Embed Size (px)
Citation preview
-
1IUse of Naturally Growing Aquatic -
Plants for Wastewater Purification ~~
E
Y. Zimmels, F. Kirzhner, S. Roitman {
~
{
1J
ABSTRACT: This paper examines potential uses of naturally growing availability of regional wastewater treatment systems. The Kishon {
aquatic plants for wastewater purification. These plants enhance the removal River discharges its highly contaminated water into the Haifa Bay {
of ~llutants by consu~g part of them in th~ form .of plant nutrients. This and, consequently, the regional seashore is also polluted. The {
applies to urban and agncultural wastewater, m particular, where treatment consequences as confirmed by continuous river monitoring are {
units of different sizes can be applied at the pollution source. The
d .
tr Th '.. t tamm . ti . h d th 11 , f L...lSas ous. lS rncessan con a on as cause e co apse 0
effectiveness of wastewater punficatlon by different plants was tested on
th Ki h R., d ."' ..tIlaboratory and pilot scales. The growth rate of the plants was related to the e s on lver s ecosystem an lts ~anslormat~on rnto an ope~ 1-
wastewater content in the water. Batch and semicontinuous experiments wastewater canal ~at flows across and rnto the Haifa Bay, where it 2
verified that the plants are capable of decreasing all tested indicators for water takes a heavy environmental toll. -
quality to levels that permit the use of the purified water for irrigation. This The volume of wastewater and other liquid waste streams that
applies to biochemical oxygen demand (BOD), chemical oxygen demand, were discharged into the river in 2000 reached 15.7 X 10³ m3fd. The
total suspended solids, pH, and turbidity. In specific cases, the turbidity pollution load consisted of approximately 7 tons of solids, 0.5 tons of
reached the level of drinking water. Comparison of BOD concentrations with mineral oil, 1 ton of ammonia (NH3) , and more than 1 ton of
typic~ levels in water Ire~tme~t fac~lities across the.country indicates the biochemical oxygen demand (BOD). The acidic wastes (pH -0.9) of 1"1
effectiveness of water punficatlon With plants. A major effect of treatment Haifa Chemicals Ltd. (Haifa Bay Israel) a world leader in fertilizers
with plants was elimination of the disturbing smell from the wastewater. It is d .
d tn ' al h . al be , 1 . d ' t b . f 0 ..an rn us c emlC s, are leve 0 e a major source 0
shown that mIXtures of wastewater and polluted water from the Klshon River
11 ' f th . (Ki h R. A th . R 2000) 0 tlare e bl .. d t Ire tm t b th 1 ts Th h . gh th po ution 0 e fiver s on lver u onty eport, .ver
bamna emvarymg egrees 0 a en y epan. e I er e wastewater content in the mixture, the more effective the treatment by the the y~ars: this sltilation has provoked protests from ~nvironmental e
plants. In this context, a scheme for rehabilitation and restoration of the organlzations that demand the enforcement of steps to lmprove water 1"1
Kishon River is presented and technical and economical aspects of the quality. As the Kishon River is polluted along its path by different f
purification technology are considered. Water Environ. Res., 76,220 (2004). urban and industrial sources, their specific treatment (e.g., at the i
KEYWORDS te 1 t tu 1 Ire tm t t t Ire source) by natilral means, such as aquatic plants, offers a promising
: wa r pans, na ra a en, was ewa er atment, ...e
urban pollution, agricultural pollution. and environmentally friendly solution to the problem. ~
In this context, we first consider general aspects that are related to 1
the application of aquatic plants for purification of wastewater n
Introduction followed by their potential use for reduction of Kishon River £
The Kishon River, which is one of the largest and most important poll.uti~~. This option is l~e~ to .the problem of river .restoration, c
rivers in Israel, has been contaminated by streams of wastewater and aValla~lllty of water for lffigation, and. the establishment of b
various chemical pollutants. This river, which flourished in the past, recreational areas at the natural treatment sites. 0
provided the stage for a number of biblical stories. Today, there are SI
sections along the Kishon River that are severely contaminated to Application and Methodology of Operation is
the extent that they are devoid of life. The river, which is the second Wetlands that are being constructed worldwide are designed for d,
largest among the coastal rivers, drains an area of 1100 km2 and is wastewater treatment at the secondary and tertiary level (Gopal, is
perennial for most of its 70-km course. 1999; Kadlec, 1995; Kadlec and Knight, 1995). These systems
Contamination of the river by neighboring industries began long range in size from 200 m2 to more than 4 X 10⁷ m2 (Knight, 1997). m
ago. Oil refineries and the associated petrochemical industry were However, the impression that the constructed wetlands offer a cost- S)
established in the region in the 1930s during the British Mandate. effective alternative to conventional wastewater treatment (Hamil- ({
Different sections of the Kishon River can be described now as flow ton et al., 1993) cannot always be sustained. Seyeral physical, m
systems containing wastewater, petrochemical mixtilres, and chemical, and biological processes are involved in the trans- th
solutions, including toxic effluents. This particularly applies to the formation and consumption of plant nutrients within the wetland. 0]
final 7 km of the downstream section of the river (e.g., before its The major physical process in wetlands is the settling of suspended a
discharge to the Haifa Bay). Typical composition data for Kishon particulate matter, which is a major cause of reduction in BOD of m
River water (Kishon River Authority Report, 2000) are summarized the treated wastewaters. dc
in Table 1. Apart from the downstream section of the river, which is The chemical processes, which include absorption, chelation, and 01
the most severely contaminated, the whole river does not comply precipitation, are responsible for the major removal of phosphorous 01
with local environmental guidelines. The urban and industrial compounds and heavy metals. Among the biological processes, the 01
infrastructilre existing along the river complicates the regional most important are those mediated by microorganisms and they gI
ecological pictilre. This infrastructilre includes municipalities and include either oxidation or reduction of carbon, nitrogen, and to
plants that discharge their waste streams into the river, despite the sulphur, depending on the availability of oxygen. Generally, w
220 Water Environment Research, Volume 76, Number 3 M
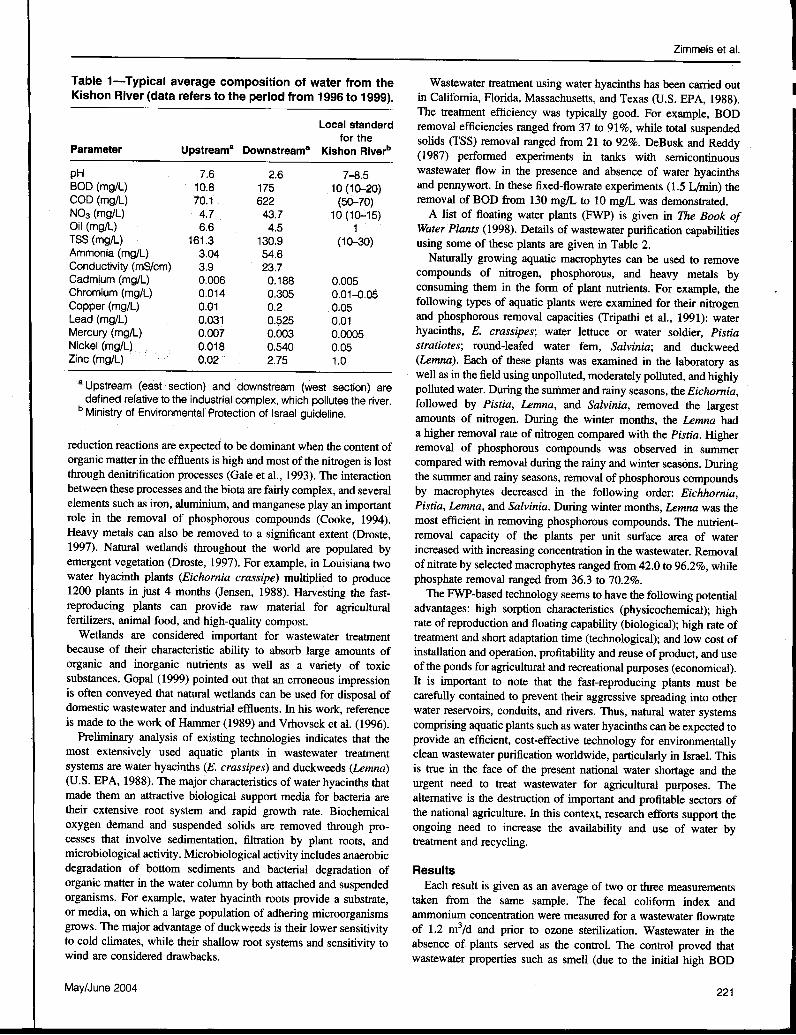
Zimmels et al.1Table 1- Typical average composition of water from the Wastewater treatment using water hyacinths has been carried out I
Kishon River (data refers to the period from 1996 to 1999). in California, Florida, Massachusetts, and Texas (U.S. EPA, 1988).The treatinent efficiency was typically good. For example, BOD
Local standard removal efficiencies ranged from 37 to 91 %, while total suspendedfor the solids (TSS) removal ranged from 21 to 92%. DeBusk and Reddy
Parameter Upstream- Downstream- Kishon Riverb (1987) performed experiments in tanks with semicontinuous
pH 7.6 2.6 7-8.5 wastewater flow in the presence and absence of water hyacinthsBOD (mg/L) 10.8 175 10 (.10-20) and pennywort.1n these fixed-flowrate experiments (1.5 L/rnin) theCOD (mg/L) 10.1 622 (50-70) removal of BOD from 130 mg/L to 10 mg/L was demonstrated.NO3 (mg/L) 4.7 43.7 10 (10-'15) A list of floating water plants (FWP) is given in The Book ofOil (mg/L) 6.6 4.5 1 Water Plants (1998). Details of wastewater purification capabilitiesTSS (mg/L) 161.3 130.9 (10-30) using some of these plants are given in Table 2.Ammonia (mgiL) 3.04 54.6 Naturally growing aquatic macrophytes can be used to removeCond~ctivity (mS/cm) 3.9 23.7 compounds of nitrogen, phosphorous, and heavy metals byCadml~m (mg/L) 0.006 0.188 0.005 consuming them in the form of plant nutrients. For example, theChromium (mg/L) 0.014 0.305 0.01-0.05 ti 11 . f . 1 . d ti th ..C ( /L) 0 01 0 2 0 05 0 owmg types 0 aquatic p ants were examme or elf nItrogen
opper mg ... d h h al " (T ' tho al 1991)Lead (mgiL) 0.031 0.525 0.01 an ~ osp orous re~ov capaCIties npa I et ., .: w.at~rMercury (mg/L) 0.007 0.003 0.0005 hyacmths, E. crass/pes; water lettuce or water soldIer, P/st/aNickel (mg/L) 0.018 0.540 0.05 stratiotes; round-leafed water fern, Salvinia; and duckweedZinc (mg/L) 0.02 2.75 1.0 (Lemna). Each of these plants was examined in the laboratory as
well as in the field using unpolluted, moderately polluted, and highly-Upstream (east section) and downstream (west section) are polluted water. During the summer and rainy seasons, the Eichomia,
defined relative to the industrial complex, which pollutes the river. followed by Pistia, Lemna, and Salvinia, removed the largestb Ministry of Environmentaf Protection of Israel guideline. amounts of nitrogen. During the winter months, the Lemna had
a higher removal rate of nitrogen compared with the Pistia. Higherreduction reactions are expected to be dominant when the content of removal of phosphorous compounds was observed in summerorganic matter in the effluents is high and most of the nitrogen is lost compared with removal during the rainy and winter seasons. Duringthrough denitrification processes (Gale et al., 1993). The interaction the summer and rainy seasons, removal of phosphorous compoundsbetween these processes and the biota are fairly complex, and several by macrophytes decreased in the following order: Eichhomia,elements such as iron, aluminium, and manganese play an important Pistia, Lemna, and Salvinia. During winter months, Lemna was therole in the removal of phosphorous compounds (Cooke, 1994). most efficient in removing phosphorous compounds. The nutrient-Heavy metals can also be removed to a significant extent (Droste, removal capacity of the plants per unit surface area of water1997). Natural wetlands throughout the world are populated by increased with increasing concentration in the wastewater. Removalemergent vegetation (Droste, 1997). For example, in Louisiana two of nitrate by selected macrophytes ranged from 42.0 to 96.2%, whilewater hyacinth plants (Eichomia crassipe) multiplied to produce phosphate removal ranged from 36.3 to 70.2%.1200 plants in just 4 months (Jensen, 1988). Harvesting the fast- The FWP-based technology seems to have the following potentialreproducing plants can provide raw material for agricultural advantages: high sorption characteristics (physicochemical); highfertilizers, animal food, and high-quality compost. rate of reproduction and floating capability (biological); high rate of
Wetlands are considered important for wastewater treatment treatment and short adaptation time (technological); and low cost ofbecause of their characteristic ability to absorb large amounts of installation and operation, profitability and reuse of product, and useorganic and inorganic nutrients as well as a variety of toxic of the ponds for agricultural and recreational purposes (economical).substances. Gopal (1999) pointed out that an erroneous impression It is important to note that the fast-reproducing plants must beis often conveyed that natural wetlands can be used for disposal of carefully contained to prevent their aggressive spreading into otherdomestic wastewater and industrial effluents. In his work, reference water reservoirs, conduits, and rivers. Thus, natural water systemsis made to the work of Hammer (1989) and Vrhovsek et al. (1996). comprising aquatic plants such as water hyacinths can be expected to
Preliminary analysis of existing technologies indicates that the provide an efficient, cost-effective technology for environmentallymost extensively used aquatic plants in wastewater treatment clean wastewater purification worldwide, particularly in Israel. Thissystems are water hyacinths (E. crassipes) and duckweeds (Lemna) is true in the face of the present national water shortage and the(U.S. EPA, 1988). The major characteristics of water hyacinths that urgent need to treat wastewater for agricultural purposes. Themade them an attractive biological support media for bacteria are alternative is the destruction of important and profitable sectors oftheir extensive root system and rapid growth rate. Biochemical the national agriculture. In this context, research efforts support theoxygen demand and suspended solids are removed through pro- ongoing need to increase the availability and use of water bycesses that involve sedimentation, filtration by plant roots, and treatment and recycling.microbiological activity. Microbiological activity includes anaerobicdegradation of bottom sediments and bacterial degradation of Resultsorganic matter in the water column by both attached and suspended Each result is given as an average of two or three measurementsorganisms. For example, water hyacinth roots provide a substrate, taken from the same sample. The fecal coliform index andor media, on which a large population of adhering microorganisms ammonium concentration were measured for a wastewater flowrategrows. The major advantage of duckweeds is their lower sensitivity of 1.2 m3/d and prior to ozone sterilization. Wastewater in theto cold climates, while their shallow root systems and sensitivity to absence of plants served as the control. The control proved thatwind are considered drawbacks. wastewater properties such as smell (due to the initial high BOD
May/June 2004 221
rf5i,~
Zimmels et al.
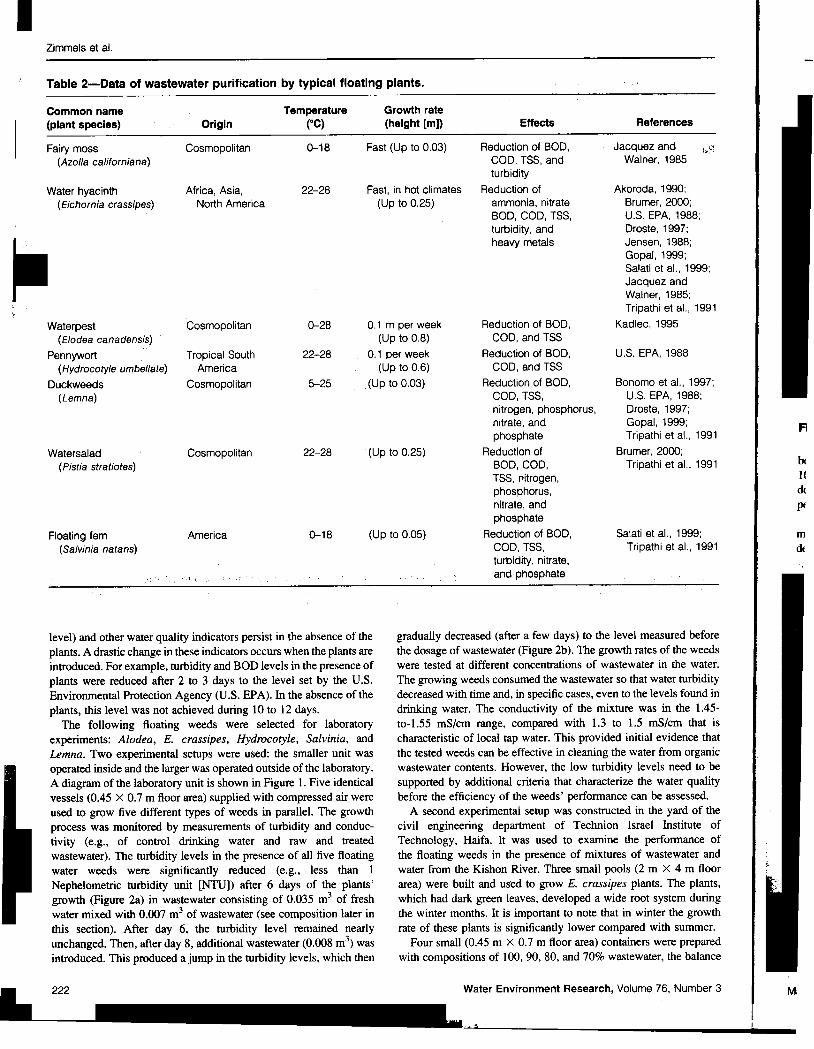
Table 2-Data of wastewater purification by typical floating plants.
I Common name Temperature Growth rate(plant species) Origin (OC) (height [m]) Effects References
Fairy moss Cosmopolitan 0-18 Fast (Up to 0.03) Reduction of BOD, .Jacquez and hI:!(Azolla californians) COD, TSS, and Wainer, 1985 .
turbidityWater hyacinth Africa, Asia, 22-28 Fast, in hot climates Reduction of Akoroda, 1990:
(Eichornia crassipes~ North America (Up to 0.25) ammonia, nitrate Brumer, 2000;BOD, COD, TSS, U.S. EPA, 1988;turbidity, and Droste, 1997;heavy metals Jensen, 1988:
Gopal, 1999;Salati et al., 1999;Jacquez andWainer, 1985;Tripathi et al., 1991
Waterpest Cosmopolitan 0-28 0.1 m per week Reduction of BOD, Kadlec, 1995(Elodea canadensis) (Up to 0.8) COD, and TSS
..Pennywort Tropical South 22-28, '. 0.1 per week Reduction of BOD, U.S. EPA, 1988
(Hydrocotyle umbellate) America .' (Up to 0.6) COD, and TSS" .Duckweeds Cosmopolitan 5-25 ,(Up to 0.03) Reduction of BOD, Bonomo et al., 1997;
(Lemna) COD, TSS, U.S. EPA, 1988;nitrogen, phosphorus, Droste, 1997;nitrate, and Gopal, 1999;phosphate Tripathi et al., 1991 FI
Watersalad Cosmopolitan 22-28 (Up to 0.25) Reduction ot Brumer, 2000;(Pistia stratiotes) BOD, COD, Tripathi et al., 1991 ~
TSS, nitrogen, 1(phosphorus, dtnitrate, and ptphosphate
Floating fern America 0-18 (Up to 0.05) Reduction of BOD, Salati et al., 1999; m(Salvinia natans) COD, TSS, Tripathi et al., 1991 dt
turbidity, nitrate,
level) and other water quality indicators persist in the absence of the gradually decreased (after a few days) to the level measured beforeplants. A drastic change in these indicators occurs when the plants are the dosage of wastewater (Figure 2b). The growth rates of the weedsintroduced. For example, turbidity and BOD levels in the presence of were tested at different concentrations of wastewater in the water.plants were reduced after 2 to 3 days to the level set by the U.S. The growing weeds consumed the wastewater so that water turbidityEnvironmental Protection Agency (U.S. EP A). In the absence of the decreased with time and, in specific cases, even to the levels found inplants, this level was not achieved during 10 to 12 days. drinking water. The conductivity of the mixture was in the 1.45-
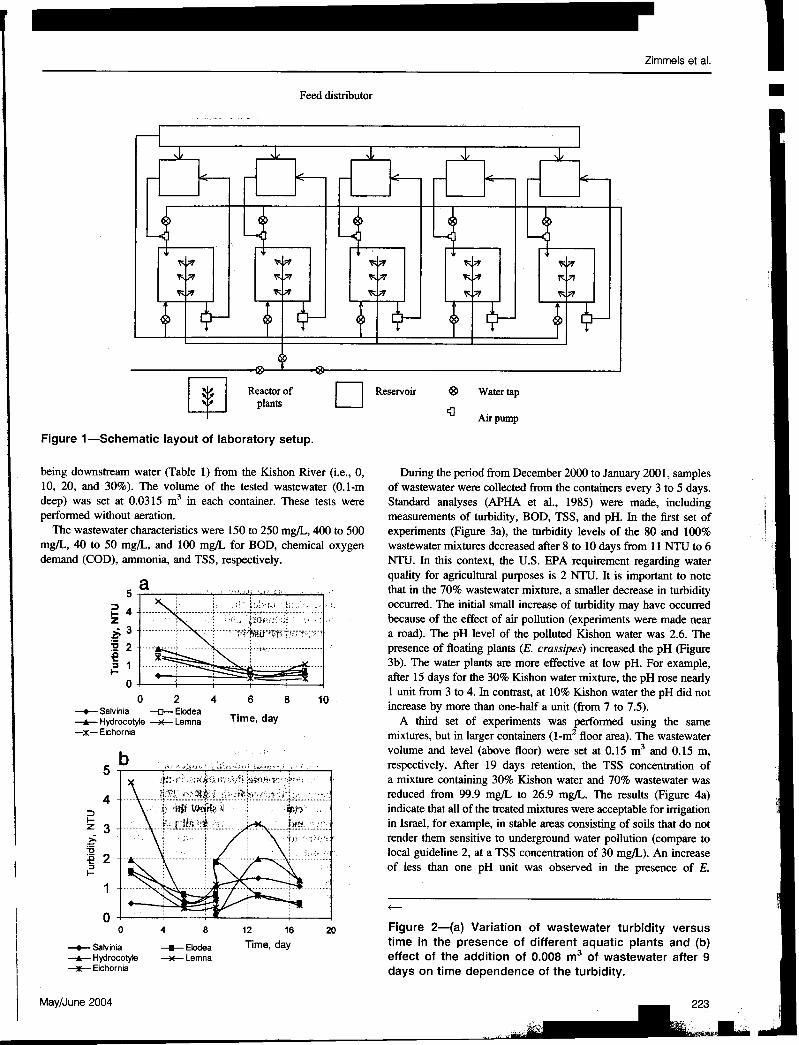
The following floating weeds were selected for laboratory to-l.55 mS/cm range, compared with 1.3 to 1.5 mS/cm that isexperiments: Alodea, E. crassipes, Hydrocotyle, Salvinia, and characteristic of local tap water. This provided initial evidence thatLemna. Two experimental setups were used: the smaller unit was the tested weeds can be effective in cleaning the water from organicoperated inside and the larger was operated outside of the laboratory. wastewater contents. However, the low turbidity levels need to beA diagram of the laboratory unit is shown in Figure I. Five identical supported by additional criteria that characterize the water qualityvessels (0.45 X 0.7 m floor area) supplied with compressed air were before the efficiency of the weeds' performance can be assessed.used to grow five different types of weeds in parallel. The growth A second experimental setup was constructed in the yard of theprocess was monitored by measurements of turbidity and conduc- civil engineering department of Technion Israel Institute oftivity (e.g., of control drinking water and raw and treated Technology, Haifa. It was used to examine the performance ofwastewater). The turbidity levels in the presence of all five floating the floating weeds in the presence of mixtures of wastewater andwater weeds were significantly reduced (e.g., less than 1 water from the Kishon River. Three small pools (2 m X 4 m floorNephelometric turbidity unit [NTU]) after 6 days of the plants' area) were built and used to grow E. crassipes plants. The plants,growth (Figure 2a) in wastewater consisting of 0.035 m3 of fresh which had dark green leaves, developed a wide root system duringwater mixed with 0.007 m3 of wastewater (see composition later in the winter months. It is important to note that in winter the growththis section). After day 6, the turbidity level remained nearly rate of these plants is significantly lower compared with summer.unchanged. Then, after day 8, additional wastewater (0.008 m3) was Four small (0.45 m X 0.7 m floor area) containers were preparedintroduced. This produced a jump in the turbidity levels, which then with compositions of 100, 90, 80, and 70% wastewater, the balance "~
222 Water Environment Research, Volume 76, Number 3 'Mi
Zimmels et al. I=-Feed distributor ~,
[jJ Reactor of D Reservoir @ Water tap
plants <I A.If pump
Figure 1-Schematic layout of laboratory setup.
being downstream water (Table 1) from the Kishon River (i.e., 0, During the period from December 2000 to January 2001, samples10, 20, and 30%). The volume of the tested wastewater (O.l-m of wastewater were collected from the containers every 3 to 5 days.deep) was set at 0.0315 m3 in each container. These tests were Standard analyses (APHA et al., 1985) were made, includingperformed without aeration. measurements of turbidity, BOD, TSS, and pH. In the first set of
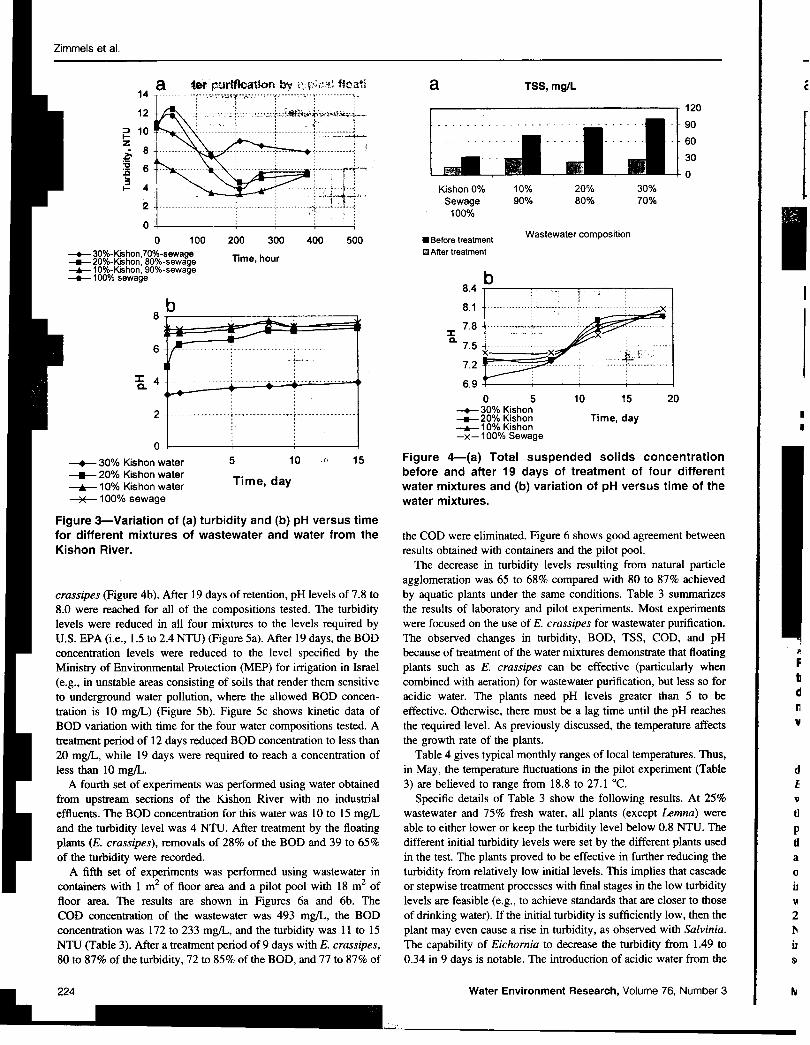
The wastewater characteristics were 150 to 250 mg/L, 400 to 500 experiments (Figure 3a), the turbidity levels of the 80 and 100% \.mg/L, 40 to 50 mg/L, and 100 mg/L for BOD, chemical oxygen wastewater mixtures decreased after 8 to 10 days from 11 NTU to 6 \
demand (COD), ammonia, and TSS, respectively. NTU. In this context, the U.S. EPA requirement regarding waterquality for agricultural purposes is 2 NTU. It is important to note
5 a , ".', that in the 70% wastewater mixture, a smaller decrease in turbidity
~ 4 l;-'.:,.:(:..~.;~ i.,;~ occurred. The initial small increase of turbidity may have occurredZ :' !(' 'c~" because of the effect of air pollution (experiments were made near~ 3 ..+j';.f::':'.:;~' , a road). The pH level of the polluted Kishon water was 2.6. The~ 2 -.,' ' ' presence of floating plants (E. crassipes) increased the pH (Figure
~ 1 '.':_~~ 3b). The water plants are more effective at low pH. For example,t- 0 ..! ~ after 15 days for the 30% Kishon water mixture, the pH rose nearly
0 2 4 6 8 10 1 unit from 3 to 4. In contrast, at 10% Kishon water the pH did not-+-Sawinia -o-Elodea .increase by more than one-half a unit (from 7 to 7.5).-.-Hydrocotyle --Lemna Time, day A third set of experiments was performed using the same-)(-E~hornia mixtures, but in larger containers (1-m2 floor area). The wastewater
volume and level (above floor) were set at 0.15 m3 and 0.15 m,5 '" 'J,",i" , i,'i.'" ik.n;.' respectively. After 19 days retention, the TSS concentration of
a mixture containing 30% Kishon water and 70% wastewater was4 reduced from 99.9 mg/L to 26.9 mg/L. The results (Figure 4a)
::> indicate that all of the treated mixtures were acceptable for irrigation~ 3 in Israel, for example, in stable areas consisting of soils that do not:;:;.. render them sensitive to underground water pollution (compare to~ 2 local guideline 2, at a TSS concentration of 30 mg/L). An increase~ of less than one pH unit was observed in the presence of E.
1+-
00 4 8 12 16 20 Figure 2-(a) Variation of wastewater turbidity versus
-+-Sawinia --Elodea Time. day time in the presence of different aquatic plants and (b)-.-Hydrocotyle --Lemna effect of the addition of 0.008 m3 of wastewater after 9
Eichornia days on time dependence of the turbidity.
May/June 2004 23 ~
",..,...I" "JI ~--, ""=~- ~
~Zimmels et ai, -
a -'p"'.u , "'V ',p""" .',"c"" a TSS mg/L c14 --'"F';""~"~c'f"#;;:-"-'f"-"--'.c-"--'T'--'-'-"-'-"1- '
12 -;~ 120~, : 90'f ,. l' -
~ 10 i-;:::-::::::~z : : c 60
f : j:::~~;:::.-r'"i ~o~ " 1.I- 4 ';"-;.-}-'---j Kishon 0% 10% 20% 30%
2. f; : : J1:~~~-,- -7'." Sewage 90% 80% 70%: : : !:'?: 100%
0 0 1 ~o 2~0 3~0 4~0 5~ .Before treatment Wastewater composition
I-+-- 30%-Kishon 70%-sewageT . h im After treatment
-.-20%-Kishon: 80%-sewage Ime, our ,-*-10%-Kishon,90%-sewage b ;: -+-- 100% sewage
8.4 ; Ib :, , '8.1 ' ,
87.8
~a-
6 7.5
7.2
:a. 4 , 6.9
:: 0 5 10 15 20: t1l1q 111-.: ~,' -+--30% Kishon2 ; '-" 17:---"--: -.-20% Kishon Time, day .
:: -*-10% Kishon .:: -x-100% Sewage0 ' .
-+-30% Kishon water 5 10 15 Figure 4-(a) Total suspended solids concentration---20% Kishon water. before and after 19 days of treatment of four different-.-10% Kishon water Time, day water mixtures and (b) variation of pH versus time of the-*-100% sewage water mixtures.
Figure 3-Variation of (a) turbidity and (b) pH versus timefor different mixtures of wastewater and water from the the COD were eliminated. Figure 6 shows good agreement betweenKishon River. results obtained with containers and the pilot pool.
The decrease in turbidity levels resulting from natural particleagglomeration was 65 to 68% compared with 80 to 87% achieved
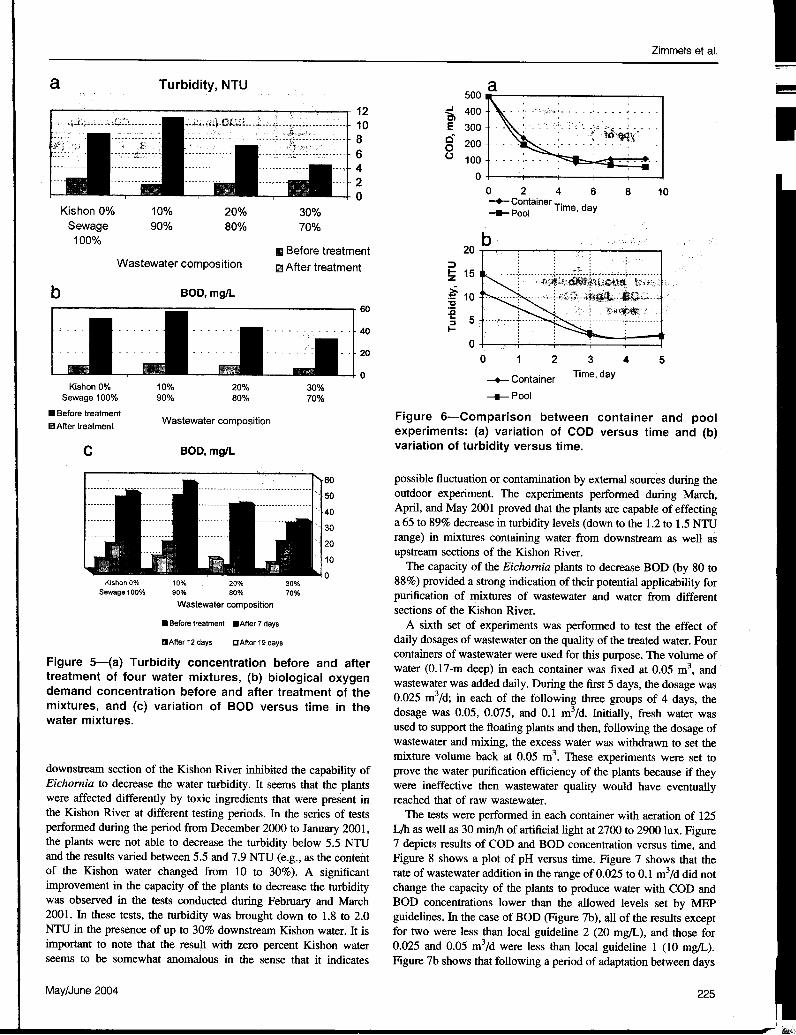
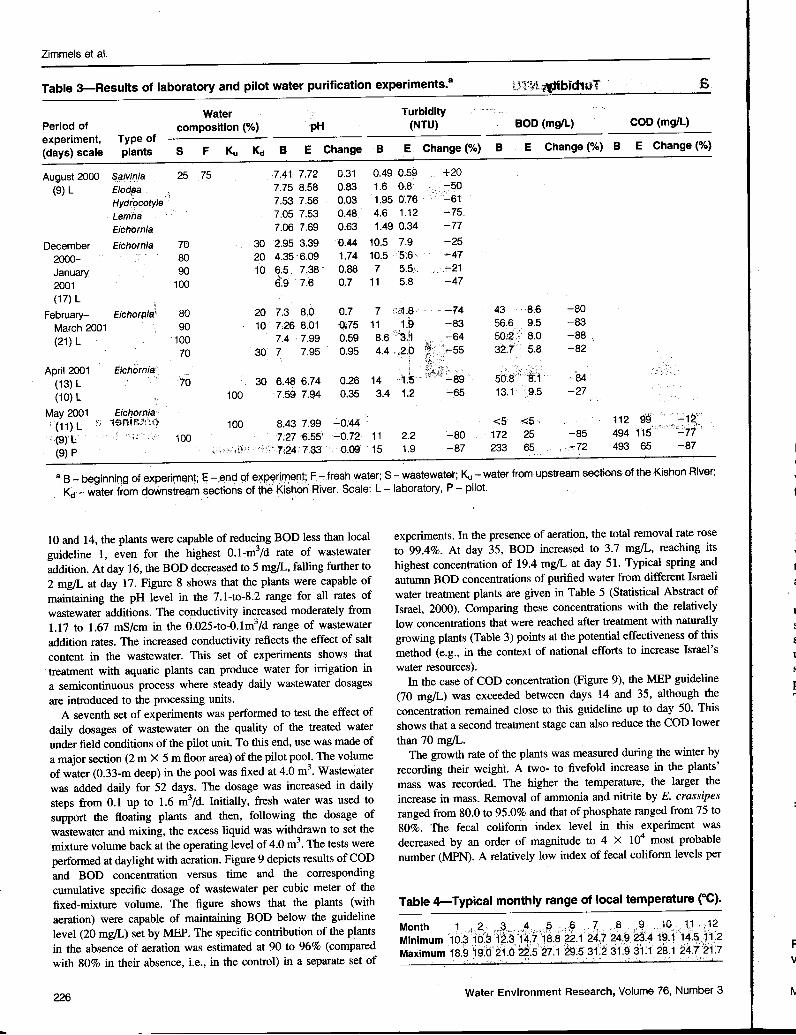
crassipes (Figure 4b). After 19 days of retention, pH levels of 7.8 to by aquatic plants under the same conditions. Table 3 summarizes8.0 were reached for all of the compositions tested. The turbidity the results of laboratory and pilot experiments. Most experimentslevels were reduced in all four mixtures to the levels required by were focused on the use of E. crassipes for wastewater purification.U.S. EPA (i.e., 1.5 to 2.4 N11J) (Figure 5a). After 19 days, the BOD The observed changes in turbidity, BOD, TSS, COD, and pHconcentration levels were reduced to the level specified by the because of treatment of the water mixtures demonstrate that floatingMinistry of Environmental Protection (MEP) for irrigation in Israel plants such as E. crassipes can be effective (particularly when F(e.g., in unstable areas consisting of soils that render them sensitive combined with aeration) for wastewater purification, but less so for IIto underground water pollution, where the allowed BOD concen- acidic water. The plants need pH levels greater than 5 to be Ctration is 10 mg/L) (Figure 5b). Figure 5c shows kinetic data of effective. Otherwise, there must be a lag time until the pH reaches nBOD variation with time for the four water compositions tested. A the required level. As previously discussed, the temperature affects ¥
treatment period of12 days reduced BOD concentration to less than the growth rate of the plants.20 mg/L, while 19 days were required to reach a concentration of Table 4 gives typical monthly ranges of local temperatures. Thus,less than 10 mg/L. in May, the temperature fluctuations in the pilot experiment (Table d
A fourth set of experiments was performed using water obtained 3) are believed to range from 18.8 to 27.1 °C. Efrom upstream sections of the Kishon River with no industrial Specific details of Table 3 show the following results. At 25% \1effluents. The BOD concentration for this water was 10 to 15 mg/L wastewater and 75% fresh water, all plants (except Lemna) were tland the turbidity level was 4 N11J. After treatment by the floating able to either lower or keep the turbidity level below 0.8 N11J. The pplants (E. crassipes), removals of 28% of the BOD and 39 to 65% different initial turbidity levels were set by the different plants used tlof the turbidity were recorded. in the test. The plants proved to be effective in further reducing the a
A fifth set of experiments was performed using wastewater in turbidity from relatively low initial levels. This implies that cascade 0containers with 1 m2 of floor area and a pilot pool with 18 m2 of or stepwise treatment processes with final stages in the low turbidity itfloor area. The results are shown in Figures 6a and 6b. The levels are feasible (e.g., to achieve standards that are closer to those ~COD concentration of the wastewater was 493 mg/L, the BOD of drinking water). If the initial turbidity is sufficiently low, then the 2concentration was 172 to 233 mg/L, and the turbidity was 11 to 15 plant may even cause a rise in turbidity, as observed with Sa/vinia. l'N11J (Table 3). After a treatment period of 9 days with E. crassipes, The capability of Eichomia to decrease the turbidity from 1.49 to it80 to 87% of the turbidity, 72 to 85% of the BOD, and 77 to 87% of 0.34 in 9 days is notable. The introduction of acidic water from the sc
Water Environment Research, Volume 76, Number 3 ~
Zimmels et al. I"..,.-
a Turbidity, NTU a ~500
12 ~ 400 . .10 E 300 .
8 g 2006 (.) 100 .
4 0
~ 0 2 4 6 8 10--Container T. d.!me ayKlshon 0% 10% 20% 30% --Pool .
Sewage 90% 80% 70%
100%.Before treatment 20
Wastewater composition mJ After treatment ~ 15z
b BOD, mg/L ;?j 10"C
60 :0~ 5
40 I-
020 0 1 2 3 4 5
0 -+- Container Time, dayKishon 0% 10% 20% 30%
Sewage 100% 90% 80% 70% Pool
.Before treatment W t t .t' Figure 6-Comparison between container and poolas ewa er compos! IonDAfter treatment experiments: (a) variation of COD versus time and (b)
C BOD, mg/L variation of turbidity versus time.
0 possible fluctuation or contamination by external sources during the50 outdoor experiment. The experiments performed during March,40 April, and May 2001 proved that the plants are capable of effecting30 a 65 to 89% decrease in turbidity levels (down to the 1.2 to 1.5 NTU
range) in mixtures containing water from downstream as well as20 upstream sections of the Kishon River.
10 The capacity of the Eichornia plants to decrease BOD (by 80 to
Kishon 0% 10% 20% 30% 0 88%) provided a strong indication of their potential applicability for
Sewage 100% 90% 80% 70% purification of mixtures of wastewater and water from differentWastewater composition sections of the Kishon River.
.Before treatment .After 7 days A sixth set of experiments was performed to test the effect of
.After 12 days mAfter 19 days daily dosages of wastewater on the quality of the treated water. Fourcontainers of wastewater were used for this purpose. The volume of
Figure 5-(a) Turbidity concentration before and after water (0.17-m deep) in each container was fixed at 0.05 m3, andtreatment of four water mixtures, (b) biological oxygen wastewater was added daily. During the first 5 days, the dosage wasdemand concentration before and after treatment of the 0.025 m3/d; in each of the following three groups of 4 days, themixtures, and (c) variation of BOD versus time in the dosage was 0.05, 0.075, and 0.1 m3/d. Initially, fresh water waswater mixtures. used to support the floating plants and then, following the dosage of
wastewater and mixing, the excess water was withdrawn to set themixture volume back at 0.05 m3. These experiments were set to
downstream section of the Kishon River inhibited the capability of prove the water purification efficiency of the plants because if theyEichornia to decrease the water turbidity. It seems that the plants were ineffective then wastewater quality would have eventuallywere affected differently by toxic ingredients that were present in reached that of raw wastewater.the Kishon River at different testing periods. In the series of tests The tests were performed in each container with aeration of 125performed during the period from December 2000 to January 2001, L/h as well as 30 min/h of artificial light at 2700 to 2900 lux. Figurethe plants were not able to decrease the turbidity below 5.5 NTU 7 depicts results of COD and BOD concentration versus time, andand the results varied between 5.5 and 7.9 NTU (e.g., as the content Figure 8 shows a plot of pH versus time. Figure 7 shows that theof the Kishon water changed from 10 to 30%). A significant rate of wastewater addition in the range of 0.025 to 0.1 m3/d did notimprovement in the capacity of the plants to decrease the turbidity change the capacity of the plants to produce water with COD andwas observed in the tests conducted during February and March BOD concentrations lower than the allowed levels set by MEP2001. In these tests, the turbidity was brought down to 1.8 to 2.0 guidelines. In the case of BOD (Figure 7b), all of the results exceptNTU in the presence of up to 30% downstream Kishon water. It is for two were less than local guideline 2 (20 mg/L), and those forimportant to note that the result with zero percent Kishon water 0.025 and 0.05 m3/d were less than local guideline I (10 mg/L).seems to be somewhat anomalous in the sense that it indicates Figure 7b shows that following a period of adaptation between days
May/June 2004 225
Zimmels et al.
.Water Turbiditypeno~ of composition (%) pH (NTU) BOD (mg/L) COD (mg/L)
experiment, Type of(days) scale plants S F Ku ~ B E Change B E Change (%) B E Change (%) B E Change (%)'---I -, .
August 2000 S~!~!n!a 25 75 7,41 7.72 0.31 0.49 0.59 +20(9) L Efod~a ii 7.75 8.58 0,83 1.6 0.8 ;:::50
HydrpcPtyfe 7.53 7.56 0.03 1.95 0'.76 ""'61Lemha 7.05 7.53 0.48 4.6 1.12 -75Eichornia 7.06 7.69 0.63 1.49 0.34 -77
December Eichoriii~ 70 30 2.95 3.39 0.44 10.5 7.9 -252000- 80 20 4.35"6.09 1.74 10.5 ,5:6 ~47January 90 10 6,5 7;38 -0.88 7 5..5, -c-212001 100 6~9 7.e 0.7 11 5.8 -47
(17) Lc
February- Eichorniai, 80 20 7.3 8,0 0.7 7 :1'"1,fj -74 43 8,-6 -80:March 2001 90 10 7.26 8.01 ,0,75 11 1.9 -83 56.6 9.5 -83
(21) L 100 7.4 7.99 0.59 8.6 )'3." c.-64 50;? 8.0 -88\ $, )
70 30 7 7.95 0.95 4.4 ,,2,0 ":'-55 32.7 5.8 -82
April 2001 Eichornia ,.: }J,-,l: "c.,.(13) L :1 70 30 6.48 6.74 0.26 14 .c1.5"';~:":*-89: 50.8""8:1 -84(10)L 100 7.597.94 0.35 3.4 1.2 '-'65 13.1 c.9.5 -27
May 2001 Eichornia(11) L f, 19ni&!!;1,:~ 100 8.43 7.99 -0:44 <5 <5, 112 99' ":12'"
'{9)'1.: 100 7.27 6.55' -0.72 11 2.2 -80 172 25 -85 494 115""":":::77::'
Ia B -beginning of experime,nt; E -enq of exI?7r!~n\; F -freshwater; S -wastewater; Ku- water from upstream sections of the Kishon River; 1
Kd- water from downstre~m s,ections of the K!s~on River. Scale: L -laboratory, P -pilot. ;
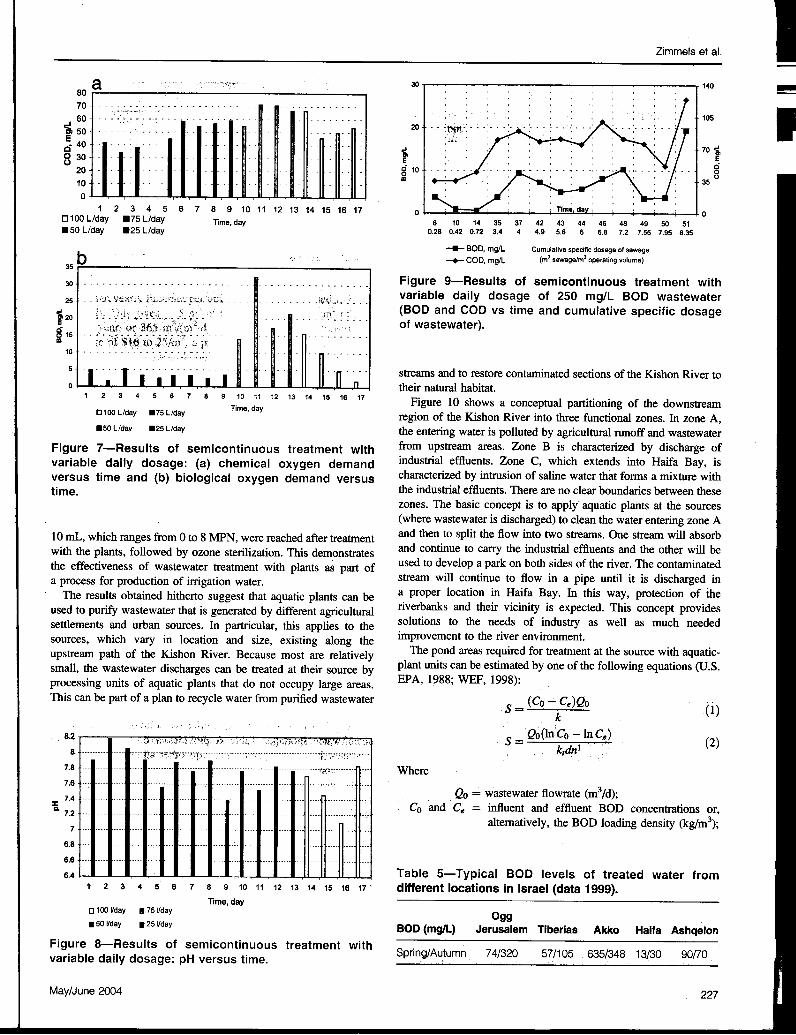
10 and 14, the plants were capable of reducing BOD less than local experiments. In the presence of aeration, the total removal rate roseguideline 1, even for the highest 0.1-m3jd rate of wastewater to 99.4%. At day 35, BOD increased to 3.7 mg/L, reaching itsaddition. At day 16, ~e BOD dec.reased to 5 mg/L, falling further to highest concentration of 19.4 mg/L at day 51. Typical spring and ;2 mg/L at day 17. FIgure 8 shows that the plants were capable of autumn BOD concentrations of purified water from different Israeli ,maintaining the pH level in the 7.l-to-8.2 range for all rates of water treatment plants are given in Table 5 (Statistical Abstract of '
wastewater additions. The conductivity increased moderately from Israel, 2000). Comparing these concentrations with the relatively1.17 to 1.67 mSjcm in the 0.025-to-0.lm3jd range of wastewater low concentrations that were reached after treatment with naturally \
addition rates. The increased conductivity reflects the effect of salt growing plants (Table 3) points at the potential effectiveness of this :content in the wastewater. This set of experiments shows that method (e.g., in the context of national efforts to increase Israel's .treatment with aquatic plants can produce water for irrigation in water resources). \a sernicontinuous process where steady daily wastewater dosages In the case of COD concentration (Figure 9), the MEP guideline S
are introduced to the pro~essing units. (70 mg/L) was exceeded between days 14 and 35, although the ~A seventh set of expenments was performed to test the effect of concentration remained close to this guideline up to day 50. This
daily dosages of wastewater on the quality of the treated water shows that a second treatment stage can also reduce the COD lower
under field conditions of the pilot unit. To this end, use was made of than 70 mg/L.a major section (2 m X 5 m floor area) of the pilot pool. The volume The growth rate of the plants was measured during the winter byof water (0.33-m deep) in the pool was fixed at 4.0 m3. Wastewater recording their weight. A two- to fivefold increase in the plants'was added daily for 52 days. The dosage was increased in daily mass was recorded. The higher the temperature, the larger thesteps from 0.1 up to 1.6 m3jd. Initially, fresh water was used to increase in mass. Removal of ammonia and nitrite by E. crassipessupport the floating plants and then, following the dosage of ranged from 80.0 to 95.0% and that of phosphate ranged from 75 to i
wastewater and mixing., the excess liquid was withdrawn to set the 80%. The fecal coliform index level in this experiment was
mixture volume back at the operating level of 4.0 m3. The tests were decreased by an order of magnitude to 4 X 10⁴ most probableperformed at daylight with aeration. Figure 9 depicts results of COD number (MPN). A relatively low index of fecal coliform levels per
and BOD concentration versus time and the correspondingcumulative specific dosage of wastewater per cubic meter of thefixed-mixture volume. The figure shows that the plants (with Table 4- Typical monthly range of local temperature (OC).
aeration) were capable of maintaining BOD below the guidelinelevel (20 mg/L) set by MEP. The specific contribution of the plants Month , ~ ..:;~\ '19c)'.!:,t;,~,R"i'.'~ ,:~, c~c'i~ ;!0,:.-:1j, ;1~
in the absence of aeration was estimated at 90 to 96% (compared Mini.mum 10.~ ,,10;~,1i~'.3'. ,11:7,]8.8 ~2.1, 24,,:7, ~~'.~ 2~:~1~'.1 ,14c9,!1;2 Fwith 80% in their absence, i.e., in the control) in a separate set of Maximum 18.9 19.0 21.0~f.5 27.129.531.231,931.128.124.721.7 v
226 Water Environment Research, Volume 76, Number 3 ~
~
Zimmel~ et al. I
80 a 30 140 ~
~~ ::::: :::: 105 I~50 20E ---
.40 ---Q -
030 ---0&, 700&,(.) --E E
20 C 10 C--0 0
10 m 35 "
0
1 2 3 4 5 6 7 8 9 10 11 12 13 14 15 16 17 00100 L/day .75 L/day T' d 0.50 L/day .25 L/da 'me. ay 6 10 14 35 37 42 43 44 46 48 49 50 51
Y 0_28 0_42 0_72 3.4 4 4.9 56 6 68 72 755 7.95 8_35
--BOD, mg/L Cumulative specific dosage of sewage35 -+- COD, mg/L (m3 sewage/m3 operating volume)
30 Figure 9-Results of semicontinuous treatment with25 --i,:J~ Yf;.~;'-l." -;';'.';.\.1.. -' -.-variable daily dosage of 250 mg/L BOD wastewater
~20 ii,\'. (BOD and COD vs time and cumulative specific dosagec of wastewater).g 15 10
5 streams and to restore contaminated sections of the Kishon River to0 their natural habitat.
1 2 3 4 5 8 7 8 9 10 11 12 13 14 15 16 17 .C 1 00 Lid .7 5Lid Time, day FIgure 10 shows a conceptual partitioning of the downstream
ay ay . f th K. h .regIon 0 e IS on RIver into three functional zones. In zone A
.50 L/day .25 L/day th ..'e enterIng water IS polluted by agricultural runoff and wastewater
Figure 7-Results of semicontinuous treatment with from upstream areas. Zone B is characterized by discharge ofvariable daily dosage: (a) chemical oxygen demand industrial effluents. Zone C, which extends into Haifa Bay, isversus time and (b) biological oxygen demand versus characterized by intrusion of saline water that forms a mixture withtime. the industrial effluents. There are no clear boundaries between these
zones. The basic concept is to apply aquatic plants at the sources(where wastewater is discharged) to clean the water entering zone A
10 nIL, which ranges from 0 to 8 MPN, were reached after treatment and then to split the flow into two streams. One stream will absorbwith the plants, followed by ozone sterilization. This demonstrates and continue to carry the industrial effluents and the other will bethe effectiveness of wastewater treatment with plants as part of used1o develop a park on both sides of the river. The contaminateda process for production of irrigation water. stream will continue to flow in a pipe until it is discharged in
The results obtained hitherto suggest that aquatic plants can be a proper location in Haifa Bay, In this way, protection of iheused to purify wastewater that is generated by different agricultural riverbanks and their vicinity is expected. This concept providessettlements and urban sources. In partricular, this applies to the ~olutions to the needs of industry as well as much neededsources, which vary in location and size, existing along the Improvement to the river environment.upstream path of the Kishon River. Because most are relatively The P?nd areas required for treatment at the source with aquatic-small, the wastewater discharges can be treated at their source by plant UnIts can be estimated by one of the following equations (U.S.
processing units of aquatic plants that do not occupy large areas. EPA, 1988; WEF, 1998):
This can be part of a plan to recycle water from purified wastewater (Co -Ce )Qos= k (1)
~ ,,;Ii S = Qo(lnCo =~C~) 28 '--,r~;;-"';~!r'-'!T!"---;i' "-' '1,'jC"':;'",,-- ktdnl ( )
7.8 OJ('''._' -..Where
% ::::: -:---: -: :-:- : :- '--:':::::::: -,- Qo = wastewater flowrate (m3fd);Do 7-2 'c, Co and Ce = influent and effluent BOD concentrations or,
7 alternatively, the BOD loading density (kg/m3);
6.8 ---c- 6.6 6.4 Table 5- Typical BOD levels of treated water from
1 2 3 4 5 6 7 8 9 10 11 12 13 14 15 16 17 different locations in Israel (data 1999).
Time,day0100 Vday .75 Vday.50 Vday .25 Vday 099
.BOD (mg/L) Jerusalem Tiberias Akko Haifa Ashqelon
Figure 8-Results of semicontinuous treatment with .variable daily dosage: pH versus time. Sprlng/Au,tumn 74/320 57/105 6351.348 131,30 90/70
May/June 2004 227
.1.2
c 1
~- t:r_~;!:'l~-I-::;'--~:._- !E -;; 0.8 ,r t! l "- ..;_."-";"0 ~~ 7::~':'\'1\:F_¥_::1
~NEO.6 --*,.t;-"",';."...l.~..;:.-
1~~0'4 ~~~,,: IJ:i.,::~:"~:!-:0
Depth 0.5 m0 1000
-.-Depth 0.75 mInfluent BOD, mg/L
_Depth1.0m
Figure 1o-Partitioning of the downstream area of the (a)Kishon River into functional zones (1, 3-park zones; 2-industrial zone; 4-wastewater treatment plan of the Haifadistrict; 5, 6, 7, and 8-Kishon River streams afterpurification; 9-wastewater stream; 10-barrier; 11-rain 20
...,water). The stream (6) entering from zone A consists of .: :...water purified by the action of aquatic plants. -16 ~~ .~,- "::..~ ~. :- --, --
>- .."'II .'"C. .'" .
"'E 12 " : ~-.:..:.:...~---"k = specific BOD loading rate (kg[m2..dD; N'==' _..,-: ~_: :kt = first-order rate coefficient (day-I) (valued at 1..1) ~ 8 *" .~~_. : ---:- ..:,..
(Reed et al.., 1995); c :,." ..d= depth of pond (m); and 4 .4, -: :.,-- .-; nl = drainage voids (0..38 for a bed of medium to
II) (R d t al 1995) Depth05m 0
coarse grave ee e., ..-0 200 400 600 800 1000
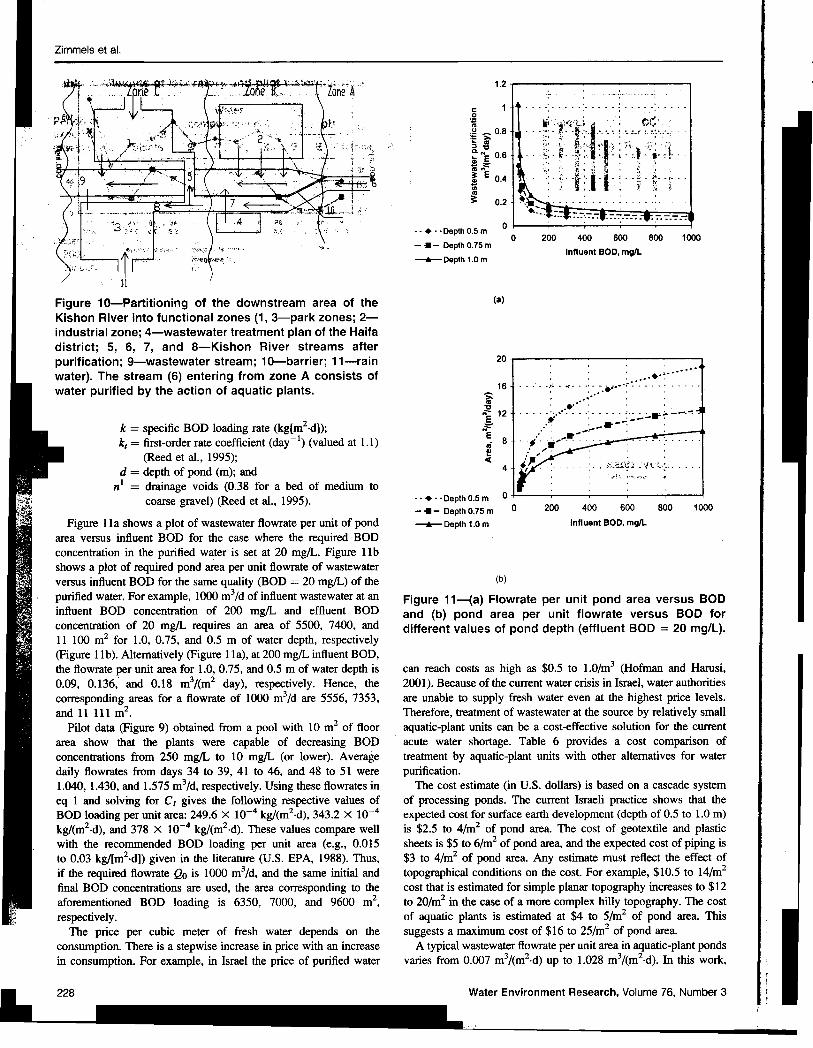
-.-Depth 0.75 mFigure 11a shows a plot of wastewater flowrate per unit of pond _Depth 1.0 m Influent BOD, mg/L
area versus influent BOD for the case where the required BODconcentration in the purified water is set at 20 mg/L.. Figure 11 bshows a plot of required pond area per unit flowrate of wastewaterversus influent BOD for the same quality (BOD = 20 mg/L) of the (b)purified water. For example, 1000 m3/d of influent wastewater at an Figure 11-(a) Flowrate per unit pond area versus BODinfluent BOD concentration of 200 mg/L and effluent BOD and (b) pond area per unit flowrate versus BOD forconcentration of 20 mg/L requires an area of 5500, 7400, and different values of pond depth (effluent BOD = 20 mg/L).11 100 m2 for 1..0, 0..75, and 0..5 m of water depth, respectively(Figure lIb). Alternatively (Figure 1Ia), at 200 mg/L influent BOD,the flowrate per unit area for 1..0, 0.75, and 0.5 m of water depth is can reach costs as high as $0.5 to 1.0/m3 (Hofman and Harusi,0.09, 0.136.. and 0..18 m3/(m2 day), respectively. Hence, the 2001). Because of the current water crisis in Israel, water authoritiescorresponding areas for a flowrate of 1000 m3/d are 5556, 7353, are unable to supply fresh water even at the highest price levels..and 11 111 m2. Therefore, treatment of wastewater at the source by relatively small
Pilot data (Figure 9) obtained from a pool with 10 m2 of floor aquatic-plant units can be a cost-effective solution for the currentarea show that the plants were capable of decreasing BOD acute water shortage. Table 6 provides a cost comparison ofconcentrations from 250 mg/L to 10 mg/L (or lower).. Average treatment by aquatic-plant units with other alternatives for waterdaily flowrates from days 34 to 39, 41 to 46, and 48 to 51 were purification.1.040,1.430, and 1.575 m3/d, respectively. Using these flowrates in The cost estimate (in U.S. dollars) is based on a cascade systemeq 1 and solving for C 1 gi,:es the following respective values of of processing ponds. The current Israeli practice shows that theBOD loading per unit area: 249.6 X 10⁻⁴ kg/(m2.d), 343.2 X 10⁻⁴ expected cost for surface earth development (depth of 0.5 to 1.0 m)kg/(m2.d), and 378 X 10-4 kg/(m2.d). These values compare well is $2.5 to 41m2 of pond area. The cost of geotextile and plasticwith the recommended BOD loading per unit area (e.g., 0.015 sheets is $5 to 61m2 of pond area, and the expected cost of piping isto 0.03 kg/[m2..dD given in the literature (U.S. EPA, 1988). Thus, $3 to 41m2 of pond area. Any estimate must reflect the effect ofif the required flowrate Qo is 1000 m3/d, and the same initial and topographical conditions on the cost. For example, $10.5 to 141m2final BOD concentrations are used, the area corresponding to the cost that is estimated for simple planar topography increases to $12aforementioned BOD loading is 6350, 7000, and 9600 m2, to 201m2 in the case of a more complex hilly topography. The costrespectively. of aquatic plants is ~stimated at $4 to 51m2 of pond area.. This
The price per cubic meter of fresh water depends on the suggests a maximum cost of $16 to 251m2 of pond area.consumption. There is a stepwise increase in price with an increase A typical wastewater flowrate per unit area in aquatic-plant pondsin consumption. For example, in Israel the price of purified water varies from 0..007 m3/(m2.d) up to 1.028 m3/(m2.d). In this work,~
228 Water Environment Research, Volume 76, Number 3 I

=~ ~Table 6-Comparison of cost of water treatment by downstream sections by splitting the stream into two channels. One ~
different technologies. channel will continue to carry the heavily polluted industrial effluents,whereas the second channel will supply cleaner water to the water
Processing cost parks on both sides of the river. This is expected to rehabilitate theType of treatment ($US/m3) Intended use river and its ecosystem.
Desalination 0.65-1.0 Industry, aquifer(Hofman and replenishment AcknowledgmentsHarusi,2001) C dits Th' h ed b th K K thQ t 0 46-0 7 I d t ' f re .IS researc was support y e eren ayeme
ua ernary "n us ry, aqui er LeI 1 (J al ) th C " Ab ' ' S . M..(Hofman and replenishment srae erus em, e enter lor sorption m clence, mlstryHarusi. 2001) I';' of Immigrant Absorption, State of Israel (Jerusalem), and Technion
Units of aquatic plant 1 I,. ]:0..2..0,4 Industry, agriculture V.P.R. Fund-Steigman Research Fund (Haifa, Israel).Authors. Yoram Zimmels, Felix Kirzhner, and Semen Roitman
are all with the Faculty of Civil and Environmental Engineering,Technion, Israel Institute of Technology, Haifa, Israel. Correspon-
the average yearly flowrate per unit pond area is assumed to be 0.1 dence should be addressed to Prof. Y. Zimmels, Environmental andm3/(m2.d). This gives 36.5 m3 of treated water from 1 m2 of pond Water Resources Engineering, Department of Civil Engineering,area per year, or 365 m3/(m2.d) in 10 years. Using a construction Technion, Israel Institute of Technology, Haifa, 32000, Israel; e-cost range of $16 to 251m2, a processing cost range of $0.2 to 0.41 mail: [email protected], and a net profit range of $0.2 to 0.4/m2 from sales of the purified Submitted for publication June 23, 2002; revised manuscriptwater shows that a return on the capital investment can be expected submitted March 4, 2003; accepted for publication March 14, 2003.within 1.1 to 3.4 years. The deadline to submit Discussions of this paper is September
Although water purified by aquatic-plant units cannot be used as 15, 2004.fresh water, it may be used in industry and agriculture as part of aneffort to increase available water resources in Israel and neighboringcountries. The use of natural water-purification technologies Referencesprovides favorable cost-benefit ratios, as evidenced by Akoroda. M. 0, (1990) A Comparison of Eichomia crassipes (Ponteder-
iaceae) and Sphagnum quinquefarium (Sphagnaceae) in Treatment of.Reduction of pollutant loading at its source, especially in small Acid Mine Water. Econ. Bot" 44,40,
towns and villages; American Public Health Association: American Water Works Association;.Effective water reuse as irrigation water; Water Environment Federation (1985) Standard Methods for the.Regulation of the hydroperiod of rivers to safeguard baseline Examination of Water and Wastewatel; 16th ed.; Washington, D.C.
flow conditions. Bonomo, L.; Pastore11i, G,: Zambon, N. (1997) Advantages and Limitations, ,.Restoration of ecological function to polluted regions and of Duckweeds-Based Wastewater Treatment Systems, Water SCI.
" .1.. f 1. I f th " . f .Technol" 35 (5), 239.laclltatlon 0 mu tip e use 0 e area lor spawnmg 0 marme B L (2000)U f A ' M h 1m th Q ali frumer, ' se 0 quatlc acrop ytes to prove e u ty 0lIfe, conservation of nature, protection of mIgratory birds, Effluents after Chlorination, Ph.D. Dissertation, Technion Israelpassive recreation, and promotion of ecotourism; Institute of Technology, Haifa.
.Service as a model for environmentally friendly and effective Cooke, L. G, (1994) Nutrient Transformation in a Natural Wetlandwater management in arid and hot climate countries; and Receiving Sewage Effluent and the Implications for Waste Treatment.
.Growing plants as a means to improve water quality and Water Sci. Technol., 29 (4), 209,elimination of disturbing wastewater smell. DeBusk, T, A,: Reddy, K, R. (1987) BOD Removal in Floating Aquatic
Macrophyte-Based Wastewater Treatment Systems. Water Sci. Tech-nol" 19 (12), 273.
Droste, R. L. (1997) Theory and Practice of Water and WastewaterConclusions Treatment; Wiley & Sons: New York; p 800.
The potential use of aquatic plants for improving river water quality Gale, P. M.; Devai, L.; Reddy, K. R.; Graetz, D. A. (1993) Denitrification'd ed . th' k L bo t II 'I t ' ts Potential of Soil from Constructed and Natural Wetlands. Ecol, Eng" 2,
was consl er m IS wor. a ra ory as we as pI 0 expenmen 119indic~ted the ~iability of this ~pproach, particular~y for ~e section of Gopal, Hr. (1999) Natural and Constructed Wetlands for Wastewaterthe Kishon River polluted WIth wastewater, not mdustrtal effluents. Treatment: Potentials and Problems. Water Sci. Technol.. 40 (3), 27.This relates to a reduction in values of major water-quality indicators Hamilton, N.: Nix, P. G.; Sobolewski, A. (1993) An Overview ofsuch as BOD, TSS, COD, and turbidity. The plants (primarily E. Constructed Wetlands as Alternatives to Conventional Waste Treat-crassipes) were capable of reducing these variables to concentrations ment Systems. Water Pollut, Res. J. Canada, 28,529.required by national and local guidelines as well as international Hammer, D, A., Ed. (1989) Constructed Wetlands for Wastewaterstandards for irrigation water. Furthermore, the plants eliminated the Treatment. Municipal, Industrial and Agricultural; Lewis Publishers:disturbing smell of wastewater, which poses serious problems in Chelsea, Michi~an. ,various locations throughout the country. The aquatic-plants system Hofman, D.; HaruSI, Y. (2001) Cost of Urban Wastewater Treatment m
f" . tall fri dl d fti . hn I " Israel, Part 3. Water Eng., Liq. Irrigation, 11, 8 (in Hebrew).0 lers an envlronmen y en y an cost-e ective tec 0 ogy lor J R B WaIn H Z (1985)C b" N ' R al '
th, ..acquez, .,; er,.. om mmg utnent emov WItreatment of urban and agncultural wastewater m Israel, In partIcular, Prot ' S th . U . W te H ' th F h t Pra P I,. ' em yn eSls smg a a r yacm -res wa er wn 0 y-thIs applIes to small- and medIum-sIze commumtles and agncultural culture Wastewater Treatment System; Project No. 1345677; http://enterprises. In the case of the Kishon River, aquatic plants can be used homepage. westmont.edu/u/outside/phil.sodermantwww/abs 195.htm,to purify water coming from the upstream sections of the river. The Jensen, R. (1988) Floating Aquatic Plants, Texas Water Resources, 14 (2),treated stream can then be used to nourish new park areas in the 1-10.
May/June 2004 229

'.",Co
Zimmels et al.
Kadlec, R, H. (1995) Overview: Surface F1ow Constructed Wetlands The Book of Water Plants (1998) Van de Velde Waterplanten bv:System. Water Sci. Technol., 32 (3), 1. Bleeiswijk, Netherlands; p 141.
Kadlec, R. H.; Knight, R. L. (1995) Treatments Wetlands; Lewis Publishers: Tripathi, Br. D.; Srivastava, J.; Misra, K. (1991) Nitrogen and PhosphorusBoca Raton, F1orida. Removal-Capacity of Four Chosen Aquatic Macrophytes in Tropical
Kishon River Authority Report (accessed April 2000) www.kishon.orgil. Freshwater Ponds. Environ. Conserv., 18, 143.Knight, R. L. (1997) Wildlife Habitat and Public Use Benefits of Treatment U.S. Environmental Protection Agency (1988) Constructed Wetlands and
Wetlands. Water Sci. Technol., 35 (5), 35. Aquatic Plant Systems for Municipal Wastewater Treatment: DesignReed, S. C.; Crites, R. W.; Middlebrooks, E. J. (1995) Natural Systems Manual; Office of Research and Development, Center for Environ-
for Waste Management and Treatment, 2nd ed.; McGraw-Hili: mental Research Information: Cincinnati, Ohio; p 83.New York. Vrhovsek, D.; Kukanja, V.; Bule, T. (1996) Constructed Wetland for
Salati, E., Jr.; Salati, Eneida; Salati, E. (1999) Wetlands Projects Developed Wastewater Treatment. Water Res., 30,2287.in Brazil. Water Sci. Technol., 40 (3), 19. Water Environment Federation (1998) Design of Municipal Wastewater
Statistical Abstract of Israel (2000) Central Bureau of Statistics: Jerusalem, Treatment Plants, 4th ed.; Manual of Practice No.8; Alexandria,Israel; No. 51, pp 1-17. Virginia.
Arnc("elCI
eJ
01
OJ
isOJ
c:aJ
eJ
~Ta~
Ii.II
10
btItJ
tIIi
0
Eaaaea
.,IIv
e1e,II.
230 Water Environment Research, Volume 76, Number 3 ~