Embed Size (px)
Citation preview
B R A I N R E S E A R C H 1 1 4 7 ( 2 0 0 7 ) 1 2 4 – 1 3 9
ava i l ab l e a t www.sc i enced i rec t . com
www.e l sev i e r. com/ loca te /b ra in res
Research Report
Plastic and metaplastic changes in the CA1 and subicularprojections to the entorhinal cortex
Sarah Craig, Sean Commins⁎
Department of Psychology, National University of Ireland, Maynooth, Maynooth, Co. Kildare, Ireland
A R T I C L E I N F O
⁎ Corresponding author. Fax: +353 1 7084767.E-mail address: [email protected]
0006-8993/$ – see front matter © 2007 Elsevidoi:10.1016/j.brainres.2007.02.016
A B S T R A C T
Article history:Accepted 2 February 2007Available online 21 February 2007
The hippocampal formation (HF) is a brain structure critically involved in memoryformation. Two major pathways have been identified in the rat; one projection targets thehippocampus via perirhinal cortex and lateral entorhinal cortex (LEC) while another targetsthe hippocampus via postrhinal cortex and medial entorhinal cortex (MEC). Areas CA1 andsubiculum constitute major output structures of HF and target many cortical structuresincluding EC. These return projections are also anatomically segregated with distinctregions of CA1 and subiculum projecting to either the LEC or MEC. We have previouslydemonstrated that the projections from CA1 and subiculum to the EC are capable ofsustaining short- and long-term plastic changes. Here we detail a physiological topographythat exists along the hippocampal output projections, equating well with the knownanatomy. Specifically, field excitatory postsynaptic potential (fEPSP) responses in LEC arestronger following distal CA1 and proximal subiculum stimulation, compared to eitherproximal CA1 or distal subiculum stimulation. In addition, fEPSP responses in MEC arestronger following proximal CA1 stimulation compared to distal CA1. We also demonstratethat the distal CA1-LEC, proximal CA1-MEC and proximal subiculum-LEC projections are allcapable of frequency-dependent plastic effects that shift the response from LTD to LTP. Inaddition, responses in distal CA1-LEC projection seem to show metaplastic capabilities. Wediscuss the possibility of dissociation between LEC andMEC projections, whichmay suggesttwo functional circuits from the HF to the cortex and may have implications in informationprocessing, memory research and hippocampal seizure spread to the cortex.
© 2007 Elsevier B.V. All rights reserved.
Keywords:MetaplasticityFunctional segregationLong-term potentiationPaired-pulse facilitationHippocampus
1. Introduction
The hippocampus is a medial temporal lobe structure that iscritically involved in the formation of declarative memories(Ogden and Corkin, 1991; Scoville and Milner, 1957). Evidencefor this ascertain derives from lesion (Jarrard, 1983, 1993),patient (Cipolotti et al., 2006), imaging (Schacter and Wagner,1999), and the plastic capabilities of this structure (Martin etal., 2000). Long-term potentiation (LTP), a long-lasting form of
(S. Commins).
er B.V. All rights reserved
synaptic change considered a realistic model of learning andmemory was first identified along the perforant pathway (themajor input projection to the hippocampus; Bliss and Lomo,1973; Bliss and Collingridge, 1993). Other forms of activity-dependent changes have been demonstrated throughout thehippocampal circuit, including among others, long-termdepression (LTD), paired-pulse facilitation and depression(PPF/D), post-synaptic potentiation (PST) and augmentation(Thomsom, 2000). PPF and PPD are short-term plastic changes
.

125B R A I N R E S E A R C H 1 1 4 7 ( 2 0 0 7 ) 1 2 4 – 1 3 9
at the synapse elicited by a brief spike pair. PPF is thephenomenon whereby the field excitatory postsynapticresponse (fEPSP) to a second stimulus is enhanced relative tothe first, if the second stimulus is delivered relatively quicklyafter the first (Katz and Miledi, 1970; Zucker, 1989).
It has been increasingly clear that it is not just simply amatter of whether plastic changes can be induced at aparticular synapse; rather synapses should be viewed asbeing dynamic. The dynamic nature of synapses should beseen in terms of the duration of change (short-term changesin the range of milliseconds, in the case of PPF/D to morelonger-term changes hours to days, in the case of LTP/D),degree of change and direction of change. Some synapses forexample, may demonstrate an increase in efficacy (facilita-tion and potentiation), while others may decrease (depres-sion). This dynamism is important in the developing cortex(Bienenstock et al., 1982) and is now clear that memoryformation and storage may also depend on such changes(Bear et al., 1987).
Traditionally LTP and LTD have been treated as indepen-dent entities, evidence, however, now suggests that theseprocesses are bi-directional modifications of the same synap-tic mechanism (Castellani et al., 2001; Dudek and Bear, 1993;Heynen et al., 2000). Experimental data obtained from thedeveloping visual cortex have led to a biphasic synapticmodification rule known as the Bienenstock-Cooper-Munrorule (BCM; Bienenstock et al., 1982), with the crossover pointfrom LTD to LTP known as the modification threshold (θm).This threshold is not fixed but varies according to priorpostsynaptic activity (Dudek and Bear, 1993). This activity-dependent modulation, termed metaplasticity (Abraham andBear, 1996) can result from a number of different factorsincluding changes in receptor function, prior synaptic activityand stress (Dudek and Bear, 1992; Garcia, 2001; Gisabella et al.,2003; Van Dam et al., 2004; Wu et al., 2004).
Neuroanatomical research over the last number of years(Witter et al., 2000) has suggested the existence of two parallelpathways through the hippocampal formation that may beinvolved in separately processing functionally different typesof information. The first pathway arises in the perirhinalcortex, projects through the lateral entorhinal cortex (LEC) andterminates in different layers of the dentate gyrus, CA3 andthe distal CA1 and proximal subiculum. The second pathwayarises in the postrhinal cortex and targets the proximal CA1and distal subiculum as well as different layers of dentategyrus and CA3 via the medial entorhinal cortex (MEC). Morerecent research (Kloosterman et al., 2003) has indicated thatthe segregation of information is maintained on the returnprojections from the hippocampus to the cortex. Tracingstudies, for example, have shown that the proximal CA1 anddistal subiculum target mainly the MEC whereas the distalCA1 and proximal subiculum target the LEC (Kloosterman etal., 2003; Tamamaki and Nojyo, 1995). The importance ofidentifying hippocampal–cortical projections that are physio-logically as well as anatomically connected lies in thesuggestion that one or all of these projections may serve asfunctional routes along which memories may be retained.Indeed, many current theories of memory formation highlightthe importance of hippocampal–cortical interactions for theconsolidation of declarative memories (Nadel and Moscov-
itch, 1997; Rolls, 1996; Squire, 1992). Furthermore, sometheories (Rolls, 1996) specify that the backprojections fromthe hippocampus to the neocortex must undergo activity-dependent changes in order for memories to be retained inthe long-term.
Recently we have demonstrated that the projection fromCA1-EC and subiculum-EC can undergo activity-dependentchanges in the form of PPF and LTP (Craig and Commins, 2005,2006); however, as suggested above it is becoming increasinglyrecognised that it is not simply a question of whethersynapses can become potentiated or not, but rather, it isimportant to understand the full range of dynamic plasticcapabilities of a particular synapse to fully appreciate the roleof plasticity in memory formation.
In a first set of experiments we aim to detail electrophy-siologically the topographical nature of the CA1 and subicularprojections to EC, from this, we wish to examine the plasticand metaplastic capabilities of these projections. Specifically,we aim to elucidate whether the CA1 and/or subicular-ECprojections are capable of frequency-dependent plasticity,that is, are the projections capable of shifting from LTD to LTPsimply by varying the frequency applied to the particularsynapse. In other words, does each projection fit the BCMmodel of synaptic plasticity and if so what is the modificationthreshold of each projection? Furthermore once a change hasoccurred in the responsiveness of a projection, is thatprojection capable of further change by applying a secondstimulation at any give frequency?
2. Results
2.1. General description of electrode placement sites
2.1.1. Lateral EC responses following CA1 stimulationIn all cases (n=6) a response was evoked in the LEC followingstimulation in area CA1. Figs. 1a (first panel) and b (upperpanel) shows the distribution of the approximate final posi-tions of all stimulating and recording sites. Fig. 1a (secondpanel) shows 3 representativeNissl-stained coronal sliceswithproximal, medial and distal CA1 electrode tracks, while Fig. 1b(lower panel) shows an electrode track in LEC. The finalstimulating sites were positioned along the entire proximo-distal extent of CA1. The positions of the stimulating electro-des were all located between 3.1 mm and 5.8 mm posterior toBregma. In addition the final positions of the recordingelectrodes in LEC were all located between 6.7 mm and7.2 mm posterior to Bregma.
The recording electrode was first lowered to 6 mm belowthe surface of the brain and allowed to settle in the LEC.Then, the stimulating electrode was slowly lowered towardsthe proximal CA1 with stimulation conducted at a rate of0.05 Hz. When the maximal fEPSP response was achieved inthe LEC, the stimulating electrode was allowed to settle for10 min and various features of the fEPSP were noted,including amplitude, slope and latency of response. Theresponse occurred at a mean latency value of 14.67±0.34 msand had a mean peak amplitude value of 0.34±0.08 mV and aslope of 0.1±0.02 mV/ms. While recording electrode remainedin place in LEC the stimulating electrode was then removed

126 B R A I N R E S E A R C H 1 1 4 7 ( 2 0 0 7 ) 1 2 4 – 1 3 9
slowly from the proximal CA1 and then lowered towardsmedial CA1 until a maximal response was again achieved. Asingle-pulse stimulation in medial CA1 evoked a largerpositive-going deflection in the lateral EC. The mean ampli-tude of entorhinal response for medial CA1 stimulation was0.48±0.10 mV with a mean latency of 15.12±0.31 ms. Themean slope was 0.14±0.03 mV/ms. Finally, the stimulating
electrode was again slowly removed and then lowered todistal CA1 until the maximum response was observed in LEC.The mean amplitude was 1.29±0.15 mV and the latency was11.15±0.5 ms. The mean slope was 0.21±0.06 mV/ms. A one-way ANOVA was conducted to compare the mean of threefEPSP responses in LEC following stimulation in either theproximal, medial or distal CA1. An overall significant

127B R A I N R E S E A R C H 1 1 4 7 ( 2 0 0 7 ) 1 2 4 – 1 3 9
difference was found in the mean slope of the responses(F=3.787, df=2,17, p<0.05), with subsequent post hoc analysis(Tukey, p<0.05) demonstrating that the evoked response inLEC was significantly larger following stimulation in distalCA1 compared to the proximal region (Fig. 1e).
2.1.2. Medial EC responses following CA1 stimulationIn all cases (n=6) a response was evoked in the MEC followingstimulation in area CA1. Fig. 1c (first panel) and 1d (lowerpanel) show the distribution of the final positions of allstimulating and recording sites. Fig. 1c (second panel) shows 3representative Nissl-stained coronal sections with proximal,medial and distal CA1 electrode tracks, while Fig. 1d (lowerpanel) shows an electrode track in MEC. The final stimulatingsites were positioned along the entire proximo-distal extent ofCA1. The positions of the stimulating electrodes were alllocated between 3.1 mm and 5.8 mm posterior to Bregma. Inaddition the final positions of the recording electrodes in MECwere again approximately located between 6.7 mm and7.2 mm posterior to Bregma.
The recording electrode was first lowered to the MEC andallowed to settle, then, the stimulating electrode was slowlylowered towards the proximal CA1 with stimulation con-ducted at a rate of 0.05 Hz. When the maximal fEPSPresponse was achieved in the MEC, the stimulating electrodewas allowed to settle for 10 min and the fEPSP slopeamplitude and latency of response were again noted. Asthe stimulating electrode settled in the proximal CA1, theresponse in MEC was characterised by a positive-goingdeflection that occurred at a mean latency value of 16.82±1.38 ms and had a mean peak value of 1.58±0.24 mV and aslope of 0.19±0.03 mV/ms. The stimulating electrode wasremoved from the proximal CA1 and slowly lowered towardsthe medial CA1 while recording continued to take place inMEC. As stimulating electrode settle in the medial CA1 asmall positive-going response occurred in MEC. The meanamplitude for the response was 0.52±0.07 mV and the meanlatency was 12.83±0.79 ms. The mean slope was 0.10±0.01 mV/ms. Finally the stimulating electrode was placed inthe distal CA1; this produced a small response characterisedby a mean fEPSP response in the MEC of amplitude of 0.41±0.11 mV and latency of 11.43±0.45 ms. The mean slope was0.1±0.01 mV/ms. A one-way ANOVA was again conducted tocompare the mean of three fEPSP responses in LEC followingstimulation in either the proximal, medial or distal CA1. Anoverall significant difference was found in the mean slope ofthe responses (F=7.102, df=2,17, p<0.01), with subsequent
Fig. 1 – (a, first panel) Distribution of the approximate final positdistal CA1. (a, second panel) Three representative Nissl-stainedtargeting proximal, medial and distal CA1. (b, upper panel) Distribin LEC. (b, lower panel) Shows a representative Nissl-stained corDistribution of the approximate final positions of all stimulating sThree representative Nissl-stained coronal slices highlighting thdistal CA1. (d) Distribution of the approximate final positions of aNissl-stained coronal slice of an electrode track targeting MEC (loevoked fEPSP response in the LEC following stimulation in proxichart demonstrating the mean slope of the evoked fEPSP respondistal CA1 with representative traces.
post hoc analysis (Tukey, p<0.05) demonstrating that theevoked response in LEC was significantly larger followingstimulation in proximal CA1 compared to the distal (p<0.01)or medial (p<0.05) regions (Fig. 1f).
2.1.3. Lateral EC responses following subicular stimulationIn all cases (n=12) a response was evoked in the LECfollowing stimulation in the subiculum. Fig. 2a (first andthird panel) shows the distribution of the approximate finalpositions of all stimulating and recording sites. Fig. 2a(second and fourth panel) shows representative Nissl-stainedcoronal sections, with stimulating and recording electrodetracks. The stimulating sites were positioned along the entireproximo-distal extent of the subiculum. Proximal electrodesare indicted by a circle, medial electrodes by a triangle anddistal electrodes by a square. The positions of the stimulatingelectrodes were all located between 6.1 mm and 6.4 mmposterior to Bregma. In addition the final positions of therecording electrodes in LEC were all located between 6.7 mmand 7.2 mm posterior to Bregma. A similar procedure to CA1-EC recordings (see above) was adopted here. The recordingelectrode was allowed to settle in the LEC while thestimulating electrode was slowly lowered towards theproximal subiculum. When the maximal fEPSP responsewas achieved in the LEC, the stimulating electrode wasallowed to settle for 10 min and the fEPSP was characterised.A single-pulse stimulation in the proximal subiculumevoked apositive-going deflection in the LEC with amean latency valueof 13.98±1.36ms and ameanpeak value of 2.10±0.28mVand aslope of 0.54±0.09mV/ms. Following this, only the stimulatingelectrode was removed and aimed towards the medialsubiculum. Stimulation in the medial subiculum was againcharacterised by a positive-going deflection. The mean ampli-tude was 1.15±0.25 mV, the mean latency of 12.67±2.00 msand the mean slope of 0.22± 0.05 mV/ms. A smaller responsewas observed as the electrodes were lowered towards thedistal subiculum. The mean amplitude of this response was0.77±0.30 mV with a latency of 18.93±1.35 ms and a meanslope of 0.22±0.04 mV/ms. A one-way ANOVA was conductedto compare the mean of three fEPSP responses in LECfollowing stimulation in either the proximal, medial or distalsubiculum. An overall significant difference was found in themean slope of the responses (F=7.736, df=2,35, p<0.01), withsubsequent post hoc analysis (Tukey, p<0.05) demonstratingthat the evoked response in LEC was significantly largerfollowing stimulation in proximal subiculum compared toeither the distal (p<0.01) or medial (p<0.01) regions (Fig. 2c).
ions of all stimulating sites (n=6) in proximal, medial andcoronal slices highlighting the stimulating electrode trackution of the approximate final positions of all recording sitesonal slice of an electrode track targeting LEC. (c, first panel)ites in proximal,medial and distal CA1 (n=6). (c, secondpanel)e stimulating electrode track targeting proximal, medial andll recording sites in MEC (upper panel) with a representativewer panel). (e) Bar chart demonstrating the mean slope of themal, medial and distal CA1 with representative traces. (f) Barse in the MEC following stimulation in proximal, medial and
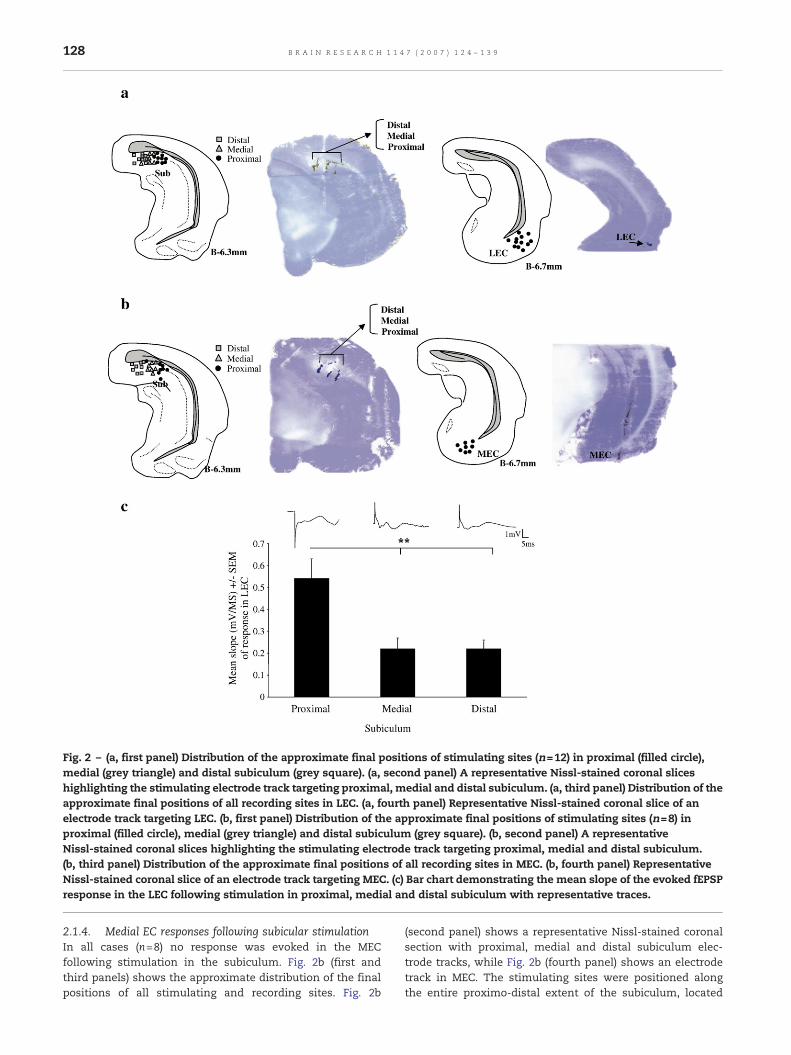
Fig. 2 – (a, first panel) Distribution of the approximate final positions of stimulating sites (n=12) in proximal (filled circle),medial (grey triangle) and distal subiculum (grey square). (a, second panel) A representative Nissl-stained coronal sliceshighlighting the stimulating electrode track targeting proximal, medial and distal subiculum. (a, third panel) Distribution of theapproximate final positions of all recording sites in LEC. (a, fourth panel) Representative Nissl-stained coronal slice of anelectrode track targeting LEC. (b, first panel) Distribution of the approximate final positions of stimulating sites (n=8) inproximal (filled circle), medial (grey triangle) and distal subiculum (grey square). (b, second panel) A representativeNissl-stained coronal slices highlighting the stimulating electrode track targeting proximal, medial and distal subiculum.(b, third panel) Distribution of the approximate final positions of all recording sites in MEC. (b, fourth panel) RepresentativeNissl-stained coronal slice of an electrode track targeting MEC. (c) Bar chart demonstrating the mean slope of the evoked fEPSPresponse in the LEC following stimulation in proximal, medial and distal subiculum with representative traces.
128 B R A I N R E S E A R C H 1 1 4 7 ( 2 0 0 7 ) 1 2 4 – 1 3 9
2.1.4. Medial EC responses following subicular stimulationIn all cases (n=8) no response was evoked in the MECfollowing stimulation in the subiculum. Fig. 2b (first andthird panels) shows the approximate distribution of the finalpositions of all stimulating and recording sites. Fig. 2b
(second panel) shows a representative Nissl-stained coronalsection with proximal, medial and distal subiculum elec-trode tracks, while Fig. 2b (fourth panel) shows an electrodetrack in MEC. The stimulating sites were positioned alongthe entire proximo-distal extent of the subiculum, located

129B R A I N R E S E A R C H 1 1 4 7 ( 2 0 0 7 ) 1 2 4 – 1 3 9
just below the corpus callosum. The positions of thestimulating electrodes were all located between 6.1 mmand 6.4 mm posterior to Bregma. In addition, the final
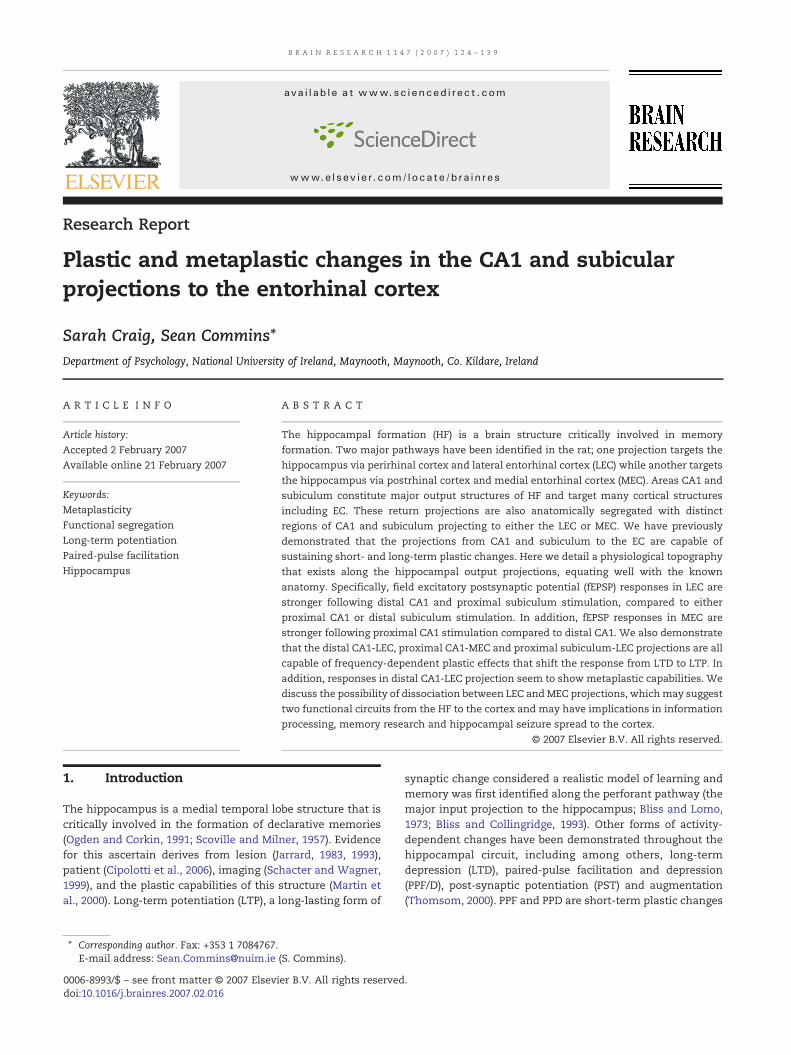
Fig. 3 – Bar chart demonstrating mean percentage facilitation inand 480 ms IPIs in the (a) distal CA1-LEC, (b) proximal CA1-MECtraces of fEPSP1 and fEPSP2 for the 20, 60 and 480 ms intervals a
positions of the recording electrodes in MEC were all locatedbetween 6.7 mm and 7.2 mm posterior to Bregma. Unfortu-nately, in our hands, a single-pulse stimulation in the
fEPSP2 normalised to fEPSP1 (100%) with 40, 60, 120, 240and (c) proximal subiculum-LEC projections. Representativere illustrated above the graph (1, 2 and 3 respectively).

130 B R A I N R E S E A R C H 1 1 4 7 ( 2 0 0 7 ) 1 2 4 – 1 3 9
proximal, medial or distal subiculum failed to evoke ameasurable response in the MEC.
2.2. Short-term plastic effects in the hippocampal outputsto EC
In a second set of experiments paired-pulse facilitation ordepression was examined in the projections that producedmaximal responses, that is, distal CA1-LEC, proximal CA1-MEC and proximal subiculum-LEC.
Using five inter-pulse-intervals (IPIs; 40 ms, 60 ms, 120 ms,240 ms and 480 ms), PPF was measured at the different IPIs sixtimes in at least 25 animals in the distal CA1-LEC projection.The mean percentage facilitation for 40 ms, 60 ms, 120 ms,240 ms and 480 ms intervals is 168±16%, 194±25%, 171±11%,150±7% and 106±4%, respectively (normalised to the firstfEPSP of each pair (100%)). A strong PPF effect is evident acrossall intervals tested (except 480 ms) in this projection (p<0.01)(Fig. 3a). A one-way ANOVA was then used to compare themean percentage facilitation across the different IPIs. Anoverall significant main effect was found (F=4.775, df=4,20,p<0.01) between the IPIs tested with subsequent post hoctests (p<0.05) revealing that the mean percentage facilitationat the 480 ms IPI was significantly lower compared to all otherintervals.
Baseline PPF/D was also examined in the proximal CA1-MEC projection using the same five IPIs. Themean percentagefacilitation for 40 ms, 60 ms, 120 ms, 240 ms and 480 msintervals is 72±24%, 173±18%, 212±20%, 230±26% and 190±14% respectively. A strong PPF effect is evident across mostintervals tested, including the 480ms IPI (p<0.01), while PPD isobserved following the 40ms IPI (p<0.05) (Fig. 3b). Again a one-way ANOVA was used to compare the mean percentagefacilitation across the different IPIs. An overall significantmain effect was again found (F=7.404, df=4,20, p<0.01)between the IPIs tested with subsequent post hoc tests(p<0.05) demonstrating that the mean percentage facilitationat the 40ms IPI was significantly lower than all other intervalsas would be predicted from Fig. 3b.
Finally, baseline PPF/D was also examined in the proximalsubiculum-LEC projection using the same five IPIs as before.The mean percentage facilitation for 40 ms, 60 ms, 120 ms,240ms and 480ms intervals is 155±7%, 153±8%, 140±5%, 128±6% and 115±5%, respectively (see Fig. 3c). A strong PPF effect isevident across most intervals tested except for 480 ms IPI(p<0.01). A one-way ANOVA was conducted to compare themean facilitation at the different IPIs. An overall significantmain effect was found (F=11.701, df=4,20, p<0.01) betweenthe IPIs tested with subsequent post hoc tests (p<0.05)revealing that the mean percentage facilitation at the 40 msand 60 ms IPI was significantly higher than the facilitation at240 and 480 ms, while the mean percentage facilitation the120 ms IPI was significantly higher than that at the 480 ms IPI.
2.3. Long-term frequency-dependent plasticity in thehippocampal outputs to EC
2.3.1. Distal CA1-LECInitially a 3×5 mixed factorial ANOVA was conducted toexamine the effects of frequency stimulation and time of
application of stimulation on the plastic capabilities in thedistal CA1-LEC projection. TIME was used as the within-subjects factor (conducted at three levels; 10 min baselineperiod, 50–60 min post-first stimulation and 50–60 post-second stimulation). GROUP was used as the between-subjectfactor (conducted at five levels; 1 Hz, 5 Hz, 10 Hz, 50 Hz and100 Hz). We found an overall significant main effect for TIME(F=14.518, df=2,46, p<0.01), Group (F=9.149, df=4,23, p<0.01)and also a significant TIME×GROUP interaction effect(F=4.646, df=8,46, p<0.01). Investigation of within-groupeffects of TIME at each frequency of stimulation revealed thefollowing effects.
The mean slope of the fEPSP response in LEC at 30 and60min post-1 Hz stimulation in distal CA1 (n=6) stood at 91.17±3.23 and 96.66±4.8%, respectively of pre-stimulation baselineresponses. A second stimulation at 1 Hz produced a smallincrease in fEPSP responses immediately (113.7±7.6%) post-stimulation and remained increased for the next 60 min.Responses at 30 and 60 min post-second stimulation, forexample, stood at 124.26±4.5 and 121.6±2.4%, respectively(Fig. 4a). A repeated-measures ANOVA comparing the final10-min period post-second stimulation to the final 10 minperiod post-first stimulation and the 10 min baseline periodfound an overall significant main effect for the three timeperiods (F=6.898, df=2,10, p<0.05). Bonferroni post hoc testsrevealed a significant increases in mean responses for thefinal 10 min post-second stimulation compared to the final10 min post-first stimulation (t=−2.942, df=5, p<0.05). Therewas, however, no significant change in mean slope offEPSPs for the final 10 min of recording post-first (t=0.209,df=5, p>0.05) or second stimulation (t=−2.372, df=5, p=0.07)compared to 10-min baseline period (see Fig. 4a).
Following 5 Hz stimulation (n=6), the fEPSP responseinitially decreased at 15 min (75.79±7.12%) and remaineddepressed for at least 30 min (80.91±9.2%). This responsethen gradually increased back to near baseline levels at45 and 60 min post-stimulation (90.27±7.56 and 90.29±5.18%, respectively). A second 5 Hz stimulation also didnot produce significant changes in fEPSP responses.Responses stood at 94.8±6.7 and 89.7±8.5% at 30 and60 min post-second stimulation respectively (Fig. 4b).Comparisons of the three 10 min periods (final 10-minperiod post-second stimulation, final 10 min period post-first stimulation and 10 min baseline period) revealed nosignificant changes in mean fEPSP responses (F=0.901,df=2,10, p>0.05). Bonferroni post hoc tests also revealed nosignificant differences between any of the time periodstested.
Following 10 Hz stimulation (n=6), fEPSP responses at 30and 60 min stood at 66.47±3.89 and 83.83±4.9%, respectivelyof pre-stimulation response. A second 10 Hz stimulation didnot cause further depression but responses graduallyreturned to baseline levels. Responses for example stoodat 89.9±2.55 and 97.2±2.33% at 30 and 60 min post-second10 Hz stimulation, respectively (see Fig. 4c). A repeated-measures ANOVA comparing the final 10-min period post-second stimulation to the final 10 min period post-firststimulation and the 10 min baseline period did not find anoverall significant main effect for the three time periods(F=2.457, df=2,10, p>0.05). Post hoc comparisons, however,

Fig. 4 – Effect of (a) 1 Hz, (b) 5 Hz, (c) 10 Hz, (d) 50 Hz and (e) 100 Hz stimulation on the slope of fEPSPs in the distal CA1-LECprojection (n=6 for each frequency tested). Stimulations are given twice, the first after a 10-min baseline period and thesecond 60min post-first stimulation. The post-stimulation values are expressed as percentage of the pre-stimulation baseline±SEM. Representative traces for baseline, post-first stimulation and post-second stimulation are located above each figure.(f) A line chart plotting the average mean change in fEPSP slope at each frequency for the final 10 min of recording post-firststimulation (black line) and post-second stimulation (dashed line).
131B R A I N R E S E A R C H 1 1 4 7 ( 2 0 0 7 ) 1 2 4 – 1 3 9

132 B R A I N R E S E A R C H 1 1 4 7 ( 2 0 0 7 ) 1 2 4 – 1 3 9
revealed that the mean responses of the final 10-min periodpost-first stimulation were significantly smaller than themean baseline responses (t=2.692, df=5, p<0.05). No otherdifferences were noted.
Following 50 Hz stimulation (n=6) fEPSP responses at 30and 60min stood at 116.37±3.28 and 110.51±4.3% respectivelythat of pre-stimulation responses. While a second 50 Hzstimulation did not produce significant changes in fEPSPresponses. Responses remained potentiated at 129± 5.2 and119±4.9% at 30 and 60 min post-second stimulation respec-tively (see Fig. 4d). A repeated-measures ANOVA found anoverall significantmain effect for the three time periods tested(F=18.178, df=2,10, p<0.01). Bonferroni post hoc tests revealedsignificant increases in mean responses for the final 10 minpost-first and post-second stimulation compared to baselineperiod (t=−5.111, df=5, p<0.01 and t=−4.172, df=5, p<0.01,respectively). There was, however, no significant change inmean slope of fEPSPs for the final 10min of recording post-firstcompared to final 10min of recording post-second stimulation(t=−1.4, df=5, p>0.05).
Finally following 100 Hz stimulation (n=5) fEPSP responsesat 30 and 60 min stood at 143.27±6.4 and 140.22±1.55%,respectively that of pre-stimulation responses. A secondstimulation at 100 Hz seemed to enhance this potentiation.Responses stoodat 165±16and156±13%at 30 and60minpost-second 100 Hz stimulation, respectively (Fig. 4e). A repeated-measures ANOVA again found an overall significant maineffect for the three time periods tested (F=8.935, df=2,8,p<0.01). Bonferroni post hoc tests again revealed a significantincrease in mean responses for the final 10 min post-firstand post-second stimulation compared to baseline period(t=−8.394, df=4, p<0.01 and t=−3.158, df=4, p<0.05, respec-tively). There was, however, no significant change in meanslope of fEPSPs for the final 10 min of recording post-firstcompared to final 10 min of recording post-second stimula-tion (t=−1.387, df=4, p>0.05).
Fig. 4f summaries the results described above by plottingthe average mean change in fEPSP slope at each frequencyfor the final 10 min of recording post-first stimulation(black line) and post-second stimulation (dashed line). Themodification threshold occurs at approximately 25 Hz (axiscross-over of black line). As BCM model predicts thatsynaptic function can vary depending on the previoushistory of that synapse (Bienenstock et al., 1982), in orderto directly test whether this projection was capable of ametaplastic effects, the mean change in response in thefinal 10 min following the second and first frequencystimulations only was compared. This analysis was carriedout using a 2×5 repeated-measures ANOVA. TIME (firststimulation Vs second stimulation) was used for the within-subjects measures and GROUP (1, 5, 10, 50 and 100) wasused as the between-subjects measure. An overall signifi-cant main effect for TIME (F=16.13, df=1,23, p<0.01) wasfound suggesting that this projection is capable of meta-plastic effects. There was also a main effect for GROUP(F=8.354, df=4,23, p<0.001). Subsequent post hoc testsdemonstrated that the responses following 100 Hz weresignificantly higher than those following 5 or 10 Hz. Inaddition, we found a significant TIME×GROUP interactioneffect (F=3.073, df=4,23, p<0.05).
2.3.2. Proximal CA1-MECAgain a 3×5 mixed factorial ANOVA was conducted toexamine the effects of frequency stimulation and time ofapplication of stimulation on the plastic capabilities this timein the proximal CA1-MEC projection. TIME was used as thewithin-subjects factor (again conducted at three levels; 10 minbaseline period, 50–60 min post-first stimulation and 50–60post-second stimulation). GROUP was used as the between-subject factor (conducted at five levels; 1 Hz, 5 Hz, 10 Hz, 50 Hzand 100 Hz). We found no overall significant main effect forTIME (F=1.201, df=2,42, p>0.05), we did, however, find overallsignificant main effect for GROUP (F=4.759, df=4,21, p<0.01)and also a significant TIME×GROUP interaction effect(F=3.378, df=8, 42, p<0.01). This then allowed us to investigatewithin-group effects at each frequency of stimulation.
The mean slope of the fEPSP response in MEC following1 Hz stimulation in the proximal CA1 (n=5) decreased initiallyat 15 min (76.88±1.14%) and then started to increase at 30, 45and 60 min (88.03±1.2, 91.84±1.83, 92.66±0.74%, respectively).A second stimulation at 1 Hz in this projection leads to aninitial depression in response before gradually increasing tojust below baseline levels. Responses stood at 72±7% and77.9±2.8% at 30 and 60 min post-second stimulation, respec-tively (see Fig. 5a). A repeated-measures ANOVA comparingthe final 10- min period post-second stimulation to the final10 min period post-first stimulation and the 10 min baselineperiod found no overall significant main effect for the threetime periods (F=1.814, df=2,8, p>0.05). Bonferroni post hoctests, however, revealed a significant decrease in meanresponses for the final 10 min post-second stimulationcompared to the final 10 min post-first stimulation (t=2.886,df=4, p<0.05). No other differences were noted.
Following 5 Hz stimulation (n=5), the fEPSP response at 30and 60 min stood at 69.92±1.3 and 70.30±2.04%, respectively,of pre-stimulation response. A second stimulation did notchange this depression. Responses at 30 and 60 min post-second stimulation stood at 71±4% and 72±3.5%, respectively(see Fig. 5b). A repeated-measures ANOVA comparing thethree time periods found an overall significant main effect(F=5.866, df=2,8, p<0.05). Bonferroni post hoc tests revealed nosignificant change in mean responses for the final 10 minpost-second stimulation compared to the final 10 min post-first stimulation (t=−0.371, df=4, p>0.05). We did find,however, a significant decrease in mean response for boththe final 10 min post-first stimulation (t=5.559, df=4, p<0.01)and post-second stimulation compared to baseline responses(t=2.3, df=4, p=0.05).
Following 10 Hz stimulation, fEPSP responses at 30 and60min stood at 67.3±1.7 and 72.04±1.42%, respectively of pre-stimulation response (n=5). A second stimulation at 10 Hz didnot cause any further depression rather responses remainedunchanged for a further 60 min. Responses, for example, at 30and 60 min post-second stimulation remained at 64±4% and75±2%, respectively (see Fig. 5c). A repeated-measures ANOVAwas again conducted to examine the baseline period with thefinal 10 min of recording post-first stimulation and the meanresponse of the final 10 min post-second stimulation. Anoverall significant main effect was found (F=18.28, df=2,8,p<0.01), with Bonferroni post hoc tests revealing a significantdecrease in the mean fEPSP response for both the final 10 min

Fig. 5 – Effect of (a) 1 Hz, (b) 5 Hz, (c) 10 Hz, (d) 50 Hz and (e) 100 Hz stimulation on the slope of fEPSPs in the proximalCA1-MEC projection (n=6 for each frequency tested). Stimulations are given twice, the first after a 10-min baseline period andthe second 60 min post-first stimulation. The post-stimulation values are expressed as percentage of the pre-stimulationbaseline±SEM. Representative traces for baseline, post-first stimulation and post-second stimulation are located above eachfigure. (f) A line chart plotting the average mean change in fEPSP slope at each frequency for the final 10 min of recordingpost-first stimulation (black line) and post-second stimulation (dashed line).
133B R A I N R E S E A R C H 1 1 4 7 ( 2 0 0 7 ) 1 2 4 – 1 3 9

134 B R A I N R E S E A R C H 1 1 4 7 ( 2 0 0 7 ) 1 2 4 – 1 3 9
recording period post-first stimulation (t=4.449, df=4, p<0.01)and post-second stimulation compared to baseline responses(t=7.079, df=4, p=0.05). No significant differences were notedfor the two post stimulation periods (i.e. 50–60 min post-firststimulation and 50–60 min post-second stimulation, t=0.170,df=4, p>0.05).
Following 50 Hz stimulation fEPSP responses at 30 and60 min post-stimulation stood at 92.68±3.4 and 93.74±2.79%,respectively of pre-stimulation responses (n=6). A secondstimulation at 50 Hz did not change these responses.Responses at 30 and 60 min post-second stimulation stoodat 96±5% and 98±1%, respectively (see Fig. 5d). A repeated-measures ANOVA confirmed these findings with no signifi-cant differences noted between the three time periods tested(F=0.063, df=2,10, p>0.05).
Finally, following 100 Hz stimulation, long-term potentia-tion was induced. Field EPSP responses at 30 and 60 min stood124.01±3.35 and 124.7±3.02% respectively that of pre-stimula-tion responses (n=5). A second stimulation at 100 Hz seemedto enhance this potentiation further. Responses stood at 149±8% and 135±4% at 30 and 60 min post-second stimulation,respectively (Fig. 5e). A repeated-measures ANOVA found nosignificant differences between the three time periods tested(F=3.090, df=2,8, p>0.05). However, Bonferroni post hoc testsrevealed a significant increase in the mean fEPSP response forthe final 10 min recording period post-first stimulationcompared to 10 min baseline recordings (t=−2.717, df=4,p=0.05). No other differenceswere noted, due to the variabilityin responses.
Fig. 5f summaries the results described above by plottingthe average mean change in fEPSP slope at each frequency forthe final 10 min of recording post-first stimulation (black line)and post-second stimulation (dashed line). The modificationthreshold for this projection seems to occur at around 50 Hz(black line crossing x-axis). Again, to directly examine anymetaplastic effects on the proximal CA1-MEC projection wecompared the mean change in response following the secondand first frequency stimulations at each frequency tested.Using a repeated ANOVAwith TIME as thewithin-subjects andGROUP as the between-subjects measure, we found nosignificant main effect for TIME (F=0.82, df=1,21, p>0.05)suggesting thatmetaplastic effects were difficult to achieve onthis projection. We did, however, find an overall significantmain effect for GROUP (F=4.672, df=4,21, p<0.01). Subsequentpost hoc analysis revealed that response changes following100 Hz stimulation was significantly higher than thosefollowing 5 and 10 Hz. No interaction effect was revealed(F=0.905, df=4,21, p>0.05).
2.3.3. Proximal subiculum-LECA 3×5 mixed factorial ANOVA was conducted to examine theeffects of frequency stimulation and time of application ofstimulation on the plastic capabilities in the proximalsubiculum-LEC projection. TIME was again used as thewithin-subjects factor. GROUP was used as the between-subject factor. We found no overall significant main effect forTIME (F=1.563, df=2,40, p>0.05). We also did not find anoverall significant GROUP main effect (F=0.938, df=4,20,p>0.05) or a significant TIME×GROUP interaction effect(F=1.058, df=8, 40, p>0.05). However, we decided to investigate
each individual group separately to see if any differenceswould emerge at this level of analysis.
Themean slope of the fEPSP response in LEC following 1 Hzstimulation in proximal subiculum (n=5) at 30 and 60minwas86.26±1.79 and 83.36±3.19% respectively of pre-stimulationbaseline responses. A second stimulation at 1 Hz did notchange these responses (see Fig. 6a). Responses at 30 and60 min post-second stimulation stood at 80±7.6% and 87±3%,respectively (see Fig. 6a). Repeated-measuresANOVA foundnosignificant differences between the final 10 min of recordingpost-second, the final 10 min of recording post-first stimula-tion and or baseline periods (F=1.104, df=2,10, p>0.05).
Following stimulation in the proximal subiculum at 5 Hz(n=6) responses in the LEC initially decreasedbefore increasingback to baseline levels at 60 min post-stimulation. A secondstimulation at 5 Hz decreased responses further but thesegradually increased again back to baseline levels. Responses at30 and 60 min post-second 5 Hz stimulation stood at 105±2%and 112±3%, respectively (Fig. 6b). A repeated-measuresANOVA found no significant differences between the threetime periods tested (F=1.271, df=2,10, p>0.05).
Following stimulation at 10 Hz (n=5) fEPSP responses in theLEC initially decreased before increasing back to baselinelevels at 60 min post-stimulation. Responses at 30 and 60 minstood at 82±3% and 104±4%, respectively. A second stimula-tion at 10 Hz did not produce any changes in fEPSP response(Fig. 6c). A repeated-measures ANOVA again confirmed thatthere were no significant differences between the three timeperiods tested (F=0.123, df=2,8, p>0.05).
Stimulation at 50 Hz in the proximal subiculum (n=6)produced a small potentiation in fEPSP response in the LEC.Responses increased to 114±2% and 113±3% of pre-stimula-tion values at 30 and 60 min post-stimulation, respectively. Asecond stimulation at 50 Hz initially produced an increase inresponse but these decreased to levels comparable to thosepost-first stimulations (Fig. 6d). Responses at 30 and 60 minpost-second stimulation stood at 124±2% and 118±2%,respectively. Multiple comparisons revealed that the final10 min of recordings post-first 50 Hz stimulation wassignificantly higher than baseline recordings (t=−2.583, df=5,p<0.05).
Finally, a 100 Hz stimulation produced an increase in fEPSPresponse (n=4) and this response remained potentiated for atleast 60 min (t=−2.724, df=3, p<0.05). Responses at 30 and60 min post-stimulation stood at 146±7% and 125±5%,respectively. A second 100 Hz stimulation did not cause anychange in this response (t=0.126 df=3, p>0.05; see Fig. 6e).
Fig. 6f summarises the results described above by plottingthe average mean change in fEPSP slope at each frequencyfor the final 10 min of recording post-first stimulation (blackline) and post-second stimulation (dashed line). The mod-ification for this threshold was hard to determine (see blackline). Again, to examine whether the proximal subicular-LECprojection was capable of metaplastic changes, we used arepeated-measures ANOVA with TIME as the between-subjects and GROUP as the between-subjects measure; wefound no significant effect for TIME (F=0.902, df=1,20,p>0.05). No overall significant effect was found for GROUP(F=1.065, df=4,20, p<0.05) and no interaction effect wasrevealed (F=0.654, df=4,20, p>0.05). This finding would

Fig. 6 – Effect of (a) 1 Hz, (b) 5 Hz, (c) 10 Hz, (d) 50 Hz and (e) 100 Hz stimulation on the slope of fEPSPs in the proximalsubiculum-LEC projection (n=6 for each frequency tested). Stimulations are given twice, the first after a 10-min baseline periodand the second 60 min post-first stimulation. The post-stimulation values are expressed as percentage of the pre-stimulationbaseline±SEM. Representative traces for baseline, post-first stimulation and post-second stimulation are located above eachfigure. (f) A line chart plotting the average mean change in fEPSP slope at each frequency for the final 10 min of recordingpost-first stimulation (black line) and post-second stimulation (dashed line).
135B R A I N R E S E A R C H 1 1 4 7 ( 2 0 0 7 ) 1 2 4 – 1 3 9

136 B R A I N R E S E A R C H 1 1 4 7 ( 2 0 0 7 ) 1 2 4 – 1 3 9
suggest that this projection is not capable of sustainingmetaplastic effects using this experimental protocol.
3. Discussion
The results of the experiments reported here reveal importantplastic properties along the major output projections of thehippocampal formation. Previous pilot data reported by us,suggested a number of functional projections from the hippo-campal areas CA1 and the subiculum to the entorhinal cortex(Craig and Commins, 2003, 2004), here we demonstrate anddetail at least three strongly evoked projections, distal CA1-LEC,the proximal CA1-MEC and proximal subiculum-LEC projec-tions, that are organised along topographical lines. Theseprojections equate well with what is known about the anatomyof the region. It is known, for example, that projections from thecortex to the hippocampal formation are anatomically segre-gated, with the MEC receiving input from the postrhinal cortexand forming the medial perforant path into the hippocampus(Naber et al., 1997). In contrast, the LEC receives informationpredominately from the perirhinal cortex and in turn forms thelateral perforant path (Burwell et al., 1995; Burwell and Amaral,1998; McNaughton, 1980, 1982; Witter et al., 2000). Work byBenini and Avoli (2005) andmore recently by Kloosterman et al.(2003)would suggest that this segregation is alsomaintained forthe back-projections from the hippocampal formation to theentorhinal cortex. Our findings would also seem to confirmphysiologically these results and also suggest two functionallyseparate pathways from the hippocampus to the EC that wouldinclude both CA1 and subiculum to LEC in one circuit and CA1-MEC in the second.
We have recently demonstrated that the CA1-EC projectionis capable of sustaining both PPF and LTP (Craig and Commins,2005). In the series of experiments presented here, we extendthese findings by examining the plastic effects for both thedistal CA1-LEC and proximal CA1-MEC projections. We wereable to demonstrate that both projections are capable ofreadily shifting from LTD to LTP by simply varying thefrequency applied to that synapse. These results fit the BCMmodel very well and are also similar to results from previousexperiments investigating the effect of varying frequency tothe Schaffer collaterals in vitro (Dudek and Bear, 1992) and inslice cultures of rat hippocampus (Mellentin et al., 2005). Wereveal that both CA1 projections seem to showdifferent plasticcapabilities, for example, stimulation at both 50 Hz and 100 Hzshowed strong potentiation in the CA1-LEC projection,whereas 100 Hz stimulation alone produced potentiation inthe CA1-MEC projection. Whereas, stimulation at 5 Hz and10 Hz in the CA1-MEC projection produced a strong depressionof synaptic strength. In addition, dissociable short-termplasticeffects were also seen in the two CA1 projections. Facilitation,for example, in the CA1-LEC projection was immediatelyapparent at the 40 ms IPI, maximising between 60 and120 ms IPI before the facilitatory effect being lost at the480 ms IPI. In contrast to this, in the CA1-MEC projection,paired-pulse depression was observed at 40 ms IPI and as theinterval lengthened strong facilitation was revealed and thisfacilitation remained strong even at 480ms IPIwhere normallyshort-term plastic changes would not be observed (see Zucker,
1989). Further differences between the two projections wererevealed by their metaplastic capabilities. We observedmetaplastic effects in the CA1-LEC projection, whereby asecond stimulation at the same frequency produced a generalupward shift in synaptic responses (or by a leftward shift in themodification threshold) thereby allowing the synapses to bepotentiated more easily. The CA1-MEC projection, in contrast,did not demonstrate any such metaplastic capabilities. Wehave recently also demonstrated (Craig and Commins, 2006)that the subiculum-EC projection is capable of PPF, LTP andLTD. These effects were observed from recordings made inmore lateral areas of the entorhinal cortex, while stimulatingmore proximal areas of the subiculum. We also reported thatwe were unable to evoke responses from more medial regionsof the entorhinal. In the experiments presented here, weconfirm these observations by systematically examiningevoked responses in both the LEC and MEC by stimulatingproximal,medial anddistal regions of the subiculum.Weshowclearly that the response evoked in the LEC is significantlylarger when stimulating proximal subiculum compared todistal subicular stimulations. We were also unable, in theseexperiments, to evoke a measurable response in the MEC.There are a number of possible reasons for this. It is possiblethat there are much fewer neurons projecting to MEC from thesubiculum, than are projecting to LEC. The anatomical studiesthat suggest a subiculum-MEC projection, for example, didobserve much fewer labelled cells in MEC than in LEC aftersubiculum stimulation (Kloosterman et al., 2003; TamamakiandNojyo, 1995). Thus, it is possible that our electrodeswere inthe wrong area and we missed the few projecting neurons.Also, it is possible that there is no major projection from thesubiculum to MEC and that the few labelled cells observed inMEC in previous studies may have been fibres en passagebetween distal subiculum and postrhinal cortex. We alsoextend our previous findings by demonstrating that thisprojection is capable of frequency-dependent plastic changes,shifting readily from LTD to LTP. Finally we demonstrate thatthis projection at least in our hands was not capable ofmetaplastic changes. Although the proximal subiculum pro-jection to LEC does not seem to be a dynamic as the CA1projection, as evidenced by smaller magnitudes in depressionand potentiation in general and that there were no significantdifferences in the long-term responses between any of thefrequencies (see Fig. 6f). The plastic properties of the subicularprojection do share characteristics more in common with thedistal CA1-LEC projection rather than the MEC projection.Stimulations in both projections produce LTP at both 50Hz and100 Hz while, facilitation was observed in both projections at40ms IPI, maximising at 60ms IPI andwith little or no effect at480 ms IPI.
Interpretation of our results, however, should proceedwithcaution. We are unsure as to the exact nature of the evokedresponse that we have observed in the entorhinal cortex. Thepositive-going deflection observed in the majority of cases inreported experiments (and indeed, seen in our previousfindings; Craig and Commins, 2005, 2006) may be as a resultof the placement of electrodes with respect to activatedsynapses, alternatively, the positive deflectionmay be a resultof activation of local inhibitory circuits. The EC is a complexmultilayered structure with intrinsic connectivity (Burwell

137B R A I N R E S E A R C H 1 1 4 7 ( 2 0 0 7 ) 1 2 4 – 1 3 9
and Amaral, 1998) and with hippocampal projections input-ting both different layers and subdivisions of the EC, as such,the responses that we have observed most probably have amixed mechanism. Although the majority of recordings wereaimed at the deeper layers of both LEC andMEC, field potentialrecordings do not allow for precise identification of electrodeplacement sites.
Recognising the need for more detailed experimentsparticularly characterising the neuroanatomy more preciselyby using single-unit electrophysiology combinedwith cell fills,our results would putatively suggest two important circuitsfrom the hippocampal region to the entorhinal cortex, onethrough the LEC and the other through MEC. These circuitsmay convey dissociable types of information. This is observedalong the input projections where Hargreaves et al. (2005), forexample, have recently demonstrated that the spatial signalcarried by themedial projection ismuch stronger compared tothat carried by the lateral projection. In addition, our resultswould give credence to the various memory theories thatpredict that the backprojections to the cortex should bemodifiable (see Rolls, 1996). However, our results wouldsuggest that as the CA1-LEC projection and to a lesser extentthe subiculum-LEC projection are more capable of potentia-tion (requiring a lower frequency stimulation) and demon-strate metaplastic effects (in the case of CA1-LEC), that theseprojections may be more efficient in retaining informationcompared to the CA1-MEC projection.
In addition to the information processing functionsattributed to the permanent plastic changes seen in manyhippocampal synapses, permanent excitability synapticchanges may also lead to the promotion of epileptogenesis.Furthermore, it has been recently suggested that synapticstrengthening during epileptiform activity could reinforce theexcitatory network and shift the balance of excitation andinhibition towards excitation (Abegg et al., 2004). This shift ofbalance of excitation and inhibition towards excitation hasbeen used to explain how seizure foci can spread from onebrain region to another during secondary epileptogenesis(Abegg et al., 2004). Seizure foci have been shown to spreadfrom the hippocampus to cortical regions (Benini and Avoli,2005). As both CA1 and subiculum are strongly implicated intemporal lobe epilepsy (Wozny et al., 2005), their corticalprojections, may in addition to their role in informationprocessing, also provide potential routes along which seizure-like activity may propagate to parahippocampal structuresand further downstream to the neocortex. Our findings wouldsuggest that the proximal CA1-MEC projectionmight act as aninhibitory mechanism to prevent the spread of the seizure-like activity. While the distal CA1 and to a lesser extent thesubiculum-LEC projections may be more efficient in theprocessing of information, epileptiform activity may also bemore capable of being spread easier via these pathways.
In summary, we found clear dissociable effects in theplastic capabilities of the CA1-LEC and CA1-MEC projections,with the CA1-MEC projection demonstrating more depressionand a resistance to metaplastic changes. Although thesubiculum-LEC projection is not as dynamic as the CA1projections it does display some plastic properties that seemto bemore similar to the CA1-LEC projection as opposed to theCA1-MEC projection. This might suggest a functional circuit
through the LEC that is distinct from the projections that passthrough the MEC and may have important implications inboth information processing and memory research and thespread of seizure-like activity through the medial temporallobes.
4. Experimental procedures
4.1. Surgery
Adult maleWistar rats (Biomedical Facility, University CollegeDublin; weight; 250–350 g) were anaesthetised with urethane(ethyl carbamate; 1.5 g/kg i.p.) and mounted on a stereotaxicframe. A local anaesthetic/adrenaline combination (xylocaine)was injected under the scalp and an incision was made tovisualise the skull. Burr holes were made for electrode accessusing coordinates according to Paxinos and Watson (1998).Stainless bipolar stimulating electrodes (50 μm in diameter)insulated except at the tip were aimed at the CA1 andsubiculum. Stimulating electrodes were aimed at either theproximal, medial or distal CA1 (B −3.3 mm, 2.2 mm L; B −4.3,2.2 mm L and B −5.6 mm, 4.4 mm L) or proximal, medial ordistal subiculum (B −6.3 mm, 4.4 mm L, B −6.3 mm, 3.8 mm Land B −6.3 mm, 3.2 mm L, respectively; Paxinos and Watson,1998). (The areas distal and proximal CA1 refer to those areasbordering the subiculum and area CA3, respectively. Thesubiculum is likewise defined with distal and proximalsubiculum referring to the regions closest to the presubiculumand area CA1, respectively; see Witter et al., 2000 for furtheranatomical detail.) Stainless wire recording electrodes (dia-meter 50 μm) were also used. The recording electrodes wereaimed at the following coordinates: B −6.7 mm, 5.8 mm L, and6.0mmbelow the surface for LEC, andB −6.7mm, 4.2mmLand7.2mm below the surface for MEC (Paxinos andWatson, 1998).
4.2. Stimulation and data acquisition
Signals were filtered between 0.1 Hz and 1 kHz and thenamplified (DAM-50 differential amplifier, WPI, Hertfordshire,UK). Recordings were digitised online using a PC connectedto a CED-1401 plus interface (CED, Cambridge, UK).
In the first set of experiments the recording electrode wasslowly lowered towards either LEC (n=6) or MEC (n=6) andallowed to settle for 10 min. In some cases the recordingelectrode was lowered at an angle of 20° to ensure nodifferences were observed due to the oblique nature of thecortical layers in LEC (data not shown). The stimulatingelectrode was slowly lowered in 100 μm steps until theappropriate area in the proximal CA1 was reached. Fieldexcitatory postsynaptic potentials (fEPSPs) were evoked bystimulating with a square-wave (constant current pulse of0.1 ms duration at a frequency of 0.05 Hz). The intensity ofstimulus was set at a level that evoked a fEPSP slope of 55–65%of the maximum (using individually determined input-outputcurves). Following characterisation of the fEPSP in this regionthe stimulating electrode only was slowly removed and thenaimed for the medial CA1 and subsequently the distal CA1. Asimilar procedure was adopted for recordings between theproximal medial and distal subiculum and LEC (n=12) and

138 B R A I N R E S E A R C H 1 1 4 7 ( 2 0 0 7 ) 1 2 4 – 1 3 9
proximal medial and distal subiculum and MEC (n=7). For thepurpose of data analysis the field excitatory postsynapticpotential (fEPSP) slope was measured, calculated from themiddle one-thirds of the upward-going deflection of theresponse.
Following identification of the location of maximumresponses along the CA1-EC and subiculum-EC projections,three projections emerged: distal CA1-LEC, proximal CA1-MECand proximal subiculum-LEC. In a second set of experiments,short- and long-term plastic effects were then examined onthese maximal responsive projections. Stimulating andrecording electrodes were first allowed to settle for 10 min inthe appropriate areas in CA1, subiculum and EC (see above).Then PPF was attempted on each of the three projections atinter-stimulus intervals (ISIs) of 40, 60, 120, 240 and 480 ms.The PPF valuewas calculated by taking the average of six slopevalues of fEPSP1, for a given ISI, and normalising the average ofsix values for fEPSP2 with respect to this value in percentageterms (see Commins et al., 1998 for further details). Followingthis, baseline measurements were induced at a rate of 0.05 Hzfor another 10 min. Stimulus intensity during PPF and thedifferent frequency stimulations (see below) was set at base-line intensity. Changes in excitatory postsynaptic potential(EPSP) slope were assessed by measuring the slope of theresponse compared to baseline response. Induction of longer-term plastic changes in each of the three pathways (distalCA1-LEC, proximal CA1-MEC and proximal subiculum-LEC)was attempted by varying the frequency but keeping thenumber of stimuli constant (900 pulses) (n=5/6 for eachfrequency for each pathway). The frequencies used were 1, 5,10, 50 and 100 Hz. Following this, low-frequency stimulationwas then resumed at a rate of 0.05 Hz for a further 60 min. Asecond frequency stimulation (second FS) was then attemptedand after which baseline recordings were again resumed for afurther 60 min.
4.3. Histological processing
After all experiments the rats were overdosed with sodiumpentobarbitone and their brains subsequently removed. Inorder to check the positions of the electrodes the brains werefrozen in Tissue-Tek O.C.T. compound (R.A. Lamb, EastSussex, UK). 20 μm coronal slices were cut using a cryostat.Sections with electrode lesions were mounted on slides inorder to confirm electrode positioning. The sections werecounterstained with cresyl violet (Nissl) to define cytoarchi-tectonic borders and subsequently coverslipped. All electrodesites and electrode tracks were reconstructed using Paxinosand Watson atlas (Paxinos and Watson, 1998).
4.4. Ethics
All experiments were carried out in accordance with theEuropean Communities Council Directive (86/609/EEC) andwith Irish Department of Health and Children regulations.
4.5. Statistics
The data were analysed using a series of one-way ANOVAswith appropriate post hoc tests (Tukey, p<0.05). Wherever
applicable dependent t-tests or repeated-measures ANOVAsusing post hoc tests with Bonferroni correction were con-ducted. A star-based system was used: *p<0.05; **p<0.01;***p<0.001.
Acknowledgments
The authors gratefully acknowledge the support of the HealthResearch Board of Ireland. We would also like to thankProfessors Michael Rowan, Shane O'Mara (TCD) and Dr.Richard Roche (NUIM) for their helpful comments anddiscussions.
R E F E R E N C E S
Abegg, M.H., Savic, N., Ehrengruber, M.U., McKinney, R.A.,Gahwiler, B.H., 2004. Epileptiform activity in rat hippocampusstrengthens excitatory synapses. J. Physiol. 554 (2), 439–448.
Abraham, W.C., Bear, M.F., 1996. Metaplasticity: the plasticity ofsynaptic plasticity. Trends Neurosci. 19, 126–130.
Bear, M.F., Cooper, L.N., Ebner, F.F., 1987. A physiological basis for atheory of synapse modification. Science 237, 42–48.
Benini, R., Avoli, M., 2005. Rat subicular networks gatehippocampal output activity in an in vitro model of limbicseizures. J. Physiol. 566 (Pt. 3), 885–900.
Bienenstock, E.L., Cooper, L.N., Munro, P.W., 1982. Theory forthe development of neuron selectivity: orientationspecificity and binocular interaction in visual cortex.J. Neurosci. 2, 32–48.
Bliss, T.V.P., Collingridge, G.L., 1993. A synaptic model formemory: long-term potentiation in the hippocampus. Nature361, 31–39.
Bliss, T.V.P., Lomo, T., 1973. Long-lasting potentiation of synaptictransmission in the dentate area of the anaesthetised rabbitfollowing stimulation of the perforant path. J. Physiol. 232,331–356.
Burwell, R.D., Amaral, D.G., 1998. Cortical afferents of theperirhinal, postrhinal and entorhinal cortices of the rat.J. Comp. Neurol. 398, 179–205.
Burwell, R.D., Witter, M.P., Amaral, D.G., 1995. Perirhinal andpostrhinal cortices of the rat: a review of the neuroanatomicalliterature and comparison with findings from the monkeybrain. Hippocampus 5, 390–408.
Castellani, G.C., Quinlan, E.M., Cooper, L.N., Shouval, H.Z., 2001.A biophysical model of bi-directional synaptic plasticity:dependence on AMPA and NMDA receptors. Proc. Nat.Acad. Sci. 98, 12772–12777.
Cipolotti, L., Bird, C., Good, T., Macmanus, D., Rudge, P.,Shallice, T., 2006. Recollection and familiarity in densehippocampal amnesia: a case study. Neuropsychologia 44,489–506.
Commins, S., Gigg, J., Anderson, M., O’Mara, S.M., 1998. Interactionbetween paired-pulse facilitation and long-term potentiationin the projection from hippocampal area CA1 to the subiculum.NeuroReport 9, 4109–4113.
Craig, S., Commins, S., 2003. Physiological evidence for atopographical projection from the subiculum to lateralentorhinal cortex. Acta Neurobiol. Exp. 63, 87.
Craig, S., Commins, S., 2004. Physiological evidence for thetopographical nature of the output from the hippocampus tothe entorhinal cortex. FENS Abstr. 2, A120.9.
Craig, S., Commins, S., 2005. Interaction between paired-pulsefacilitation and long-term potentiation in the projection from

139B R A I N R E S E A R C H 1 1 4 7 ( 2 0 0 7 ) 1 2 4 – 1 3 9
hippocampal area CA1 to the entorhinal cortex. Neurosci. Res.53 (2), 140–146.
Craig, S., Commins, S., 2006. Short- and long-term facilitation ofsynaptic transmission in the entorhinal cortex followingstimulation in the subiculum. Behav. Brain Res. 174 (2),281–288.
Dudek, S., Bear, M., 1992. Homosynaptic long-term depression inarea CA1 of hippocampus and effects of N-methyl-D-aspartatereceptor blockade. Proc. Nat. Acad. Sci. 89, 4363–4367.
Dudek, S., Bear, M., 1993. Bidirectional long-term modificationof synaptic effectiveness in the adult and immaturehippocampus. J. Neurosci. 13, 2910–2918.
Garcia, R., 2001. Stress, hippocampal plasticity and spatiallearning. Synapse 40, 180–183.
Gisabella, B., Rowan, M.J., Anwyl, R., 2003. Mechanisms underlyingthe inhibition of long-term potentiation by preconditioningstimulation in the hippocampus in vitro. Neuroscience 121,297–305.
Hargreaves, E.L., Rao, G., Ler, I., Knierim, J.J., 2005. Majordissociation between medial and lateral entorhinal input todorsal hippocampus. Science 308, 1792–1794.
Heynen, A.J., Quinlan, E.M., Bae, D.S., Bear, M.F., 2000.Bidirectional, activity-dependent regulation of glutamatereceptors in the adult hippocampus in vivo. Neuron 28,527–536.
Jarrard, L.E., 1983. Selective hippocampal lesions and behaviour:effects of kainic acid lesions on performance of place and cuetasks. Behav. Neurosci. 97, 873–889.
Jarrard, L.E., 1993. On the role of the hippocampus in learning andmemory in the rat. Behav. Neural Biol. 60, 9–26.
Katz, B., Miledi, R., 1970. Further study of the role of calcium insynaptic transmission. J. Physiol. 207, 789–801.
Kloosterman, F., Witter, M.P., van Haeften, T., 2003. Topographicaland laminar organization of subicular projections to theparahippocampal region of the rat. J. Comp. Neurol. 455,156–171.
Martin, S.J., Grimwood, P.D., Morris, R.G.M., 2000. Synapticplasticity and memory: an evaluation of the hypothesis. Annu.Rev. Neurosci. 23, 649–711.
Mellentin, C., Moller, M., Jahnsen, H., 2005. Properties of long-termsynaptic plasticity and metaplasticity in organotypic slicecultures of rat hippocampus. Exp. Brain Res. 1–10.
McNaughton, B.L., 1980. Evidence for two physiologically distinctperforant pathways to the fascia dentate. Brain Res. 199, 1–19.
McNaughton, B.L., 1982. Long-term synaptic enhancementand short-term potentiation in rat fascia dentata actthrough different mechanisms. J. Physiol. (London) 324,249–262.
Nadel, L., Moscovitch, M., 1997. Memory consolidation, retrogradeamnesia and the hippocampal complex. Curr. Opin. Neurobiol.7, 217–227.
Naber, P.A., Caballero-Bleda, M., Jorritsma-Byham, B., Witter, M.P.,1997. Parallel input to the hippocampal memory systemthrough peri- and postrhinal cortices. NeuroReport 8,2617–2621.
Ogden, J.A., Corkin, S., 1991. Memories of H.M. In: Abraham, W.C.,Corballis, M.C., White, K.G. (Eds.), Memory Mechanisms.Lawrence Erlbaum Associated, Hillsdale, N.J.
Paxinos, G., Watson, C., 1998. The Rat Brain in StereotaxicCoordinates. Academic Press, San Diego.
Rolls, E.T., 1996. A theory of hippocampal function in memory.Hippocampus 6, 601–620.
Schacter, D.L., Wagner, A.D., 1999. Medial temporal lobeactivations in fMRI and PET studies of episodic encoding andretrieval. Hippocampus 9 (1), 7–24.
Scoville, W.B., Milner, B., 1957. Loss of recent memory afterbilateral hippocampal lesions. J. Neurol., Neurosurg. Psychiatry20, 11–21.
Squire, L.R., 1992. Memory and the hippocampus: a synthesis fromfindings with rats, monkeys, and humans. Psychol. Rev. 99 (2),195–231.
Tamamaki, N., Nojyo, Y., 1995. Preservation of topography in theconnections between the subiculum, field CA1 and theentorhinal cortex in rats. J. Comp. Neurol. 353, 379–390.
Thomsom, A.M., 2000. Facilitation, augmentation andpotentiation at central synapses. Trends Neurosci. 23, 305–312.
Van Dam, E.J.M., Kamal, A., Artola, A., de Graan, P.N.E., HendrikGispen, W., Ramakers, G.M.J., 2004. Group I metabotropicglutamate receptors regulate the frequency-response functionof hippocampal CA1 synapses for the induction of LTP andLTD. Eur. J. Neurosci. 19, 112–118.
Witter, M.P., Naber, P.A., van Haeften, T., Machielsen, W.C.M.,Rombouts, S.A.R.B., Barkhof, F., Scheltens, P., Lopes da Silva,F.H., 2000. Cortico-hippocampal communication by way ofparallel parahippocampal-subicular pathways. Hippocampus10, 398–410.
Wozny, C., Knopp, A., Lehmann, T.N., Heinemann, U., Behr, J.,2005. The subiculum: a potential site of ictogenesis in humantemporal lobe epilepsy. Epilepsia 46 (5), 17–21.
Wu, J., Rowan, M., Anwyl, R., 2004. Synaptically stimulatedinduction of group I metabatropic glutamatereceptor-dependent long-term depression and depotentiationis inhibited by prior activation of metabotropic glutamatereceptors and protein kinase C. Neuroscience 123, 507–514.
Zucker, R.S., 1989. Short-term synaptic plasticity. Annu. Rev.Neurosci. 12, 13–31.