Embed Size (px)
Citation preview

DOCTORA L T H E S I S
Luleå University of TechnologyDepartment of Civil, Mining and Environmental Engineering
Division of Structural Engineering - Steel Structures
2007:31|: 102-15|: - -- 07⁄31 --
2007:31
Plate Buckling Resistance Patch Loading of Longitudinally Stiffened Webs and Local Buckling
Mattias Clarin


Doctoral Thesis 2007:31
Plate Buckling Resistance- Patch Loading of Longitudinally Stiffened Webs and Local Buckling -
Mattias Clarin
Luleå University of TechnologyDept. of Civil, Mining and Environmental Engineering
Division of Structural Engineering - Steel StructuresLuleå, August 2007


Preface
I
Preface
A couple of weeks ago, I spent some time in contemplation over how different time may be experienced. More than five years have passed since the 1st of April 2002 which was the day I took my first tremulous steps towards this thesis. That I actually was moving towards writing a doctoral thesis wasn’t that obvious during that day, neither during many of the days to follow. Nevertheless, that day was the beginning of a period which has contained so many things. A period which will be ended by this thesis. Five years are a short period in some senses, a verylong in others. Isn’t it strange that end and beginning can be so close in some ways, distant in others? Just as a reminder, this preface is a beginning, a beginning of an end which in fact this thesis is...
During this period in my life, I have been fortunate to be aided by my supervisor Professor Ove Lagerqvist. From the earlier days mainly investigating residual stresses and local buckling to patch loading resistance in the end, your experience and knowledge in the field has been invaluable. Though, working with you has also brought many memorable times regarding other things. Reflecting over music, books and other small and large things in life has been delightful. I thank you not only for drafting me to the Division of Steel Structures in my beginning, but also for your time, support and friendship!
The first three years of the work resulting in this thesis I was favoured to get great assistance by Dr. Eva Pètursson. As co-supervisor Eva was reading, correcting and questioning but maybe more important, supporting and encouraging. When Eva engaged in new challenges outside the university I was fortunate to get a strong “substitute” on the co-supervisor position; Professor Bernt Johansson. Using his vast knowledge, calmly explaining and answering my questions has been the very best support a Ph.D. aspirant can get. I thank you both and I am truly grateful for assisting me during this period!
As always, research is maybe not impossible, though difficult to conduct without financial support. The financial aid provided by Luleå University of Technology (LTU) and by RFCS - Research Fund for Coal and Steel within the frame of the two projects LiftHigh - Efficient

II
Lifting Equipment with Extra High Strength Steel and ComBri - Competitive Steel and Composite Bridges by Improved Steel Plated Structures are gratefully acknowledged.
I am also very grateful for the friendly support and help given the staff at Complab which have helped out with huge effort during the experimental work. Special gratitude is paid towards Lars Åström, Georg Danielsson and Claes Fahlesson for aid during the all the tests!
The immensely friendly and warm atmosphere at the Division of Structural Engineering has been a great aid in the days starting not that productive. This especially regarding the research group for Steel Structures with which I have shared many good times. Supporting late night and week-end workers, coffee breaks, research discussions; the memorable occasions are so many... I have enjoyed the period with you and will miss you all!
I can hardly imagine how this period would have been without my companion Jonas Gozzi. Much has been going on during these years, work- and otherwise. The former stretch from the beginning of office and computer sharing, via doctoral courses, laboratory work and assisting guests researchers to the thesis discussions in the end. The latter stretches over an even wider spectra of events; caravan customizing, skiing, transparent toilet doors, Sarek, the queues of China, popcorn dinners and much much more. It has been a pure pleasure my friend!
Nonetheless, nothing of this would have been possible without the support, understanding and love of my cherished Annica.You kept encouraging me with your hearty laughter and glowing and kind spirit regardless how messy and absent-minded I was. As much as this is the beginning of the end of this period, the end is the beginning of a new period for us. At the same place, at the same time, how sweet it will be!
Consequently, all periods come to an end, also prefaces... However, this preface was just the beginning of an end. Though, an end which is the beginning of something yet not written. Ergo, time is a strange thing. Occasionally slow moving, usually fast. Aye, plainly strange it is...
Luleå, 25th of August, 2007
Mattias Clarin

Abstract
III
Abstract
Incremental launching of steel bridges is a demanding undertaking, on the erection site as well as on the designers desk. Not seldom, the structure itself is during the launching subjected to high concentrated forces on the lower flange when passing over a launching shoe or an intermediate support (e.g. column). These concentrated forces, commonly referred to as patch loads, may be of such magnitude that it governs the thickness of the web in the bridge girder. Though, a small increase in web thickness leads to a substantial gain of steel weight of the bridge. Hence also a higher material cost.
One solution to this problem is to increase the buckling resistance of the web with the use of a longitudinal stiffener of open (a plate) or closed type (closed profile of e.g. V-shape). The improved patch load resistance is in the european design code EN 1993-1-5 nowadays determined with the help of the yield resistance for the web and contributing parts of the loaded flange reduced with a factor dependent of the slenderness of the web and the influence of one or more longitudinal stiffeners. Parts in the expression for the yield resistance and the reduction factor have been somewhat questioned and over the years a substantial amount of tests and FE simulations of longitudinally stiffened webs has been carried out. This research work has produced a large amount of test data which has been used herein to further improve the prediction of the patch load resistance of longitudinally stiffened steel girder webs.
Based on the use of the gathered test data from the literature and previously done research, a calibrated patch load resistance function was developed for both open and closed longitudinal stiffeners. Furthermore, a partial safety factor for the proposal was determined according to the guidelines in EN 1990 (2002). In all, the proposal was shown to clearly improve the accuracy of resistance prediction when compared to other resistance models as well as the EN 1993-1-5.
Another questioned part in the commonly used design codes is the reduction function regarding local buckling under uniform in-plane compression. The nowadays used function (the Winter function) has been developed during the 1930’ies and was based on tests on cold formed specimens. This reduction function has been criticized as being too optimistic regarding plates with large welds. A series of tests on welded specimens made of high strength steel with large
IV
welds was conducted to investigate the aforementioned concerns. Along with test data found in literature survey, the Winter function was proven to be too optimistic regarding these heavily welded plates. A new reduction function, based on the test data, was proposed and validated through a comparison with the available experimental results.

Notations & Symbols
V
Notations & Symbols
The notations and symbols used in this thesis are described within this chapter. The notations and symbols are listed in alphabetical order, roman and greek respectively.
Roman notations and symbolsa - Weld size, numerical coefficient or panel length
A - Area
A5 - Elongation measurement, 5%
Afl - Area of flange
Aw - Area of web
b - Correction factor
b - Width of plate
b1 - Depth / Height of upper panel
beff - Effective width
bf - Width of flange
bst - Width of longitudinal stiffener
cu - Half the length in the web which resists the applied force
Co - Parameter used for calculating the buckling coefficient of alongitudinally stiffened web
d - Plate thickness
D - Flexural plate rigidity

VI
E - Modulus of elasticity, Youngs modulus
fu - Ultimate tensile strength
fue - Ultimate strength, electrode
fyk - Characteristic value of yield strength
fy - Yield strength
fye - Yield strength, electrode
fyf - Yield strength of flange
fyw - Yield strength of web
F - Force
Fcr - Elastic critical buckling load
Fcr1 - Elastic critical buckling load for the upper (directly loaded) panel,patch loading
Fcr2 - Elastic critical buckling load for the whole web panel, patchloading
Fexp - Ultimate load from tests
FE - Applied transverse load
FR - Predicted load resistance
FRd - Design resistance
FRl - Predicted resistance for a longitudinally stiffened web accordingto an amplification factor model
Fu - Ultimate resistance
Fy - Yield resistance
grt(X) - Resistance function of basic variables in design model
h - Height / length of plate in specimen
h1 - Distance between upper flange and centre of gravity oflongitudinal stiffener
hst,o - Depth / Height of closed stiffener, outer dimension

Notations & Symbols
VII
hst,w - Depth / Height of closed stiffener, dimension closest to web
hw - Depth / Height of web
If - Moment of inertia, flange
Ist - Moment of inertia, longitudinal stiffener
k - Coefficient
kc - Error term
kcr - Buckling load coefficient
kd,n - Design fractile factor
kF - Buckling load coefficient, patch loading
kF1 - Buckling load coefficient for the upper (directly loaded) panel,patch loading
kF2 - Buckling load coefficient for the whole web panel, patchloading
kn - Characteristic fractile factor
ksl - Buckling load coefficient addition for a longitudinally stiffenedweb
k - Buckling load coefficient according to EN 1993-1-5
L - Plate length
m, n - Number of half waves over plate
ME - Applied bending moment
Mi - Plastic moment resistance, inner plastic hinge in flange
Mo - Plastic moment resistance, outer plastic hinge in flange
Mpf - Plastic moment resistance, flange
Mpw - Plastic moment resistance, web
MR - Bending moment resistance according to EN 1993-1-5
N - Normal force

VIII
Ncr - Critical load
Nel - Buckling load
Nx, Ny - Normal forces per unit distance
Nxy - Shearing force per unit distance
r - Value of resistance
rd - Design value of the resistance
re - Experimental resistance
rk - Characteristic resistance value
rm - Predicted resistance by the resistance function using the meanvalues of basic variables, i.e. grt(Xm)
rn - Nominal resistance value
rt - Resistance predicted by the resistance function grt(X)
Rm - Ultimate resistance
Rp0.2 - 0,2% Proof stress
s - Standard deviation
ss - Loaded length
sy - Distance between plastic hinges in loaded flange
t - Thickness
tf - Thickness of flange
ti - Flange thickness, idealized
tst - Thickness of longitudinal stiffener
tw - Thickness of web
T - External work
U - Internal work
V - Coefficient of variation of the error term

Notations & Symbols
IX
Vfy - Coefficient of variation of the yield resistance
Vrt - Coefficient of variation of the resistance function
w - Amplitude of lateral deflection
wo - Initial amplitude of lateral deflection
W - Section modulus
Weff - Effective section modulus according to EN 1993-1-5
x, y, z - Cartesian coordinates
X - Array of j basic variables X1, ..., Xj
Xm - Mean value of the basic variable
Greek notations and symbols
- Angle
- Distance between yield lines in web
, F - Imperfection factor, reduction function
- Distance between plastic hinges
- Boundary condition dependent parameter
M - Partial factor for resistance
M* - Corrected partial factor for resistance
M1 - Partial factor for members susceptible to instability
st - Relative flexural rigidity of longitudinal stiffener
st,t - Relative flexural transition rigidity of longitudinal stiffener
- Error term or deformation
w - In-plane deformation of web
- Logarithm of the error term
- Strain or Material depentent parameter
- Correction factor for bending moment or imperfection factor

X
- Angle defining deformation of web with yield lines
0, 0F - Plateau length, reduction function
F - Plate slendernes parameter, patch loading
P - Plate slendernes parameter, local buckling
- Poisson’s ratio, = 0,3 if nothing else is stated
- Stress
c , rc - Compressive residual stress
cr - Critical stress
max - Maximum stress
min - Minimum stress
r - Residual stress
rs - Residual stress
u - Ultimate stress
w - Stress in web
x - Normal stress
st - Relative torsional rigidity of longitudinal stiffener
- Reduction factor
F - Reduction factor, patch loading
P - Reduction factor, local buckling
- Stress ratio
Throughout the thesis mean values are marked overlined, e.g. fy represents the mean yield strength.

Table of Contents
XI
Table of Contents
Preface . . . . . . . . . . . . . . . . . . . . . . . . . . . . . . . . . . . . . . . . I
Abstract . . . . . . . . . . . . . . . . . . . . . . . . . . . . . . . . . . . . . . III
Notations & Symbols . . . . . . . . . . . . . . . . . . . . . . . . . . . . . . V
Chapter 1: Introduction . . . . . . . . . . . . . . . . . . . . . . . . . . . . 1 1.1 Local buckling . . . . . . . . . . . . . . . . . . . . . . . . . . . . . . . . . . . . . . . 2
1.2 Patch loading . . . . . . . . . . . . . . . . . . . . . . . . . . . . . . . . . . . . . . . . 3
1.3 Purpose and Aim . . . . . . . . . . . . . . . . . . . . . . . . . . . . . . . . . . . . . 4
1.4 Limitations . . . . . . . . . . . . . . . . . . . . . . . . . . . . . . . . . . . . . . . . . . 5
1.5 Basic concepts . . . . . . . . . . . . . . . . . . . . . . . . . . . . . . . . . . . . . . . 5 1.5.1 Effective cross-section of longitudinal stiffeners . . . . . . . . . . . . . . . . . . . . 5 1.5.2 Bending resistance . . . . . . . . . . . . . . . . . . . . . . . . . . . . . . . . . . . . . . . . . 7
1.6 Disposition of the thesis . . . . . . . . . . . . . . . . . . . . . . . . . . . . . . . . 7
Chapter 2: Plate Buckling - Theory . . . . . . . . . . . . . . . . . . . . 9 2.1 Plate buckling theory . . . . . . . . . . . . . . . . . . . . . . . . . . . . . . . . . 11
2.1.1 Elastic analysis / Calculation of critical load . . . . . . . . . . . . . . . . . . . . . . 11 2.1.2 Simply supported plates under uniform compression. . . . . . . . . . . . . . . . 13 2.1.3 Initial plate imperfections . . . . . . . . . . . . . . . . . . . . . . . . . . . . . . . . . . . 16 2.1.4 Geometric imperfections. . . . . . . . . . . . . . . . . . . . . . . . . . . . . . . . . . . . 17 2.1.5 Residual stresses . . . . . . . . . . . . . . . . . . . . . . . . . . . . . . . . . . . . . . . . . . 18
2.2 The effective width concept . . . . . . . . . . . . . . . . . . . . . . . . . . . . 19 2.2.1 The von Kármán effective-width formula . . . . . . . . . . . . . . . . . . . . . . . 19 2.2.2 The Winter function . . . . . . . . . . . . . . . . . . . . . . . . . . . . . . . . . . . . . . 21
2.3 Patch loading . . . . . . . . . . . . . . . . . . . . . . . . . . . . . . . . . . . . . . . 23 2.3.1 Resistance for girders without longitudinal stiffeners. . . . . . . . . . . . . . . . 24 2.3.2 Resistance for girders with longitudinal stiffeners . . . . . . . . . . . . . . . . . . 33 2.3.3 Interaction with bending. . . . . . . . . . . . . . . . . . . . . . . . . . . . . . . . . . . . 43
2.4 Summary of the theoretical review . . . . . . . . . . . . . . . . . . . . . . . 44
Chapter 3: Patch Loading - Test Results . . . . . . . . . . . . . . . . 45

XII
3.1 Patch loading experiments on longitudinally stiffened girders . . . . 46 3.1.1 Rockey et. al (1978) . . . . . . . . . . . . . . . . . . . . . . . . . . . . . . . . . . . . . . . 46 3.1.2 Bergfelt (1979) . . . . . . . . . . . . . . . . . . . . . . . . . . . . . . . . . . . . . . . . . . . 48 3.1.3 Bergfelt (1983) . . . . . . . . . . . . . . . . . . . . . . . . . . . . . . . . . . . . . . . . . . . 49 3.1.4 Galea et. al (1987) . . . . . . . . . . . . . . . . . . . . . . . . . . . . . . . . . . . . . . . . . 50 3.1.5 Shimizu et. al (1987) . . . . . . . . . . . . . . . . . . . . . . . . . . . . . . . . . . . . . . . 51 3.1.6 Janus et. al (1988) . . . . . . . . . . . . . . . . . . . . . . . . . . . . . . . . . . . . . . . . . 53 3.1.7 Dubas and Tschamper (1990). . . . . . . . . . . . . . . . . . . . . . . . . . . . . . . . . 54 3.1.8 Dogaki et. al (1990). . . . . . . . . . . . . . . . . . . . . . . . . . . . . . . . . . . . . . . . 55 3.1.9 Carretero and Lebet (1998) . . . . . . . . . . . . . . . . . . . . . . . . . . . . . . . . . . 57 3.1.10 Walbridge and Lebet (2001) . . . . . . . . . . . . . . . . . . . . . . . . . . . . . . . . . 58 3.1.11 Kuhlmann and Seitz (2004) . . . . . . . . . . . . . . . . . . . . . . . . . . . . . . . . . 59
3.2 Numerical simulations . . . . . . . . . . . . . . . . . . . . . . . . . . . . . . . . 61 3.2.1 Davaine (2005) . . . . . . . . . . . . . . . . . . . . . . . . . . . . . . . . . . . . . . . . . . . 61
3.3 Summary of the experimental review . . . . . . . . . . . . . . . . . . . . . 62
Chapter 4: Patch Loading - Design Proposal . . . . . . . . . . . . . 65 4.1 Yield resistance . . . . . . . . . . . . . . . . . . . . . . . . . . . . . . . . . . . . . 65
4.2 Elastic critical load . . . . . . . . . . . . . . . . . . . . . . . . . . . . . . . . . . . 66
4.3 Reduction function . . . . . . . . . . . . . . . . . . . . . . . . . . . . . . . . . . 67
4.4 Proposal of design approach . . . . . . . . . . . . . . . . . . . . . . . . . . . . 68
4.5 Validation of the design proposal. . . . . . . . . . . . . . . . . . . . . . . . . 70
4.6 Comparison with other models . . . . . . . . . . . . . . . . . . . . . . . . . . 74
4.7 Interaction with bending moment . . . . . . . . . . . . . . . . . . . . . . . . 75
4.8 Summary of the proposed design procedure. . . . . . . . . . . . . . . . . 77
4.9 Concluding remarks . . . . . . . . . . . . . . . . . . . . . . . . . . . . . . . . . . 79
Chapter 5: Local Buckling - Test Results . . . . . . . . . . . . . . . . 83 5.1 Nishino et. al (1967). . . . . . . . . . . . . . . . . . . . . . . . . . . . . . . . . . 83
5.1.1 Test Setup. . . . . . . . . . . . . . . . . . . . . . . . . . . . . . . . . . . . . . . . . . . . . . . 84 5.1.2 Test results and conclusions . . . . . . . . . . . . . . . . . . . . . . . . . . . . . . . . . . 84
5.2 Dwight et. al (1968) . . . . . . . . . . . . . . . . . . . . . . . . . . . . . . . . . . 85 5.2.1 Conclusions . . . . . . . . . . . . . . . . . . . . . . . . . . . . . . . . . . . . . . . . . . . . . 86
5.3 Dwight and Moxham (1969). . . . . . . . . . . . . . . . . . . . . . . . . . . . 86 5.3.1 Tests made by J.D. Harrison . . . . . . . . . . . . . . . . . . . . . . . . . . . . . . . . . 86 5.3.2 Tests made by K.E. Moxham. . . . . . . . . . . . . . . . . . . . . . . . . . . . . . . . . 87 5.3.3 Conclusions . . . . . . . . . . . . . . . . . . . . . . . . . . . . . . . . . . . . . . . . . . . . . 87
5.4 Fukumoto and Itoh (1984) . . . . . . . . . . . . . . . . . . . . . . . . . . . . . 88
5.5 Rasmussen and Hancock (1992) . . . . . . . . . . . . . . . . . . . . . . . . . 89 5.5.1 Test setup . . . . . . . . . . . . . . . . . . . . . . . . . . . . . . . . . . . . . . . . . . . . . . . 90 5.5.2 Residual stress measurement . . . . . . . . . . . . . . . . . . . . . . . . . . . . . . . . . 90 5.5.3 Test results and conclusions . . . . . . . . . . . . . . . . . . . . . . . . . . . . . . . . . . 91
5.6 Möller and Johansson (1995). . . . . . . . . . . . . . . . . . . . . . . . . . . . 92

Table of Contents
XIII
5.6.1 Test setup . . . . . . . . . . . . . . . . . . . . . . . . . . . . . . . . . . . . . . . . . . . . . . 92 5.6.2 Test results and conclusions. . . . . . . . . . . . . . . . . . . . . . . . . . . . . . . . . . 93
5.7 Concluding remarks . . . . . . . . . . . . . . . . . . . . . . . . . . . . . . . . . . 93
Chapter 6: Local Buckling - Experimental Work . . . . . . . . . . 95 6.1 Background . . . . . . . . . . . . . . . . . . . . . . . . . . . . . . . . . . . . . . . . 95
6.2 Experimental investigation . . . . . . . . . . . . . . . . . . . . . . . . . . . . . 95
6.3 Uniaxial tests . . . . . . . . . . . . . . . . . . . . . . . . . . . . . . . . . . . . . . . 96 6.3.1 Specimens . . . . . . . . . . . . . . . . . . . . . . . . . . . . . . . . . . . . . . . . . . . . . . 96 6.3.2 Test setup . . . . . . . . . . . . . . . . . . . . . . . . . . . . . . . . . . . . . . . . . . . . . . 97 6.3.3 Test results . . . . . . . . . . . . . . . . . . . . . . . . . . . . . . . . . . . . . . . . . . . . . . 97
6.4 Buckling tests . . . . . . . . . . . . . . . . . . . . . . . . . . . . . . . . . . . . . . . 98 6.4.1 Specimens . . . . . . . . . . . . . . . . . . . . . . . . . . . . . . . . . . . . . . . . . . . . . . 98 6.4.2 Test setup . . . . . . . . . . . . . . . . . . . . . . . . . . . . . . . . . . . . . . . . . . . . . .100 6.4.3 Measurements . . . . . . . . . . . . . . . . . . . . . . . . . . . . . . . . . . . . . . . . . . .101 6.4.4 Results. . . . . . . . . . . . . . . . . . . . . . . . . . . . . . . . . . . . . . . . . . . . . . . . .102
6.5 Test evaluation . . . . . . . . . . . . . . . . . . . . . . . . . . . . . . . . . . . . . 103
6.6 Concluding remarks . . . . . . . . . . . . . . . . . . . . . . . . . . . . . . . . . 105
Chapter 7: Local Buckling - Design Proposal . . . . . . . . . . . . . 107 7.1 Background . . . . . . . . . . . . . . . . . . . . . . . . . . . . . . . . . . . . . . . 107
7.2 Proposal and validation of new reduction function . . . . . . . . . . . 108
7.3 Concluding remarks . . . . . . . . . . . . . . . . . . . . . . . . . . . . . . . . . 110
Chapter 8: Discussion and Conclusions . . . . . . . . . . . . . . . . . 113 8.1 Patch loading - Discussion. . . . . . . . . . . . . . . . . . . . . . . . . . . . . 113
8.2 Local buckling - Discussion. . . . . . . . . . . . . . . . . . . . . . . . . . . . 114
8.3 Conclusions . . . . . . . . . . . . . . . . . . . . . . . . . . . . . . . . . . . . . . . 116
8.4 Proposals for future work . . . . . . . . . . . . . . . . . . . . . . . . . . . . . 117
Chapter 9: References . . . . . . . . . . . . . . . . . . . . . . . . . . . . . 119
APPENDIX A: Patch Loading - Specimen Data. . . . . . . . . . . . . 125
APPENDIX B: Patch Loading - Further Evaluation . . . . . . . . . . 143
APPENDIX C: Local Buckling - Further Evaluation . . . . . . . . . . 163

XIV

Introduction
1
Chapter 1:
Introduction
The civil engineering of today is a demanding undertaking. A structural designer has not only to guarantee that the structure to be built is safe to use, but also take economical, environmental and architectural aspects into account. A part of this work is to decide what material to use, e.g. a materially homogeneous composed structure or a composite creation? The early civil engineers often used what was nearby, usually stone or timber. Today there are a multitude of different materials available on the market. Concrete, timber, fibre reinforced polymers, glass and steel are all examples of materials used in civil structures today.
When the structural steel entered the market, the civil engineers were provided with a possibility to design more slender structures than before. However, making the structural members more slender in order to minimize the use of material (dead weight and economy) the designers also had to pay an increased attention to possible buckling related issues.
The designer has a couple of tools to use to make their structure as perfect as possible with respect to the aspects of safety, economy, architecture and environment. The material was one example of these, another is the design regulations which is a way for the designer to ensure the safety of the structure. However, the design codes available for the designer has to be applicable with respect to not only safety (yet being economically efficient), but also be kept up to date with respect to advances by the steel industry and the production methods of civil structures. Developing and up-dating the design codes are usually some of the work a structural researcher is facing, e.g. through European research projects.
The work presented within this thesis is an example of some of the outcome of such projects. The two RFCS (Research Fund for Coal and Steel) sponsored research projects LiftHigh -“Efficient Lifting Equipment with Extra High Strength Steel” and ComBri - “Competitive Steel and Composite Bridges by Improved Steel Plated Structures” were the frame within which the herein presented research work was conducted.
The project LiftHigh was initiated in 2002 and under three years an investigation of how using steels with a higher strength than commonly used (e.g. fy > 600 MPa) could benefit the

2
crane industry was carried out. This with respect to an increased lifting capacity and / or a reduced dead weight of the products. The work in this thesis focused on investigating the resistance of plates subjected to uniformly distributed compressive stresses, referred to as local buckling, was conducted as a part of the LiftHigh project.
The other part of this thesis, focusing on the resistance of longitudinally stiffened plates subjected to in-plane local compressive loads, referred to as patch loading, was conducted as a part of the ComBri project. The ComBri project was a three year research activity, started in 2003. The main objectives of the research work was to promote the use of steel plated structures mainly in bridge applications and to further improve the cross-sections of steel in both composite and pure steel bridges. This with respect to design with respect to both final and erection state.
1.1. Local bucklingAs mentioned earlier, designing a structure of steel often includes slender members / cross-
sections which have to be treated safely and properly with respect to possible buckling phenomena. Even though the presented work within this thesis only comprises plates subjected to uniformly distributed compressive in-plane stresses, buckling of a plate is not out of consideration if the stresses differ from being evenly distributed. Applying bending moments and shear stresses also induces in-plane stresses, i.e. plate buckling has to be considered.
In the European design regulation used for design of plated steel structural elements, EN 1993-1-5, the method of taking local buckling into account is based on the effective width concept, originated from the work of Theodor von Kármán and his colleagues in the 1930’ies. Though, original concept by von Kármán was refined in the years to follow and in the end of the 1940’ies George Winter presented a modified version of the effective width concept. The work by Winter ended up in a reduction function validated with respect to a large quantity of experiments, i.e. on plates with imperfections. This was the major difference between the work of von Kármán and Winter, the former was derived with respect to a perfect plate without any imperfections. However, the tests conducted by Winter only comprised cold-formed plates which imperfection wise often differs from corresponding welded plates.
A number of researchers world-wide have since then performed investigations to investigate if the ultimate resistance of welded plates is the same as the cold formed plates of Winter, i.e. the Winter reduction function. However, many of these tests presented in e.g. Nishino et. al (1967), Dwight et. al (1968), Fukumoto and Itoh (1984) showed that the Winter function tends to overestimate the ultimate resistance of more slender welded plates. Furthermore, other researchers, e.g. Veljkovic and Johansson (2001) has by numerical simulations shown that the Winter function is more suitable to use for plates without residual stresses, i.e. not in as-welded condition. Though the Winter function is still used in the EN 1993-1-5 to estimate the buckling resistance of both cold-formed and welded plates under in-plane compression.

Introduction
3
1.2. Patch loadingAnother type of plate buckling frequently encountered in practice, is buckling of a girder web
subjected to a locally applied in-plane compressive load. Local in the sense of not being distributed over the whole width of the plate, in this case the girder web. Examples of when this load case may occur may be found in numerous structural applications, e.g. wheel loads on gantry girders, purlins on main frame structures, crane girders and as in line with the focus of the ComBri project, during launching of bridge girders.
Emphasizing that steel structures usually are made slender on economical basis, the reader understands in which manner a modern steel bridge, composite or pure steel, is designed. The common way to ensure that the buckling resistance of a slender bridge girder web are sufficient, may be either to increase the web thickness of web or by using stiffeners. The choice is in most cases based on total economy, e.g. labour costs for the extra welding needed to reinforce the web with a stiffener versus the cost for increasing the web thickness. However, vertical stiffeners are commonly used to resist the static support reactions (patch loading) from dead weight of the bridge and external loads in the final state. Though, when constructing a large bridge, the common erection procedure is to incrementally launch the bridge in place. The bridge girders are assembled at one end and pushed out over the intermediate supports along the span of the bridge.
When a bridge girder is launched, the support reactions is not statically applied as in the final state, but is moving along the span of the bridge. Thus, the support reactions is not possible to manage using vertical stiffeners. Furthermore, since the bridge girder will be supported as a console beam during most of the launching, large bending moments are added to the patch loading. For girders with a depth up to approximately 3 m, the buckling resistance is commonly ensured increasing the web thickness. However, regarding deeper cross-sections and larger spans, the bending moments may increase in such an extent that the most efficient way to guarantee the buckling resistance of the web is to reinforce the web by one or several longitudinal stiffeners. Reinforcing a girder web with longitudinal stiffeners not only increases the bending resistance but has also as shown by many researchers a beneficial effect on the patch loading resistance, e.g. Rockey et. al (1978), Bergfelt (1979) and Janus et. al (1988).
The ultimate patch loading resistance of an unstiffened steel girder web has over the years been quite thoroughly investigated. One of the more recent and acknowledged publications was Lagerqvist (1994) which also was implemented as the patch loading rules of EN 1993-1-5. However, parts of the existing rules in EN 1993-1-5 has been questioned, and with Gozzi (2007) a refined proposal for the patch loading resistance was presented and validated.
Regarding the ultimate patch loading resistance for longitudinally stiffened girder webs publications as Graciano (2002), Seitz (2005) and Davaine (2005) are examples of work focused on improving the prediction models regarding the failure mode. In EN 1993-1-5 the patch loading resistance for a longitudinally stiffened web is predicted using a model presented

4
in Graciano (2002). However, the prediction model in EN 1993-1-5 treats open and closed section stiffeners in the same way, furthermore the model was based on the theory for unstiffened webs. Hence, inherited the criticized part of the resistance model of Lagerqvist (1994).
1.3. Purpose and AimAs previously mentioned, the work presented within this thesis has been divided into two
parts, one considering patch loading of a girder web reinforced with a longitudinal stiffener and one focusing on plate buckling under uniformly distributed compression. Therefore, this section was also sub-divided into parts comprising the purposes and aims for the two research areas respectively.
The purpose of the work presented within this thesis regarding the ultimate patch loading resistance was to
• Investigate if an ultimate patch loading resistance method for girder webs reinforced with one longitudinal stiffener, consistent with the proposal of Gozzi (2007) regarding unstiffened webs, could be stated.
• Examine if webs stiffened with closed section stiffeners could safely be designed in the same manners as open section stiffeners with respect to the patch loading resistance.
The work focusing on buckling resistance of plates with welds subjected to uniformly distributed compressive in-plane stresses was conducted with the purpose of
• Produce experimental results using specimens made of steel with a higher strength than commonly used in civil engineering today.
• Examine if steels with higher strength may be considered in the same manners as more commonly used structural steels with respect to the ultimate plate buckling resistance.
• Examine if the Winter function used in EN 1993-1-5 is applicable regarding plates joined by welding.
The aim of this thesis was, regarding both the patch loading resistance and local buckling resistance, to if possible
• Propose and validate an efficient and safe design procedure, improving the prediction of the ultimate resistance in comparison to EN 1993-1-5 and previously presented research work.

Introduction
5
1.4. LimitationsRegarding the patch loading investigation the following limitations were imposed:
• The experimental results gathered from the literature comprises only plate I-girders subjected to patch loading (one local load). Opposite or end patch loading was not considered.
• The investigation presented herein only considers the patch loading resistance of a web reinforced with one longitudinal stiffener of open or closed type.
• Possible interaction phenomena was only investigated with respect to bending moment, e.g. shear / patch loading interaction was not considered.
Regarding the local buckling investigation the following limitations were introduced:
• The gathered data from the literature only comprises plate specimens with a square cross-section under uniaxial compression, i.e. the individual plates were all treated as simply supported internal compression elements.
Further, the following limitations was common for both the patch loading and the local buckling investigation:
• The gathered data, as well as the experimental work conducted, only comprised structural steel, i.e. no tests or specimens made of stainless steel were considered herein.
• All experimental results gathered from the literature and presented tests herein, comprises only welded girders or box specimens in as-welded condition, i.e. none of the specimens were stress relieved.
1.5. Basic conceptsWithin this section some basic concepts and notations used within this thesis are explained.
The notations used for describing the layout for a girder web longitudinally stiffened with an open or closed section stiffener is described in Figure 1.1.
1.5.1. Effective cross-section of longitudinal stiffenersThe moment of inertia for a longitudinal stiffener, Ist, is used herein to determine e.g. the
relative flexural rigidity of the longitudinal stiffener. Generally the moment of inertia is determined for the stiffener itself and a contributing part of the girder web. However, there exists different definitions of how to estimate the Ist, e.g. Rockey et. al (1979) and Graves Smith and Gierlinski (1982), however regarding this thesis the definition of EN 1993-1-5 according to Figure 1.2 is adopted.
6
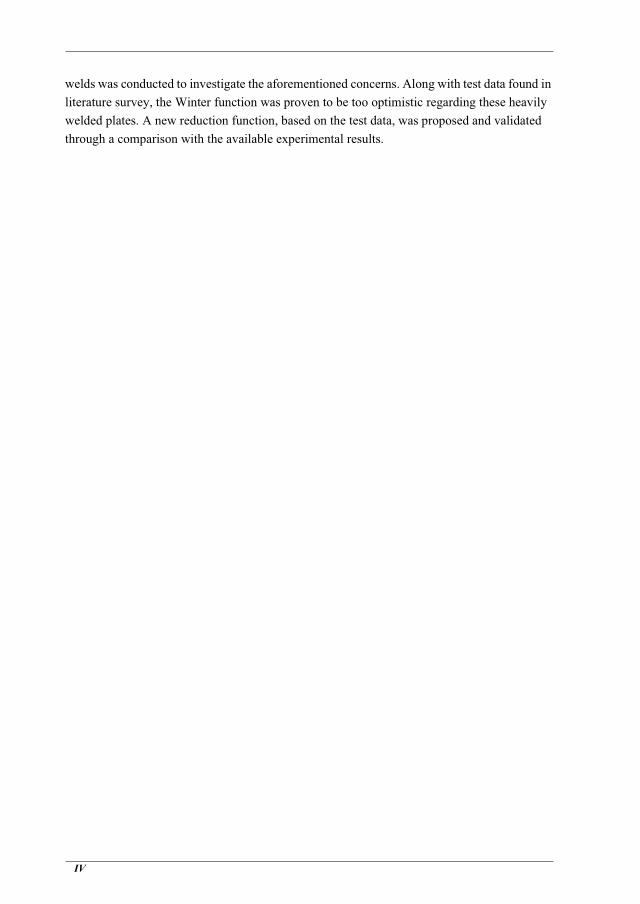
Figure 1.1: Schematic description of cross-sectional notations for a girder stiffened with an open sectioned stiffener (left) and a closed section stiffener (right).
The section of the stiffener used as the gross area comprising the stiffener with an addition of the web, 15 tw wide on each side of the stiffener. Though this must be compatible with the actual dimensions of the cross-section, e.g. distance to flanges or overlapping areas.
Figure 1.2: The definition of EN 1993-1-5 regarding the effective cross-section of longitudinal stiffeners. Left open section stiffener and to the right a closed section stiffener.

Introduction
7
1.5.2. Bending resistanceThe bending resistance of the longitudinally stiffened girders was herein calculated with
respect to EN 1993-1-5. This with respect to cross-section classes and possible reductions to effective sections. This was conducted for all outstand and internal elements under compressive stresses, i.e. flanges, the part of web under compression and the stiffeners. The cross-section was subdivided into simply supported parts, e.g. the stiffener in Figure 1.2 above would be divided into three parts, and the rest of the web also into three parts (one above the stiffener, one “inside” the stiffener and one from the stiffener and down to the neutral axis) all treated individually.
Furthermore, the bending resistance was also modified with respect to the girder being of hybrid type or not. Regarding common hybrid girders, i.e. with a flange having a higher yield strength than the web, the approximation according to eq. (1.1) and eq. (1.2) was used to determine the bending resistance.
(1.1)
(1.2)
However, some of the test data from the literature was based on girders with an “opposite” hybrid girder, i.e. with the web having a higher yield strength than the flange. In these cases the bending resistance was approximated assuming that the web was to reach the yield limit even though the flange having a lower yield strength, i.e. first assuming the whole cross-section having the yield stress of fyw. The bending resistance was then modified subtracting the overestimation of the flange resistance, all according to eq. (1.3).
(1.3)
1.6. Disposition of the thesisIn chapter 2 the basic plate buckling theory is briefly described. An introduction into
structural stability initiates the chapter, followed by the concepts of critical loads, effective width (by e.g. von Kármán and Winter) with respect to local buckling. Furthermore some models describing the ultimate patch loading resistance regarding unstiffened girder webs, followed by models regarding webs with longitudinal stiffeners, are introduced. Formulations regarding patch loading and bending moment interaction are also briefly presented.
Chapter 3 comprises a survey of published work regarding patch loading resistance of longitudinally stiffened I-girder webs. Specimens with webs reinforced with open stiffeners, as well as closed stiffeners are presented. Moreover, results from 366 numerical simulations from
MR fyf Weff W–=
Whw Aw
12------------------ 1
fywfyf-------–
22
fywfyf-------+=
MR fyw Weff fyw fyf– Afl hw tf+–=

8
the literature are introduced. All the gathered tests results were also re-evaluated with respect to EN 1993-1-5 and the results are shown in this chapter.
A proposal of a modified design approach, based on the findings in the literature is presented in chapter 4. The design model is validated by re-evaluating the test results and numerical simulations with respect to the proposal. Furthermore, the proposed design approach is compared with some directly comparable proposals by other authors as well as the design rules of EN 1993-1-5. In a last step a partial safety factor in accordance to the guidelines in Annex D of EN 1990 (2002) for the tests as well as for the numerical simulations, is introduced.
Experimental work regarding local buckling published by other authors is presented in chapter 5. The test results gathered from the literature comprises specimens made of plates joined by welds along their edges to a box shaped cross-section. All of the tests introduced within this chapter is in as-welded condition and re-evaluated with respect to EN 1993-1-5.
Chapter 6 presents the experimental work regarding local buckling of box-sectioned welded specimens preformed at LTU. The test set-up, layout of the specimens, measured quantities and more are described. Furthermore, the results from the local buckling tests are compared to the EN 1993-1-5 and presented in this chapter.
Chapter 7 proposes a modified reduction function for calculating the effective width regarding plates with welds. Furthermore the proposal is validated by comparison to the available tests results from both literature and experimental work conducted at LTU. In a last step, the proposed reduction function is provided a partial safety factor on the same manners as for the patch loading part of this thesis.
All the work presented in this thesis is discussed and concluded in chapter 8. Furthermore, some proposals for future work is also introduced.
Tables containing data of the specimens used for patch loading experiments and numerical simulations presented in the literature are displayed in Appendix A.
In Appendix B additional figures describing the test and numerical simulation data are shown. This with respect to the herein proposed design approach, as well as the proposals by other researchers which have been used for the comparison. The statistical evaluation of the proposed resistance approach is also provided in this appendix.
Appendix C is detailing the local buckling experiments. This with respect to specimen data, stress / strain figures from tensile tests, axial load / mean axial deformation figures from the local buckling tests etc. Furthermore the used measuring equipment are briefly described and the statistical evaluation of the partial safety factor with respect to the tests results from the literature and LTU conducted experimental work is presented.

Plate Buckling - Theory
9
Chapter 2:
Plate Buckling - Theory
The words “stable” or “instable” are used by people in various contexts. Almost everyone have a relation or thought concerning the two words describing the state of something. The terms are used in the wide range from psychology and politics to nuclear and chemical applications. The term “stable” is often connected to something positive and rigid when “instable” is closely linked to the possibility of an abrupt loss of something. One of the most known and used context of the two words, which almost all people have a relation to, is when used in medical surroundings; a stable or instable health state.
The interest in stability / instability is also a central concern regarding mechanical systems, e.g. structural or civil engineering, see Figure 2.1. In this field the stability or instability of a structure is often confined to regard the elastic part of the phenomena. However, as will be shown later herein, a structural engineer may also have to consider the inelastic state. As an example of structural instability one can consider the columns in a building made with a steel frame. These columns have not only to withstand the vertical loads of the dead weight and e.g. snow, but also lateral loads caused by the wind. This well known instability phenomenon is usually referred to as column or flexural buckling.
Figure 2.1: Maybe an up-coming example of structural instability?

10
The buckling may be of global nature, as described above, but may also be of localized (local) type. Buckling of local sort are regional located buckling, e.g. a flange of a beam or at a certain level of a silo, see Figure 2.2. Local buckling occur due to compressive stresses and may in a further perspective cause global buckling because of the loss of resistance of the cross section in question.
Figure 2.2: Different examples of buckling. Shell buckling in a silo (left), Farshad (1994), and box shaped profile (right).
A structure or a member in an equilibrium state under e.g. compressive load may become unstable and the structure acquires a new equilibrium state or a new trend of behaviour. When considering classical buckling theory the critical stress level is defined as the stress at which the perfect structure becomes unstable. This point is called the bifurcation point or bifurcation load. Usually two more types of elastic instabilities are distinguished. These are limit equilibrium instability (snap-through buckling) and dynamic or flutter instability.
Considering the load - displacement behaviour of a plate subjected to compressive stresses, a load level lower than the bifurcation point corresponds to a state where buckles are of elastic type. Hence, the secondary path in Figure 2.3 represents the post buckling stadium.
Figure 2.3: Schematic description of the bifurcation of equilibrium.
Load
Deformation
Bifurcation point
Critical load
Secondary pathPrimary path

Plate Buckling - Theory
11
The bifurcation load or critical load has under the years been thoroughly investigated. As mentioned above, the critical load is determined with elastic analysis and have been examined theoretically by many different researchers, e.g. Timoshenko and Gere (1963).
2.1. Plate buckling theoryA thin plate is, by definition, a two-dimensional flexural element of which the thickness is
much smaller than its other two dimensions. A plane passing through the middle of the plate is called the middle plane.
Thin plate elements are used in various structures; they may be elements in a complex structure or may themselves constitute the major part of a structure. Examples of plate elements are walls of containers, silos, and reservoirs, flat roofs, flat elements of vehicles and aircrafts, and sheet piles. Examples of plates in civil engineering applications are the flanges and the web of a beam. Plate elements may be homogeneous and isotropic or they may be stiffened and / or have a composite construction.
Depending on the mode of application, a plate can be subjected to various lateral as well as in-plane forces. Under certain circumstances, applied in-plane loading may cause buckling which can be global or in some cases, have a localized nature; delamination buckling of composite plates or buckling of a web in a steel beam are examples of local buckling. Regarding thin plates, buckling is a phenomenon which may influence the load-bearing capacity of plate elements. Hence, this must be taken into consideration in the design of plate elements.
2.1.1. Elastic analysis / Calculation of critical loadThe theory behind the behaviour of a thin plate under compressive forces is usually divided
into two parts; firstly the calculation of the critical load and secondly the determination of the ultimate load level. The critical load level is by definition the point were the perfect structure, or member, in question loose its stability.
Analytical calculation of the bifurcation or critical load on the basis of the classical theory of elasticity may be done either through solving the differential plate equation or via the energy method. The differential equation describing the equilibrium under small deformations of a plate loaded in its plane was established by Saint-Venant in 1870, Dubas and Gehri (1986), and states
(2.1)
where w is the lateral displacement and the flexural rigidity of the plate is given by
4wx4
--------- 24w
x2 y2-----------------
4wy4
--------- 1D---- Nx
2wx2
--------- Ny
2wy2
--------- 2 Nxy
2wx y
------------++=++

12
(2.2)
This plate equation was derived under the assumptions that the material is behaving in a ideally elastic way, the plate is without initial imperfections such as initial curvature or residual stresses. Furthermore, the plate deformations are assumed to be small. Under these assumptions the plate shows no lateral deformations until the critical stress level is reached. At this point, the deflection can either be negative or positive regarding the coordinate system of the plate, Figure 2.4.
Figure 2.4: System bifurcation at point A. The plate buckles in either a positive or negative lateral direction, w.
The plate equation may be convenient to use when a rigorous solution of eq. (2.1) is possible. When the plate in question is for example reinforced with stiffeners, the problem gets more advanced. These more advanced applications led to the development of other models, better describing the actual behaviour of plates.
In 1891 Bryan developed an strain energy expression for a plate under bending. The approach of this method is to study the plate energy in the bifurcation point, where the plate cease to be in its assumed perfectly flat state and instead follow its secondary equilibrium path (see Figure 2.3) in a laterally deformed state. The energy based solution is built on the classical correlation between the internal energy of bending and the external work done by the forces acting in the middle plane of the plate. The expression for describing the strain energy stored in the deformed plate is
(2.3)
Furthermore the equation describing the work conducted by the externally applied forces is
D E t3
12 1 2–-----------------------------=
U 12--- D
2wx2
---------2wy2
---------+2
2 1 –2wx2
---------2wy2
---------2wx y
------------2
–– xd yd=

Plate Buckling - Theory
13
(2.4)
The equations eq. (2.3) and eq. (2.4) are only valid for small deformations, which is assumed to be the case at the bifurcation point. With Figure 2.3 in mind, the comparison between the internal energy and external work gives, according to Timoshenko and Gere (1963), the following information concerning the stability of the plate in question at the bifurcation point:
• If U > T, the flat form of equilibrium of the plate is stable (primary path)
• If U < T, the plate is unstable and buckling occurs (secondary path)
However, the critical load amplitude may be found by setting
(2.5)
which can be solved under the condition that the change in energy potential must have a minimum value for a stable equilibrium. This may be used for the derivation of the differential equation form of the equilibrium, eq. (2.1). Another way to solve the problem is to apply an expression for the lateral deformation of the plate.
2.1.2. Simply supported plates under uniform compression
Figure 2.5: Simply supported plate under uniform compressive load. Dubas and Gehri (1986).
If considering a plate subjected to uniformly distributed forces along two of the edges, according to Figure 2.5, the determination of the critical load level of the plate in question is dramatically simplified comparing to the general case with loads applied in all the in-plane
T 12--- Nx
2wx2
--------- Ny
2wy2
--------- 2+ Nxy
2wx y
------------+ xd yd–=
T U U T– 0= =

14
directions. Since the only load applied on the plate, in the form of a uniform distributed compressive force, acting along the edges x = a/2 and x = -a/2, the rest of the external applied loads according to equation eq. (2.1) equals zero:
(2.6)
The assumed edge constraints of the plate leads to the following boundary conditions:
Along the edges x = a/2 and x = -a/2
(2.7)
and along the edges y = 0 and y = b
(2.8)
The boundary conditions implies that the deformed shape of the simply supported plate may be described by a double trigonometric Fourier series on the form
(2.9)
By substituting the expression of the lateral deflection according to equation eq. (2.9) into eq. (2.3) and eq. (2.4) under the above described conditions in eq. (2.6), eq. (2.7) and eq. (2.8), and by using the relation between the external work done by the applied load and the strain energy according to equation eq. (2.5), the following relation may after some mathematical work be stated
(2.10)
To satisfy the equation eq. (2.10) for all positions on the plate, i.e. all values of x and y, the following relation has to be true:
(2.11)
or in another form
Ny Nxy 0= =
w2wx2
--------- 0= =
w2wy2
--------- 0= =
w amnm x
a----------- n y
b---------sinsin
n 1=m 1=
= m n, 1 2 3,,=
D ma
-------2 n
b------
2+
2Nx
ma
-------2
+ amnm x
a----------- n y
b---------sinsin 0=
D ma
-------2 n
b------
2+
2Nx
ma
-------2
+ 0=

Plate Buckling - Theory
15
(2.12)
The combination of the two integer parameters now have to be chosen in such a way that the applied load, Nx, reach a minimum value, i.e. the sought critical load value, Ncr. It can be shown that the lowest critical load is reached when the plate buckles in a shape such that one half sinus wave is formed over the width of the plate (y-direction), hence the integer parameter n = 1, Timoshenko and Gere (1963). With this, the equation eq. (2.12) may be evaluated to
(2.13)
in which the integer parameter m describes the number of half sinus waves over the length of the plate (x-direction). The equation eq. (2.13) are more often formed as
(2.14)
where the dimensionless parameter kcr is the buckling load coefficient and is given by
(2.15)
Furthermore, with the expression for the flexural rigidity of the plate given in eq. (2.2), inserted in eq. (2.14) the well known expression for the critical, or bifurcation, stress may be expressed as
(2.16)
with the insight of that
(2.17)
The buckling load coefficient, kcr, is, as can be seen in eq. (2.15), a function of the plate width b, the length a and the number of sinus half waves over the length, m. For different values of the plate width and length ratio a / b, the lowest critical stress level will be found for different numbers of half waves according to Figure 2.6.
Nx
D ma
-------2 n
b------
2+
2
ma
-------2
------------------------------------------------------=
Ncra2 2 D
m2------------------------ m2
a2------ 1
b2-----+
2
= m 1 2 3,,=
Ncr kcr
2 Db2
--------------=
kcrm b
a----------- a
m b-----------+
2= m 1 2 3,,=
cr kcr
2 E12 1 2–----------------------------- t
b---
2=
crNcr
t-------=

16
Figure 2.6: The buckling load coefficient for a simply supported thin plate. Timoshenko and Gere (1963).
2.1.3. Initial plate imperfectionsIn section 2.1.1, a quite straight forward method for calculating the critical stress level is
presented. However, as always concerning theoretical models describing nature, it is important to remember the assumptions made for the theory in question. Emphasizing the assumptions made of a initially perfect flat plate and a perfectly isotropic behaviour in a homogenous material the understanding of the limitations in the presented theory are obvious. All materials have different levels inherent imperfections, also steel. A plate delivered from the steel fabricator has an initial curvature and probably also residual stresses from uneven cooling of the material. These facts makes the assumptions made above somewhat unrealistic, which also has been proven experimentally and may be found in chapter 3.
Now when the assumptions are found to be a quite utopical description of the real behaviour of the considered plates, the question arises how these initial imperfections affect the plate behaviour before, as well as after, the bifurcation point. Figure 2.7 shows the difference in the plate behaviour when plate imperfections are considered.
Considering Figure 2.7 two conclusions concerning how the imperfection influence the plate behaviour may be drawn. Firstly, buckling of a plate with inherent imperfections is gradual and the exact critical load may be difficult to determine. Hence, difficulties arises when a comparison between theoretically and experimentally determined critical loads are to be conducted. Secondly, as mentioned before, the plate may accept continued loading after the bifurcation load is reached. Thus the critical load is shown to be a non-representative measure on the ultimate resistance of the plate in question.

Plate Buckling - Theory
17
Figure 2.7: The influence of initial plate imperfections in relation to a perfect plate. Lateral displacement, , and applied in-plane stress, , in relation to the elastic critical stress, cr.
2.1.4. Geometric imperfectionsWhen considering the initial out-of-plane imperfections, i.e. initial buckles, the influence of
these on the maximal out-of-plane deformation / load correlation are shown in Figure 2.8.
The graph and the calculations behind was made by H. Nylander in 1951 and shows how an applied initial deformed shape with the amplitude wo (in the same shape as the deformed plate) affects the magnitude of lateral deformations under applied load. Furthermore, when the material is assumed to be ideal elastic, the model gives no information concerning the ultimate load. Concluded, the initial geometric imperfections primarily influences the plate stiffness and becomes more obvious with an increased plate slenderness.
Figure 2.8: The effect of initial geometric imperfections. Relation between the lateral deformation, w, plate thickness, d, and load, N, concerning different amplitudes of initial imperfections wo. Nylander (1951).

18
2.1.5. Residual stressesKnowing that residual stresses are present in all materials, it is evident that this must affect
also the plate buckling theory. Geometrical imperfections and residual stresses in a plate under compression mainly affects the initial phase of the loading of the plate. This since the initial imperfections acts as an existing applied load before applying external loads. In Figure 2.9 below, a schematical distribution of residual stresses caused by edge welding a plate is shown.
Figure 2.9: Schematic distribution of residual stresses in an edge welded plate.
Considering Figure 2.9 above, the influence of the initial load due to the present residual stresses is clear. Since the middle region of the plate before external loads are applied, already is under compressive stresses, it is obvious that yielding of the plate in question will occur at a lower external load level compared to a residual stress free plate, see Figure 2.10.
The effect of inherent residual stresses is more marked for stockier or intermediate slender plates, for which yielding is the governing cause of failure. Concerning more slender plates, the initial geometric imperfection tend to surpass the influence of residual stresses, Dubas and Gehri (1986). Hence, the influence of residual stresses decreases with increasing plate slenderness.
Figure 2.10: Schematic influence on the behaviour of a plate with (S) and without (A) residual stresses.
L / L
cr

Plate Buckling - Theory
19
2.2. The effective width conceptAs shown above, the estimation of the critical load may be done by a straight forward
method. However, the elastic analysis assumes, as described in previous sections, that the plate in question is perfectly flat and that no initial stresses are present. Because of the presence of these imperfections non-linear models were evolved. Furthermore, the initial plate imperfections were not solely the reason to why non-linear theories had to be evolved. The assumption concerning the constitutive relations, in this case ideal elastic material, is not suitable to use when the ultimate resistance is sought for.
Another reason why non-linear models were established was that many researchers showed that the ultimate load of a plate under compression may significantly surpass the critical load level. This was especially evident concerning more slender plates. Regarding stockier plates the resistance is often limited by yielding in the material and the ultimate load may be lower than the critical.
In linear elastic analysis, the distribution of the load is assumed to remain uniform until the plate buckles. However, when the plate starts to buckle, the stresses are re-distributed in the plate. The plate behaviour under these large deformations, or post critical behaviour, is a complicated area to describe. Some differential equations describing the phenomenon were derived by von Kármán in 1910 but the methods for solving these are complex, Dubas and Gehri (1986). The finite difference method, fourier series or different perturbation methods are possible tools for this work.
Other methods may also be used for studying the post critical plate behaviour. One example is the numerical methods, e.g. the finite element method, FEM, which probably is the most powerful tool available today. However, other methods have been used during the years of research. Analytical methods such as the Ritz energy method or a method based on a theory by Skaloud and Kristek called the “Folded plate theory method” are both excellent examples.
As described above, the theory behind plate buckling is rather complicated due to the combination between the membrane stresses from the applied load and bending stresses in the deformed plate, as well as shear stresses due to rotation at the corners of the plate. For design purposes the above described methods may be too advanced to use. This is why the “Effective width approach” by von Kármán et al. (1932), is widely spread as the model for determining the ultimate resistance of plates under compression.
2.2.1. The von Kármán effective-width formulaThe starting point for the effective width approach is that the ultimate resistance is reached
when the largest edge stress reaches the yield stress level. Since the formed buckle in the middle of the plate reduces the plates ability to carry the load, the stresses are re-distributed as shown

20
in Figure 2.11 below. The real stress distribution in the plate is approximated, or substituted, with two strips which describes the load carrying effective width of the plate.
Figure 2.11: Stress distribution in a plate before (a) and after buckling (b).The von Kármán assumption concerning the effective width is presented in (c). Brush and Almroth (1975).
von Kármán’s hypothesis was that the fictitious plate with the width of beff would have the critical stress equal to the yield stress, i.e.
(2.18)
Furthermore, the critical stress according to eq. (2.16) under the condition that the plate is under uniform compression and simply supported (kcr = 4) the following expression may describe the relation between effective width and yield stress level:
(2.19)
or with the original plate width equal to b
cr fy=
42 E
12 1 2–----------------------------- t
beff--------
2fy=

Plate Buckling - Theory
21
(2.20)
which is usually referred to as the von Kármán effective-width formula. Furthermore, the relation
(2.21)
was made as a generalization of the corresponding well known parameter for column buckling and was called the reference slenderness of the plate. In modern design rules, when design is done with respect to the ultimate load, this expression is the only one in which the elastic critical load is considered, and as expressed in von Kármán et al. (1932) the following may be stated
(2.22)
or
(2.23)
under the circumstances that the plate is simply supported and under uniform compressive load.
Although, von Kármán’s theories gained reputation as a good method to use for the determination of the ultimate load of the plate in question, the method was a method based on plates without initial imperfections and when compared to test results it was found to be true only for large b / t ratios. However, von Kármán still stands as the first researcher proposing a reduction factor function.
2.2.2. The Winter functionTheodor von Kármáns work was a milestone concerning the simplified design methods
concerning plate buckling. Many researchers followed his work, aiming for an expression describing a real plate with inherent initial imperfections. One of the more known and widely spread in design codes, is the one proposed by Winter in 1947. Winter conducted numerous experimental tests on cold formed specimens and suggested
(2.24)
as a suitable function regarding the effective width, Winter (1947). Winters first suggestion
beff b crfy
-------=
pfy
cr------- 1 05 b
t---
fykcr E--------------,= =
beff 1 9 t Efy----,=
beffb
-------- 1p
-----= for p 1
beffb
-------- 1p
----- 1 0 22,p
----------–= for p 0 673,

22
was with the coefficient 0,25 but was later changed to the 0,22 used nowadays. However, it is interesting to notice the small difference between the “original” equation eq. (2.23) and the experimentally based eq. (2.24).
Other researchers proposed different solutions, or modifications, of the initial von Kármán formula. Two reported in Dubas and Gehri (1986) are
(2.25)
by Faulkner in 1965 and
(2.26)
suggested by Gerard in 1957.
Even though a lot of effort has been put into this research field, the Winter function, based on the cold formed members survived and is nowadays set as the function used in the present design rules in EN 1993-1-5.
In EN 1993-1-5 the plate slenderness, p in eq. (2.21) is rewritten according to
(2.27)
and is defined as
(2.28)
The above stated parameter was introduced as a precaution to eventual differences in the material characteristics considering steels with fy > 235 MPa. However, this parameter may be debated in some senses, e.g. when used in physical interpretations of the behaviour of a cross-section as the moment of inertia, see the discussion in chapter 8. Regarding the buckling load coefficient, k , for a simply supported plate under uniform compressive load, this is set to be equal to 4.
As mentioned above, design with respect to local buckling of flat compression elements is made through a reduction of the cross sectional area of the plate in question. Concerning internal compression elements this is, according to EN 1993-1-5, done through the use of the expression
beffb
-------- 1 05,p
---------- 1 0 26,p
----------–= for p 0 55,
beffb
-------- 0 82,
p0 85,
-----------=
pb t
28 4 k,--------------------------------=
235fy
---------=

Plate Buckling - Theory
23
(2.29)
in which the factor = min / max, represents the actual stress distribution over the plate. Concerning uniform distribution of compressive stress this factor equals 1. Thus, the eq. (2.29)reflects the original Winter function eq. (2.24) used for these kind of plate elements in EN 1993-1-5.
2.3. Patch loadingAnother form of buckling is the patch loading, commonly used for a load with a shorter
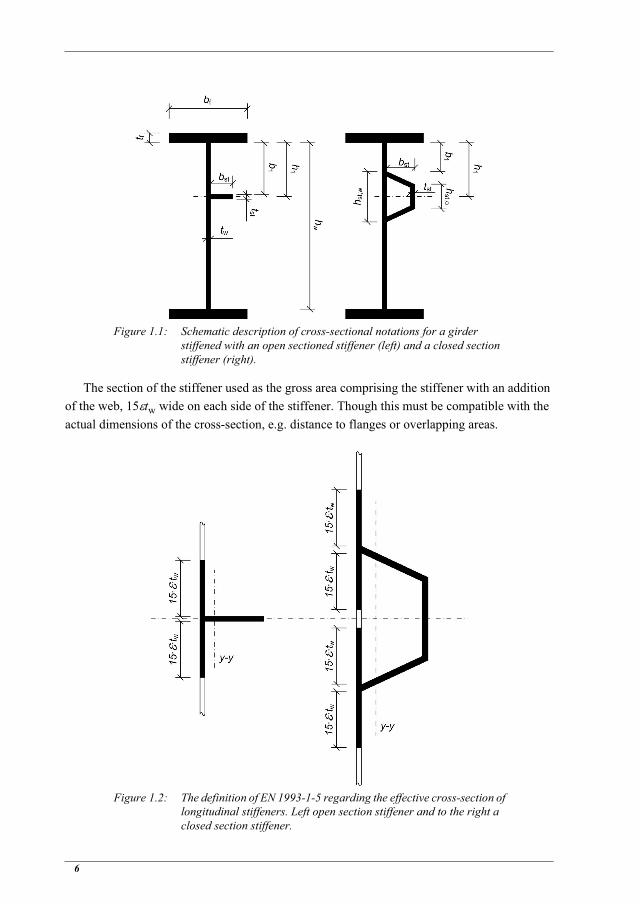
distribution length along a girder, applied perpendiculary to the flange in the plane of the web. The phenomena is similar to the previously described plate buckling, however patch loading in the elastic region does not distribute the stresses at an even magnitude as for the previously described buckling. Early patch loading investigations date from the end of the 1930’s when the influence of the flange stiffness on the web resistance to patch loading often was estimated using the analogy of a beam on an elastic foundation following the old formulas of Zimmermann (1888), Bergfelt (1979). The previously used slopewise load distribution (on a slope 1:1 from the applied load) was replaced by the beam on an elastic foundation in order to estimate the load acting on the edge of the web. Although the load distribution problem had two solutions, i.e. the 45 degree slope and the elastic foundation, the buckling problem was still to solve.
The aforementioned research on plate buckling regarding the gained knowledge in how to predict the ultimate resistance, i.e. moving from the idea that the critical buckling load was a good approximation of the ultimate resistance to actual models describing the maximum load a plate could carry, applies also in the field of patch loading resistance. The elastic critical load is nowadays “only” used to classify the slenderness of the girder web in order to calculate a reduction factor. Other models does not use a reduction formulation, e.g. in the 1960’s tests in Granholm (1960) gave a very simple and preliminary formula for the prediction of the ultimate load with the thickness given in mm and the ultimate load in tonnes according to
(2.30)
This was probably one of the first ultimate patch loading resistance models to be derived based on an empirical consideration. However, more refined models were to follow and the resistance for a longitudinally stiffened web has often been closely linked to the unstiffened ditto. Herein, a presentation of how the research regarding the patch loading resistance for an unstiffened web has progressed will come first. Following the theory for an unstiffened web will be the corresponding theory for the longitudinally stiffened webs.
p 0 055 3 +,–
p2
----------------------------------------------------- 1 0,=
Fu 8 5, tw2=

24
2.3.1. Resistance for girders without longitudinal stiffeners
3-hinge models
BergfeltOne of the first models based on a fully mechanical approach based on the failure
mechanisms observed under experimental work was presented in Bergfelt (1979). Bergfelt referred to the model as the “three-hinge-flange” and stated his earlier work presented in Bergfelt (1971) as its origin. The three hinge mechanism model was derived from tests results from his own and other researchers work.
Bergfelt describes his model as follows: “At a small load the flange behaves as a beam on elastic foundation (consisting of the web). At increasing load a plastic hinge forms in the flange just under the load. The web stresses start yielding below the hinge, whereafter the yielding region extends. The negative bending moments in the flange increase, and the failure starts when a (negative) plastic hinge forms on each side of the load.” However, Bergfelt also states that the model in Bergfelt (1971) not seemed to be valid for tf / tw > 2 (i.e. more common girder ratios). The authors’ idea of the reason for this problem was that for girders with more slender webs compared to the flanges, the crippling of the web starts as buckling of the region of the web under the applied patch load and not because of a reached yield limit of the web.
This contradiction (compared to the basic idea of the three-hinge-flange mechanism) led Bergfelt to refine his model further, and was so done with Bergfelt (1979). Furthermore, Bergfelt mentions that if the load is distributed through a very stiff bar, or is distributed over a longer distance, there are possibilities that the centre plastic hinge in the flange may be replaced by two hinges at each end of the load introducing bar/plate.
To make the model more applicable concerning “normal” girders, Bergfelt aimed towards finding a satisfactory estimation of w according to the model description in Figure 2.12 below.
Figure 2.12: The three-hinge-flange model according to Bergfelt (1979).
Bergfelt used the von Kármán approach, with the approximative description of the failure stress according to eq. (2.31)
(2.31)w cr fyw=

Plate Buckling - Theory
25
Bergfelt evolved the system and end up in the expression
(2.32)
in which ti = tf for a web of “normal” slenderness and with a flange satisfying bf = 25tf.
In other cases with bf / tf -ratios not equal to 25 the eq. (2.33) is valid (under the restriction that the flange has a rectangular cross-section).
(2.33)
Concerning eq. (2.34) the expression contains a number of correction terms and also terms for including eventual influence of vertical, f(sv), and longitudinal, f(sl), stiffeners. Bergfelt also states that the other correction factors generally lies close to 1.
(2.34)
Regarding longitudinally stiffened girders Bergfelt proposes a resistance function of amplification factor type which is described in section 2.3.2.
Roberts and ChongThe attentive reader may suspect that the three-hinge model probably is more applicable to
patch loading cases with a shorter loading length. Nevertheless, in Roberts and Chong (1981) a three-hinge mechanism was proposed to be used under “distributed” patch loading. With a distributed patch load the authors referred to a load distributed over the whole panel length. The applicable tests of Bossert and Ostapenko (1967) were used as comparison to the proposed model. However, different from the proposed model of Bergfelt but in line with other work made by Roberts and e.g. Shimizu et al. (1989a,b), Roberts and Chong derived the model with yield lines in the web.
UngermannA more recent publication using the three-hinge mechanism is the dissertation by
Ungermann (1990). Ungermann used a more contemporary approach to establish a patch loading resistance model for design, i.e. by using the von Kármán approach of plate slenderness, with the slenderness parameter according to eq. (2.35). The resistance proposal in Ungermann (1990) according to eq. (2.36) was also verified through a comparison to tests. Furthermore, the resistance proposal presented by Ungermann comprises two equations which are valid for two different web slenderness values with 0,8 as the divider. This is due to the yielding of the web regarding more stocky webs and the same idea may be found in the work by Roberts presented later within this chapter.
FR 0 8 tw2 E fyw ti tw f ss hw etc,,,=
ti tfbf
25 tf-------------4=
f ss hw etc,, f ss f hw f fyw f ME f f sv f sl

26
The two equations of Ungermann reads
(2.35)
(2.36)
in which the distance between the outermost plastic hinges is estimated as
(2.37)
and the yield resistance, Fy, of the web is calculated over this length of the web according to
(2.38)
As may be noticed in eq. (2.36) the yield resistance of the web over the length 2cu is reduced with a function, f( F), i.e. the resistance is given with the reduced yield load on the form
(2.39)
and was the first patch loading design model based on a reduction factor dependent on the web plate slenderness parameter, F.
4-hinge models
Roberts and RockeyIn the end of the 70’ies, at the same time as Bergfelt developed his model, Roberts and co-
authors presented an alternative plastic mechanism solution. The background of the work was that none of the up to then published models and / or design recommendations was entirely satisfactory when compared to the experimental data base available hitherto. In Roberts and Rockey (1978) and (1979) a solution for the ultimate resistance for plate girders under patch loading was proposed. The model was based on four plastic hinges in the flange accompanied by yield lines in the web. The idea of the ultimate failure model is described in Figure 2.13. Furthermore, the model presented in the publications of Roberts and Rockey was in the articles compared with available test data and, according to the authors, suitable to use for prediction of the ultimate patch loading resistance.
FFyFcr-------=
FR 22 27 tw2 fyw= if F 0 8,
FR 2 cu tw fyw0 525,
F------------- 0 375,
F2
-------------+= if F 0 8,
2 cuss2----
ss2----
2 4 bf tf fyftw fyw
------------------------------++=
Fy 2 cu tw fyw=
FR F F Fy=

Plate Buckling - Theory
27
Figure 2.13: The definition of the failure mechanism and the position of the four plastic hinges in the loaded flange and yield lines in the web according to Roberts and Rockey (1979).
In 1981 Roberts presented an article himself with a revised version of the aforementioned model. The modifications of the model presented in Roberts (1981) was mainly due to new tests focusing on how changes of the web depth and the thickness of the flanges and the web affected the patch loading resistance. The latter was a revised form of the four hinge model from Roberts and Rockey (1979), and the procedure to estimate the patch loading resistance according to the version of Roberts (1981) is presented in short manners below.
The greek symbols , and in Figure 2.13 above represents the assumed position of the yield lines in the web, the position of the outermost plastic hinges in the flange and the deformation of the web precisely prior to failure respectively. The next step to take in order to formulate the resistance equation is to assume that the external load deforms the girder a small vertical distance, w, which implies a rotation in the plastic hinges of w / and of the yield lines in the web of magnitude w / 2 cos . By summing and equating the external and internal work done under this incremental deformation, the following equation is given.
(2.40)
in which is a definition of a length of the web under the external load which is assumed to have yielded because of compressive membrane stresses, hence this part of the web offers no bending resistance and is subtracted from the directly loaded length ss according to eq. (2.40). By minimizing FR in eq. (2.40) with respect to , the spread of the plastic hinges in the flange may be expressed as
(2.41)
and under the assumption that the flange deformation just before collapse may be estimated using the theory of elasticity and that the moment distribution in the flange varies linearly
FR4 Mpf----------------
4 Mpwcos
--------------------------2 ss Mpw
cos---------------------------
2 Mpwcos
--------------------------–+ +=
2 Mpf cosMpw
----------------------------------=

28
between +Mpf at the outer plastic hinge to - Mpf at the closest hinge at the edge of the patch load, the maximum vertical displacement of the flange may be derived by integration to
(2.42)
Through some geometrical compatibilities, mathematical work and also on the assumptions that fyf = fyw and the distance between the flange and the yield line, , was set to 25tw for slender girders, Roberts ends up in a solution for estimating the patch loading resistance according to
(2.43)
However, Roberts recommended that the ratio ss / hw would be limited to 0,2 due to the somewhat unrealistic assumption of a straight flange between the two inner plastic hinges when the loaded length grows larger. Furthermore, Roberts indicates that eq. (2.43) seems to underestimate the ultimate resistance concerning girders with very thin flanges and webs. Based on a comparison to test data Roberts suggested that the ratio tf / tw would be limited to three to avoid the aforementioned issues but also states that this limitation is not recommended for practical situations.
In the same publication (Roberts (1981)) an alternative failure model is presented. This model addresses the possibility of a failure by direct yielding of the web underneath the patch load. With an increased web thickness, (i.e. stockier web) the ratio out of plane bending stiffness to the compressive membrane stiffness will be raised. According to Roberts this implies that an alternative formulation for more stocky webs would be needed and is founded on the model described in Figure 2.14.
Figure 2.14: The failure model for stocky webs according to Roberts (1981).
Analogous to the method on which eq. (2.43) was derived, Roberts uses the external and internal work, equating these and minimizing the expression with respect to and ends up in eq. (2.44) below.
(2.44)
vMpf
2
6 E If-------------------=
FR 0 5 tw2 E fyw tf
tw----------------------- 1
3 sshw
-----------twtf-----
32---
+,=
FR fyw tw ss 2 4 Mpf fyw tw+=

Plate Buckling - Theory
29
Knowing that the plastic moment resistance of the flange is given by
(2.45)
and inserting eq. (2.45) in eq. (2.44) the following equation for prediction of the ultimate patch loading resistance concerning a web failing due to yielding may be derived
(2.46)
All in all, Roberts used the lowest of the two described resistances (i.e. either the direct yielding resistance or the resistance of the buckled web) as the resistance of regarded girder, that is the smallest of eq. (2.43) and eq. (2.46) gave the actual resistance of the girder.
LagerqvistIn 1994 Lagerqvist presented his doctoral thesis focused on the resistance of steel girders
subjected to concentrated forces. In Lagerqvist (1994) a thorough literature review was accompanied with the presentation of experimental work, numerical simulations and in the end the proposal of a design model. Lagerqvist addressed patch loading of three types; patch load, opposite patch load and end patch load. Herein only the work dealing with the first of these will be considered. The proposal of Lagerqvist was based on a von Kármán approach and consisted of three parts, an expression for the yield resistance, the elastic critical buckling load and the resistance function itself.
Concerning the expression for the yield resistance this was derived on the basis of 48 tests made on welded girders made of high strength steel and moreover 12 tests on rolled beams were included. All three load applications were tested, however the majority of tests were focused on end patch loading. Numerical simulations by means of FEM were used to derive appropriate elastic buckling loads, i.e buckling coefficients for the three load cases. Furthermore, the resistance function proposed was empirically determined with the use of about 250 tests from the literature and in a last step the whole design proposal was compared to some 540 tests and was found to predict the patch loading resistance with a better accuracy than other models from the literature. The work presented in Lagerqvist (1994), with respect to the patch load case according to the mechanical model described in Figure 2.15, will be summarized herein.
In Lagerqvist (1994) the first of the three included parts in the resistance model to be addressed was the expression of the yield load. A model according to Figure 2.15 was used, which is similar to what earlier was proposed by Roberts concerning webs with lower slenderness, i.e. webs suspected to fail by direct yielding. However, based on experimental observations Lagerqvist stated that the deformed part of the loaded flange increased with an increasing web slenderness, i.e the responding part of the web increased with the increasing web
Mpf fyf bf tf2 4=
FR fyw tw ss 2 tffyf bffyw tw-----------------+=

30
slenderness. Nevertheless, this behaviour was not captured in the proposal of Roberts in which the loaded length of the web remains the same over variations of web slenderness. This could be shown using a formulation on the form of eq. (2.39) and the resistance expressed by Roberts, i.e. eq. (2.46) put equal to the yield load, Fy. The loaded length in this expression (i.e. the bracketed terms in eq. (2.46)) remains the same over variations of the web slenderness, F.Lagerqvist suggested a possible alternative formulation to capture this behaviour and this was to enhance the plastic bending resistance of the outermost hinges by letting a part of the web contribute (see Figure 2.15). By using this fictitious T-section of the outer hinges, Lagerqvist secured the dependent relation between the slenderness of the web and the loaded length, i.e. if hw increased the contributing part in Mo would increase and so also the loaded length.
Figure 2.15: The mechanical model for the yield resistance as suggested in Lagerqvist (1994).
To establish an expression for the yield load Lagerqvist made the evaluation in the same manners as Roberts did, i.e. equating external and internal work and ended up in the equation
(2.47)
and by comparison to test results, Lagerqvist proposes k2 = 0,02 for the contributing part of the web.
After having established an expression to determine the yield load of the web during patch loading, Lagerqvist focuses on the second part in his design model, the elastic critical load, eq. (2.48). The method used in Lagerqvist (1994) to determine the buckling coefficient was based on FE analyses of a web with flanges. The model was verified through comparison to other researchers’ published work and found proper to use for further simulations. Lagerqvist combined his derived expressions for the buckling coefficients of both the first and second buckling mode of the deformed web and ended up in eq. (2.49) as the best combination.
(2.48)
Fy fyw tw ss 2 tf 2 tffyf bffyw tw----------------- k2 hw
tf------
2++ +=
Fcr kF
2 E12 1 2–-----------------------------
tw3
hw------=

Plate Buckling - Theory
31
(2.49)
Furthermore, Lagerqvist (1994) also proposed a simplified version of eq. (2.49), in which Lagerqvist included the contribution from the flanges (i.e. the last term in eq. (2.49)) in the first term of the expression. This simplified coefficient would be more suitable to use in design applications. The simplified buckling coefficient was proposed as
(2.50)
The third and last part of the design model presented in Lagerqvist (1994) was the reduction function itself. The function is dependent of the web plate slenderness, F (see eq. (2.35)) and was calibrated with the use of some 190 tests with . The reduction factor function proposed reads
(2.51)
and gives the patch loading resistance with use of eq. (2.39). This equation was however simplified in Johansson et. al (2001) which presented the new design rules for plated structures to be implemented in EN 1993-1-5. The simplified version (design version) of the reduction function eq. (2.51) reads according to
(2.52)
and was furthermore introduced in EN 1993-1-5. Furthermore, the term describing the contribution of the web to the outer plastic hinges in eq. (2.47), (in EN 1993-1-5 called m2) was restricted to only influence the resistance concerning webs more slender than 0,5. That is
(2.53)
MüllerAnother proposal addressing the reduction function for predicting the patch loading
resistance may be found in Müller (2003). In his doctoral thesis Müller proposed a reduction factor founded on the general plate buckling curve proposed in Maquoi and Rondal (1986). The proposal of the latter authors was based on the consideration that any plate buckling curve
kF 5 82 2 1hwa
------2
0 46bf tf
3
hw tw3
----------------4,+,+,=
kF 6 2hwa
------2
+=
ME MR 0 4,
F F 0 06 0 47,F
---------- 1+,=
F F0 5,
F------- 1=
m2 0 02,hwtf
------2
= if F 0 5,
m2 0= if F 0 5,

32
captures the yielding (lower slenderness) and the actual reduction curve (more slender plates). Based on this consideration Maquoi and Rondal presented a general format for which the buckling curves could be written
(2.54)
in which the factor is depending mainly on the boundary conditions for the plate under consideration and the is an imperfection factor dependent of the plate slenderness. The imperfection parameter was expressed as
(2.55)
In Müller = 1 is used to interpolate between the yielding and the von Kármán proposed curve for reduction with increasing plate slenderness. With =1 the solution to eq. (2.54) reads
(2.56)
and with according to
(2.57)
Müller proposed a reduction curve with = 0,34 and 0 = 0,8 to be used for girders subjected to patch loading. The curve was derived in comparison to tests results and furthermore proposed to be used with the plate slenderness determined according to the reduced stress method of EN 1993-1-5. Müller used data from tests and numerical simulations to determine the required load amplifiers according to the reduced stress method. Another example of derivation of a resistance function based on the eq. (2.56) and eq. (2.57) may be found in Grotmann (1993). However this work was proposing a geometrical imperfection factor including the properties of high strength steel by the use of the parameter according to eq. (2.28).
GozziIn Gozzi (2007) the work on patch loading related issues were taken another step further in
the refinement undertaking. The doctoral thesis by Gozzi put the patch loading resistance of plated girders in ultimate as well as serviceability limit state in focus. Herein the work concerning the serviceability limit state will be overlooked and only the ultimate limit state will be regarded. When dealing with the ultimate patch loading resistance Gozzi continued and modified the work presented in Lagerqvist (1994). This with special attention paid to the expression for the yield resistance, in particular the assumption about the addition to plastic moment resistance which origin is found in the added part of the web concerning the outermost hinges in the 4-hinge model of Lagerqvist. In Gozzi (2007) a thorough numerical simulation
1 – 1 – =
0–=
12 –+
-----------------------------=
12--- 1 0– ++=

Plate Buckling - Theory
33
investigation was presented without any proof of that the web contributed in the aforementioned plastic hinges. The FE investigation comprised 19 models over which the flange thickness and width, web thickness, aspect ratio and loaded length was varied. According to Gozzi the numerical study could not prove any contribution from the web regarding the plastic moment resistance in the outermost hinges. Hence Gozzi proposed that the influence of the m2 parameter regarding the loaded length would be neglected, i.e. m2 = 0 irrespective of web slenderness. This conclusion was also supported in Davaine (2004) which is presented in section 2.3.2.
However, the above presented conclusion by Gozzi made the yield resistance decrease hence a new calibration of the reduction function was needed. This undertaking was presented in Gozzi (2007) using a reduction factor function of the same type as in Müller (2003) (see previous section). As mentioned, the yield resistance was changed which furthermore gives an overestimation of the patch loading resistance if the factors proposed by Müller is applied. Thus, the factors and 0 was calibrated using a data base consisting of 184 individual patch loading experiments with low applied bending moments compared to the design resistance. The calibration handed a best fit curve with the factors set to F = 0,5 and 0F = 0,6. Moreover, the results showed that the stockier specimens still had a higher resistance, and the plateau level was proposed to be set to 1,2. The proposition of Gozzi (2007) regarding the reduction factor function may then be concluded as
(2.58)
and
(2.59)
Further, the proposal was in Gozzi (2007) proved to give a prediction of the ultimate patch loading resistance with less scatter compared to the design model implemented in EN 1993-1-5. The proposed model was furthermore verified through a statistical evaluation according to Annex D of EN 1990 (2002) and the derived partial safety factor, M1, was proposed to be set to 1,0.
2.3.2. Resistance for girders with longitudinal stiffenersCalculating the patch loading resistance for a longitudinally stiffened plated girder has often
been estimated using the corresponding resistance for an unstiffened girder. When the patch loading resistance for such an unstiffened web has been calculated it is multiplied with an amplification factor to estimate the actual resistance regarding the web equipped with a longitudinally stiffener (e.g. on the form of eq. (2.63)). However, as been presented in previous section 2.3.1 the reduction factor approach has become the leading prediction model used in the
F1
F F2
F–+------------------------------------- 1 2,=
F12--- 1 0 5, F 0 6,– F++=

34
design regulations of today (e.g EN 1993-1-5). With the aim to have stringent patch loading resistance prediction models both regarding longitudinally stiffened and the corresponding unstiffened type, this has brought the amplification factor models somewhat out of date. Nevertheless, a lot of effort has been put into the topic of estimating the ultimate patch loading resistance of longitudinally stiffened webs with amplification factors (e.g. Bergfelt (1979), Janus et. al (1988), Kutmanová and Skaloud (1992), Graciano and Edlund (2001)), and will be presented shortly herein.
Although these are two historically predominant methods of calculating the patch loading resistance of a longitudinally stiffened girder web there are other proposals available. One quite unique example is a model developed by genetic programming (GP) presented in Cevik (2007). The programming method is a self adaptable program which uses the predefined variables to fit an expression to predict the actual test result. The GP based formulation of patch loading resistance of longitudinally stiffened webs was calibrated towards 138 tests with 11 geometrical and material parameters used as variables. According to Cevik the final GP-equation shows a perfect agreement when comparing to the experimental data base used, showing a mean value of 1,021 and a coefficient of variation of 0,156. Although the correlation to the experiments are good the equation is somewhat complicated and lacks a physical foundation. This may make the expression inadequate when dealing with parameters outside the interval used for the GP. Moreover, the equation is calibrated with only open stiffeners which makes it questionable to use for closed stiffener types. Nevertheless, the equation, with geometries in mm and material properties in MPa, to predict the resistance in kN according to Cevik reads
(2.60)
Another type of direct prediction model may be found in Graciano (2002), and later also Graciano and Edlund (2003), in which the 4-hinge model (Roberts and Rockey (1979), see Figure 2.13), with the addition of a longitudinal stiffener, acts as foundation for the work. Under the assumptions that fyw = fyf (the shortcoming of the yield line model mentioned in section ) and that the position of the yield line would be the resistance expression, a model in Graciano (2002) named “Model II: Failure mechanism model”, was stated as
FRl twa3 fywcos
59 57 tst ss 83 08,–+,–--------------------------------------------------------------+
tf
tf 17 97 184 22,ss
----------------+,+---------------------------------------------------
fyfhw b1 65 81 bf 98 77 ss fyf–,–+,+---------------------------------------------------------------------------------------------
twhw
tf2 15 42 tst fyf 34 76 bst–,–+,–
------------------------------------------------------------------------------+
=
b1 2 20 tw=

Plate Buckling - Theory
35
(2.61)
the latter also the resistance for the unstiffened web plate in which the yield lines are positioned at and for both cases the parameter , according to eq. (2.62), assuming that the collapse load is transmitted over this length of the web which is yielding due to membrane compressive stresses.
(2.62)
However, in many cases and aiming for a harmonized resistance formula for both stiffened an unstiffened girders, along with being user friendly, there might be better options for the designer than the above presented approach.
Amplification factor methodsAs stated earlier, the amplification factor method used to predict the resistance of
longitudinally stiffened girders subjected to patch loading uses the resistance for the unstiffened girder multiplied with an amplification factor, i.e. eq. (2.63).
(2.63)
The ordinary way of deriving such an amplification factor was with reference to experimental work and tests of girders with the same dimensions and only the presence of a longitudinal stiffener as difference. Further, the difference in ultimate resistance was expressed as with an empirically determined function. Some examples of such amplification factor proposals presented by some authors are presented in this section.
One of the more straight forward recommendations for an amplification factor was given in Markovic and Hajdin (1992) who suggested a linear equation according to
for (2.64)
which was derived based on test data from the literature comprising 133 longitudinally stiffened and 318 unstiffened girders. Using eq. (2.64), the authors compared different equations for
FRl 4 tw2 E fyw tf
b1-----------------------
24 E If ss 2 tf –+ Mpw2
b1 Mpf2
------------------------------------------------------------------------------+= ifb1tw----- 40
FRl 2 fyw tw2 2 E tf
fyf-------------------
12 E If ss 2 tf –+ Mpw2
Mpf2
------------------------------------------------------------------------------+= ifb1tw----- 40
20 tw fyw fyf=
Mpw 4 2 ss 2 tf++
2 Mpw fyw twMpf
2
6 E If Mpw----------------------------------+
------------------------------------------------------------------------------------------=
fyw fyf
FRl FR f sl=
f sl 1 28 0 7b1hw------,–,= 0 1
b1hw------ 0 4,,

36
predicting the resistance regarding unstiffened girders, FR, and searched for the best model to be used to predict the resistance for a longitudinally stiffened girder according to eq. (2.63). Testing several equations the best one, according to the authors was the one presented by Roberts (1981), eq. (2.43). This either in the “basic” form according to eq. (2.43) or a form including bending moment. Furthermore, Markovic and Hajdin concluded that eq. (2.43) was the hitherto best formula to predict the resistance for the unstiffened girders if the influence of the loading length was diminished.
The same year another amplification factor was proposed in Kutmanová and Skaloud (1992). The research work was founded on earlier performed experimental and theoretical work (Janus et. al (1988) described in section 3.1.6) regarding single- and double-sided longitudinally stiffened as well as unstiffened girders. The results of the tests were analysed with a non-linear regression approach and the following equation was established as amplification factor
(2.65)
and the ultimate resistance of an unstiffened girder according to
(2.66)
These equations are similar to the ones presented in Janus et. al (1988), however slightly modified to have a better prediction level. However, one drawback of these equations may be that they are established using tests from only one place, e.g. the steel delivered from the same mill, same equipment used and so on. Though, the population used for the regression analysis comprises many individual tests which is favourable.
BergfeltBased on his test results (see chapter 3) Bergfelt determined an amplification factor to take
the influence of the longitudinal stiffener into account. This with respect to the ultimate patch loading resistance. In Bergfelt (1979) the three-hinge-flange model was presented together with a resistance function for unstiffened girders according to eq. (2.32). However the investigation in Bergfelt (1979) was started as an attempt to determine the factor f(sl) (see eq. (2.34)) and through the comparison with the (relatively few and scattered) test results, Bergfelt proposed eq. (2.67) as the amplification factor for a longitudinally stiffened girder.
(2.67)
f sl 0 958 0 09b1hw------ln,–,=
FR 12 6 tw2 fyw 1 0 004
sstw-----,+
If
tw4
-----fyf
240---------
0 153,
,=
f sl 1 13---
b1hw------+
s3b1-------- 0 1
b1hw------ 0 33,,;+=

Plate Buckling - Theory
37
in which the modified distance between the outermost plastic hinges in the upper flange is proposed to lie in the interval
(2.68)
and with a correction factor for the flange bending moment, , Bergfelt proposes eq. (2.69) to determine the distance between the outermost plastic hinges.
(2.69)
However, Bergfelt also proposes a more simple way to determine the amplification factor for the presence of the longitudinal stiffener. The idea behind this formula is according to Bergfelt that the increase in ultimate resistance due to the longitudinal stiffener partly depends on the ratio sy / b1and partly on the effect of the welding. The alternative formulation was stated as follows
(2.70)
GracianoIn the aforementioned doctoral thesis Graciano (2002), two additional models were
investigated besides the previously described Model II. The “Model I: Regression analysis of test results” was based on the customary approach of amplification factors. As base for the ultimate resistance Graciano used the findings of Lagerqvist (1994), see section , eq. (2.47)-eq. (2.51), as the resistance for the unstiffened case. Based on a large number of test results found in the literature, Graciano performed a regression analysis with the ratios b1 / hw, tf / tw and fyf/ fyw as parameters in the amplification function. The results from this regression analysis was that the best fit would be found if using an amplification factor function according to
(2.71)
However, Graciano also states, with reference to statistics literature, that the main shortcoming of his empirical approach is that the actual accuracy in prediction is strongly dependent of the population size used for the analysis.
Reduction factor methods and the elastic critical loadAs shown earlier in this chapter, the elastic critical load as an ultimate load has been proved
to be inadequate to use for design. However, the elastic critical load is usually essential to
sy ss s sy ssss
2
sy----+ ++
sy 5 2bf----
tftw-----
2 twti-----
fyf
E fyw
--------------------,=
1 0 02syb1----- f sl 1 1 0 02
syb1-----,+,,+
f sl 0 556 0 277b1hw------
fyf fywtf tw
-----------------ln,–,=

38
determine the plate slenderness for von Kármán approach reduction factor models, i.e. most reduction factor models regarding plate buckling of today. Hence, how the elastic critical load is determined is of great importance to achieve a good correlation between the predicted resistance and the actual resistance of e.g. a test or a real girder. The elastic critical load has been subjected to extensive research work, e.g. Rockey et. al (1979), Graves-Smith and Gierlinski (1982), Kutzelnigg (1982) and Janus et. al (1988). As mentioned earlier approximate solutions were given to estimate the elastic critical load under various support and loading conditions. Nowadays, the elastic critical load may be estimated in complicated cases by means of different computer aided approaches, e.g. FEM. However, for “everyday” design purposes there has to be analytical approximations of how to estimate the critical load, or usually the buckling coefficient regarding the considered plate, i.e. eq. (2.48). More recent research work presenting solutions for estimating the elastic critical load for a longitudinally stiffened web subjected to patch loading may be found in Graciano (2002) and Davaine (2005).
The work regarding the elastic critical load presented in Graciano (2002) was founded on numerical simulations using the FE-package ABAQUS. Graciano first studied simply supported plates with and without longitudinal stiffeners and compared to previously presented work. Furthermore the model got more refined adding flanges to the web, and a parameter study was conducted in order to investigate the relevance of some parameters, e.g. the relative position and flexural rigidity of the stiffener and the contribution from the flanges. Moreover the influence of the torsional rigidity of the longitudinal stiffener was investigated which led to that also closed longitudinal stiffeners were included in the study. The results from the numerical investigation were then used to modify the buckling coefficient regarding unstiffened webs, proposed in Lagerqvist (1994), see eq. (2.49), by adding a term, ksl, which took the contribution from the longitudinal stiffener into account (eq. (2.72)). This term was proposed as a function of the cross section of the stiffener (i.e. open or closed) and the panel aspect ratio of the upper (directly loaded) panel b1 / a.
(2.72)
The term ksl added the contribution from the longitudinal stiffener, taking the relative flexural rigidity of the stiffener into account and a factor, Co, which is through regression analysis dependent of the ratio b1 / a and the ratio torsional / flexural rigidity of the stiffener according to
(2.73)
Summing up the results from the regression analysis Graciano ended up in two expressions for the Co parameter, according to eq. (2.74) below. The first will normally be suited for open stiffeners and the second for closed section stiffeners.
kF 5 82 2 1hwa
------2
0 46bf tf
3
hw tw3
----------------4 ksl+,+,+,=
ksl Co st=

Plate Buckling - Theory
39
(2.74)
However, the eq. (2.74) was concluded to only be valid if
(2.75)
and
(2.76)
Further, the relative flexural rigidity of the stiffener should, according to Graciano, not be taken larger than the transition rigidity, i.e. the rigidity for which the buckling mode of the web switches from lateral displacement stiffener to a stiffener acting as a nodal line regarding the out of plane web buckling. Thus, ksl is limited according to
(2.77)
in which st,t is the transition rigidity for open stiffeners (or st / st < 0,15) according to
(2.78)
or regarding closed stiffeners (or stiffeners with st / st > 0,15) according to
(2.79)
Graciano also states that these sets of equations were obtained with geometric interaction between the web plate and the longitudinal stiffener taken into account. Moreover, the equations also account for the transition from global to local buckling modes. The above described approach to determine the buckling coefficient for longitudinally stiffened webs under patch loading was, combined with the design proposal by Lagerqvist (1994), by Graciano named “Model III: Post-critical Resistance Approach”. This Model III was in Graciano (2002) proposed to be used for design purpose since it was found to be the most complete model available and with a good agreement with experimental comparison. Moreover, it was later somewhat modified and in EN 1993-1-5 the recommended design method to use for predicting the patch loading resistance of a longitudinally stiffened girder (see the section EN 1993-1-5below).
Co
5 44b1a----- 0 21,–,
6 51b1a-----,
=
st
st------ 0 15,
st
st------ 0 15,
0 05 b1 a 0 3,,
b1 0 3 hw,
ksl Co st t
st t 14 ahw------
2 9,211 0 3
b1a-----–,+=
st t 45 ahw------
1 3,=
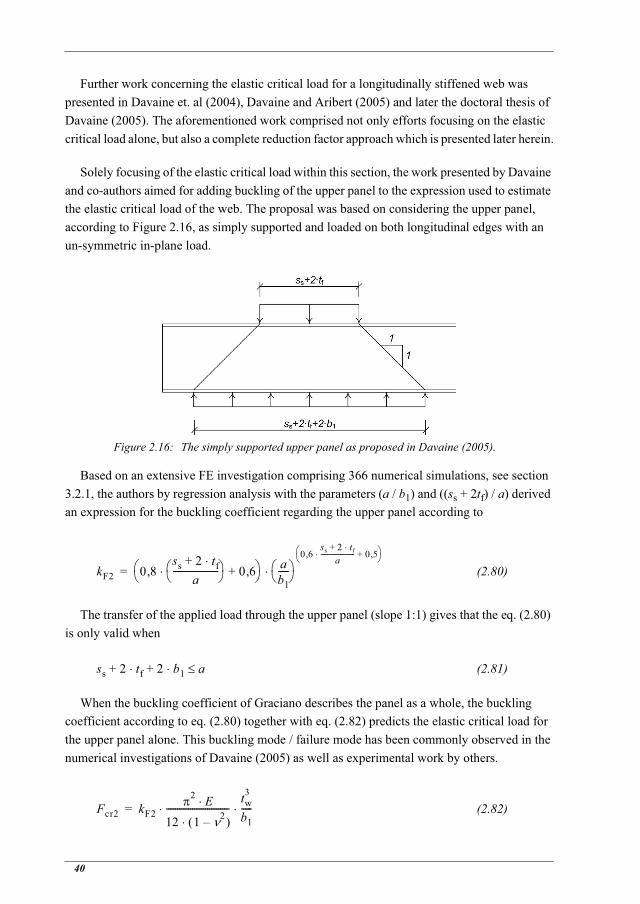
40
Further work concerning the elastic critical load for a longitudinally stiffened web was presented in Davaine et. al (2004), Davaine and Aribert (2005) and later the doctoral thesis of Davaine (2005). The aforementioned work comprised not only efforts focusing on the elastic critical load alone, but also a complete reduction factor approach which is presented later herein.
Solely focusing of the elastic critical load within this section, the work presented by Davaine and co-authors aimed for adding buckling of the upper panel to the expression used to estimate the elastic critical load of the web. The proposal was based on considering the upper panel, according to Figure 2.16, as simply supported and loaded on both longitudinal edges with an un-symmetric in-plane load.
Figure 2.16: The simply supported upper panel as proposed in Davaine (2005).
Based on an extensive FE investigation comprising 366 numerical simulations, see section 3.2.1, the authors by regression analysis with the parameters (a / b1) and ((ss + 2tf) / a) derived an expression for the buckling coefficient regarding the upper panel according to
(2.80)
The transfer of the applied load through the upper panel (slope 1:1) gives that the eq. (2.80) is only valid when
(2.81)
When the buckling coefficient of Graciano describes the panel as a whole, the buckling coefficient according to eq. (2.80) together with eq. (2.82) predicts the elastic critical load for the upper panel alone. This buckling mode / failure mode has been commonly observed in the numerical investigations of Davaine (2005) as well as experimental work by others.
(2.82)
kF2 0 8ss 2 tf+
a--------------------- 0 6,+, a
b1-----
0 6ss 2 tf+
a--------------------- 0 5,+,
=
ss 2 tf 2 b1 a++
Fcr2 kF2
2 E12 1 2–-----------------------------
tw3
b1-----=

Plate Buckling - Theory
41
Finally, Davaine and co-authors proposes an interaction formula for the two buckling modes according to
(2.83)
in which Fcr1 denotes the buckling load according to EN 1993-1-5 presented in following section. The interaction formulation was based on observations during incremental loading in the numerical simulations. Davaine and co-authors noticed that the response of the stiffened web was divided in two steps; the first corresponding to local buckling in the lower panel and the second local buckling of the upper panel until failure.
The reduction factor approach, used to predict the ultimate resistance of a longitudinally stiffened girder subjected to patch loading, all depends on the web slenderness as shown previously herein. Furthermore, within this section the two most recent publications on the topic is presented along with the recommendations of the EN 1933-1-5. The reduction factor approach by Graciano (2002) was modified to be implemented in the EN 1993-1-5 and hence the original proposal (aforementioned Model III) will not be regarded within this section.
DavaineAlong with the proposal of the improved estimation of the critical load, see eq. (2.82) and eq.
(2.83), a proposal for an improved reduction factor function was proposed in Davaine (2005). The reduction factor function was calibrated with the use of the extensive numerical simulations by Davaine, see section 3.2.1, and furthermore also justified through a comparison with experimental data gathered in the literature. Davaine proposed to use a function on the form of eq. (2.56) and eq. (2.57), hence the plateau length and the imperfection factor were calibrated to fit the numerical results. The parameters were determined to be set to F = 0,21 and 0F = 0,8. Furthermore, Davaine proposed to set the term m2 = 0 regarding the expression for the yield resistance. Emphasizing the origin of this parameter as the contribution from the web to the outermost plastic hinges in the 4-hinge model of Lagerqvist, Davaine observed a better correlation with the numerical results if the contribution from the web was omitted. Even though this was not the scope of the doctoral thesis, the questioned term could be disregarded without the whole concept failing. Recalling the previously described findings in Gozzi (2007) which proved that the m2-term should be neglected, further indicates that the assumption of Davaine was correct.
SeitzAnother approach for determining the ultimate patch loading resistance regarding a
longitudinally stiffened web was presented in Kuhlmann and Seitz (2002), (2004) and later refined and presented in the doctoral thesis Seitz (2005). The scope of this approach was to consider local buckling of each individual panel as well as global buckling of the whole stiffened web. The approach was motivated via the different load cases the two (considering a
1Fcr------- 1
Fcr1---------- 1
Fcr2----------+=

42
panel with only one stiffener) sub-panels are subjected to, i.e. “opposite patch loading” for the upper and “regular patch loading” for the lower. Further, the upper panel was expected to fail in a column buckling mode and the lower panel in a plate buckling mode with larger post-critical reserves, so Kuhlmann and Seitz drew the conclusion that the resistance of the stiffened girder would be possible to define by interpolation between the plate-like and the column-like behaviour.
By an experimental investigation and following numerical experiments Seitz presented interpolation functions used to determine the ultimate patch loading resistance as interpolated between the plate buckling resistance and the column buckling resistance.
EN 1993-1-5As previously mentioned, the design recommendations of EN 1993-1-5 is a modified version
of the Model III proposal of Graciano (2002). The procedure is rather straight forward and presented in short terms herein.
The patch loading resistance of the longitudinally stiffened web is predicted according to
(2.84)
with the yield resistance of the web determined as
< (2.85)
The parameters m1 and m2 are calculated according to
(2.86)
and according to eq. (2.53)
The slenderness ratio, F is as usual determined according to eq. (2.35), i.e.
with the critical load according to
FR F Fy=
Fy fyw tw ss 2 tf 1 m1 m2+++= fyw tw a
m1fyf bffyw tw-----------------=
m2 0 02hwtf
------2
,= if F 0 5,
m2 0= if F 0 5,
FFyFcr-------=

Plate Buckling - Theory
43
(2.87)
So forth the proposal of Lagerqvist is followed, however to take the influence of the longitudinal stiffener into account, the modified version proposed by Graciano (2002) is used in EN 1993-1-5 according to
(2.88)
in which the relative flexural rigidity of the longitudinal stiffener is calculated with
(2.89)
where the second moment of area of the stiffener, Ist, is including contributing parts of the web according to Figure 1.2. According to EN 1993-1-5 eq. (2.88) is valid for and . Last but not least, the reduction factor is obtained by using the eq. (2.52), i.e.
The attentive reader may here notice the differences in the original proposals of Lagerqvist (1994) and Graciano (2002).
2.3.3. Interaction with bendingWhen loading a girder, e.g. simply supported, with some load between the supports it
inevitably also subjects the girder to bending moment. The case of patch loading is not an exception to this. Hence, researchers has over the years proposed different models to take this into account. Usually with an interaction model based on individual resistance models, i.e. the patch loading resistance and the bending moment resistance, treated as individual phenomena but interacting on basis of the interaction equation. This also implies that the interaction model used would be the same disregarding of the web is stiffened or not.
One of the earlier contemporary interaction models was presented in Bergfelt (1971) who proposed
(2.90)
However in a later publication, Bergfelt (1976), the author states that no interaction between patch loading and bending moment seems to be present when ME / MR < 0,6.
Fcr 0 9 k, F Etw3
hw------=
kF 6 2+hwa
------2
5 44b1a----- 0 21,–, st+=
st 10 9Ist
hw tw3
---------------- 13 ahw------
3210 0 3
b1a-----–,+,=
0 05 b1 a 0 3,,b1 hw 0 3,
F F0 5,
F------- 1=
FEFR------
8 MEMR--------
21=+

44
Moving on to the into the 90’s, the publication Lagerqvist (1994) proposed two interaction equations; one for welded girders, eq. (2.91) and one regarding rolled beams, eq. (2.92) according to
(2.91)
(2.92)
and in EN 1993-1-5, the first equation of these two are recommended for design purposes.
2.4. Summary of the theoretical reviewAs seen, a lot of effort has been put into the issues concerning plate buckling related ultimate
resistance. This both regarding plates under uniformly distributed compressive stresses as well as unevenly distributed, herein focused on patch loading. Many different proposals have been made on how the ultimate resistance should be predicted in the most precise way, both with respect to theory as well as experimental observations and numerical simulations. As mentioned earlier, the presence of initial imperfections such as residual stresses from welding and geometric imperfections may reduce the theoretically determined resistance greatly. This has been handled by using experiments as reference and develop semi-empirical resistance models.
The today recommended design models in the EN 1993-1-5 has been presented herein, and the author will use these as a reference to the work presented in the following chapters. Furthermore, the work presented by Gozzi (2007), Graciano (2002) and Davaine (2005) will be used. The latter two as reference to the herein proposed resistance approach since both of them are focused on the ultimate patch loading resistance for a longitudinally stiffened web. The author of this thesis also find the work presented by Seitz (2005) interesting, however shortcoming in the german language of the author herein makes the interpretation of the model difficult and moreover very uncertain. Hence, no comparisons with this proposed approach will be conducted herein.
FEFR------ 0 8
MEMR--------, 1 4,=+
FEFR------
2 MEMR--------
21=+

Patch Loading - Test Results
45
Chapter 3:
Patch Loading - Test Results
All since the 1950’ies experimental work focused on which and how the parameters of a welded I-girder influences the patch loading resistance has been investigated. One of the more internationally known early publications, considering longitudinally stiffened girder webs, would by many researchers said to be the work of Allan Bergfelt in the end of the 70’ies and the beginning of the 80’ies. The publication Rockey et. al (1978), with Bergfelt as co-author was the start of an extensive investigation with many experimental tests. Bergfelt (1979) and Bergfelt (1983) were continuing the previously conducted work. One of the larger, if not the largest, test series was presented in Janus et. al (1988) which presented a test programme comprising over 150 individual specimens, both stiffened and unstiffened.
In 1990 Dubas and Tschamper presented an investigation comprising also closed longitudinal stiffeners. These stiffeners has a higher torsional stiffness and so forth also in many cases a more favourable type of stiffener to use for web stiffening. The work in Dubas and Tschamper (1990) used webs with open stiffeners as a reference to the V-shaped closed stiffener specimens.
From open stiffeners and via V-shaped stiffeners, Carretero and Lebet in 1998 presented a series of tests with girders stiffened with closed stiffeners of trapezoidal (TRP) type. The TRP-type stiffeners are probably the most used today when a longitudinal stiffener is applied to e.g. a bridge girder. More tests on specimens reinforced with TRP-stiffeners was presented in Walbridge and Lebet (2001) and Kuhlmann and Seitz (2004). The latter also included FE simulations verified via the experimental work and in Seitz (2005) proposals were made for an improved design procedure (see section 2.3.2).
An extensive FE investigation into longitudinally stiffened girder webs was presented in Davaine (2005). The work was focused on improving design codes and the proposals for improved design is presented in section 2.3.2.
Within this thesis, some of the experimental work presented by some of the aforementioned authors and more has been used to evaluate the EN 1993-1-5 patch loading resistance

46
recommendations. In Table 3.1 below the data used and its origin is presented as well as some of the characteristics of the specimens used in the experiments. A total of 140 specimens with open longitudinal stiffeners, 24 with closed stiffeners and 366 FE simulations were gathered surveying the literature. The authors’ publications in which the test data and/or simulations were presented is briefly described in this chapter.
The gathered data was in a first step evaluated with respect to EN 1993-1-5. However, the current limitations in EN 1993-1-5 was not followed in here, i.e. the validation statements regarding eq. (2.88) was not taken into account.
Table: 3.1: Characteristic data from the experiments and simulations gathered from the published material introduced within this chapter.
3.1. Patch loading experiments on longitudinally stiffened girders
3.1.1. Rockey et. al (1978)During the first half of 1977 Rockey and Bergfelt made the first test in, what was to be, an
extensive investigation regarding longitudinally stiffened webs behaviour under patch loading. The test series “R” comprised 8 ultimate load tests on a total of four specimens and was presented in Rockey et. al (1978). Half of the test series was conducted on unstiffened girders used as reference to the other half which was fitted with open longitudinal stiffeners welded on to the webs. The four specimens were in other means identical, except differences in the flange dimension. The purpose of the experimental work was to investigate the influence of the longitudinal stiffener upon the ultimate patch load resistance. The tests were carried out in such
Author No. of tests Open / Closed stiffener
a / hw h1 / hw ss / hw
Rockey et. al (1978) 4 Open 1,00 0,20-0,21 0,05
Bergfelt (1979) 9 Open 0,75-3,24 0,20 0,05-0,06
Bergfelt (1983) 6 Open 1,50-4,08 0,20-0,34 0,05-0,16
Galea et. al (1987) 2 Open 1,40 0,21-0,26 0,54
Shimizu et. al (1987) 1 Open 1,00 0,20 0,30
Janus et. al (1988) 101 Open 1,00-2,00 0,10-0,50 0,10-0,20
Dubas and Tschamper (1990) 24 12 Open12 V-shape 1,76-2,48 0,15-0,20 0,04-0,24
Dogaki et. al (1990) 2 Open 1,00 0,20 0,10
Carretero and Lebet (1998) 6 6 TRP-shape 1,31-2,25 0,20-0,38 0,25-0,38
Walbridge and Lebet (2001) 5 3 Open2 TRP-shape 1,43 0,11-0,23 0,29
Kuhlmann and Seitz (2004) 4 4 TRP-shape 2,00 0,25-0,30 0,58
Davaine (2005) (FEA) 366 Open 1,33-4,00 0,10-0,40 0,20-1,00

Patch Loading - Test Results
47
a way that every girder was tested twice; the girder was after the first test turned so the patch load could be applied on the undamaged flange.
Test setupThe two girders R2 and R4 was fitted with longitudinal stiffeners during the first set of tests
and hence used in the evaluation in this thesis. The other two girders (R1 and R3) tested in Rockey et. al (1978) were also equipped with longitudinal stiffeners, but this only after the first set of tests in which these were tested as unstiffened. In the following tests the girders R1 and R3 were fitted with longitudinal stiffeners but in the tension zone. This in an attempt to reduce the influence of the fact that the girders already had been loaded to failure due to the patch load. The same procedure was followed concerning the stiffened girders R2 and R4. These were also stiffened with an additional longitudinal stiffener in the new compression zone and the old damaged part was now on the tension side of the girder. The exact dimensions of these four tests on two girders may be found in Appendix A.
The tests were made with the girders simply supported and the patch load applied in the centre of the flange. Strains were measured with rosette gauges, lateral deformations, initial as well as during the tests, were also measured. Vertical deformation on both flanges of the girders was measured in the centre of the specimens with transducers.
Test results and conclusionsThe test results from Rockey et. al (1978) has here been evaluated with respect to EN 1993-
1-5 (Figure 3.1 below).
Figure 3.1: The four tests on two girders with open stiffeners from Rockey et. al (1978) evaluated with respect to EN 1993-1-5. Fexp/Fy as a function of the slenderness, F.
0 1 2 3 4 5Slenderness, F
0
0.4
0.8
1.2
F exp
/Fy
Rockey et. al (1978)EN 1993-1-5

48
The main conclusion in Rockey et. al (1978) was that it was shown that by using a longitudinal stiffener positioned at one-fifth of the web depth, the patch loading resistance could be significantly increased.
3.1.2. Bergfelt (1979)The work initiated in Rockey et. al (1978), described in section 3.1.1, was with Bergfelt
(1979) taken a step further. In this publication two new test series (series “A” and “B”) were accompanying the previously tested series “R” presented earlier.
Test setupTest series “A” was intended to investigate the influence of a distance variation between
vertical stiffeners for both unstiffened and longitudinally stiffened girders. The series comprised a total of 3 girders which was first tested unstiffened. After the first test a longitudinal stiffener of open type was welded to the web and the same girder was tested once again, though rotated so the patch load was applied on what was the tension flange when unstiffened. The girder was then sectioned into two girders with a length between 510 and 1200 mm, cutting away approximately 700 mm of the mid part (i.e. what was defined as the damaged part from the previous patch loading). As a last step these smaller girders were equipped with vertical stiffeners at the ends and tested two times (i.e. one test with the patch load applied on each flange).
Initial out-of-plane deformations were measured with transducers as well as the propagating buckling during the tests.
Test results and conclusionsThe conclusions drawn in Bergfelt (1979) were summarized in three sections. First, the load
bearing capacity regarding patch loading on a girder with a slender web was increased through the usage of a longitudinal stiffener. Second, the author concluded that the prediction of the failure load is strongly dependent of the distance between the outermost formed plastic hinges in the loaded flange. At last, Bergfelt concluded that the three-hinge-flange theory that was used for the evaluation of the test results was very approximative, though giving a fair picture of the beam behaviour immediately before failure. However, Bergfelt opinion was that this model had to undergo some corrections before being used for quantitative calculations.
A total of nine tests on longitudinally stiffened girders were conducted and these tests were evaluated with respect to the EN 1993-1-5 and may be found below in Figure 3.2. Furthermore, the publication presented the test series “B” which comprised a total of 9 tests on unstiffened girders. Though, these tests were not regarded herein because of the unstiffened webs.

Patch Loading - Test Results
49
Figure 3.2: The nine tests on girders with open stiffeners from Bergfelt (1979) evaluated with respect to EN 1993-1-5. Fexp/Fy as a function of the slenderness, F.
3.1.3. Bergfelt (1983)As an extension to the previously described tests in Bergfelt (1979) the author in Bergfelt
(1983) presented six additional tests aiming to clarify some results and give a better basis for calculations.
Test setupA single sided open stiffener with varying upper panel depth were used on all the six tests
presented in this publication. The specimen layout and test set-up used were the same as presented in section 3.1.2 also the same procedure in specimen fabrication was used (i.e. dividing of one main girder into two smaller). The two main specimens had a panel length, a,of 3000 mm and the four other smaller specimens panel lengths of 1100 mm. The longitudinal stiffeners were placed at either h1 / hw = 0,2 or 0,34. The rest of the specimen dimensions may be seen in Appendix A.
Test results and conclusionsThe main conclusion in the publications concerning these new tests was that placing the
stiffener closer to the loaded flange had a larger beneficial influence on the patch loading resistance.
The six specimens used herein were evaluated with respect to EN 1993-1-5 and the results may be found in Figure 3.3.
0 1 2 3 4 5Slenderness, F
0
0.4
0.8
1.2
F exp
/Fy
Bergfelt (1979)EN 1993-1-5

50
Figure 3.3: The six additional specimens from Bergfelt (1983) evaluated with respect to EN 1993-1-5. Fexp/Fy as a function of the slenderness, F.
3.1.4. Galea et. al (1987)The work presented in Galea et. al (1987) was an investigation into how the presence of
bending moments and a longitudinal stiffener would influence the patch loading resistance. Moreover the position of the stiffener and possible changes in the resistance was investigated. The authors presented a test series consisting of four test girders; two stiffened and two without any longitudinal stiffeners. Three of the experiments were performed with extra long span to achieve the required amount of bending moment to investigate the interaction patch loading - bending moment.
Test setupThe specimens used in the experimental work all had the same dimensions and the only
difference was the presence of an open longitudinal stiffener on two of the girders (P2 and P3). These two girders are the ones used herein for further evaluation. The yield stress measured to be between 244 - 286 MPa. Further information about dimensions and material properties may be found in Appendix A.
The two specimens R2 and R3 were tested with an extra applied moment, or if put in another way, with extra span; a total length of 15,4 m. The setup was of three-point bending type; the beam simply supported with an external concentrated force applied at the centre of the beam. The patch load was applied with a loading device consisting of four rollers spread over a load length of 690 mm. As for the tests described in Shimizu et. al (1987) these tests were made with specimens with extension girders to reach the required span regarding bending moment. The
0 1 2 3 4 5Slenderness, F
0
0.4
0.8
1.2F e
xp/F
y
Bergfelt (1983)EN 1993-1-5

Patch Loading - Test Results
51
girders were prevented from lateral rotation, i.e. no risk for lateral-torsional buckling of the beam.
The instrumentation in the test series comprised out-of-plane deflection measurement on points situated in the vincinity of the centre-line of the beam. Measurements were made on both surfaces of the web. Moreover, vertical deflection was measured with transducers placed on the top and bottom flange. Strains were measured with rosette gauges, as well as uni-axial gauges, on the web, the flanges and the transversal and longitudinal stiffeners.
Test results and conclusionsThe two herein regarded girders R2 and R3 failed at loads of 720 and 730 kN respectively.
These loads accompanied with the dimensions of the specimens were used to evaluate the tests with respect to EN 1993-1-5 and is shown in adjacent Figure 3.4. EN 1993-1-5 underestimates the patch load resistance with approximately 50%.
Figure 3.4: Girders R2 and R3 from Galea et. al (1987) evaluated with respect to EN 1993-1-5. Fexp/Fy as a function of the slenderness, F.
The main conclusions by the authors were that the longitudinal stiffener increased the ultimate load with approximately 37%. Furthermore, the authors concluded that the position of the stiffener (i.e. at 1/4th or 1/5th of the depth) did not have any significant influence on the load carrying capacity.
3.1.5. Shimizu et. al (1987)In Shimizu et. al (1987) the authors presented a study comprising tests of 10 specimens
reinforced with one to three longitudinal stiffeners of open type.The aim of the study was to clarify the buckling or collapse behaviour of stiffened web panels during a simulated launching
0 1 2 3 4 5Slenderness, F
0
0.4
0.8
1.2
F exp
/Fy
Galea et. al (1987)EN 1993-1-5
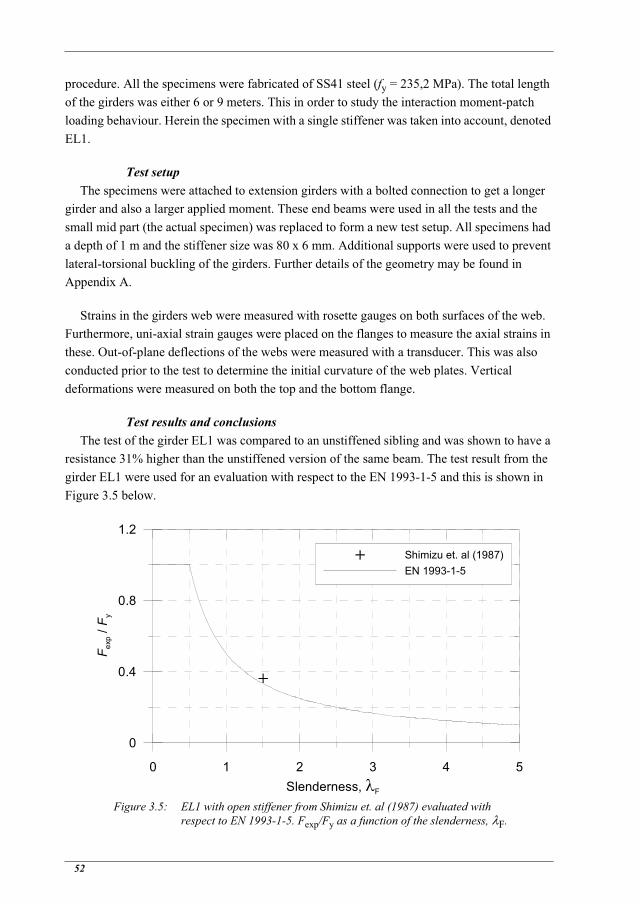
52
procedure. All the specimens were fabricated of SS41 steel (fy = 235,2 MPa). The total length of the girders was either 6 or 9 meters. This in order to study the interaction moment-patch loading behaviour. Herein the specimen with a single stiffener was taken into account, denoted EL1.
Test setupThe specimens were attached to extension girders with a bolted connection to get a longer
girder and also a larger applied moment. These end beams were used in all the tests and the small mid part (the actual specimen) was replaced to form a new test setup. All specimens had a depth of 1 m and the stiffener size was 80 x 6 mm. Additional supports were used to prevent lateral-torsional buckling of the girders. Further details of the geometry may be found in Appendix A.
Strains in the girders web were measured with rosette gauges on both surfaces of the web. Furthermore, uni-axial strain gauges were placed on the flanges to measure the axial strains in these. Out-of-plane deflections of the webs were measured with a transducer. This was also conducted prior to the test to determine the initial curvature of the web plates. Vertical deformations were measured on both the top and the bottom flange.
Test results and conclusionsThe test of the girder EL1 was compared to an unstiffened sibling and was shown to have a
resistance 31% higher than the unstiffened version of the same beam. The test result from the girder EL1 were used for an evaluation with respect to the EN 1993-1-5 and this is shown in Figure 3.5 below.
Figure 3.5: EL1 with open stiffener from Shimizu et. al (1987) evaluated with respect to EN 1993-1-5. Fexp/Fy as a function of the slenderness, F.
0 1 2 3 4 5Slenderness, F
0
0.4
0.8
1.2
F exp
/Fy
Shimizu et. al (1987)EN 1993-1-5

Patch Loading - Test Results
53
From the experimental work presented the authors drew the conclusions that a smaller span length increases the maximum loads. Furthermore a wider launching shoe (load length) was also concluded to be beneficial concerning the patch load resistance.
3.1.6. Janus et. al (1988)One of the most comprehensive studies based on experimental work was presented during
the late 80-ies by Janus et. al (1988). A total of 152 tests on steel girders under patch loading were made. The specimens were of unstiffened type as well as longitudinally stiffened with single- and double-sided open stiffeners. A total of 101 specimens were of stiffened model, hence also used for the evaluation herein.
The authors’ aims for the study was to achieve a general understanding regarding the behaviour of a longitudinally stiffened steel girder subjected to patch load and possible differences between the stiffened and unstiffened types. Furthermore the influence of the stiffener rigidity was examined with respect to any correlation to the patch loading resistance. Moreover the position of the stiffener and the influence of changes in this parameter was investigated.
Test setupThe test series was divided into four sets in which different parameters and their influence
on the ultimate patch loading capacity was examined. The parameters/quantities varied throughout the test series were the position of the longitudinal stiffener (i.e. b1), the size of the stiffener, the height-to-thickness ratio of the web (i.e. hw / tw), the aspect ratio of the web (a / hw) and the size of the loaded flange. All of the dimension and material characteristics of the 101 stiffened specimens used in this evaluation is listed in Appendix A. During all the tests the ratio load length / panel length (ss / a) was held equal to 0,1.
The setup of the tests were of three-point type with the girder simply supported and the patch load applied in the beam centre. Strains were measured on a number of positions on both the web and the longitudinal stiffener. Displacement out-of-plane concerning the web buckling as well as vertical deformation of both flanges and the longitudinal stiffener were measured with electrical transducers. Furthermore the initial curvature of the web was measured prior to the test on all specimens.
Test results and conclusionsJanus et. al (1988) concluded that all of the test girders failed with a segmental plastic hinge
line under the patch load in the web and three point plastic hinges were also developed in the loaded flange. The authors’ also concluded that the presence of a longitudinal stiffener substantially increased the patch loading resistance only if the stiffener was located in the vincinity of the loaded flange with b1 / hw < 0,25. Furthermore the tests presented in Janus et. al (1988) led to the establishment of a patch loading resistance model of the amplification factor type, i.e. eq. (2.63).
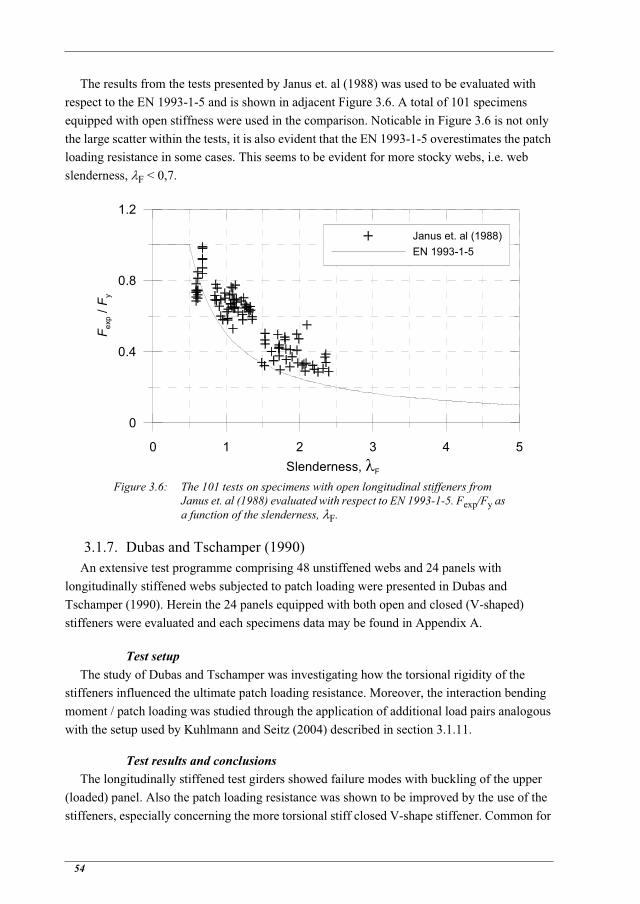
54
The results from the tests presented by Janus et. al (1988) was used to be evaluated with respect to the EN 1993-1-5 and is shown in adjacent Figure 3.6. A total of 101 specimens equipped with open stiffness were used in the comparison. Noticable in Figure 3.6 is not only the large scatter within the tests, it is also evident that the EN 1993-1-5 overestimates the patch loading resistance in some cases. This seems to be evident for more stocky webs, i.e. web slenderness, F < 0,7.
Figure 3.6: The 101 tests on specimens with open longitudinal stiffeners from Janus et. al (1988) evaluated with respect to EN 1993-1-5. Fexp/Fy as a function of the slenderness, F.
3.1.7. Dubas and Tschamper (1990)An extensive test programme comprising 48 unstiffened webs and 24 panels with
longitudinally stiffened webs subjected to patch loading were presented in Dubas and Tschamper (1990). Herein the 24 panels equipped with both open and closed (V-shaped) stiffeners were evaluated and each specimens data may be found in Appendix A.
Test setupThe study of Dubas and Tschamper was investigating how the torsional rigidity of the
stiffeners influenced the ultimate patch loading resistance. Moreover, the interaction bending moment / patch loading was studied through the application of additional load pairs analogous with the setup used by Kuhlmann and Seitz (2004) described in section 3.1.11.
Test results and conclusionsThe longitudinally stiffened test girders showed failure modes with buckling of the upper
(loaded) panel. Also the patch loading resistance was shown to be improved by the use of the stiffeners, especially concerning the more torsional stiff closed V-shape stiffener. Common for
0 1 2 3 4 5Slenderness, F
0
0.4
0.8
1.2
F exp
/Fy
Janus et. al (1988)EN 1993-1-5

Patch Loading - Test Results
55
the panels was that the relative position of the stiffeners, h1 / hw, concerning the closed stiffeners was kept constant at 0,2. Regarding the open stiffeners the ratio b1 / hw was 0,15 or 0,2.
The 24 tests used in the evaluation herein were evaluated with respect to EN 1993-1-5 and the results may be found in Figure 3.7. The results in plotted Figure 3.7 all points out an underestimation of the patch loading resistance when calculating according to the EN 1933-1-5. Generally speaking, it seems to be more evident for the closed section stiffened panels than for the ones equipped with open stiffeners.
Figure 3.7: The 24 experiments from Dubas and Tschamper (1990) evaluated with respect to EN 1993-1-5. Fexp/Fy as a function of the slenderness,
F.
3.1.8. Dogaki et. al (1990)Plate girders reinforced with longitudinal stiffeners and subjected to patch loading was the
focus in Dogaki et. al (1990). The work presented in the publication was a part of a wider patch loading investigation regarding stiffened and unstiffened girders. In Dogaki et. al (1990) experimental work comprising three girders, two stiffened and one without stiffener, was presented. The paper presented the ultimate load tests from the three girders as well as comparison with theoretical approaches to predict the failure loads presented by other authors.
Test setupThe test specimens which were equipped with a longitudinal stiffener (model 4 and model 5)
had an open stiffener of thickness 4,5 mm. The width of the stiffener was 30 and 38 mm respectively. The other dimensions was nominally the same, but the measured values may be viewed in Appendix A.
0 1 2 3 4 5Slenderness, F
0
0.4
0.8
1.2
F exp
/Fy
Dubas and Tschamper (1990) (OS)Dubas and Tschamper (1990) (CS)EN 1993-1-5

56
The test setup was of simply supported type with the patch load applied in the centre of the girder. Lateral rotations were prevented by supports at the sides of the beam, as well as with help of the hydraulic jack used for application of the load.
Numerous strain gauges of uniaxial and rosette type were used to monitor and measure the developing strains during the tests. The strains were measured on both flanges and in the web (with rosette gauges). Furthermore, the vertical displacement was measured at both upper and lower flange at the centre of the span. The out-of-plane deformations of the web was also measured with transducers.
Test results and conclusionsThe ultimate patch load of the model 4 and model 5 was reached at approximately 105 and
110 kN respectively. These experimental loads was with the specimen dimensions evaluated with respect to EN 1993-1-5 and presented in Figure 3.8 below. As may be seen, the EN 1993-1-5 somewhat underestimates the resistance, however not by more than approximately 30%.
Dogaki et. al (1990) concluded that the post-critical strength of longitudinally stiffened girder under patch loading was remarkable. Moreover, the buckling of the web was all localized to the upper panel and the longitudinal stiffeners seemed to be stiff enough to form a nodal line for the out-of-plane deformation of the web. As for the comparison of the theoretical models three predictions out of four were underestimating the ultimate load. These when comparing with the models of Janus et. al (1988) and a model previously developed by the authors of Dogaki et. al (1990).
Figure 3.8: The two specimens from Dogaki et. al (1990) evaluated with respect to EN 1993-1-5. Fexp/Fy as a function of the slenderness, F.
0 1 2 3 4 5Slenderness, F
0
0.4
0.8
1.2
F exp
/Fy
Dogaki et. al (1990)EN 1993-1-5

Patch Loading - Test Results
57
3.1.9. Carretero and Lebet (1998)In Carretero and Lebet (1998) an investigation of the behaviour of slender webs subjected to
patch loads was presented. The results of an experimental investigation were compared to four different resistance models; a model presented in Dubas and Tschamper (1990), a swiss design norm named SIA 161, the patch load resistance model by Lagerqvist (1994) and the modified model in EN 1993-1-5 described in section 2.3.2.
Test setupA total of 6 composite beams were tested under a concentrated load. Concerning the study
presented herein, 6 of the panels in the beams were longitudinally stiffened with a TRP stiffener and furthermore used in the evaluation. The dimensions of the specimens may be found in Appendix A.
Test results and conclusionsA general conclusion of the comparison was that all four models seemed to give conservative
predictions of the patch load resistance, however the model by Lagerqvist (1994) was concluded to be the best prediction model and the modified resistance model in EN 1993-1-5 gave predictions approximately 25% more conservative. Furthermore, Carretero and Lebet concluded that longitudinal stiffening of slender girder webs increased the patch load resistance with approximately 25 - 60% dependent of the placing of the stiffener (i.e. the depth of the upper panel, b1). The test results regarded in this thesis were evaluated according to EN 1993-1-5 and presented in Figure 3.9.
Figure 3.9: The 6 panels with a closed stiffener from Carretero and Lebet (1998) evaluated with respect to EN 1993-1-5. Fexp/Fy as a function of the slenderness, F.
0 1 2 3 4 5Slenderness, F
0
0.4
0.8
1.2
F exp
/Fy
Carretero and Lebet (1998)EN 1993-1-5

58
As shown in Figure 3.9 the actual patch loading resistance, Fexp, compared to EN 1993-1-5, FR, was up to 2,2 times the predicted load. However, a large scatter between the 6 tests may be seen.
3.1.10.Walbridge and Lebet (2001)The experimental work presented in Walbridge and Lebet (2001) consists of tests of a total
of 6 specimens; two fitted with a closed TRP-shaped longitudinal stiffener, three with an open stiffener and one girder was unstiffened as reference to the stiffened ones. The girders were made as composite beams with a lower flange reinforced with concrete according to Figure 3.10. Herein the results from the five stiffened girders will be taken into account for further evaluations.
Figure 3.10: The cross-section layout of the specimens tested in the experimental investigation presented in Walbridge and Lebet (2001).
Test setupThe tests setup was made with the intention to simulate the launching of a bridge girder with
the concrete already cast on the flange. The loaded length of the upper flange was held constant for all tests, i.e. 200 mm and the web depth was in all cases 700 mm over a panel length of 1000 mm. The longitudinal stiffeners were placed that the depth of the upper panel was 75, 100 or 125 mm. The complete list of dimensions and some material properties of the specimens may be found in Appendix A.
Test results and conclusionsWalbridge and Lebet (2001) concluded that the torsional stiffness of the closed stiffeners was
capable to restrict the out-of-plane deformations of the web in a more efficient way then compared to the open type with less torsional stiffness. Using the TRP-stiffener at 75 mm distance from the upper flange increased the ultimate patch loading resistance with 64% compared to the unstiffened reference girder meanwhile an open stiffener at the same position increased the resistance by 31% only.

Patch Loading - Test Results
59
The results from Walbridge and Lebet (2001) was evaluated with respect to EN 1993-1-5 and are shown in Figure 3.11. Noticeable is the high resistance when compared to the one predicted by EN 1993-1-5.
Figure 3.11: The five specimens from Walbridge and Lebet (2001) evaluated with respect to EN 1993-1-5. Two specimens with closed stiffener and 3 with an open stiffener. Fexp/Fy as a function of the slenderness, F.
3.1.11.Kuhlmann and Seitz (2004)Girders reinforced with closed section stiffeners subjected to patch loading was the topic in
Kuhlmann and Seitz (2004). Experimental work as well as FE simulations were conducted with the aim of improving design methods for predicting the ultimate patch load capacity. Larger loading lengths than most of the researchers investigated previously were used to fill this gap in knowledge. Pure patch loading was examined as well as the interaction of patch loading and a larger bending moment. The results from the experimental work comprising a total of 7 tests on 5 girders were evaluated and used to verify the FE simulations.
Test setupThe test series consisted of 3 smaller girders with a span of 2,4 m and two larger specimens
with a length of 9,6 m. The latter was used for introducing bending moment high enough to examine the patch loading - bending moment interaction. All of the girders except one had longitudinally stiffened webs. All stiffeners were of closed TRP type. Furthermore, two of the patch loading tests were made on panels with two longitudinal stiffeners. The test setup and the loading frame is schematically described in Figure 3.12. The girders with a single longitudinal stiffener were used in the evaluation herein and the dimensions and other characteristics of these girders used in the evaluation herein may be found in Appendix A.
0 1 2 3 4 5Slenderness, F
0
0.4
0.8
1.2
F exp
/Fy
Walbridge and Lebet (2001) (OS)Walbridge and Lebet (2001) (CS)EN 1993-1-5

60
Figure 3.12: The test setup used for the patch loading experiments with “extra” applied moment. The load pair denoted “Q” used to introduce a higher bending moment. Kuhlmann and Seitz (2004).
Kuhlmann and Seitz measured out-of-plane web deformations, initial as well as growth during loading, on a grid consisting of 23 x 15 measuring points. The vertical displacement was also measured, in this case with a pair of transducers in each of the four loading points. Hence vertical deflection was measured in 4 points on both side of the loading rig. Strains were measured with uniaxial, as well as rosette gauges. The rosette gauges were applied on both sides on the web and the uniaxial gauges were used to measure the axial strains in the flanges.
Test results and conclusionsIn Kuhlmann and Seitz (2004) it was concluded that by the use of a closed longitudinal
stiffener the patch loading resistance could be substantially increased. The authors showed that with a TRP stiffener positioned at the patch load resistance increased with about 56% when compared to an unstiffened girder. At the increase was somewhat lower, about 44%. However, using two stiffeners increased the patch loading resistance even more; about 86% higher resistance when comparing to the unstiffened case the authors concluded.
Concerning the patch loading - bending moment interaction, the authors could not observe any significant differences in the patch load resistance when applied under a bending moment. Only when the combination bending, shear and patch load was examined, a reduction in the patch load resistance could be noticed.
Regarding the evaluation of tests results herein, the four tests on girders with a single closed longitudinal stiffener were used. Two of these were tested with an extra applied bending moment. The patch loading resistance evaluated with respect to EN 1993-1-5 is shown in Figure 3.13.
h1 0 25 hw,=h1 0 3 hw,=

Patch Loading - Test Results
61
Figure 3.13: Four specimens with a closed longitudinal stiffener from Kuhlmann and Seitz (2004) evaluated with respect to EN 1993-1-5. Fexp/Fy as a function of the slenderness, F.
3.2. Numerical simulations
3.2.1. Davaine (2005)In 2005 an extensive study based on numerical FE simulations was presented in the doctoral
thesis of Davaine (2005). The study was focused on steel girders with deep webs, e.g. up to 5 m. The aim of the study was to justify the approach in EN 1993-1-5 also for longitudinally stiffened girders with webs this deep. The author found that the experimental data presented by other researchers mainly comprised specimens with girder depths up to 1,2 m. The work presented in Davaine (2005) was based on the findings from simulations on 366 specimens with different geometries, listed in Appendix A, however all of the girder webs were reinforced with a stiffener with open cross-section. The FE-model was validated with respect to results from previously tested girders. Not only patch loading was investigated, but also the interaction of patch loading - bending moment.
The FE-simulations was first used to re-formulate the critical load Fcr as stated in EN 1993-1-5. In a second step, the resistance function was calibrated, some of these findings are presented in section 2.3.2. Furthermore, the proposals were calibrated with the statistical procedure described in Annex D of EN 1990 (2002).
Within this thesis the 366 simulations were used to be evaluated and the evaluation with respect to EN 1993-1-5 is presented in Figure 3.14.
0 1 2 3 4 5Slenderness, F
0
0.4
0.8
1.2
F exp
/Fy
Kuhlmann and Seitz (2004)EN 1993-1-5

62
Figure 3.14: The 366 numerical simulations of Davaine (2005) evaluated with respect to EN 1993-1-5. Fexp/Fy as a function of the slenderness, F.
3.3. Summary of the experimental reviewSummarizing the conclusions from the previously conducted research work, the authors to
the above presented publications all seems to agree that adding a longitudinal stiffener to the web increases the patch loading resistance. If the stiffener if of closed type, this effect seems to be even larger due to the increased stiffness both with respect to out-of-plane bending and torsion. However, the actual gain of resistance using longitudinal stiffeners all depends on the girder cross-section, placement of the stiffener and the stiffener cross-section.
A total of 140 individual tests made on specimens with open longitudinal stiffeners were used in the evaluation herein. Comparing the test results with respect to the by EN 1993-1-5 predicted resistance in Figure 3.15, it seems like the majority of the tests are on the safe side. Nevertheless, some of the stockier tests ( ) by Janus et. al (1988) seems to be overestimated with respect to their resistance. Furthermore, the scatter amongst the individual tests by all the authors are noticable. Also, specimens with web slenderness, F > 2 would benefit from a raised reduction curve when looking into Figure 3.15.
Considering Figure 3.16 containing the 24 specimens with a closed stiffener type, all tests seems to be on the safe side of the reduction curve of EN 1993-1-5. Though, one test by Carretero and Lebet (1998) exactly coincides with the curve. However, it seems that the margin of safety regarding the prediction of EN 1993-1-5 seems to be rather high and moreover the tests also in this case seems to show a large scatter.
0 1 2 3 4 5Slenderness, F
0
0.4
0.8
1.2F e
xp/F
y
Numerical simulationsEN 1993-1-5
F 0 6,

Patch Loading - Test Results
63
Figure 3.15: The 140 specimens with open section longitudinal stiffeners. Ultimate experimental load, Fexp, compared to the EN 1993-1-5 recommended design procedure.
Figure 3.16: The 24 specimens with closed section longitudinal stiffeners. Ultimate experimental load, Fexp, compared to the EN 1993-1-5 recommended design procedure.
Regarding the numerical simulations by Davaine (2005) most of the 366 numerical simulations seems to keep together in a cluster, see Figure 3.17, though some simulations seems
0 1 2 3 4 5Slenderness, F
0
1
2
3F e
xp/F
R
Tests from literature (OS)EN 1993-1-5
0 1 2 3 4 5Slenderness, F
0
1
2
3
F exp
/FR
Tests from literature (CS)EN 1993-1-5

64
to have much larger resistance than predicted by the EN 1993-1-5. Furthermore, regarding the simulations with a web slenderness, F > 1,5 the EN 1993-1-5 curve could have been raised to better coincide with the simulations.
Figure 3.17: The 366 numerical simulations with open section longitudinal stiffeners. Ultimate experimental load, Fexp, compared to the EN 1993-1-5 recommended design procedure.
All in all, the tests regarding both open and closed stiffeners together with the numerical simulations, could benefit from a modification of the resistance function, better shaped to fit the more slender specimens, i.e. the prediction of the ultimate patch loading resistance could be improved for more slender girders. Further, the scatter amongst the tests could possibly be reduced by a better estimation of the buckling load of the stiffened webs.
0 1 2 3 4 5Slenderness, F
0
1
2
3
F exp
/FR
Numerical simulationsEN 1993-1-5

Patch Loading - Design Proposal
65
Chapter 4:
Patch Loading - Design Proposal
The aim herein is to find a design approach for longitudinally stiffened girders subjected to patch loading consistent with the one proposed in Gozzi (2007) concerning unstiffened girders. This involves the yield resistance of the web, the elastic critical load to determine the slenderness of the web and as third component a reduction function to determine the reduction factor as a function of the slenderness. The basics of the reduction factor approach used to determine the ultimate patch loading resistance have been presented in chapter 2 along with proposals from other authors as well as the today recommended approach given in EN 1993-1-5.
The previously presented tests reported by other authors (see chapter 3) are used to validate the proposal. Hence, the herein proposed ultimate patch loading resistance model was validated using data from tests on girders with both open and closed sections stiffeners, as well as numerical simulations. Furthermore, this chapter also contains a comparison of the proposed model with the most recent published directly comparable models of Graciano (2002) and Davaine (2005). Also a comparison to the EN 1993-1-5 proposed approach to predict the ultimate patch loading resistance is conducted.
4.1. Yield resistanceAs stated in chapter 2, some of the work presented in Gozzi (2007) was focused on making
an improvement concerning the expression for the yield resistance. Emphasizing previously mentioned risen questions regarding the web contribution to the plastic resistance in the outermost hinges in the model by Lagerqvist (1994), Gozzi investigated if this criticism was justified.
The findings of the conducted research work of Gozzi concluded that the questioned part of the yield resistance expression should be neglected, i.e. the contribution from the web to the bending moment resistance of the outer plastic hinges should be omitted in the mechanism model. Furthermore, since the mechanism regarding an unstiffened web subjected to patch loading is profoundly the same as for a web longitudinally stiffened, the work by Gozzi should be applicable also regarding longitudinally stiffened girders and would not induce any direct

66
sources of resistance prediction issues. Moreover, in a historical perspective, some design codes e.g. EN 1995-1-5 have recommended use of the same equations for the yield resistance both for stiffened and unstiffened girders. Since this way of designing has been used it would be preferable, from a designers point of view, to maintain this correlated design recommendations, i.e. basically the same equations to use regardless to if the web is longitudinally stiffened or not. Hence, the expression in eq. (4.1) will herein be applied as the yield resistance of the longitudinally reinforced web subjected to patch loading.
(4.1)
However since the model is considering one panel subjected to patch loading, the effective loaded length ly, expressed in the brackets of eq. (4.1), is limited to the panel width a. Hence, the yield resistance will inhere be determined as
(4.2)
4.2. Elastic critical loadOne of the more debated and difficult parts to determine of the three in the resistance function
approach is probably the elastic critical load for the stiffened web. Nowadays there are a multitude of ways to determine the critical load, e.g. numerical methods, software solely developed to predict the critical load or, maybe most commonly used, by hand calculations using different models. As presented in section 2.3.2 the most recent work regarded herein on this topic was presented in Graciano (2002) and Davaine (2005). The work by Graciano was after some modifications implemented in EN 1993-1-5. However, the elastic critical load or buckling coefficient of Graciano only regarded the whole web panel. This was in Davaine (2005) further improved to also include a consideration of the critical load for the upper panel alone, eq. (2.82), using a buckling coefficient according to eq. (2.80). This critical load uses a theory based on a non-uniform opposite patch loading of the upper panel. Furthermore, the actual load distribution in the upper panel is assumed to be in on a 1:1 slope which leads to that
for the buckling coefficient to be valid, otherwise the usually present vertical stiffeners will carry a larger portion of the load and the results will be conservative. Davaine (2005) also stated that during the numerical simulations performed, an interaction behaviour between the two buckling modes was observed, i.e. the buckling mode described by the equations of Graciano / EN 1993-1-5 and the one regarding the upper panel of Davaine. However, the author of this thesis finds it hard to justify an elastic critical load, used for characterizing the slenderness of the web in the elastic region, determined as an interaction of two different buckling modes. The most intuitive way must, according to the author, be using the lowest of the two critical loads, i.e.
Fy fyw tw ss 2 tf 1fyf bffyw tw-----------------++=
Fy fyw tw ss 2 tf 1fyf bffyw tw-----------------++ fyw tw a=
ss 2 tf 2 b1 a++

Patch Loading - Design Proposal
67
(4.3)
in which the first is proposed to be calculated according to eq. (2.87) and the second according to the proposal of Davaine, i.e. eq. (2.82) and eq. (2.80).
4.3. Reduction functionAs previously stated, many different forms of reduction functions have over the years been
proposed and furthermore proven to be well suitable to use under certain circumstances. Though, since the reduction factor usually is determined as a function of the slenderness the calibration of these together are of great importance. Since a modified expression of the yield resistance (section 4.1), and furthermore accompanied with changes of the way to calculate elastic critical load according to section 4.2, was adopted, the reduction function has to be tuned to fit these new proposals. To achieve the aim of using the same reduction factor for both longitudinally stiffened and unstiffened girders as historically done, the work presented in Gozzi (2007) was investigated as a solution. This since the proposed reduction function on the form originally proposed by Müller (2003), already has been proven to be able to predict the ultimate resistance of unstiffened girders using the proposed modifications regarding the yield load. A proposal on the form of Müller has, due to the use of two modifiable parameters, a superior flexibility inherent compared to a function on the form of EN 1993-1-5, i.e. eq. (2.52).
The proposed function of Gozzi (2007) was calibrated using 184 patch loading experiments with unstiffened webs with induced bending moments according to ME / MR < 0,4. Furthermore, the limit of the reduction factor concerning stocky webs, i.e. with a slenderness lower than what is needed to reduce the resistance with respect to buckling, was chosen to be set to 1,2 instead of the usually used 1,0 of e.g. eq. (2.52). This was based on the fact that the more stocky specimens showed a resistance higher than the yield resistance and a better fit of the curve (prediction of the actual real behaviour) could be achieved in this way. However, the limitation of the reduction factor in the lower region of web slenderness would actually not be needed when compared to the experimental work presented in Gozzi (2007), though a bit unconventional. Nevertheless, the proposed reduction function for unstiffened girders, as presented in section 2.3.1, reads
with
Fcr minFcr1
Fcr2=
F1
F F2
F–+------------------------------------- 1 2,=
F12--- 1 0 5, F 0 6,– F++=

68
A comparison of the above presented resistance function with respect to some other usually used or historically famous may be studied in Figure 4.1.
Figure 4.1: Comparison of reduction curves, e.g. the Winter function, the herein proposed reduction function.
4.4. Proposal of design approachCollecting the three parts regarding the yield load, the critical load and the reduction factor
function a complete ultimate patch loading resistance approach may be stated. As mentioned earlier, the different parts have been proposed based on numerical simulations and/or comparisons with experimental work. Common for both approaches are that they are limited to comprise specimens, numerical as well as experimental, with properties spread over an interval. This interval is usually used as the interval for which one states the proposal to be valid over. However, inhere the limitations of previous research was disregarded if not directly violating statements in proposed equations or physical limitations concerning the specimen. Hence, based on the research of Gozzi (2007) the yield load will be calculated according to eq. (4.2).
Regarding the critical load, the lowest of the critical load for the whole panel and the upper panel is suggested to be used, i.e.
with Fcr1 according to EN 1993-1-5 and Graciano (2002) which states
0 1 2 3 4 5Slenderness,
0
0.4
0.8
1.2
1.6
Red
uctio
n fa
ctor
,
0,5 / 1 / 1 / 2
Winter functionProposal
Fcr minFcr1
Fcr2=

Patch Loading - Design Proposal
69
(4.4)
with the buckling coefficient for the whole stiffened web according to
(4.5)
with the influence from an open stiffener is calculated as
(4.6)
If the above stated addition to the buckling coefficient for the whole unstiffened web not should be given the possibility to be negative, i.e. the buckling coefficient for a stiffened web would be lower than the corresponding unstiffened, the following relation is needed
(4.7)
In EN 1993-1-5 this possibility is given, i.e. if the panel is wide enough it would be possible that the buckling coefficient for a stiffened panel would be lower than for an unstiffened with the same dimensions. To avoid this oddity, the buckling coefficient for the unstiffened panel is herein proposed as a lower bound for kF1. Hence, eq. (4.7) can be disregarded if the influence of the longitudinal stiffener is limited to
(4.8)
As for closed section stiffeners, the proposal of Graciano (2002) is proposed to be used herein.
(4.9)
Regarding the relative flexural rigidity of the stiffener, st, this is calculated as
(4.10)
Fcr1 0 9 k, F1 Etw3
hw------=
kF1 6 2+hwa
------2
kst+=
kst 5 44b1a----- 0 21,–, st=
b1a----- 0 21,
5 44,---------- 0 039,
kst 5 44b1a----- 0 21,–, st 0=
kst 6 51b1a-----, st=
stE IstD hw---------------=

70
with the moment of inertia of the stiffener, Ist, including the contributing parts of the web according to Figure 1.2. However, when regarding a longitudinal stiffener of open type the relative flexural rigidity is limited by the transition rigidity according to
(4.11)
At this point EN 1993-1-5 uses the limitation of the ratio b1 / a < 0,3, otherwise the last bracketed product in eq. (4.11) would be negative. However, inhere this aspect is disregarded and if b1 / a > 0,3 the transition rigidity is set to the first term, i.e.
(4.12)
Regarding closed section stiffeners, the statement for the transition rigidity of Graciano (2002) is kept to be calculated as
(4.13)
Regarding the elastic critical load for the upper panel, the only limit regarding dimensions of this proposal is governed here. The derived expression of Davaine (2005) is proposed to be used under the restriction that the responding length (loaded length) of the lower part of the upper panel has to be smaller than the actual panel width, that is
The buckling coefficient for the upper panel regarding panels with both types of stiffeners is proposed to be calculated in line with the work of Davaine, i.e. eq. (2.80) and eq. (2.82).
At last the yield load and the elastic critical load determines the slenderness of the stiffened web according to the von Kármán approach stated in eq. (2.35) and further determines the reduction factor according to eq. (2.58) and eq. (2.59).
4.5. Validation of the design proposalTo validate the proposed design procedure the data from the in chapter 3 presented
experimental work was used. However, four tests had to be excluded from the data base due to the restrictions of the load distribution in the upper panel. I.e. was not satisfied which may lead to that the vertical stiffeners would probably carry much of the applied
st st t, 13 ahw------
3210 0 3
b1a-----–,+=
st st t,
13 ahw------
3210 0 3
b1a-----–,+ if
b1a----- 0 3,
13 ahw------
3if
b1a----- 0 3,
=
st st t, 45 ahw------
1 3,=
ss 2 tf 2 b1 a++
ss 2 tf 2 b1 a++

Patch Loading - Design Proposal
71
load. Furthermore, the statement would probably be satisfied for most common dimensions of girders, hence excluding the tests TG1-1 to TG1-3 by Janus et. al (1988) and the EL1 of Shimizu et. al (1987) (see Appendix A) would not be detrimental to the design applicability. After removing these four tests, 136 specimens with open stiffeners, 24 test with closed stiffeners and 366 numerical simulations remains to be used in the proposal validation.
Regarding the relative flexural rigidity of the stiffeners, these were calculated according to eq. (4.10) with a Young’s modulus set to 210 GPa and a Poisson’s ratio of 0,3. The results from the experiments in relation to the proposed ultimate resistance approach are shown in Figure 4.2 (open stiffeners), Figure 4.3 (closed stiffeners) and Figure 4.4 (numerical simulations).
Figure 4.2: Fexp/FR for the respective specimen slenderness according to the proposal. 136 tests with open stiffeners.
As seen the scatter amongst the tests are somewhat large, however this may be the case when using a larger amount of test data produced at various test institutes. Experience shows that when using test data from one or a few laboratories, the scatter is often decreased. This may have its origin in different measurement equipment, test setups etc. However, an other possibility may be that the scatter may be native of parameters not included in the model. Though, this negative side of the scatter may also be turned to something that may be counted as a strength of a prediction model, i.e. if the model may predict the inhomogeneous test population safely the reliability in design work would be higher than if using a model only based on for example numerical simulations or tests made at one laboratory.
When concluding the two graphs over the tests regarding the open and closed stiffeners, the conclusion that all of the 136 + 24 specimens are safely predicted by the proposal. However, only the characteristic ultimate resistance are yet regarded. Further, the scatter amongst the
0 1 2 3 4 5Slenderness, F
0
1
2
3
F exp
/FR
Tests from literature (OS)Proposal
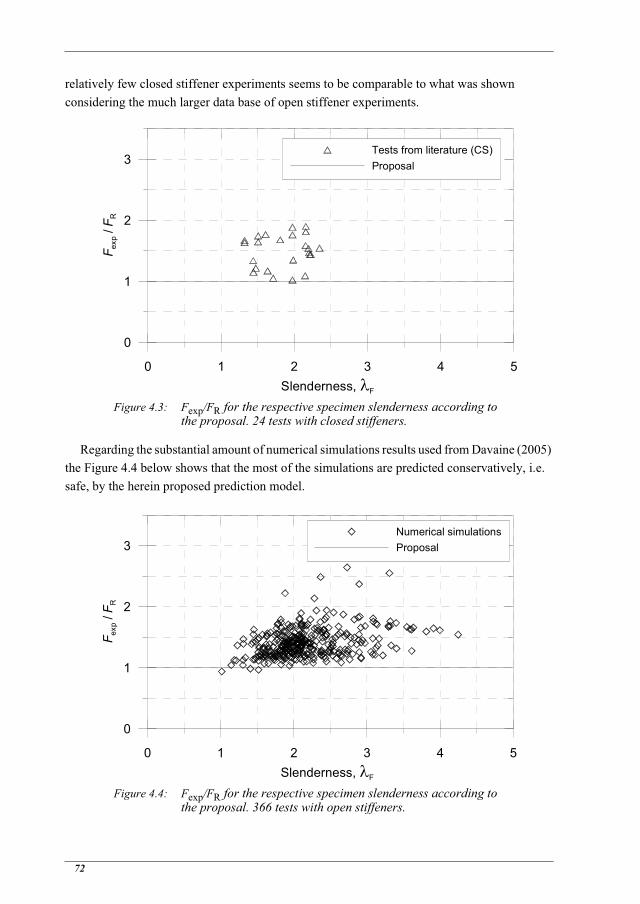
72
relatively few closed stiffener experiments seems to be comparable to what was shown considering the much larger data base of open stiffener experiments.
Figure 4.3: Fexp/FR for the respective specimen slenderness according to the proposal. 24 tests with closed stiffeners.
Regarding the substantial amount of numerical simulations results used from Davaine (2005) the Figure 4.4 below shows that the most of the simulations are predicted conservatively, i.e. safe, by the herein proposed prediction model.
Figure 4.4: Fexp/FR for the respective specimen slenderness according to the proposal. 366 tests with open stiffeners.
0 1 2 3 4 5Slenderness, F
0
1
2
3
F exp
/FR
Tests from literature (CS)Proposal
0 1 2 3 4 5Slenderness, F
0
1
2
3
F exp
/FR
Numerical simulationsProposal

Patch Loading - Design Proposal
73
When the results presented Figure 4.2 - Figure 4.4 above is put in statistical figures, the mean value, the coefficient of variation and the standard deviation of the three sub-groups are presented in Table 4.1.
Table: 4.1: Statistical interpretation of the results shown in Figure 4.2 - Figure 4.4. Experimental results, Fexp with reference to the predicted ultimate resistance, FR.
As seen in Table 4.1 the two groups of test data (open and closed stiffeners) seems to be comparable with each other. When regarding the numerical simulations the statistical parameters seems to be somewhat better which would be explained if pointing out that more than two times as many specimens have been used.
Regarding the neglection of the upper limit of the ratio b1 / a the Figure 4.5 containing both open and closed section stiffeners, shows that this assumption would not jeopardize the safety of the model. The prediction model seems to underestimate the actual resistance somewhat more for these, nevertheless, the model may be used without restrictions regarding b1 / a and still be safe. However, there are only four individuals tests with a upper panel depth / width ratio above 0,3.
Open stiffeners
Closed stiffeners
Numerical simulations
Number of tests 136 24 366
Mean 1,496 1,499 1,410
Standard deviation 0,251 0,271 0,235
Coefficient of variation 0,168 0,180 0,167
Lower 5-percent fractile 1,162 1,060 1,125
Upper 5-percent fractile 1,975 1,879 1,793

74
Figure 4.5: Fexp/FR as a function of the ratio b1 / a. 160 tests with longitudinal stiffeners.
As a last step in the validation process a statistical evaluation of the proposed design model was conducted according to the recommendations of Annex D in EN 1990 (2002). This evaluation ends up in a partial safety factor, M1, to be used for calculation of the design resistance. This evaluation may be studied in its full extents in Appendix B.2. Within this chapter only the final result is given, i.e. the partial safety factor for the proposed design model, evaluated using the 136 tests of girders with an open stiffener and the 24 tests with a closed longitudinal stiffener. The partial safety factor was determined to M1 = 1,0 which herein will be given as the recommendation for design purposes. Moreover, the same partial safety factor was determined on basis of the numerical simulations comprising the 366 simulations. The result from this evaluation is enclosed in Appendix B.2.3 with the evaluation of the partial factor which was determined to M1 = 1,0.
4.6. Comparison with other modelsThe herein proposed ultimate patch loading resistance approach was furthermore compared
to the proposal of Davaine (2005), the un-modified proposal of Graciano (2002) and the recommended approach of EN 1993-1-5. The comparison was conducted using the same specimens and the aforementioned equation restrictions concerning the ratio b1 / a. The respective statistical parameters of the other three models may be studied in Table 4.2.
0 0.1 0.2 0.3 0.4b1/ a
0
1
2
3F e
xp/F
RTests from literature (OS)Tests from literature (CS)Proposal

Patch Loading - Design Proposal
75
Table: 4.2: Comparison of the proposals by Graciano (2002), Davaine (2005), the recommendations in EN 1993-1-5 and the herein proposed approach. The 136 tests with open stiffeners were regarded.
As seen, the model by Graciano (2002) is the only one showing a lower standard deviation combined with a lower mean value than the proposed approach. However, when studying the results more closely, it can be concluded that the model by Graciano seems to overestimate the ultimate resistance regarding some of the more stocky tests. Regarding the corresponding statistical parameters the closed section stiffener specimens and the numerical tests, these may be studied in Table B.1 and Table B.2. Though, a conclusion from these tables and their respective graphs Figure B.14 - Figure B.21 is that the proposed model of Davaine (2005) seems to be the best one to predict the ultimate resistance of the numerical experiments used herein. However, this may not be regarded as a complete surprise since the model of Davaine was calibrated with respect to these numerical experiments.
4.7. Interaction with bending momentRegarding the possible interaction with bending, the bending moment resistance was
calculated according to the specifications of EN 1993-1-5 with respect to the specimens cross-section class respectively. Possible reductions due to local buckling was also regarded for the stiffeners; open stiffeners was treated as an “outstand flange” and the parts of a closed section stiffener was handled as an “internal compression part”.
Furthermore, some, or rather most, of the specimens in the data base was of hybrid type, i.e. with different yield resistances for the web and flanges respectively. However, for those experiments where the stiffener material properties were given, these were in all cases the same as for the web. The differences in the strength of the girder parts was also taken into account, both regarding the “common” hybrid girder with stronger flanges than web and also for the cases when the web was stronger than the flanges. These procedure was also presented in chapter 1.
The model originally proposed by Lagerqvist (1994) and furthermore implemented in EN 1993-1-5 to be recommended to use for interaction between patch loading and bending moment was presented in section 2.3.3 and eq. (2.91). The eq. (2.91) was proposed to be used regarding welded girders, hence the one used in the evaluation herein.
Graciano (2002)
Davaine (2005)
EN 1993-1-5 Proposal
Mean 1,249 1,476 1,456 1,496
Standard deviation 0,245 0,264 0,337 0,251
Coefficient of variation 0,196 0,179 0,271 0,168
Lower 5-percent fractile 0,861 1,152 0,892 1,162
Upper 5-percent fractile 1,626 1,980 2,078 1,975

76
Figure 4.6: Fexp/FR as a function of ME/MR for the 160 tests with open and closed longitudinal stiffeners.
Figure 4.7: Fexp/FR as a function of ME/MR for the 366 numerical simulations with open longitudinal stiffeners.
As seen in Figure 4.6 no obvious interaction between bending moment and patch loading may be observed for the experimental results. However, the experiments under a high bending
0
0.5
1
1.5
2
2.5
F exp
/FR
0 0.25 0.5 0.75 1 1.25ME /MR
Tests from literature (OS)Tests from literature (CS)EN 1993-1-5
0
0.5
1
1.5
2
2.5
3
F exp
/FR
0 0.25 0.5 0.75 1 1.25ME /MR
Numerical simulationsEN 1993-1-5

Patch Loading - Design Proposal
77
moment utilization are few, hence no conclusions regarding this matter will be drawn herein. However, even though the aforementioned tests are few, they are still safely predicted using the interaction equation recommended by EN 1993-1-5 according to eq. (2.91). Considering the numerical simulations no further conclusions regarding a potential moment - patch loading interaction may be drawn. Figure 4.7 shows no real interaction behaviour, though the simulations subjected to larger bending moment utilization is, as for the experiments, too few to make any statement.
4.8. Summary of the proposed design procedureIn this section the proposed design procedure is summarized with its different steps. The
following calculation procedure is proposed to be used for the prediction of the patch loading resistance of a longitudinally stiffened I-girder. The longitudinal stiffener may be of open or closed type, however, the proposal is only validated for panels stiffened with one stiffener. Also, the girders used in the evaluation was all of welded type. However, the proposed resistance model is only valid for girders satisfying eq. (4.14).
(4.14)
The yield resistance of the girder web is calculated using
(4.15)
which is multiplied with the reduction factor according to
(4.16)
The reduction function is proposed to be on the form
(4.17)
in which
(4.18)
The slenderness of the girder web is calculated using the von Kármán approach according to
(4.19)
ss 2 tf 2 b1 a++
Fy fyw tw ss 2 tf 1fyf bffyw tw-----------------++ fyw tw a=
FR F Fy=
F1
F F2
F–+------------------------------------- 1 2,=
F12--- 1 0 5, F 0 6,– F++=
FFyFcr-------=

78
The elastic critical load is proposed to be calculated as the lowest of the one regarding the upper panel and the whole panel respectively, i.e. as
(4.20)
in where the critical load for the whole panel should be calculated according to
(4.21)
with the buckling coefficient kF1
(4.22)
Regarding the upper panel, the elastic critical load is proposed to be calculated using
(4.23)
with a buckling coefficient of
(4.24)
The improved stiffness of the panel due to the presence of a longitudinal stiffener, kst, is calculated differently regarding open and closed section stiffeners. Regarding open stiffenersthis term is proposed to be calculated according to
(4.25)
with the relative flexural rigidity of the stiffener according to
(4.26)
in which the moment of inertia of the stiffener, Ist, includes the contributing parts of the web according to Figure 1.2.
Fcr minFcr1
Fcr2=
Fcr1 0 9 k, F1 Etw3
hw------=
kF1 6 2+hwa
------2
kst+=
Fcr2 kF2
2 E12 1 2–-----------------------------
tw3
b1-----=
kF2 0 8ss 2 tf+
a--------------------- 0 6,+, a
b1-----
0 6ss 2 tf+
a--------------------- 0 5,+,
=
kst 5 44b1a----- 0 21,–, st 0=
stE IstD hw---------------=
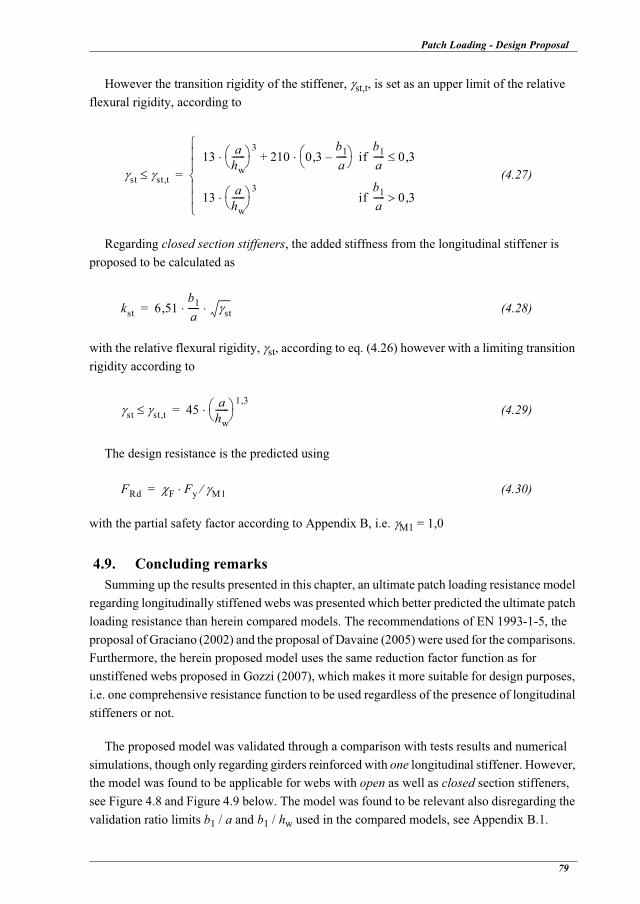
Patch Loading - Design Proposal
79
However the transition rigidity of the stiffener, st,t, is set as an upper limit of the relative flexural rigidity, according to
(4.27)
Regarding closed section stiffeners, the added stiffness from the longitudinal stiffener is proposed to be calculated as
(4.28)
with the relative flexural rigidity, st, according to eq. (4.26) however with a limiting transition rigidity according to
(4.29)
The design resistance is the predicted using
(4.30)
with the partial safety factor according to Appendix B, i.e. M1 = 1,0
4.9. Concluding remarksSumming up the results presented in this chapter, an ultimate patch loading resistance model
regarding longitudinally stiffened webs was presented which better predicted the ultimate patch loading resistance than herein compared models. The recommendations of EN 1993-1-5, the proposal of Graciano (2002) and the proposal of Davaine (2005) were used for the comparisons. Furthermore, the herein proposed model uses the same reduction factor function as for unstiffened webs proposed in Gozzi (2007), which makes it more suitable for design purposes, i.e. one comprehensive resistance function to be used regardless of the presence of longitudinal stiffeners or not.
The proposed model was validated through a comparison with tests results and numerical simulations, though only regarding girders reinforced with one longitudinal stiffener. However, the model was found to be applicable for webs with open as well as closed section stiffeners, see Figure 4.8 and Figure 4.9 below. The model was found to be relevant also disregarding the validation ratio limits b1 / a and b1 / hw used in the compared models, see Appendix B.1.
st st t,
13 ahw------
3210 0 3
b1a-----–,+ if
b1a----- 0 3,
13 ahw------
3if
b1a----- 0 3,
=
kst 6 51b1a-----, st=
st st t, 45 ahw------
1 3,=
FRd F Fy M1=

80
Figure 4.8: The 136 experiments with open stiffeners and 24 with closed stiffeners compared to the proposed ultimate patch loading resistance model.
When comparing the proposed design model with the model of Graciano (2002) the latter model seems to overestimate the results for b1 / hw > 0,3 (see Figure B.14 and Figure B.16). This is also outside the validation limit of the model by Graciano, however comparing the aforementioned two figures with Figure B.1 and Figure B.12 it seems that using the herein proposed model will hand predictions on the safe side when b1 / hw > 0,3. Studying Figure B.15 and Figure B.17 showing how the ratio b1 / a influences the level of prediction for the model of Graciano, it may be observed that outside the valid interval 0,05 < b1 / a < 0,3 there are some tests and numerical simulations on the unsafe side. Figure 4.5 and Figure B.12 showing the corresponding results by the herein proposed model, the latter seems to predict the experimental results safely disregarding the ratio 0,05 < b1 / a < 0,3.
Comparing the proposed approach with the model proposed in Davaine (2005) on the same basis as above, the model by Davaine seems to predict all of the experimental results safely (see Figure B.18 and Figure B.19) however with reference to Table 4.2 and Table B.2 the proposal of this thesis seems to be a model with less scatter and a better mean value for the closed section stiffened panels. However, regarding the open stiffeners the mean value of the model by Davaine seems to be slightly better, though with a larger scatter amongst the individual tests.
Regarding the numerical simulations, a few results from the simulations seems to be overestimated with respect to the ultimate patch loading resistance. The reason for this are difficult to point out, since there seems to be no special differences in geometry, material, loading conditions etc. when compared to the ones predicted safely.
0 1 2 3 4 5Slenderness, F
0
0.4
0.8
1.2
1.6F e
xp/F
y
Tests from literature (OS)Tests from literature (CS)Proposal

Patch Loading - Design Proposal
81
Figure 4.9: The 366 numerical simulations with open stiffeners compared to the proposed ultimate patch loading resistance model.
All in all, the herein proposed model seems to perform better than the models used in the comparison regardless of the ratio b1 / a and b1 / hw. Furthermore the proposed model was found to be applicable both to webs stiffened with one open or one closed section longitudinal stiffener. The partial safety factor was evaluated with respect to both the test results and the numerical simulations and found to be in both cases 1,0.
0 1 2 3 4 5Slenderness, F
0
0.4
0.8
1.2
1.6
F exp
/Fy
Numerical simulationsProposal

82

Local Buckling - Test Results
83
Chapter 5:
Local Buckling - Test Results
The plate buckling phenomena has, as mentioned in previous chapters, been quite thoroughly investigated. This also on a strictly experimental basis. The research work is in a continuous state since new steel grades and design rules enter the field of constructional applications.
The articles and papers presented in this chapter have been chosen to be comparable to the tests in chapter 6. This with respect to specimen layout, welding conditions, support conditions, steel grades and other comparable similarities. Furthermore, all the test results presented in this chapter are evaluated with respect to the Winter function discussed in chapter 2 and according to the EN 1993-1-5 specifications concerning plate slenderness values.
5.1. Nishino et. al (1967)An investigation aiming to clarify how residual stresses influence the resistance against local
buckling was presented by Nishino et al. (1967). Specimens used in this research work were fabricated of plates welded together to form a square cross section, see Figure 5.1, and tested in as-welded condition.
Figure 5.1: Specimen layout and weld detailing. Nishino et al. (1967).
Two different steel grades were used for the specimens, ASTM A7 (sheared specimen plates) and ASTM A514 (flame-cut specimen plates) with properties according to adjacent Table 5.1. In addition to the buckling tests the residual stress condition in the specimens were measured with the sectioning method.

84
Table 5.1: Results from tension coupon tests.The average compressive residual stresses was estimated regarding each plate (side) individually. Nishino et al. (1967).
5.1.1. Test SetupThe tests of the specimens were divided into four sets, each comprising two specimens with
the same geometrical properties and made of the same steel. The width - thickness ratios were, according Nishino et al., selected such that the critical loads were reached in either the elastic range or the elastic-plastic range. Furthermore, the length to width ratio of the plates were between 4,35 to 7,2. This would according to the authors guarantee that
• the buckling mode corresponding to the lowest critical load would be developed and
• short enough to prevent column buckling to be the governing failure mode.
The buckling tests were performed with the specimens under uniformly distributed compressive force as the specimens were equipped with rigid end plates, milled flat to simplify the alignment in the test rig. Simply supported conditions were assumed to be valid constraints for the plates in the welded specimen.
5.1.2. Test results and conclusionsRegarding the conclusions drawn by the authors in their article, the most interesting
concerning this theses were:
• The effect of residual stresses on the buckling strength of a plate is less pronounced for A 514 steel than it is for A 7 steel.
• Considerable post-buckling strength exists in a plate buckled in the elastic range, while a plate buckled in the elastic-plastic range has a relatively small reserve of post-buckling strength.
• The plate elements of square columns of A 514 steel are stronger than those of A 7 steel when compared on a non dimensional basis (compared to the yield strength of each grade).
Specimen No.
Material Yield Strength, fy [MPa]
Average compressive residual stress, rc [MPa]
Ratiorc / fy
1 A7 273,0 83 - 97 0,23
2 A7 266,1 69 - 76 0,16
3 A514 799,8 76 - 83 0,10
4 A514 710,8 97 - 103 0,15

Local Buckling - Test Results
85
Furthermore the test results presented by Nishino et al. were re-evaluated herein with respect to the Winter function and EN 1993-1-5 and presented in Figure 5.2.
Figure 5.2: Test results from all the 8 specimens from Nishino et al.(1967). The results are re-evaluated with respect to the Winter function, eq. (2.24). Plate slenderness according to EN 1993-1-5.
5.2. Dwight et. al (1968)The local buckling tests presented in Dwight et al. (1968) comprised tests of square box,
rectangular box and cruciform sections. The square box section tests were conducted with the aim of filling gaps in previously presented tests reported by J.D. Harrison and also presented by Dwight and Moxham (1969), see section 5.3.1. A total of 49 columns were tested in as-welded and stress relived condition. However only four of the tests were in as-welded condition and of square-box model, hence the ones used in the evaluation in this thesis.
The mechanical properties of the steel used for fabrication of the specimens were determined through compression tests. The length of the specimens were set to 3,5 to 4 times the plate width and tested under uniform compressive stress. In this evaluation the result from four of these tests were used and the yield stress in compression was measured to 354 and 403 MPa respectively. The test results from these tests were re-evaluated herein with respect to the Winter function and EN 1993-1-5 and presented in Figure 5.3.
0 0.5 1 1.5 2 2.5 3Slenderness, P
0
0.5
1
1.5F e
xp/F
y
Specimens of grade A7Specimens of grade A514EN 1993-1-5

86
Figure 5.3: Test results from 4 as-welded specimens reported in Dwight et al. (1968). The results were re-evaluated with respect to the Winter function. Plate slenderness according to EN 1993-1-5.
5.2.1. ConclusionsDwight et al. concluded that the difference between the resistance of an as-welded specimen
compared to a stress relieved specimen could be in the order of 10 to 15%. This considering a considerable range of width to thickness ratios and with the higher resistance concerning the stress relieved specimens.
5.3. Dwight and Moxham (1969)Another survey of work by different researchers in the field of plate buckling were presented
by Dwight and Moxham (1969). The paper focused on investigating how well the British standards BS 153 and BS 449 of 1969 were describing the actual behaviour of plate buckling and was somewhat a continuation of the work described in section 5.2. Special efforts were put into investigating how the weld induced residual stresses affected the ultimate resistance with respect to local buckling. Dwight and Moxham gathered test results from over 40 welded column specimens of square box sections with yield strengths in the range of 232 to 402 MPa. The tests applicable to this theses are listed below.
5.3.1. Tests made by J.D. HarrisonDwight and Moxham reported results from 20 experiments made by J.D. Harrison and J.B.
Dwight. These specimens were in as-welded as well as in annealed condition. The length of the specimens were about 4 times the plate width and the specimens were loaded with uniformly distributed compressive stress. In this thesis the only regarded tests are the as-welded ones (10
0 0.5 1 1.5 2 2.5 3Slenderness, P
0
0.5
1
1.5F e
xp/F
y
Dwight et. al (1968)EN 1993-1-5

Local Buckling - Test Results
87
specimens). Furthermore, the test results from these tests were re-evaluated with respect to the Winter function and EN 1993-1-5 to be comparable within this thesis. These re-evaluated results are presented in Figure 5.4.
5.3.2. Tests made by K.E. MoxhamIn Dwight and Moxham (1969) three additional tests were collected for the evaluation. These
tests were made by K.E. Moxham and conducted in a similar way to the one described above. However, these tests were made in a somewhat larger scale with bigger specimens (plate thickness of 12,7 mm) but still in as-welded condition and thereby possible to compare with the other tests reported herein. The re-evaluation of the three specimens, with a yield strength of 312 MPa, are in Figure 5.4 presented along with the others from the same publication.
Figure 5.4: Test results from the 13 as-welded specimens reported in Dwight and Moxham (1969). The results were re-evaluated with respect to the Winter function. Plate slenderness according to EN 1993-1-5.
5.3.3. ConclusionsSeveral conclusions were drawn concerning the work presented by Dwight and Moxham
(1969). Concerning this thesis relevant conclusions are:
• Residual stresses caused by welding may reduce the strength of fabricated members in relation to the size of the welds.
• The load - deformation curve for a web containing residual stresses is less peaky than that for a stress free web.
0 0.5 1 1.5 2 2.5 3Slenderness, P
0
0.5
1
1.5
F exp
/Fy
Dwight and Moxham (1969)EN 1993-1-5

88
5.4. Fukumoto and Itoh (1984)A comprehensive investigation regarding uniformly compressed steel plates was presented
in a paper by Fukumoto and Itoh (1984). The purpose of the work was to review and store data of experimental investigations under clearly defined and described conditions. The authors collected data from 793 individual tests of a variety of cross sections such as single plates, welded square boxes, square and rectangular tubes, welded rectangular sections and cruciform specimens. Data concerning specimens in as-welded as well as annealed condition were regarded. 13% of the data collected was regarding specimens made of steel with higher yield strength than 430 MPa (definition of high strength steel in the paper).
Data concerning initial geometrical imperfections, residual stress levels and ultimate loads were presented in form of histogram plots. Concerning the residual stresses, Fukumoto and Itoh states that the magnitude of the residual compressive stress may not be influenced of the yield stress of the base material. This statement was founded on 32 residual stress measurements on specimens made of high strength steel which showed that the rc / fy ratio was lower for the high strength steel specimens compared to the rest of the data set.
Fukumoto and Itoh collected results from 383 plates with inherent residual stresses. The plates were of the type with welds along the unloaded edges (in tubes or as single plates) or as-welded box sections. The authors made a non-linear regression analysis with an assumed uniform variance on the data and the mean function presented with a standard deviation of 0,0871 was
(5.1)
Furthermore, the authors made the same analysis for 172 plates without residual stresses. These plates were as-cut, annealed or annealed box sections. The result from this analysis was
(5.2)
with a standard deviation of 0,104. Herein both the equations eq. (5.1) and eq. (5.2) are compared to the Winter function in Figure 5.5.
ufy------ 0 968,
p------------- 0 286,
p2
-------------– 0 0338,
p3
----------------+= for p 0 571,
ufy------ 1 133,
p------------- 0 384,
p2
-------------– 0 0468,
p3
----------------+= for p 0 658,

Local Buckling - Test Results
89
Figure 5.5: Mean functions of plates with eq. (5.1) and without eq. (5.2) residual stresses from Fukumoto and Itoh (1984) compared to the Winter function.
Several interesting conclusions were drawn by Fukumoto and Itoh concerning their experimental data-base approach. Conclusions among others were:
• No clear difference between the plate strengths determined through single plate tests and square boxes could be pointed out.
• Annealed plates showed larger variations in strength than as-welded plates.
• Further experimental investigations were needed concerning plates of high strength steel.
5.5. Rasmussen and Hancock (1992)An investigation with the aim of determining if high strength steel with yield stress in the
range 450 - 700 MPa could be designed according to existing Australian design rules was presented in Rasmussen and Hancock (1992). A test programme comprising box welded sections and cruciform shaped specimens as well as I-shaped sections were used to examine if the design codes had to be modified or if they were usable also for the grades with higher strength (a similar aim as for this thesis, except the difference in regarded codes). The investigation focused on whether the yield slenderness limits for welded uniformly compressed plates supported along one or both longitudinal edges were applicable to the high strength steels. However, since this thesis solely focus on plates supported along both sides, these test results are the only ones regarded herein. Furthermore, the intention of the investigation by Rasmussen
0 0.5 1 1.5 2 2.5 3Slenderness, P
0
0.5
1
1.5
F exp
/Fy
Plates with residual stresses (eq. 5.1)Plates without residual stresses (eq. 5.2)EN 1993-1-5

90
and Hancock (1992) may not be completely in line with the aim of this thesis, still the test results from the paper in question are valuable and re-evaluated with respect to the Winter function.
The test programme was divided into three parts; measurement of the material properties with tension and compression coupons, residual stress measurement through specimen sectioning and compression tests of the specimens. The specimens were all made of BISALLOY 80 steel which, according to Rasmussen and Hancock, is equivalent to the ASTM A514 grade. The through coupon tests measured mechanical properties of the BISALLOY 80 grade are presented in Table 5.1.
Table 5.1: Nominal and measured mechanical properties of BISALLOY 80. Rasmussen and Hancock (1992).
5.5.1. Test setupThe box specimens used in the test programme were all fabricated by weld joining four plates
(Figure 5.6) with nominal thickness of 5 mm and with 3 different nominal widths (plate slenderness values in Figure 5.7). Gas metal arc welding with a Lincoln L50 wire were used for all the welds.
Figure 5.6: Specimen layout and weld detailing. Rasmussen and Hancock (1992).
The specimens were milled flat at the ends to allow a proper seating in the test rig. The bottom plate was fixed to prevent rotation and the top plate was mounted on a spherical seat. Furthermore the length of the specimens were chosen to allow unrestrained development of local buckles and short enough to prevent overall instability phenomena (column buckling).
5.5.2. Residual stress measurementThe longitudinal residual stresses were measured with the sectioning method and readings
were made with use of strain gauges. Gauges were applied near the centreline of each plate of
Nominal plate thickness [mm]
Type of test Youngs modulus, E [GPa]
Measured values, fy / fu [MPa]
5 Tension 211 670 / 775
5 Compression 211 750 / -

Local Buckling - Test Results
91
the box specimen and the mean values of the measured compressive stresses on the four plates are presented for each specimen in Table 5.2.
Table 5.2: Measured residual stresses of box columns. The average compressive residual stresses was estimated regarding each specimen individually. Rasmussen and Hancock (1992).
5.5.3. Test results and conclusionsThe test results from Rasmussen and Hancock were re-evaluated herein with respect to the
Winter function and EN 1993-1-5 and presented in Figure 5.7.
Figure 5.7: Test results from all the 6 specimens from Rasmussen and Hancock (1992). The results were re-evaluated with respect to the Winter function, eq. (2.24). Plate slenderness according to EN 1993-1-5.
The investigation of the high strength steel sections presented by Rasmussen and Hancock rendered in the following conclusions regarding the box sectioned specimens:
• The strength of slender welded high strength steel plates exceeds that of welded ordinary steel plates when compared on a non dimensional basis (compared to the yield strength of each grade). The test results suggest that the difference in the non
Specimen Width,b [mm]
Thickness,t [mm]
Average compressive residual stress, rc [MPa]
Yield Strength,fy [MPa]
Ratiorc / fy
B1RS 80 5 169 670 0,25
B2RS 110 5 114 670 0,17
B3RS 140 5 73 670 0,11
0 0.5 1 1.5 2 2.5 3Slenderness, P
0
0.5
1
1.5
F exp
/Fy
Rassmusen and Hancock (1992)EN 1993-1-5

92
dimensional strength may be greater for plates supported along one longitudinal edge than for plates supported along both.
• More slender plates are more affected of the presence of the residual stresses than stockier ones. This is due to the fact that the more stocky plates may be almost completely plastified at the ultimate load level.
5.6. Möller and Johansson (1995)Buckling tests on six specimens made of high strength steel were presented by Möller and
Johansson (1995). The aim of the investigation was to investigate the buckling behaviour of the newly developed steel “WELDOX 1100” from SSAB Oxelösund. The yield stress of this grade was measured to 1349 MPa.
The specimens were of stub column type with a box shaped cross section, Figure 5.8, and the height of the specimens was chosen to 3,5 times the specimen width. This to prevent column buckling, avoid clampening effects from the end supports and to allow the specimen to buckle in such a way that the lowest buckling load would be acquired. Furthermore, the specimens were tested in as-welded condition.
Figure 5.8: Specimen layout and weld detailing. Möller and Johansson (1995).
5.6.1. Test setupThe tests were performed under uniform compression of the specimens between two rigid
end plates. The deformation speed was chosen such that the nominal stress would reach the yield strength within 30 seconds. Furthermore the deformation of the specimens were carried on until a 50% load drop from the ultimate load was acquired. Deformation and load data was sampled during the tests.

Local Buckling - Test Results
93
5.6.2. Test results and conclusionsThe test results from Möller and Johansson (1995) were re-evaluated with respect to the
Winter function and EN 1993-1-5 and presented in Figure 5.9.
Figure 5.9: Test results from all the 6 specimens from Möller and Johansson (1995). The results were re-evaluated with respect to the Winter function. Plate slenderness according to EN 1993-1-5.
5.7. Concluding remarksRegarding the presented results collected through the literature survey the predominantly
chosen steel grades seems to be of a type with lower strength (i.e. yield strength below 460 MPa). However, with respect to the tests presented later in this thesis, these gathered test results are of great importance to be used as a reference.
Furthermore, the re-evaluation (or use of test data) was made with respect to EN 1993-1-5 and the Winter function. This was done in order to be able to do a comparison between the different experimental results. Even though this procedure was conducted, some differences considering the results are still present. One obvious difference is that in some cases the yield strength of the steel was measured in compression. Usually the compressive strength is slightly higher compared to steel in tension. This influences not only the evaluation considering the reduction factor, but also the plate slenderness. Emphasizing the definition of plate slenderness according to EN 1993-1-5, described in eq. (2.27) and eq. (2.28), the yield strength of the material in question is regarded. An increased yield strength implies a higher plate slenderness, i.e. the plate will be considered more slender than it would be if the yield strength in tension would be used. Furthermore a higher yield strength also implies a lower relative resistance.
0 0.5 1 1.5 2 2.5 3Slenderness, P
0
0.5
1
1.5
F exp
/Fy
Möller and Johansson (1995)EN 1993-1-5

94
Regarding the presented results some conclusions may be drawn when contemplating the conducted work shown in the sections above.
• The effect of the presence of residual stresses is evidently decreasing the local buckling resistance.
• Most of the stockier specimens seems to have a resistance surpassing the resistance predicted by the Winter function, i.e. EN 1993-1-5.
• More slender specimens tend to have a lower resistance than predicted by the Winter function, i.e. EN 1993-1-5.
Local Buckling - Experimental Work
95
Chapter 6:
Local Buckling - Experimental Work
The local buckling phenomenon has over the years been quite thoroughly investigated by numerous of different researchers, e.g. see chapter 5. However, the field of local buckling research concerning members made of steels with higher strength has yet not been fully evaluated. This topic has been the focus of the experimental work presented herein and, in some way, a step towards filling these gaps in knowledge and further enhance the possibility of using high strength steel in constructional work of today.
6.1. BackgroundDuring the winter and spring of 2004 a local buckling test programme, comprising stub
column tests and uniaxial tests, were performed at the division of structural engineering, Luleå university of technology, LTU. The tests were a part of the RFSC funded project “LiftHigh - Efficient Lifting Equipment with Extra High Strength Steel” and with focus on the second project work package: “Global and local buckling of hollow sections and welded boxes”.
With focus on this work package, 48 specimens with box cross section have been tested at LTU, solely with respect to the local buckling phenomena. This was complemented with uniaxial tension tests for the determination of the mechanical properties of the steel in question. Furthermore, measurements of the residual stress state in the specimens (as-welded condition) was conducted and presented in Clarin (2004).
The specimens were fabricated by SSAB Oxelösund and made of extra high strength steel, as well as of a more commonly used steel grade. The specimens were designed to simulate four individual plates under uniform compression and simply supported along their boundaries.
6.2. Experimental investigationThe aim for the test programme was to investigate if steels with yield strength > 460 MPa
behaves different than ordinary steel grades with respect to local buckling. This is something that has not been examined to such a great extent before. The specimens for evaluating the local buckling resistance were fabricated out of three different steel grades; 3 mm thick Domex 420

96
(hot rolled) and the two Weldox grades 700 (quenched and tempered) and 1100 (quenched), both of plates with a nominal thickness of 4 mm.
In addition to the buckling tests, 18 coupon tension tests were conducted with the purpose of determine the properties of the three different grades needed for further evaluation of the buckling test data.
6.3. Uniaxial testsThe mechanical properties of the steel used for the fabrication of the local buckling
specimens (see section 6.4) were determined through tensile coupon tests. The tests were made according to the test standardization in EN 10002-1 (2001). A total of 18 coupons were laser-cut from the same virgin plates as used for the fabrication of the buckling test specimens. Furthermore, because the rolling direction of the steel was altered between being along and perpendicular to the loading direction in the buckling tests, the mechanical properties were also determined in these directions, Figure 6.1.
6.3.1. SpecimensThe thicknesses of the plates used for the fabrication of the box specimens, hence also
concerning the coupons, were nominally 3 mm for the Domex grade and 4 mm concerning the Weldox.
Figure 6.1: Plate with laser-cut coupons along and transverse the rolling direction.
Prior to each tension test the coupon was measured to determine the geometry of the specimen. The length of the coupons was 379 mm and the width 39 mm for the gripping part of the coupon (the ends) and 24,9 mm (mean value for all 18 coupons) for the notched area in the middle of the coupon specimen. Furthermore the plate thickness was determined to 3,05 mm for the Domex plates, 4,09 mm for the Weldox 700 and 3,98 mm for the Weldox 1100 plates.

Local Buckling - Experimental Work
97
6.3.2. Test setupThe tension tests were made in a 600 kN servo - hydraulic DARTEC rig and the test data was
acquired through software enclosed with the rig. The load and axial elongation was measured until failure of the coupon specimens.
Figure 6.2: The coupon equipped with an extensometer in the test rig.
6.3.3. Test results In Figure 6.3 the typical stress-stain relations are shown for the three different grades and in
Table 6.1 the results from the 18 tested coupons are presented in numbers. The Domex 420 grade shows a classic steel stress - strain relation behaviour, with a distinct yield plateau. Therefore the yield strength is stated for these specimens. However, the Weldox grades show a strongly non-linear behaviour and has no well identifiable yield plateau. In this case the 0,2% proof stress are used as the yield criterion. All of the uniaxial stress - strain curves from the 18 coupons may be found in Appendix C.
Figure 6.3: Typical stress - strain relation for Domex 420, Weldox 700 and 1100. All specimens oriented along the rolling direction.
0 10 20 30 40
, Strain [%]
0
400
800
1200
1600
,Ten
sile
stre
ss [M
Pa]
S420, Coupon D1W700, Coupon W1W1100, Coupon W7

98
Concerning the material behaviour of the Domex 420 and Weldox 700 it is evident that the yield or 0,2% proof stress and ultimate resistance is higher when tested transverse to the rolling direction. The Weldox 1100 seems to behave contradictive to the other two grades, with an almost equal 0,2% proof stress and ultimate strength in the both directions, maybe with a slightly higher strength along the rolling direction. This was also concluded by Gozzi (2004).
Table: 6.1: Results from the uniaxial tensile coupon tests.0o indicates rolling direction along the loading direction and 90o transverse.
* Indicates failure outside of the range of the extensometer.
6.4. Buckling tests
6.4.1. SpecimensThe specimens were made of four identically designed plates, welded together along their
edges, see Figure 6.4 and Figure 6.5. The design of the specimens were conducted with the purpose to allow the plates to act as simply supported along the longitudinal edges (edges in the loading direction). Furthermore, the aim was to have these simply supported plates subjected to an uniformly distributed compressive stresses. This was achieved through welding flat milled rigid end plates to the top and bottom of the box section. These end plates were assumed to be thick enough (thickness > 15 mm) to distribute the applied load evenly to the four plates of the welded box specimen.
Specimen Yield Strength, fy [MPa]
Proof Stress, Rp0.2 [MPa]
Ultimate Strength, Rm [MPa]
A5 [%]
Dom
ex 4
20 0o
D1D2D3
442439443
---
529526530
30,129,830,1
90o
D4D5D6
469473471
---
533533532
30,528,828,7
Wel
dox
700 0o
W1W2W3
---
769774775
821828826
15,215,614,4
90o
W4W5W6
---
791800791
824834826
14,614,715,0
Wel
dox
1100 0o
W7W8W9
---
134513501357
147714801489
9,58,6*
90o
W10W11W12
---
132613591320
145715121485
*8,78,6

Local Buckling - Experimental Work
99
To prevent column buckling, the height of the specimens were limited to 3 times the plate width. This would also minimize the influence of possible clamping effects (moment restraints) from the end plates. Furthermore the rolling direction of the steel was varied between being along and perpendicular to the loading axis of the specimen.
Figure 6.4: Specimen layout and weld positions.
All specimen fabrication work, along with the production of the Weldox plates, were made by SSAB Oxelösund. The Domex plates were fabricated by SSAB Tunnplåt in Borlänge. The test ready box specimens were delivered to LTU along with plates of the three grades for fabrication of the coupons needed for the uniaxial tests.
Figure 6.5: Specimens S30-0a (left) and W73-0a (right) after test.
The 48 specimens were divided into three sets, each comprising one of the steel grades Domex 420, Weldox 700 or Weldox 1100. The nominal plate slenderness values, p, were
A - A
AA
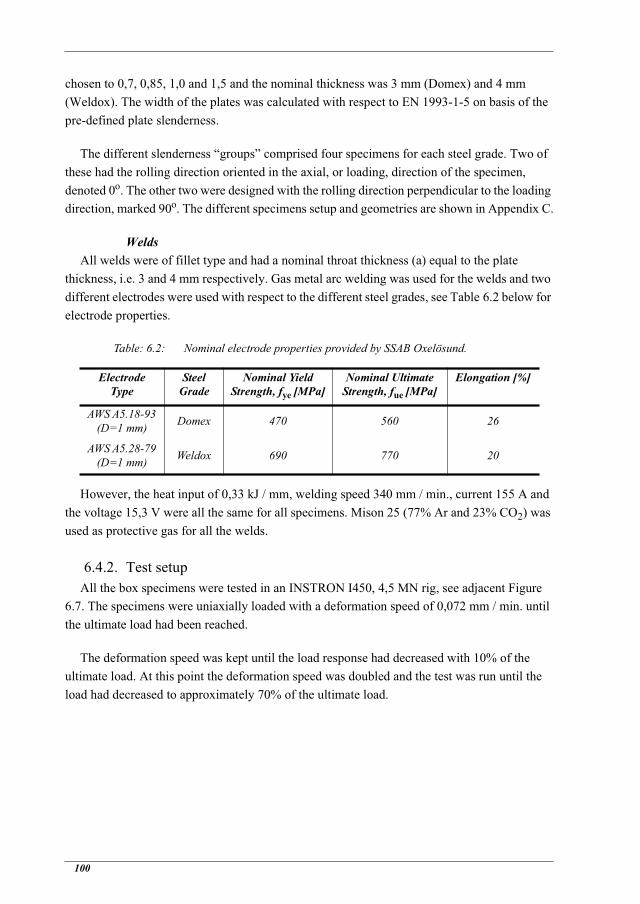
100
chosen to 0,7, 0,85, 1,0 and 1,5 and the nominal thickness was 3 mm (Domex) and 4 mm (Weldox). The width of the plates was calculated with respect to EN 1993-1-5 on basis of the pre-defined plate slenderness.
The different slenderness “groups” comprised four specimens for each steel grade. Two of these had the rolling direction oriented in the axial, or loading, direction of the specimen, denoted 0o. The other two were designed with the rolling direction perpendicular to the loading direction, marked 90o. The different specimens setup and geometries are shown in Appendix C.
WeldsAll welds were of fillet type and had a nominal throat thickness (a) equal to the plate
thickness, i.e. 3 and 4 mm respectively. Gas metal arc welding was used for the welds and two different electrodes were used with respect to the different steel grades, see Table 6.2 below for electrode properties.
Table: 6.2: Nominal electrode properties provided by SSAB Oxelösund.
However, the heat input of 0,33 kJ / mm, welding speed 340 mm / min., current 155 A and the voltage 15,3 V were all the same for all specimens. Mison 25 (77% Ar and 23% CO2) was used as protective gas for all the welds.
6.4.2. Test setupAll the box specimens were tested in an INSTRON I450, 4,5 MN rig, see adjacent Figure
6.7. The specimens were uniaxially loaded with a deformation speed of 0,072 mm / min. until the ultimate load had been reached.
The deformation speed was kept until the load response had decreased with 10% of the ultimate load. At this point the deformation speed was doubled and the test was run until the load had decreased to approximately 70% of the ultimate load.
Electrode Type
Steel Grade
Nominal Yield Strength, fye [MPa]
Nominal Ultimate Strength, fue [MPa]
Elongation [%]
AWS A5.18-93 (D=1 mm) Domex 470 560 26
AWS A5.28-79 (D=1 mm) Weldox 690 770 20

Local Buckling - Experimental Work
101
Figure 6.6: A box specimen placed in the INSTRON I450, 4,5 MN test rig.
6.4.3. MeasurementsDuring testing data was sampled over six channels. The load was measured with a load cell
from DARTEC with a measuring range up to 2 MN. The deformation in the loading direction was measured with four 11 mm LVDT's in four points located at the corners of one of the end plates of the specimens, e.g. see Figure 6.7. Four LVDT’s were used to be able to calculate the mean axial deformation of the end plate which in further evaluations was used as the mean axial plate deformation. The out of plane plate deflection, or buckle growth, was also measured. This was done with a 25 mm LVDT at the mid point of one side of the specimen, see Figure 6.7.
During all the tests the sample rate of data was 2 Hz and a 600 Hz Spider 8 from HBM was used for interpreting the signals from the gauges to PC environment. For information concerning the specifications of the equipment used for acquiring data, see Appendix C.5.
Figure 6.7: The test setup with all the LVDT’s and the load cell. The specimen was deformed from the lower side and the load measured by the load cell on the upper side (left). To the right the out of plane deflection LDVT is pictured as well as some of the axial deformation LVDT’s.

102
Prior to test start the specimens position in the rig was measured to ensure that the loading axis was in the centre of the specimens, hence the risk of introducing forces due to eccentricity of the specimen was minimized. As an extra precaution to unwanted influences, a small hole was drilled through one of the end plates of the specimens. This was to ensure that the air pressure inside the closed specimen was equal to the surrounding air at all times during the deformation of the specimen. Furthermore, possible pressure differences due to the welding (heated air) was also avoided through this procedure.
Additional measurements concerning the geometry of the specimens were also conducted. The plate dimensions were measured prior to the buckling tests and are enclosed in Appendix C.2. The plate width was measured on three positions on all four plates in every specimen. In addition to this, the plate height was measured on one position on all four sides. All dimensions were measured between the weld edges, i.e the effective width and height of the simply supported plates.
6.4.4. ResultsThe test data essential to the aim of this investigation was the ultimate load registered concerning respective specimen. The typical load - mean deformation behaviour for the specimens made of the three different grades is presented in Figure 6.8. All of the load - mean axial deformation curves are shown in Appendix C.3.
Figure 6.8: Typical load - mean axial deformation behaviour for the box specimens made of the three different steel grades.
The cross section area for the stress comparison was calculated from the data presented in Table C.1. The weld area was added to the plate section area. The weld areas were set to 19 mm2
for the Domex specimens, 34 mm2 for the Weldox 700 specimens and 32 mm2 for the Weldox
0 2 4 6 8 10
, Mean axial deformation [mm]
0
400
800
1200
1600
F, A
xial
Loa
d [k
N]
S40-0aW74-0bW114-0a

Local Buckling - Experimental Work
103
1100 specimens. All weld areas were theoretically determined with respect to their individual measured plate thicknesses. The mean 0,2% proof stress, Rp0.2, was calculated from the tension coupon test results presented in Table 6.1.
Three specimens, one from each grade, were removed from the buckling test programme. These specimens, S20-0b, W72-0b and W112-0b, were put aside to be used for the measurement of longitudinal residual stresses, presented in Clarin (2004). Furthermore SSAB Oxelösund delivered some extra specimens of the stubbier type with a nominal plate slenderness of 0,7. These specimens were made of the two Weldox grades and the results are presented with the other results from the ordinary specimens.
Figure 6.9: Specimen W74-0a with deformed end plate (left) and specimen W111-0b with ruptured weld in upper left corner (right).
Unfortunately, the results from the specimen W74-0a had to be removed from the evaluation because of some problems regarding end plate deformation, Figure 6.9 (left). The specimen never reached its ultimate load due to the plastic deformation of one of the end plates. In addition to this, problems concerning specimen W111-0b occurred. This specimen reached its ultimate load, but shortly thereafter one of the corner welds failed (see Figure 6.9 (right)) and the load dropped very fast. However, the load - deformation curve shows a somewhat different behaviour and are shown Appendix C, but since the ultimate load were reached without problems, the results from this specimen was evaluated and presented among the other results.
6.5. Test evaluationThe test results were evaluated with respect to the EN 1993-1-5, i.e. eq. (2.27) and eq. (2.29) in chapter 2. The calculations are based on the mean values for each specimen, i.e. the mean width for all four plates and the mean values concerning the mechanical properties. This is also the case concerning the plate thickness, which is determined through measurement of the coupons used in the material tests.
In Figure 6.10 and Figure 6.11 the results are plotted in comparison to the Winter function, i.e. eq. (2.24).

104
Figure 6.10: The evaluated results from the 48 specimens along with the Winter function. Plate slenderness calculated according to EN 1993-1-5.
Figure 6.11: The experimental results, Fexp,with respect to the predicted resistance, FR, according to EN 1993-1-5, i.e. the Winter function. The plate slenderness calculated according to EN 1993-1-5.
Regarding the evaluated test data some things are important to be pointed out. Firstly, the scatter between the results for each group of tests is small for the more slender specimens. Some differences can be noticed for the slender specimens, especially concerning the slenderness value of the plates. The origin of these differences is mostly dependent of the different strength
0 0.5 1 1.5 2 2.5 3Slenderness, P
0
0.5
1
1.5F e
xp/F
y
Domex 420Weldox 700Weldox 1100EN 1993-1-5
0 0.4 0.8 1.2 1.6 2Slenderness, P
0
0.5
1
1.5
2
F exp
/FR
Domex 420Weldox 700Weldox 1100EN 1993-1-5

Local Buckling - Experimental Work
105
of the steel, due to the differences in the rolling direction. Though, these differences seem to be less pronounced with increasing steel strength. Furthermore, the scatter between each test tend to be larger for the specimens with p< 0,9.
6.6. Concluding remarksConsidering Figure 6.10 the evaluated test results seems to be consistent within each test
group, i.e. plate slenderness value concerning each grade. This is even more obvious regarding the most slender specimens where the four tests of each grade are nearly four repetitions of each test (the same ultimate load reached for each specimen). Moreover, another conclusion may be drawn based on this fact and this is simply that the test procedure seems to have been consistent with small differences between each specimen test.
When comparing the test results with the Winter function (i.e. EN 1993-1-5) the more stocky plates, p < 0,9, seems to be spread around with the reduction function, see Figure 6.11. The resistance may even be somewhat higher than predicted through the Winter function. Considering these more stocky specimens, the ones of the “lower” strength steel seems to have a higher resistance than the high strength steel specimens which is positioned closer or on the Winter function in Figure 6.11. However, this may have its origin in the difference in mechanical behaviour and how the material properties are regarded as discussed above.
Regarding the other range of specimens, p > 0,9, the opposite has to be concluded. The Winter function seems to overestimate the resistance concerning more slender plates. This completely independent of steel grade. However, if Figure 6.11 is considered along with the Figure 6.10, the specimens of high strength steel seems to coincide better with the Winter function.
Considering all of the evaluated and presented test results the following may be concluded:
• The Winter function tends to describe the mean value of the resistance of stockier specimens. In this case plates with p < 0,9.
• The Winter function overestimates the resistance of more slender plates. In this case plates with p > 0,9.
• Plates made of high strength steel may be treated in the same way as “ordinary” grades with respect to the local buckling resistance.
• With respect to the Winter function, no difference between the specimens with different rolling direction could be concluded.
Considering the evaluation of the test results, one obvious difference, regarding the mechanical properties of the steel, in the evaluation procedure has to be mentioned. The slight difference between the specimens of the Domex and Weldox specimens concerns the used

106
material properties, i.e. yield strength for Domex and 0,2% proof stress concerning Weldox specimens. This different approach is dependent of the lack of well defined yield plateau considering the Weldox grade, still the hardening properties of these grades influences the evaluation. This in the way that the difference between the ultimate strength and the stress defined as fy is larger for the steels with lower strength, i.e. a well defined yield limit. This leads to that the calculated critical stress level considering the Weldox specimens will be in an unfavourable position since the stress level defined as yield stress is closer to ultimate strength of the steel. In the evaluation of the experimental work, this leads to a lower reduction factor, hence a lower position if plotted with the Winter function as a reference.
When considering the actual experimental work some things are important to state. First, the measurement of the buckling growth has not been implemented nor evaluated in this thesis. This data was herein excluded due to the fact that this test data was considered to give no further valuable information or possibilities to conclude with respect to the aim of this thesis. Furthermore, the measured initial geometric plate imperfections were neither implemented herein.
Local Buckling - Design Proposal
107
Chapter 7:
Local Buckling - Design Proposal
7.1. BackgroundThe results from the experimental investigation regarding local buckling of the box-
sectioned specimens presented in previous chapter 6, the Winter function seems to be a somewhat inappropriate choice when calculating the ultimate resistance to uniformly distributed compressive stresses for plates heavy welded or with large welds compared to the dimensions of the considered plate. Emphasizing that the Winter function was based on tests of cold-formed specimens, the actual residual stress magnitude and distribution of a plate with large welds may not be a plate represented by the Winter function. When cold-forming profiles, one do not only produce the wanted profile without welding, but also changes the material properties as well as inducing residual stresses. Introducing these changes the material behaviour, may lead to an incompatibility issue when compared directly with welded plates. Even though the boundary conditions of the respective plates are the same, i.e. simply supported around all edges in this case, the differences on a deeper level may leave the researcher astonished when comparing their test results with the Winter function. The cause of this may be the different residual stress state between welded plates and cold-formed. Furthermore, cold-forming induces plastic strains into the material. Experimental work has shown that cold-formed profiles have significantly higher proof stresses and ultimate strength levels in the area of forming, i.e. corners of a box section, Gardner (2002) and Talja (2002). These increases in the material resistance of course affects the over-all behaviour of such a specimen.
Furthermore, if considering the residual stress state in a cold-formed profile compared to a welded section of the same dimensions, the magnitudes of compressive stresses in the flat sides of the former seems to be lower than the corresponding ones in the welded profile, Ingvarsson (1977). Lower levels of compressive residual stresses increases the resistance. Moreover, the definition of the plate width regarding a cold-formed profile also influences the outcome, e.g. if the plate width is the flat side alone (inner or outer side) or as the distance between the centres of the corners. Thus, the Winter function may not on a phenomenological basis be comparable with welded plates. However, the influence of the residual stresses in the plates should have less influence on the resistance when the plate slenderness is lower (more plastic buckling).

108
Veljkovic and Johansson (2001) comprises FE studies of plates with and without residual stresses and concluded that the Winter function is more suitable to use for plates without significant residual stresses or stress relieved. This is not the case concerning plates in as-welded condition. Similar conclusions were also drawn by Rusch and Lindner (2001).
When considering Figure 7.1, comprising the collected data from the literature (see chapter 5) and the experimental results presented in chapter 6, the outcome seem to coincide, or at least describe the mean value of the results discussed above. Regarding plates of different steel grades, it seems like the Winter function may be a more suitable function to use when the plate slenderness is lower. Regarding more slender plates, p> 0,9, the Winter function overestimate the resistance concerning all the plates in the herein used data base.
Figure 7.1: The evaluated test data from 48 box specimens along with data acquired from relevant literature resulting in a total of 85 specimens tested with respect to local buckling.
Nevertheless, the results presented in this thesis shows that steel with higher strength may be treated in the same way as “ordinary” steel grades. The high strength steel may even coincide a bit better with the Winter function than steels with lower strength (fy < 460 MPa), see chapter 6.
7.2. Proposal and validation of new reduction functionStudying the work conducted regarding the ultimate patch loading resistance, or more
specifically the reduction function proposed regarding the patch loading (see chapter 4 and Figure 4.1) this reduction function seems suitable to use also concerning local buckling, however with the plateau set to 1,0. Hence, the proposed reduction function will be
0 0.4 0.8 1.2 1.6 2Slenderness, P
0
0.5
1
1.5
F exp
/Fy
Domex 420Weldox 700Weldox 1100Tests from literatureMean function, (eq. 5.1)EN 1993-1-5

Local Buckling - Design Proposal
109
(7.1)
and
(7.2)
Compared to the Winter function (Figure 7.1) and the experiments from literature and presented herein the proposed reduction function according to eq. (7.1) and eq. (7.2) seems to better predict the ultimate resistance of plates with larger welds, Figure 7.2. However, the more stocky specimens of the 13 tests by Dwight and Moxham (1969) seems to present ultimate loads surprisingly low regarding the specimens used, see Figure 5.4. The reason for this is difficult to herein explain or debate.
Figure 7.2: The experimental ultimate load Fexp in relation to the yield load, Fy,as a function of the plate slenderness p put in comparison to the proposed reduction function, eq. (7.1).
However, comparing the proposed reduction function in Figure 7.2 with the Winter function used in EN 1993-1-5 shown in Figure 7.1 it is clear that predicting the ultimate plate buckling load according to the proposal is more accurate. This only regarding plates with larger welds and not stress relieved in any way, i.e. as-welded condition. Further, the proposed reduction function is evidently proper to use regardless of steel strength or at least within the interval of the data from literature and experiments, i.e. from a yield stress, fy, of approximately 258 MPa to Rp0.2 of around to 1350 MPa.
P1
P P2
P–+------------------------------------- 1 0,=
P12--- 1 0 5, P 0 6,– P++=
0 0.4 0.8 1.2 1.6 2Slenderness, P
0
0.5
1
1.5
F exp
/Fy
Domex 420Weldox 700Weldox 1100Tests from literatureProposal

110
Regarding the design resistance, FR, this is determined in the same manners as in EN 1993-1-5, i.e. according to eq. (7.3).
(7.3)
As the last step in the validation work of the proposed model, a partial safety factor was calculated in accordance to the recommendations of Annex D in EN 1990 (2002). The method of the statistical evaluation is shown in the patch loading oriented Appendix B, and the results of the local buckling results of how the partial safety factor, M1 = 1,07 is shown in Appendix C. Even though, this safety factor is higher than the 1,0 recommended in EN 1993-1-5, the herein presented material shows that the proposed reduction function is much more appropriate to use regarding plates with large welds.
7.3. Concluding remarksWithin this chapter a reduction function suitable to use for plates with large welds was
presented. The Winter function used in EN 1993-1-5 was based on tests of cold-formed specimens which usually have lower compressive residual stresses inherent, than compared to plates with large welds.
Furthermore, it was shown that steel with a higher strength have the same resistance with respect to local buckling when compared to more commonly used structural steel. Moreover, the high strength steels may even be better to use regarding local buckling related issues as shown in Figure 7.3 when compared to steels with a lower strength.
The experiments used for this evaluation was partly found in the literature (37 tests) and partly (48 tests) made within the scope of this thesis. Different authors have presented a large quantity of tests results, from the 1960’ies until today. As discussed previously herein, using test data from many different laboratories may induce some uncertainties with respect to what is presented in the actual published report, how quantities are measured, deformation rates etc. The evaluation of the local buckling resistance was made on measured values, e.g. the yield strength measured by the authors. Though, was the yield strength measured in the same manners in 1968 than it was in 2004 with respect to the recommendations in EN 10002-1 (2001)? Was the welding techniques comparable with the fashions of which plates are welded today, e.g. filler material, energy input etc.? Since the yield strength is a dominant factor when predicting the ultimate plate buckling resistance of a plate, this also makes the evaluation of the tests results inherit the same uncertainties. With this in mind an additional statistical evaluation was conducted, comprising only contemporary results which in this case meaning results from the 1990’ies and forward. With this manoeuvre, the data base comprised 60 individual specimens for which the partial safety factor was determined with respect to the proposed reduction function. The key values of this evaluation are displayed in Appendix C, though the corrected partial safety factor was calculated to 1,03.
FRd P Fy M1=

Local Buckling - Design Proposal
111
Figure 7.3: The experimental results from the tests made at LTU and gathered from the literature, Fexp, in relation to the predicted resistance of the proposal, FR, as a function of the yield strength of the steel in the specimens. A total of 85 specimens are shown.
Regarding the definition of how large the weld have to be in relation to the plate dimensions to be stated as “large” have not been studied herein. Though, the swedish design code Handboken Bygg (1994) recommends two different reduction functions for welded plates. For plates with welds > 0,5t a larger reduction is made than for plates with welds smaller than that. However, the other dimensions of the plate are probably not unimportant, i.e. if the weld is positioned along the edge of a wide plate the negative influence of the buckling resistance in the middle of the plate would be small. Nevertheless, the herein proposed reduction function was within this chapter shown to be more suitable to use regarding plates with welds when compared to the Winter function.
0 200 400 600 800 1000 1200 1400fy [MPa]
0
0.5
1
1.5
2
2.5F e
xp/F
RTests made at LTUTests from the literatureProposal

112

Discussion and Conclusions
113
Chapter 8:
Discussion and Conclusions
8.1. Patch loading - DiscussionPreviously within this thesis, a modified reduction function was proposed for use to predict
the ultimate patch loading resistance of longitudinally stiffened webs. Moreover, a proposal regarding the prediction of the elastic critical load of the stiffened web was introduced. The design approach was based on the renowned method for unstiffened webs of Lagerqvist (1994) which later was slightly simplified and introduced as the design rule in EN 1993-1-5. Though, parts of the EN 1993-1-5 rules for prediction of the patch loading resistance have been questioned and with Gozzi (2007) a modified design approach regarding unstiffened webs was presented. The proposal of Gozzi eliminated the questioned part and was shown to predict the patch loading resistance for unstiffened webs well.
The mechanical model of Lagerqvist was also used and evaluated in Graciano (2002) to be compatible concerning stiffened webs. The work presented in Graciano was also introduced in the EN 1993-1-5 and design rules for webs stiffened with one longitudinal stiffener. However, the EN 1993-1-5 only regards the elastic critical buckling load for the stiffened web as a whole which is contradictive to the observations of some experimental work presented. Furthermore, numerical work presented in Davaine and Aribert (2005) showed that the rules of EN 1993-1-5 predicted the patch loading resistance heavily conservative regarding simulations with a higher b1 / hw ratio. Thus the authors introduced a critical buckling load estimation concerning the upper (directly loaded) panel alone. The buckling load for the web was then proposed to be estimated using an interaction formulation of the EN 1993-1-5 critical load for the whole web and the critical load for the upper panel.
The herein proposed resistance model is consistent with the proposal for unstiffened girder webs of Gozzi (2007) with respect to reduction function and mechanical model describing the failure behaviour of a girder subjected to patch loading. Furthermore, the elastic critical load was herein proposed to be estimated as the lowest buckling load comparing the EN 1993-1-5 (the whole panel) and the upper panel. This was a subjective choice by the author of this thesis since the idea of two buckling modes interacting seems somewhat contradictive or inappropriate to use with the von Kármán concept of determining the slenderness of a plate. The concept
114
proposed herein which instead uses the minimum value of two possible buckling modes is probably more uncomplicated and obvious to a user (e.g. structural designer), moreover consistent with respect to design rules concerning other phenomena.
Another not too obvious ingredient in the EN 1993-1-5 is, according to the author, the use of the - parameter, i.e. . This parameter was, to the best of the authors knowledge, introduced as a modifier to uncertainties regarding the behaviour of steel with fy > 235 MPa. However, the herein presented experimental work regarding local buckling shows that the parameter may not be adequate. Moreover, regarding patch loading resistance the use of the parameter to determine the contributory part of the web to the longitudinal stiffener is debatable. The rule implies that if two geometrically identical girders, though one being made of a steel with higher yield strength of the web compared to the other, will have different second moment of area for the stiffener, Ist, when designed according to the EN 1993-1-5.
Considering the experimental data gathered from the literature, some of the specimens were tested two times. First patch loading on one flange until failure, then turning the girder and performing a second test applying patch loading on the un-damaged flange. Inspecting the results from these tests, it is evident that the second test is influenced by the first since in most cases the ultimate patch loading resistance is lower the second time. Nevertheless, considering these sequel experiments on the same basis as other tests only loaded one time, the choice of doing this should be safe since the resistance should be higher than the experimental results shows.
A possible interaction between patch loading and bending moment of longitudinally stiffened girders could not be proved herein. However, patch loading experiments with longitudinally stiffened girders with a high utilization of the bending moment resistance are not common in the literature. Hence any conclusions regarding the matter will not be stated within this thesis. Though, Graciano and Casanova (2004) presented numerical simulations used to study this matter, and according to the authors the patch loading resistance of a longitudinally stiffened girder could be reduced with more than 60% if the bending moment resistance was utilized in larger extent.
8.2. Local buckling - DiscussionAs presented previously within this thesis, in Europe the common procedure to predict the
ultimate local buckling resistance of simply supported plates subjected to compression stresses is based on the effective width concept. Calculating the effective width according to the Eurocode EN 1993-1-5 will include the use of the Winter function, established by testing cold-formed specimens, Winter (1947).
235 fy MPa
Discussion and Conclusions
115
Previous conducted and presented research work have shown that by cold-forming a structural profile, not only the residual stress distributions and magnitudes differs when compared to a welded specimen, but the material properties may also be significantly different. Gardner (2002) and Talja (2002) both shows that parts of the cold-formed profiles have a higher proof strength if compared to welded specimens. Regarding the residual stresses present in a cold-formed profile compared to a similar welded profile, the compressive stresses in the webs of the cold-formed profile are commonly lower than in the welded ditto, Ingvarsson (1977). Since the compressive residual stresses decreases the ultimate load resistance, a plate with welds along its edges will in all likelihood have a lower local buckling resistance than compared to the same plate in a cold-formed profile.
As shown in chapter 5 and chapter 6 the Winter function is evidently not appropriate to use considering plates with larger welds. In this case large welds in the meaning that the welding procedure governs compressive residual stresses of such an extent that these surpass the actual initial stress state in the cold-formed profiles used deriving the Winter function. The applicability of the Winter function has been questioned, not only herein, but supporting FE studies may be found in Veljkovic and Johansson (2001). This article presents numerical simulations of plates with and without residual stresses and concludes that the Winter function is more suitable to use regarding plates without any significant residual stresses, e.g. cold-formed or stress relieved plates. Furthermore, Rasmussen and Hancock (1992) also concludes that the Winter function overestimates the resistance of welded plates and the mean curve for as-welded plates of Fukumoto and Itoh (1984) further proves the statement. The swedish design code BSK 99 (2003) uses a distinctive limit of what should be treated as a plate with “large” welds or not. The throat thickness of the weld, a, is compared to the plate thickness and if a > 0,5t the effective width of the plate is estimated to be smaller in comparison to the contrary. Similar approaches may be found in other design regulations, e.g. the Australian Standard AS 4100 (1990) which uses two curves (LW - Light welded and HW - Heavily welded). Though, since also the other plate dimensions influences the magnitude and distribution of weld induced residual stresses, a curve decision solely based on the weld thickness in comparison to the plate thickness may be a bit subjective.
When it comes to the data base of the square hollow sections, both from the literature and conducted tests, it was shown that disregarding tests made before the 1990’ies (25 specimens) improved the performance of the proposed reduction function in comparison to the test results. Gathering tests results from the literature often brings uncertainties regarding the specimen data and results of the experiments, e.g. “how was it measured, what techniques were used?”. Furthermore, the results from the tests of some of the more stocky tests were surprisingly low which may be a result of differences between how the experiments were performed at the different laboratories and maybe also differences in followed experimental guides, norms and / or regulations used. An example may be how the yield strength is measured. It is well known that the out-come of tension tests, usually yield and ultimate strength, of steel coupons are

116
strongly dependent of the deformation/strain rate. Hence, questions rise whether determining the mechanical properties was made in the same manners regarding tests made in the 60’ies as tests during the 90’ies? Further, since the prediction of the ultimate buckling load is strongly dependent of the yield strength of the considered plate, an answer to the low resistance may possibly be found here.
Regarding the experiments conducted on specimens made of high strength steel, it was shown that square hollow sections made of steels with higher strength may have a higher resistance to local buckling when compared to specimens fabricated of more commonly used structural steels. However, the fact that the magnitude and distribution of the compressive residual stresses strongly influences the ultimate buckling resistance is well known. Though, this higher resistance of the high strength steel specimens may be a result of lower residual stresses in relation to the strength of the steel. In Clarin (2004) the residual stresses was measured and compared regarding the specimens used for the local buckling tests presented herein. When the three different steel grades were compared, it seemed like the magnitude of the residual stresses was the same for all the specimens. However in relation to the yield strength or proof stress the ratio was lower for the high strength steels. This could be an explanation of why the high strength steel specimens have a better resistance to local buckling. Though, it is important to remember that the yield strength of the filler material in the weld is influencing the magnitude of the residual stresses. According to the knowledge of the author, there are no matching filler material regarding high strength steels as of today. Hence, the high strength steel specimens were welded with an undermatching weld which possibly led to unconventionally low residual stresses when compared to the common steel grade specimens.
8.3. ConclusionsWithin this thesis, the following conclusions are drawn from the presented work regarding
patch loading resistance of longitudinally stiffened webs and local buckling resistance of simply supported plates.
• The experimental work comprising 48 stub columns with a square hollow section made of three different steel grades was concluded to have been conducted with success. The scatter within the different test groups were small and the tests results overall comparable with results found in the literature.
• Based on experimental results, plates made of high strength steel was concluded to perform slightly better than common structural steel plates, compared with sole respect to the local buckling resistance. Thus, it was concluded that no further special attention has to be paid when using high strength steel in buckling related design.

Discussion and Conclusions
117
• The proposed reduction function regarding the effective plate width was, by comparison to 85 individual tests, concluded to be more suitable to use for heavily welded plates than the Winter function used in EN 1993-1-5.
• When compared to EN 1993-1-5 the proposed patch loading resistance model was shown to reduce the scatter and improve the prediction accuracy. Furthermore, the proposal was concluded to safely predict the resistance of webs stiffened with a stiffener with open as well as a closed cross-section.
• The proposed patch loading resistance approach, consistent with the model for unstiffened girders of Gozzi (2007), was statistically evaluated with respect to Annex D of EN 1990 (2002). In comparison to 160 experiments and 366 numerical simulations the partial safety factor M1 = 1,0 is proposed.
8.4. Proposals for future workUsually when a topic is investigated with effort more questions appears along the way.
Working on this thesis was not an exception to this and within this section some proposals of further studies are posted.
The performance of proposed reduction function simply supported welded plates still needs to be investigated with respect to its other applications, e.g. effective cross-section calculations of girders subjected to bending moments. Furthermore, the ultimate resistance with respect to local buckling is strongly influenced of the present residual stress state in the plate. Thus, it would be of interest to investigate if plates of high strength steel, heavily welded with matching filler material, would be in line with the conclusions herein; that plates made of high strength steel seems to resist buckling better than common structural steel grades.
Regarding the ultimate patch loading resistance for webs stiffened with a closed stiffener, the data found in the literature was limited. Furthermore, most of the evaluated tests seemed to be predicted conservatively with respect to the proposed model. Questions rose wether the estimation of the elastic critical load for such a girder could be predicted too low. A higher critical load would lower the slenderness value of the web, hence also a lower reduction due to buckling. An improved estimation of the critical buckling load regarding such stiffened webs would be interesting to perform, by means of numerical simulations and / or experiments.
Further, the herein proposed design procedure was only validated with respect to one longitudinal stiffener. To widen the applicability further, this could also be verified through comparison to webs with additional stiffeners. The most straightforward approach of this would according to the author be by further investigate the critical load for such girders.
As no conclusions could be drawn regarding the possible patch loading / bending moment interaction, this would be possible to study further. The limited amount of experimental work

118
studying this creates a void to fill. Furthermore, numerical simulations regarding the issue have been conducted, e.g. Graciano and Casanova (2004), nevertheless not, to the best knowledge of the author, presented in such a way that these could be further evaluated by other researchers. Hence, more experiments regarding the possible interaction would be beneficial for the steel researchers around the world.
This thesis was focused only on patch loading and not opposite or end patch loading. Hence the herein proposed resistance approach still needs to be validated with respect to these two load cases.

References
119
Chapter 9:
References
AS4100-1990 - Steel Structures. (1990). Standards Association of Australia, Sydney, Australia. (ISBN: 0-7262-6493-8).
Bergfelt, A. (1971). “Studies and tests on slender plate girders without intermediate stiffeners”, Proceedings of IABSE Colloquium, London, 1971. pp. 67-83.
Bergfelt, A. (1979). “Patch Loading on a Slender Web - Influence of Horizontal and Vertical Web Stiffeners on the Load Carrying Capacity”, Publication S 79:1, Department of Structural Engineering, Division of Steel and Timber Structures, Chalmers University of Technology, Göteborg.
Bergfelt, A. (1983). “Girder Web Stiffening for Patch Loading”, Publication S 83:1, Department of Structural Engineering, Division of Steel and Timber Structures, Chalmers University of Technology, Göteborg. (ISSN: 0534-0411).
Bossert, T.W. and Ostapenko, A. (1967). “Buckling and ultimate loads for plate girder web plates under edge loading”, Fritz Engineering Laboratory Report No. 319.1, Department of Civil Engineering, Lehigh University, Bethlehem-PA, USA.
Brush, D.O. and Almroth, B.O. (1975). “Buckling of Bars, Plates and Shells”, McGraw-Hill Inc., USA. (ISBN: 0-07-008593-5).
BSK 99 - Swedish Regulations for Steel Structures. (2003). Boverket, Sweden. (ISBN: 91-7147-732-2).
Carretero, A. and Lebet, J.-P. (1998). “Introduction de Forces Concentrées dans les Poutres Élancées”, Construction Métallique, No. 1, 1998. pp. 5-18. (In French).
Cevik, A. (2007). “A new formulation for longitudinally stiffened webs subjected to patch loading”, Journal of Constructional Steel Research, Vol. 63. pp. 1328-1340.
Clarin, M. (2004). “High Strength Steel - Local Buckling and Residual Stresses”, Lic.Thesis 2004:54, Division of Structural Engineering - Steel Structures, Luleå University of Technology, Luleå. (ISRN: LTU-LIC--04/54--SE).

120
Davaine, L., Raoul, J. and Aribert, J.-M. (2004). “Patch load resistance of longitudinally stiffened bridge girders”, Proceedings of the International symposium on steel bridges “Steelbridge 2004”, Millau, France, June 23-25, 2004.
Davaine, L. and Aribert, J.-M. (2005). “Launching of steel girder bridge - Patch load resistance of longitudinally stiffened webs”, Proceedings of 4thEuropean Conference on Steel and Composite Structures, Maastricht, The Netherlands, June 8-10, 2005.
Davaine, L. (2005). “Formulations de la réststance au lancement d’une âme métallique de pont raide longitudinalement”, Doctoral Thesis D05-05, INSA de Rennes, France. (In French).
Davids, A.J. and Hancock, G.J. (1986). “Compression Tests of Short Welded I-Sections”, Journal of Structural Engineering, Volume 112, No. 5, May 1986.
Dogaki, M., Murata, M., Nishijima, Y., Okumura, T. and Yonezawa, H. (1990). “Ultimate strength of plat girders with longitudinal stiffeners under patch loading”, Technology Reports of Kansai University, Vol. 33, 1990. pp. 121-132.
Dubas, P. and Gehri, E. (1986). “Behaviour and Design of Steel Plated Structures”, ECCS - Technical committee 8 - Structural stability, Technical working group 8.3 - Plated Structures, ECCS printing No. 44, 1st edition. Swiss Federal Institute of Technology, Zürich, Switzerland.
Dubas, P. and Tschamper, H. (1990). “Stabilité des Âmes Soumises à une Charge Concentrée et à une Flexion Globale”, Construction Métallique, No. 2, 1990. pp. 25-39. (In French).
Dwight, J.B., Chin, T.K. and Ractliffe, A.T. (1968). “Local Buckling of Thin-walled Columns, Effect of Locked-in Welding Stresses”, CIRIA, Res. Rep. No. 12, May 1968.
Dwight, J.B. and Moxham, K.E. (1969). “Welded Steel Plates in Compression”, The Structural Engineer, No. 2, February 1969.
EN 10002-1:2001 (2001) - “Metallic materials - Part 1: Method of test at ambient temperature”, CEN, European Committee for Standardization, Brussels, Belgium.
EN 1990. (2002). “Eurocode - Basis of structural design”, CEN, European Commitee for Standardization, Brussels, Belgium.
EN 1993-1-5. (2006). “Eurocode 3 - Design of steel structures - Part 1.5: Plated structural elements”, CEN, European Committee for Standardization, Brussels, Belgium.
Farshad, M. (1994). “Stability of Structures”, Developments in civil engineering Vol. 43, Elsevier Science B.V, Amsterdam, The Netherlands. (ISBN: 0-444-81698-4).

References
121
Fukumoto, Y. and Itoh, Y. (1984). “Basic Compressive Strength of Steel Plates from Test Data”, Proceedings Japanese Soc. Civ. Eng., No. 344, April 1984. pp. 129-139.
Galea, Y., Godart, B., Radouant, I. and Raoul, J. (1987). “Tests of buckling of panels subjected to in-plane patch loading”, ECCS Colloquium on Stability of Plates and Shell Structures, Ghent University, Belgium. 6-8 April. pp. 65-71.
Gardner, L. (2002). “A New Approach to Structural Stainless Steel Design”, Ph.D. Thesis, Department of Civil and Environmental Engineering, Imperial Collede of Science, Technology and Medicine, London, U.K.
Gozzi, J. (2004). “Plastic Behaviour of Steel - Experimental Investigation and Modelling”,Lic.Thesis 2004:51, Division of Structural Engineering - Steel Structures, Luleå University of Technology, Luleå. (ISRN: LTU-LIC--04/51--SE).
Gozzi, J. (2007). “Patch loading resistance of plated girders - Ultimate and serviceability limit state”, Doctoral Thesis 2007:30, Division of Structural Engineering - Steel Structures, Luleå University of Technology, Luleå. (ISRN: LTU-DT--07/30--SE).
Graciano, C. (2002). ”Patch Loading - Resistance of Longitudinally Stiffened Steel Girder Webs”, Doctoral Thesis 2002:18, Division of Steel Structures, Luleå University of Technology, Luleå. (ISSN: 1402-1544).
Graciano, C.A. and Edlund, B. (2003). “Failure mechanism of slender girder webs with a longitudinal stiffener under patch loading”, Journal of Constructional Steel Research, Vol. 59. pp. 27-45.
Graciano, C. and Casanova, E. (2005). “Ultimate strength pf longitudinally stiffened I-girder webs subjected to combined patch loading and bending”, Journal of Constructional Steel Research, Vol. 61. pp. 93-111.
Graves Smith, T.R. and Gierlinski, J.T. (1982). “Buckling of stiffened webs by local edge loads”, ASCE - Journal of the Structural Division, No. 108. pp. 1357-1366.
Grotmann, D. (1993). “Proposal for ‘European plate buckling curves’ including high strength steel property parameters”, Lehrstuhl für Stahlbau, RWTH Aachen.
Ingvarsson, L. (1977). “Cold-Forming Residual Stresses and Box Columns Built Up by two Cold-Formed Channel Sections Welded Together”, Bulletin No. 121 of The Department of Building Statics and Structural Engineering, The Royal Institute of Technology, Stockholm, Sweden, July 1977.
Janus, K., Kárníková, I. and Skaloud, M. (1988). “Experimental investigation into the ultimate load behaviour of longitudinally stiffened steel webs under partial edge loading”, ACTA Technica CSAV, No. 2. pp. 158-195.

122
Johansson, B. and Lagerqvist, O. (1995). ”Resistance of plate edges to concentrated forces”, Journal of Constructional Steel Research, Vol. 32. pp. 69-105.
Johansson, B., Maquoi, R. and Sedlacek, G. (2001). “New design rules for plated structures in Eurocode 3”, Journal of Constructional Steel Research, Vol. 57. pp. 279-311.
von Kármán, T., Sechler, E.E. and Donnell, L.H. (1932). “The Strength of Thin Plates in Compression”, Transactions ASME 1932, Applied Mechanics, APM-54-5.
Kutzelnigg, E. (1982). “Beulwerte nach der linearen Theorie für längsversteifte Platten unter Längsrandbelastung”, Stahlbau 51, Heft 3, 1982. (In German).
Kutmanová, I. and Skaloud, M. (1992). “Ultimate Limit State of Slender Steel Webs Subject to (i) Constant and (ii) Repeated Partial Edge Loading”, Journal of Constructional Steel Research, Vol. 21. pp. 147-162.
Kuhlmann, U. and Seitz, M. (2002). “Behaviour of longitudinally stiffened girder webs subjected to patch loading”, Proceedings of the 3rd European conference on steel structures, Coimbra, Portugal. 19-20 September. pp. 581-590.
Kuhlmann, U. and Seitz, M. (2004). “Longitudinally Stiffened Girder Webs Subjected to Patch Loading”, Proceedings of the International symposium on steel bridges “Steelbridge 2004”, Millau, France, 23-25 June.
Lagerqvist, O. (1994). “Patch Loading - Resistance of steel girders subjected to concentrated forces”, Doctoral Thesis 1994:159 D, Division of Steel Structures, Luleå University of Technology, Luleå. (ISSN: 0348-8373).
Maquoi, R. and Rondal, J. (1986). “From Thick to Thin or from Thin to Thick?”, Proceedings of IABSE Colloquium, Stockholm, 1986. pp. 59-65.
Markovic, N. and Hajdin, N. (1992). “A Contribution to the Analysis of the Behaviour of Plate Girders Subjected to Patch Loading”, Journal of Constructional Steel Research, Vol. 21. pp. 163-173.
Müller, C. (2003). “Zum Nachweis ebener Tragwerke aus Stahl gegen seitliches Ausweichen”, Heft 47, Lehrstuhl für Stahlbau, RWTH Aachen. (ISBN: 3-8322-1574-3). (In German).
Möller, M. and Johansson, B. (1995). “Buckling Tests on Rectangular Plates made of two Different Types of Weldox 1100 Steel”, Division of Steel Structures, Luleå University of Technology, Internal Printing 1995:05.
Nishino, F., Ueda, Y. and Tall, L. (1967). “Experimental Investigation of the Buckling of Plates with Residual Stresses”, ASTM Special Technical Publication, No. 419.pp. 12-30.

References
123
Nylander, H. (1951). “Initially deflected thin plate with initial deflections affine to additional deflection”, IABSE Publications 1951.
Rasmussen, K.J.R. and Hancock, G.J. (1992). “Plate Slenderness Limits for High Strength Steel Sections”, Journal of Constructional Steel Research, Vol. 23. pp. 73-96.
Roberts, T.M. and Rockey, K.C. (1978). “Méthode pour prédire la charge de ruine d’une poutre a âme mince soumise a une charge semi-répartie dans le plan de l’âme”, Construction Métallique, No. 3. pp. 3-13. (In French).
Roberts, T.M. and Rockey, K.C. (1979). “A mechanism solution for predicting the collapse loads of slender plate girders when subjected to in-plane patch loading”, Proceedings of the Institution of Civil Engineers, Part 2, 67. pp. 155-175.
Roberts, T.M. (1981).”Slender plate girders subjected to edge loading”, Proceedings of the Institution of Civil Engineers, Part 2, 71. pp. 805-819.
Roberts, T.M. and Chong, C.K. (1981). “Collapse of plate girders under edge loading”, ASCE - Journal of the Structural Division, No. 107. pp. 1503-1509.
Rockey, K.C., Bergfelt, A. and Larsson, L. (1978). “Behaviour of longitudinally reinforced plate girders when subjected to inplane patch loading”, Publication S 78:19, Department of Structural Engineering, Division of Steel and Timber Structures, Chalmers University of Technology, Göteborg.
Rockey, K.C., Samuelsson, A. and Wennerström, H. (1979). “The Buckling of Longitudinally Reinforces Web Plates Loaded by a Central In-plane Patch Load”,Stability problems in engineering structures and componets, Richards, T.H. and Stanley, P. editors, Applied Science Publishers LTD., London, 1979. pp. 75-88.
Rusch, A. and Lindner, J. (2001). “Tragfähigkeit von beulgefährdeten Querschnittselementen unter Berücksichtigung von Imperfektionen”, Stahlbau 70, Heft 10, 2001. (In German).
Seitz, M. (2005). “Tragverhalten längsversteifter Blechträger unter quergerichteter Krafteinleitung”, Doctoral Thesis Nr. 2005-2, Institute of Structural Design, Universität Stuttgart, Germany. (ISSN: 1439-3751). (In German).
Shimizu, S., Yoshida, S. and Okuhara, H. (1987). “An experimental study on patch-loaded web plates”, ECCS Colloquium on Stability of Plates and Shell Structures, Ghent University, Belgium. 6-8 April. pp. 85-94.
Shimizu, S., Yabana, H. and Yoshida, S. (1989a). “A New Collapse Model for Patch-Loaded Web Plates”, Journal of Constructional Steel Research, Vol. 13. pp. 61-73.
Shimizu, S., Horii, S. and Yoshida, S. (1989b). “The Collapse Mechanisms of Patch Loaded Web Plates”, Journal of Constructional Steel Research, Vol. 14. pp. 321-337.

124
Talja, A. (2002). “Test Results of RHS, Tophat and Sheeting Profiles”, Technical Research Centre of Finland, VTT Building and Transport, Internal Report: RTE50-IR-28/2002.
Timoshenko, S.P. and Gere, J.M. (1963). “Theory of Elastic Stability”, 2nd edition, McGraw-Hill International Editions. (ISBN: 0-07-Y85821-7).
Ungermann, D. (1990). “Bemessungsverfahren für volland- undkastenträger unter besonderer berücksichtigung des stegverhaltens”, Heft 17, Lehrstuhl für Stahlbau, RWTH Aachen. (ISSN: 0722-1037). (In German).
Veljkovic, M. and Johansson, B. (2001). “Design for Buckling of Plates due to Direct Stress”, Proceedings of Nordic Steel Construction Conference, Helsinki, Finland, June 2001. pp. 729-736.
Walbridge, S. and Lebet, J.-P. (2001). “Patch loading tests of bridge girders with longitudinal web stiffeners”, Rapport d’essais ècole Polyechnique Fédérale de Lausanne, ICOM 447.
Winter, G. (1947). “Strength of Thin Steel Compression Flanges”. Transactions, American Society of Civil Engineers, Vol. 112. pp. 527-554.

APPENDIX A: Patch Loading - Specimen Data
125
APPENDIX A:
Patch Loading - Specimen Data
In this appendix some specimen data of the herein used tested girders is presented. Geometries, some mechanical properties and some of the evaluated results is showed in tables comprising the specimens by author / authors.
In Appendix A.1 some of the data for the specimens used herein is presented. This Appendix comprises all specimens reinforced with an open stiffener which counts 140 individual plated girders of which 136 has been used in the evaluation.
Appendix A.2 contains the specimen data for the plated girders equipped with a closed section stiffener of V- or TRP-shape. The tables in this Appendix contains 24 individual plated girders and a schematic figure presenting the stiffener cross-section.
Some of the important data of the numerical simulations used herein is presented in Appendix A.3. A total of 366 individual simulated plate girders with an open sectioned longitudinal stiffener are presented in the tables.

126

APPENDIX A: Patch Loading - Specimen Data
127
A.1: Data for specimens with open stiffenersTable A.1: 56 of the specimens presented in Janus et. al (1988). TG 1-1, TG 1-2
and TG 1-3 were excluded from the evaluation as presented in section 4.5.
Specimentw
[mm]a
[mm]hw
[mm]fyw
[MPa]tf
[mm]bf
[mm]fyf
[MPa]ss
[mm]b1
[mm]tst
[mm]bst
[mm]Fexp[kN]
ME/MR
Fexp/FRproposal
TG 1-1TG 1-2TG 1-3TG 2-1TG 2-2TG 2-3TG 3-11TG 3-12TG 3-21TG 3-22TG 3-31TG 3-32TG 11-1TG 11-2TG 11-3TG 12-1TG 12-2TG 12-3TG 13-11TG 13-12TG 13-21TG 13-22TG 13-31TG 13-32TG 31-1TG 31-1'TG 31-2TG 31-2'TG 31-3TG 31-3'TG 32-1TG 32-1'TG 32-2TG 32-2'TG 32-3TG 32-3'TG 33-1TG 33-1'TG 33-2TG 33-2'TG 33-3TG 33-3'TG 021-0TG 021-1TG 021-2TG 021-3TG 022-1TG 022-2TG 022-3TG 041-0TG 041-1TG 041-2TG 041-3TG 042-1TG 042-2TG 042-3
222222222222222222222222666666666666666666
2,42,22,22,22,22,22,24,4444444
505505505505505505505505505505505505
100510051005100510051005100510051005100510051005622,5622,5622,5622,5622,5622,5622,5622,5622,5622,5622,5622,5622,5622,5622,5622,5622,5622,5499,2499,4499,4499,4499,4499,4499,4501,6500500500500
498,4498,4
505505505505505505505505505505505505
502,5502,5502,5502,5502,5502,5502,5502,5502,5502,5502,5502,5500500500500500500500500500500500500500500500500500500
499,2499,4499,4499,4499,4499,4499,4501,6500500500500
498,4498,4
236239231234232233236234239232231233191210215204218218191204210218215218
256,4256,4256,4256,4256,4256,4256,4256,4256,4256,4256,4256,4256,4256,4256,4256,4256,4256,4223,7238,2238,2238,2238,2238,2238,2361,8360360360360360360
555555555555555555555555
1212121212121212121212121212121212125,16,166
11,711,911,98,58,47,88,5202020
505050505050505050505050505050505050505050505050120120120120120120120120120120120120120120120120120120100
119,9119,8120,2119,9119,3119,7118,6119,3119,1119,2102,9120,6120,4
439439453453446458485466467471461481293472476295461470303293475469478473
241,7241,7241,7241,7241,7241,7241,7241,7241,7241,7241,7241,7241,7241,7241,7241,7241,7241,7292
309,4309,4309,4238,7238,7238,7262,2262,2262,2262,2285,4285,4285,4
50,550,550,550,550,550,550,550,550,550,550,550,5
100,5100,5100,5100,5100,5100,5100,5100,5100,5100,5100,5100,562,2562,2562,2562,2562,2562,2562,2562,2562,2562,2562,2562,2562,2562,2562,2562,2562,2562,2549,9249,9449,9449,9449,9449,9449,9450,16
50505050
49,8449,84
250250250100100100505050505050250250250100100100505050505050200200125125757520020012512575752002001251257575100100100100100100100100100100100100100100
555555555555555555555555555555555555555555
5,25,55
5,35,75
5,15,18,18,18,57,88,48,4
122030122030121220203030122030122030121220203030808080808080808080808080808080808080
13,331,540,550,230,940,550,117,240,750
60,539,350,760,4
3035
33,536,535,64135423942
47,542,53234
37,532,538
38,22933443443403153003423273703952852952902993513382962763002823723994055
57,56265
66,559192190202
193,5315290276
0,0030,0040,0040,0550,0540,0610,0490,0610,0560,0600,0680,0590,0150,0120,0140,1400,1150,1140,1220,1400,1280,0990,1230,1150,2430,2320,2270,2170,2640,2820,2200,2280,1930,1990,2500,2410,2290,2130,1990,1870,2650,2850,0500,0500,0530,0570,0430,0440,0390,1230,1270,1420,1280,1140,0920,088
---
1,391,361,561,311,591,401,531,681,491,981,932,101,261,301,221,211,351,671,281,591,481,711,631,331,271,231,311,541,601,121,161,161,121,601,501,161,091,231,321,071,521,601,721,431,451,291,181,391,521,411,591,421,35

128
Table A.1: 45 of the specimens with an open stiffener presented in Janus et. al (1988).
Table A.2: Two tests on girders with an open stiffener from Rockey et. al (1978).
Specimentw
[mm]a
[mm]hw
[mm]fyw
[MPa]tf
[mm]bf
[mm]fyf
[MPa]ss
[mm]b1
[mm]tst
[mm]bst
[mm]Fexp[kN]
ME/MR
Fexp/FRproposal
TG 061-0TG 061-1TG 061-2TG 061-3TG 062-1TG 062-2TG 062-3TG 121-1TG 121-2TG 121-3TG 122-1TG 122-2TG 122-3TG 141-1TG 141-2TG 141-3TG 142-1TG 142-2TG-142-3TG-161-1TG-161-2TG 161-3TG 162-1TG 162-2TG 162-3TG 241-1TG 241-1'TG 241-2TG 241-2'TG 241-3TG 241-3'TG 241-4TG 241-4'TG 241-5TG 241-6TG 242-1TG 242-1'TG 242-2TG 242-2'TG 242-3TG 242-3'TG 242-4TG 242-4'TG 242-5TG 242-6
5,65,65,55,55,65,65,6222222444444
5,45,45,45,45,45,44,14,14,14,14,14,14,14,14,14,14,14,14,14,14,14,14,14,14,14,1
498,4498,4500,5500,5498,4498,4498,4500500500500500500500500500500500500
502,2502,2502,2502,2502,2502,2500,2500,2500,2500,2500,2500,2500,2500,2500,2502,2502,2502,2502,2502,2502,2500,2500,2500,2500,2500,2
498,4498,4500,5500,5498,4498,4498,4500500500500500500500500500500500500
502,2502,2502,2502,2502,2502,2500,2500,2500,2500,2500,2500,2500,2500,2500,2502,2502,2502,2502,2502,2502,2500,2500,2500,2500,2500,2
425,7425,7454,5454,5425,7425,7425,7243,8243,8243,8243,8243,8243,8283,3283,3283,3283,3283,3283,3395,6395,6395,6395,6395,6395,6303,9303,9303,9303,9303,9303,9303,9303,9303,9303,9303,9303,9303,9303,9303,9303,9303,9303,9303,9303,9
11,912,312,312,130,430,53066
6,112,112,112,18,48,58,320,320,420,212,412,312,430,430,630,68,38,38,28,18,28,28,18,48,18,219,719,719,819,919,819,919,719,619,619,6
120,289,789,789,499
100100,1119,6119,9119,9120,7120,7120,8120,1120,2120,4120,9120,9120,790,790,890,799,699,3
100,2120,3120,4120,8120,6120,3120,8120,7120,6120,7120,7118,2118,6118,5118,4118,6118,7118,6118,3118,3118,4
238,7276,5276,5276,5253,5253,5253,5274274274
254,1254,1254,1294,3294,3294,3270,3270,3270,3272,1272,1272,1269,3269,3269,3277,5277,5277,5277,5277,5277,5277,5277,5277,5277,5244,4244,4244,4244,4244,4244,4244,4244,4244,4244,4
49,8449,8450,0550,0549,8449,8449,84
505050505050505050505050
50,2250,2250,2250,2250,2250,2250,0250,0250,0250,0250,0250,0250,0250,0250,0250,2250,2250,2250,2250,2250,2250,2250,2250,2250,2250,02
1001001001001001001001001001001001001001001001001001001001001001001001001005050505050505050505050505050505050505050
7,910119,91010105,25,25,25,15,25,18,18,38,18,28,48
1011111011115,25,18,18,18,38,28,28,27,98,15,25,28,18,18,38,38,38,28
8,1
22,832,251,160,132,450,760,516,620,224,915,820,225,220,230,634,419,830,235,925,730,234,725,630,333,91616
20,821,525,525,530,330,435,140,515,415,820,620,424,624,530,230,935,140,4
339387408420564592610555057847276
171156185
256,5248257336
387,5399610600605201196186199199186187210192208243237267259255261264266270285
0,160,200,200,210,160,160,170,060,050,060,050,040,050,110,100,120,090,080,090,180,210,210,160,160,160,140,130,120,130,130,120,130,140,130,140,090,090,100,100,100,100,100,100,100,11
1,131,301,371,421,211,271,321,841,671,892,121,811,911,351,221,461,371,321,371,231,421,461,441,391,401,531,491,391,491,471,371,371,511,381,471,351,311,451,401,361,391,391,401,401,45
Specimentw
[mm]a
[mm]hw
[mm]fyw
[MPa]tf
[mm]bf
[mm]fyf
[MPa]ss
[mm]b1
[mm]tst
[mm]bst
[mm]Fexp[kN]
ME/MR
Fexp/FRproposal
R2R4
2,12
802800
798798
266266
15,555,07
300,5120,4
286285
4040
168162
6,14
6040
7145
0,010,05
1,652,16

APPENDIX A: Patch Loading - Specimen Data
129
Table A.3: 11 specimens with open stiffeners from Bergfelt (1979).
Table A.4: The two specimens with an open stiffeners from Dogaki et. al (1990).
Table A.5: Two specimens with open stiffeners from Galea et. al (1987).
Table A.6: One specimen from Shimizu et. al (1987). The specimen was excluded in the evaluation as mentioned in section 4.5.
Table A.7: Six specimens with open stiffeners from Bergfelt (1983).
Specimentw
[mm]a
[mm]hw
[mm]fyw
[MPa]tf
[mm]bf
[mm]fyf
[MPa]ss
[mm]b1
[mm]tst
[mm]bst
[mm]Fexp[kN]
ME/MR
Fexp/FRproposal
R22 ssR42 ssA12 sA14 sA16 sA22 sA24 sA26 sA32 sA34 sA36 s
2,12222333222
802800
25001200600
25001200600
22001020510
798798800800800800800800680680680
266266300300300245245245354354354
15,555,07151515121212555
300,5120,4300300300250250250120120120
286285295295295265265265290290290
4040404040404040404040
168162160160160160160160136136136
6,14666666444
6040606060606060404040
68,542,5807892
132,697,5
121,445,854,454,7
0,010,040,040,020,010,120,040,030,150,080,04
1,592,041,841,722,301,951,311,861,851,972,27
Specimentw
[mm]a
[mm]hw
[mm]fyw
[MPa]tf
[mm]bf
[mm]fyf
[MPa]ss
[mm]b1
[mm]tst
[mm]bst
[mm]Fexp[kN]
ME/MR
Fexp/FRproposal
Model 4Model 5
3,23,2
897,1892,2
899,1901,5
270270
8,0057,957
181,2180,4
266266
9090
180180
4,74,7
29,738,2
105,42110,36
0,160,16
1,491,56
Specimentw
[mm]a
[mm]hw
[mm]fyw
[MPa]tf
[mm]bf
[mm]fyf
[MPa]ss
[mm]b1
[mm]tst
[mm]bst
[mm]Fexp[kN]
ME/MR
Fexp/FRproposal
P2P3
66
17801780
12741274
2792786
4040
230230
244267
690690
333270
1212
110110
720730
0,850,79
1,181,22
Specimentw
[mm]a
[mm]hw
[mm]fyw
[MPa]tf
[mm]bf
[mm]fyf
[MPa]ss
[mm]b1
[mm]tst
[mm]bst
[mm]Fexp[kN]
ME/MR
Fexp/FRproposal
EL1 6 600 1000 325,2 9 300 235,2 300 200 6 80 438,2 1,02 -
Specimentw
[mm]a
[mm]hw
[mm]fyw
[MPa]tf
[mm]bf
[mm]fyf
[MPa]ss
[mm]b1
[mm]tst
[mm]bst
[mm]Fexp[kN]
ME/MR
Fexp/FRproposal
731732733734735736
333333
300011001100300011001100
735735735735735735
252252252252252252
121212121212
250250250250250250
277277277277277277
40401204040120
250250250150150150
666666
606060606060
93,392,4101
104,7101,8106,3
0,100,040,040,120,040,04
1,421,741,561,551,301,10

130
Table A.8: 12 of the specimens with open stiffeners from Dubas and Tschamper (1990).
Table A.9: The three specimens with open stiffeners from Walbridge and Lebet (2001).
Specimentw
[mm]a
[mm]hw
[mm]fyw
[MPa]tf
[mm]bf
[mm]fyf
[MPa]ss
[mm]b1
[mm]tst
[mm]bst
[mm]Fexp[kN]
ME/MR
Fexp/FRproposal
VT07-4VT07-5VT07-6VT08-4VT08-5VT08-6VT09-4VT09-5VT09-6VT10-4VT10-5VT10-6
3,83,83,83,83,83,83,83,83,83,83,83,8
248017601760248017601760248017601760248017601760
100010001000100010001000100010001000100010001000
375375375358358358371371371380380380
8,358,358,358,38,38,3121212121212
150150150150150150150150150150150150
281281281328328328283283283275275275
404040
240240240404040
240240240
200200200200200200150150150150150150
666666666666
909090909090909090909090
135165170199229235145184180240275288
0,860,120,130,880,160,160,740,110,110,900,160,17
1,451,741,791,401,491,521,471,721,681,691,781,86
Specimentw
[mm]a
[mm]hw
[mm]fyw
[MPa]tf
[mm]bf
[mm]fyf
[MPa]ss
[mm]b1
[mm]tst
[mm]bst
[mm]Fexp[kN]
ME/MR
Fexp/FRproposal
Panel4-C2Panel5-C3Panel6-C3
555
100010001000
700700700
392392392
202020
225225225
355355355
200200200
12575
100
101010
808080
520,6559,9582,1
0,100,110,12
1,321,591,55

APPENDIX A: Patch Loading - Specimen Data
131
A.2: Data for specimens with closed stiffeners
Table A.10: 12 specimens presented in Dubas and Tschamper (1990). The layout of the closed stiffeners according to adjacent figure.
Table A.11: Six plated girders from Carretero and Lebet (1998). The layout of the stiffeners are according to the adjacent figure.
Specimentw
[mm]a
[mm]hw
[mm]fyw
[MPa]tf
[mm]bf
[mm]fyf
[MPa]ss
[mm]b1
[mm]tst
[mm]bst
[mm]Fexp[kN]
ME/MR
Fexp/FRproposal
VT07-1VT07-2VT07-3VT08-1VT08-2VT08-3VT09-1VT09-2VT09-3VT10-1VT10-2VT10-3
3,83,83,83,83,83,83,83,83,83,83,83,8
248017601760248017601760248017601760248017601760
100010001000100010001000100010001000100010001000
375375375358358358371371371380380380
8,358,358,358,38,38,3121212121212
150150150150150150150150150150150150
296296296292292292286286286282282282
404040240240240404040240240240
150150150150150150150150150150150150
222222222222
-
130176172160280300130198210247330315
0,960,130,130,960,210,220,850,120,120,850,200,19
1,341,671,641,091,761,891,171,651,751,551,901,82
Specimentw
[mm]a
[mm]hw
[mm]fyw
[MPa]tf
[mm]bf
[mm]fyf
[MPa]ss
[mm]b1
[mm]tst
[mm]bst
[mm]Fexp[kN]
ME/MR
Fexp/FRproposal
G1-P2G2-P2G4-P4G4-P6G5-P1G6-P2
466666
120012001200180010501050
800800800800800800
405447483483483483
101520202020
160200300300300300
371364399399399399
300300300300200200
160300230160230160
555555
-
436,5632,1590,3698
645,1777,9
0,220,190,080,150,080,09
1,681,591,031,051,351,22

132
Table A.12: Four specimens presented in Kuhlmann and Seitz (2002). The stiffener layout are according to the adjacent figure.
Table A.13: Two specimens from Walbridge and Lebet (2001). The stiffener layout are according to the adjacent figure.
Specimentw
[mm]a
[mm]hw
[mm]fyw
[MPa]tf
[mm]bf
[mm]fyf
[MPa]ss
[mm]b1
[mm]tst
[mm]bst
[mm]Fexp[kN]
ME/MR
Fexp/FRproposal
IIIIIIVV
6666
2400240024002400
1200120012001200
367367373373
20202020
260260260260
396378378378
700700700700
250310250310
4444
-
1034949991958
0,210,200,960,94
1,541,441,471,44
Specimentw
[mm]a
[mm]hw
[mm]fyw
[MPa]tf
[mm]bf
[mm]fyf
[MPa]ss
[mm]b1
[mm]tst
[mm]bst
[mm]Fexp[kN]
ME/MR
Fexp/FRproposal
Panel2-C1Panel3-C2
55
10001000
700700
392392
2020
225225
355355
200200
75125
55 - 699,1
507,40,140,10
1,771,15

APPENDIX A: Patch Loading - Specimen Data
133
A.3: Data for numerical simulationsThe numerical simulations used for the evaluations herein is more thoroughly
presented in Davaine (2005). All the 366 simulations used herein was defined with an open stiffener. In all simulations the yield limit for all steel plates was set to 355 MPa.

134

APPENDIX A: Patch Loading - Specimen Data
135
Table A.14: 63 of the numerical simulations presented in Davaine (2005).
Specimentw
[mm]a
[mm]hw
[mm]tf
[mm]bf
[mm]ss
[mm]b1
[mm]tst
[mm]bst
[mm]Fexp[kN]
ME/MR
Fexp/FRproposal
P101P102P103P104P105P106P107P111P112P113P114P115P116P117P121P122P123P124P125P126P127P131P132P133P134P135P136P137P141P142P143P144P145P146P147P151P152P153P154P155P156P157P161P162P163P164P165P166P167P171P172P173P174P175P176P177P181P182P183P184P185P186P187
202020202020202020202020202020202020202020202020202020202020202020202020202020202020202020202020202020202020202020202020202020
800080008000800080008000800040004000400040004000400040001200012000120001200012000120001200080008000800080008000800080004000400040004000400040004000120001200012000120001200012000120008000800080008000800080008000400040004000400040004000400012000120001200012000120001200012000
300030003000300030003000300030003000300030003000300030003000300030003000300030003000300030003000300030003000300030003000300030003000300030003000300030003000300030003000300030003000300030003000300030003000300030003000300030003000300030003000300030003000
606060606060606060606060606060606060606060606060606060606060606060606060606060606060606060606060606060606060606060606060606060
900900900900900900900900900900900900900900900900900900900900900900900900900900900900900900900900900900900900900900900900900900900900900900900900900900900900900900900900900900900900900900900
100010001000100010001000100010001000100010001000100010001000100010001000100010001000100010001000100010001000100010001000100010001000100010001000100010001000100010001000100010001000100010001000100010001000100010001000100010001000100010001000100010001000
285435585735885103511852854355857358851035118528543558573588510351185287,5437,5587,5737,5887,51037,51187,5287,5437,5587,5737,5887,51037,51187,5287,5437,5587,5737,5887,51037,51187,5
290440590740890104011902904405907408901040119029044059074089010401190
303030303030303030303030303030303030303030252525252525252525252525252525252525252525202020202020202020202020202020202020202020
300300300300300300300300300300300300300300300300300300300300300250250250250250250250250250250250250250250250250250250250250250200200200200200200200200200200200200200200200200200200200200200
6 948 6 987 6 558 6 348 6 009 5 770 5 714 7 906 7 646 7 045 6 705 6 290 6 100 6 061 6 385 6 652 6 559 6 499 6 212 5 945 5 568 6 691 6 838 6 479 6 326 6 068 5 869 5 715 7 649 7 456 6 888 6 584 6 228 6 097 6 071 6 222 6 466 6 472 6 478 6 334 6 332 5 664 6 469 6 688 6 414 6 334 6 134 6 030 5 674 7 441 7 304 6 779 6 510 6 192 6 092 6 077 6 088 6 299 6 387 6 458 6 474 6 144 5 835
0,200,210,190,190,180,170,170,120,110,100,100,090,090,090,280,300,290,290,280,270,250,200,200,190,190,180,170,170,110,110,100,100,090,090,090,270,290,290,290,280,280,260,190,200,190,190,180,180,170,110,110,100,100,090,090,090,270,280,280,290,290,270,26
1,611,521,341,231,181,281,411,561,381,201,211,321,451,621,491,561,481,401,281,251,301,551,511,371,281,201,311,411,541,391,201,191,311,461,621,461,511,471,421,351,331,321,501,501,391,331,251,341,401,531,421,251,181,311,461,631,421,471,461,441,421,311,36

136
Table A.15: 63 of the numerical simulations presented in Davaine (2005).
Specimentw
[mm]a
[mm]hw
[mm]tf
[mm]bf
[mm]ss
[mm]b1
[mm]tst
[mm]bst
[mm]Fexp[kN]
ME/MR
Fexp/FRproposal
P1101P1102P1103P1104P1105P1106P1107P1201P1202P1203P1204P1205P1206P1207P1301P1302P1303P1304P1305P1306P1307P1401P1402P1403P1404P1405P1406P1407P1501P1502P1503P1504P1505P1506P1507P1601P1602P1603P1604P1605P1606P1607P1701P1702P1703P1704P1705P1706P1707P1801P1802P1803P1804P1805P1806P1807P1901P1902P1903P1904P1905P1906P1907
202020202020202020202020202020202020202020202020202020202020202020202020202020202020202020202020202020202020202020202020202020
800080008000800080008000800080008000800080008000800080008000800080008000800080008000400040004000400040004000400040004000400040004000400040004000400040004000400040004000
120001200012000120001200012000120001200012000120001200012000120001200012000120001200012000120001200012000
300030003000300030003000300030003000300030003000300030003000300030003000300030003000300030003000300030003000300030003000300030003000300030003000300030003000300030003000300030003000300030003000300030003000300030003000300030003000300030003000300030003000
606060606060606060606060606060606060606060606060606060606060606060606060606060606060606060606060606060606060606060606060606060
900900900900900900900900900900900900900900900900900900900900900900900900900900900900900900900900900900900900900900900900900900900900900900900900900900900900900900900900900900900900900900900
100010001000100010001000100010001000100010001000100010001000100010001000100010001000100010001000100010001000100010001000100010001000100010001000100010001000100010001000100010001000100010001000100010001000100010001000100010001000100010001000100010001000
297,5447,5597,5747,5897,5
1047,51197,5
2704205707208701020117027542557572587510251175297,5447,5597,5747,5897,5
1047,51197,5
2704205707208701020117027542557572587510251175297,5447,5597,5747,5897,5
1047,51197,5
2704205707208701020117027542557572587510251175
5555555
60606060606060505050505050505555555
60606060606060505050505050505555555
6060606060606050505050505050
50505050505050
30030030030030030030040040040040040040040050505050505050
30030030030030030030040040040040040040040050505050505050
300300300300300300300400400400400400400400
6 043 6 113 6 064 6 126 6 118 6 139 6 155 7 840 7 640 7 109 6 767 6 148 5 672 5 700 7 760 7 568 7 022 6 662 6 076 5 673 5 698 6 596 6 690 6 615 6 702 6 639 6 723 6 677 8 685 8 385 7 855 7 533 6 758 6 005 6 001 8 633 8 311 7 757 7 402 6 669 6 011 6 006 5 766 5 828 5 796 5 824 5 812 5 835 5 844 7 255 7 377 7 021 6 871 6 443 5 642 5 569 7 169 7 304 6 898 6 642 6 119 5 519 5 548
0,180,180,180,180,180,180,190,230,230,210,200,180,170,170,230,220,210,200,180,170,170,100,100,100,100,100,100,100,130,120,120,110,100,090,090,130,120,120,110,100,090,090,260,260,260,260,260,260,270,320,330,310,310,290,250,250,320,320,310,300,280,250,25
1,401,411,391,401,391,391,531,811,651,431,271,191,251,391,791,601,351,181,181,251,401,421,431,411,411,411,621,801,731,531,341,341,401,421,581,711,511,321,321,391,421,591,351,361,351,361,351,351,371,701,731,571,461,301,171,281,681,711,521,361,181,151,28
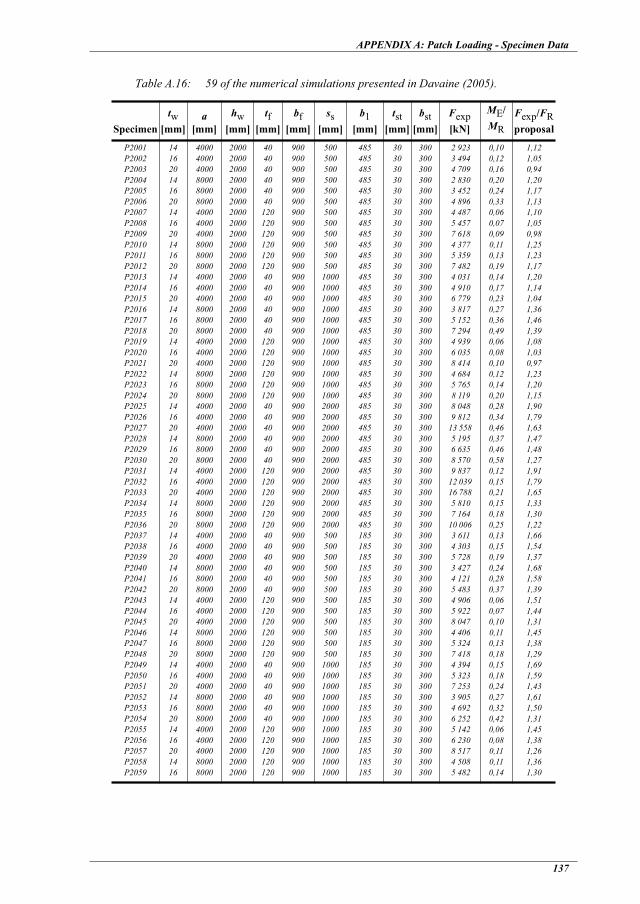
APPENDIX A: Patch Loading - Specimen Data
137
Table A.16: 59 of the numerical simulations presented in Davaine (2005).
Specimentw
[mm]a
[mm]hw
[mm]tf
[mm]bf
[mm]ss
[mm]b1
[mm]tst
[mm]bst
[mm]Fexp[kN]
ME/MR
Fexp/FRproposal
P2001P2002P2003P2004P2005P2006P2007P2008P2009P2010P2011P2012P2013P2014P2015P2016P2017P2018P2019P2020P2021P2022P2023P2024P2025P2026P2027P2028P2029P2030P2031P2032P2033P2034P2035P2036P2037P2038P2039P2040P2041P2042P2043P2044P2045P2046P2047P2048P2049P2050P2051P2052P2053P2054P2055P2056P2057P2058P2059
1416201416201416201416201416201416201416201416201416201416201416201416201416201416201416201416201416201416201416201416
40004000400080008000800040004000400080008000800040004000400080008000800040004000400080008000800040004000400080008000800040004000400080008000800040004000400080008000800040004000400080008000800040004000400080008000800040004000400080008000
20002000200020002000200020002000200020002000200020002000200020002000200020002000200020002000200020002000200020002000200020002000200020002000200020002000200020002000200020002000200020002000200020002000200020002000200020002000200020002000
404040404040
120120120120120120404040404040
120120120120120120404040404040
120120120120120120404040404040
120120120120120120404040404040
120120120120120
900900900900900900900900900900900900900900900900900900900900900900900900900900900900900900900900900900900900900900900900900900900900900900900900900900900900900900900900900900900
500500500500500500500500500500500500
100010001000100010001000100010001000100010001000200020002000200020002000200020002000200020002000500500500500500500500500500500500500
10001000100010001000100010001000100010001000
485485485485485485485485485485485485485485485485485485485485485485485485485485485485485485485485485485485485185185185185185185185185185185185185185185185185185185185185185185185
3030303030303030303030303030303030303030303030303030303030303030303030303030303030303030303030303030303030303030303030
300300300300300300300300300300300300300300300300300300300300300300300300300300300300300300300300300300300300300300300300300300300300300300300300300300300300300300300300300300300
2 923 3 494 4 709 2 830 3 452 4 896 4 487 5 457 7 618 4 377 5 359 7 482 4 031 4 910 6 779 3 817 5 152 7 294 4 939 6 035 8 414 4 684 5 765 8 119 8 048 9 812
13 558 5 195 6 635 8 570 9 837
12 039 16 788 5 810 7 164
10 006 3 611 4 303 5 728 3 427 4 121 5 483 4 906 5 922 8 047 4 406 5 324 7 418 4 394 5 323 7 253 3 905 4 692 6 252 5 142 6 230 8 517 4 508 5 482
0,100,120,160,200,240,330,060,070,090,110,130,190,140,170,230,270,360,490,060,080,100,120,140,200,280,340,460,370,460,580,120,150,210,150,180,250,130,150,190,240,280,370,060,070,100,110,130,180,150,180,240,270,320,420,060,080,110,110,14
1,121,050,941,201,171,131,101,050,981,251,231,171,201,141,041,361,461,391,081,030,971,231,201,151,901,791,631,471,481,271,911,791,651,331,301,221,661,541,371,681,581,391,511,441,311,451,381,291,691,591,431,611,501,311,451,381,261,361,30
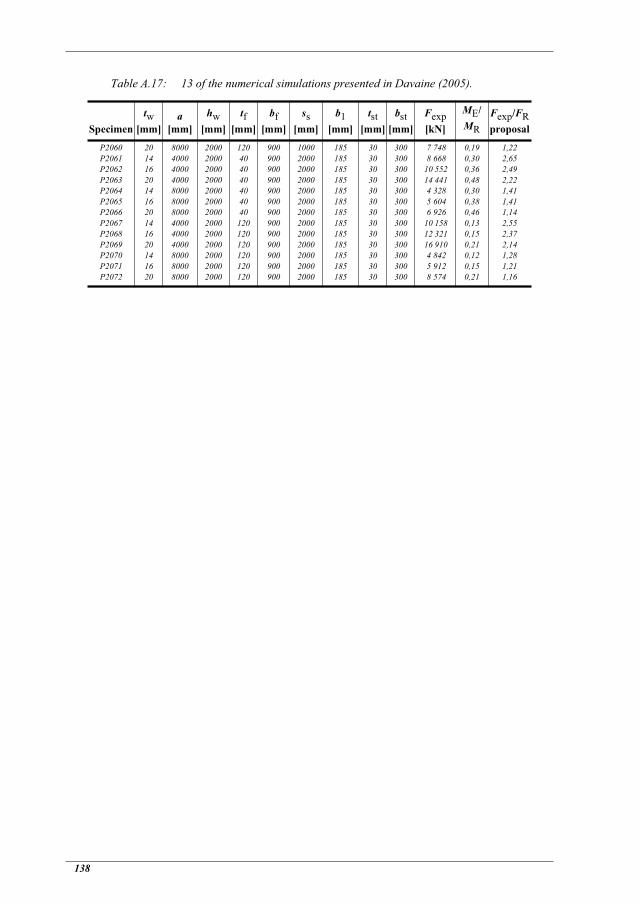
138
Table A.17: 13 of the numerical simulations presented in Davaine (2005).
Specimentw
[mm]a
[mm]hw
[mm]tf
[mm]bf
[mm]ss
[mm]b1
[mm]tst
[mm]bst
[mm]Fexp[kN]
ME/MR
Fexp/FRproposal
P2060P2061P2062P2063P2064P2065P2066P2067P2068P2069P2070P2071P2072
20141620141620141620141620
8000400040004000800080008000400040004000800080008000
2000200020002000200020002000200020002000200020002000
120404040404040
120120120120120120
900900900900900900900900900900900900900
1000200020002000200020002000200020002000200020002000
185185185185185185185185185185185185185
30303030303030303030303030
300300300300300300300300300300300300300
7 748 8 668
10 552 14 441 4 328 5 604 6 926
10 158 12 321 16 910 4 842 5 912 8 574
0,190,300,360,480,300,380,460,130,150,210,120,150,21
1,222,652,492,221,411,411,142,552,372,141,281,211,16

APPENDIX A: Patch Loading - Specimen Data
139
Table A.18: 59 of the numerical simulations presented in Davaine (2005)
Specimentw
[mm]a
[mm]hw
[mm]tf
[mm]bf
[mm]ss
[mm]b1
[mm]tst
[mm]bst
[mm]Fexp[kN]
ME/MR
Fexp/FRproposal
P3001P3002P3003P3004P3005P3006P3007P3008P3009P3010P3011P3012P3013P3014P3015P3016P3017P3018P3019P3020P3021P3022P3023P3024P3025P3026P3027P3028P3029P3030P3031P3032P3033P3034P3035P3036P3037P3038P3039P3040P3041P3042P3043P3044P3045P3046P3047P3048P3049P3050P3051P3052P3053P3054P3055P3056P3057P3058P3059
1620251620251620251620251620251620251620251620251620251620251620251620251620251620251620251620251620251620251620251620
60006000600060006000600080008000800080008000800060006000600060006000600080008000800080008000800060006000600060006000600080008000800080008000800060006000600060006000600080008000800080008000800060006000600060006000600080008000800080008000
30003000300030003000300030003000300030003000300030003000300030003000300030003000300030003000300030003000300030003000300030003000300030003000300030003000300030003000300030003000300030003000300030003000300030003000300030003000300030003000
404040
120120120404040
120120120404040
120120120404040
120120120404040
120120120404040
120120120404040
120120120404040
120120120404040
120120120404040
120120
10001000100010001000100010001000100010001000100010001000100010001000100010001000100010001000100010001000100010001000100010001000100010001000100010001000100010001000100010001000100010001000100010001000100010001000100010001000100010001000
10001000100010001000100010001000100010001000100020002000200020002000200020002000200020002000200030003000300030003000300030003000300030003000300010001000100010001000100010001000100010001000100020002000200020002000200020002000200020002000
735735735735735735735735735735735735735735735735735735735735735735735735735735735735735735735735735735735735285285285285285285285285285285285285285285285285285285285285285285285
3030303030303030303030303030303030303030303030303030303030303030303030303030303030303030303030303030303030303030303030
300300300300300300300300300300300300300300300300300300300300300300300300300300300300300300300300300300300300300300300300300300300300300300300300300300300300300300300300300300300
4 167 5 888 8 455 5 311 7 598
10 733 4 075 6 027
10 295 5 287 7 532
10 595 5 433 7 835 11 791 6 384 9 524
14 188 5 211 8 474 11 398 6 415 9 595
13 787 6 635 9 528
14 774 7 650 11 555 17 734 6 060
10 666 12 424 7 473 11 606 15 939 5 389 7 319 9 832 6 503 8 708 11 609 5 093 6 833 8 927 5 991 7 998
10 922 6 443 8 840 11 738 7 093 9 770
13 203 5 801 7 692 9 813 6 514 8 742
0,120,170,230,060,080,120,160,230,370,080,110,150,160,220,320,070,100,150,200,320,410,090,140,200,200,270,400,080,130,190,240,400,450,110,170,230,160,200,260,070,090,120,200,250,320,090,120,160,190,250,310,080,110,140,220,290,350,100,13
1,211,131,121,101,091,071,251,271,471,191,181,141,201,181,211,141,171,211,271,401,271,261,291,271,251,221,291,221,271,341,261,491,171,321,401,301,941,741,551,721,551,381,951,711,471,691,491,351,841,651,441,631,491,341,761,511,251,591,41

140
Table A.19: 62 of the numerical simulations presented in Davaine (2005).
Specimentw
[mm]a
[mm]hw
[mm]tf
[mm]bf
[mm]ss
[mm]b1
[mm]tst
[mm]bst
[mm]Fexp[kN]
ME/MR
Fexp/FRproposal
P3060P3061P3062P3063P3064P3065P3066P3067P3068P3069P3070P3071P3072P4001P4002P4003P4004P4005P4006P4007P4008P4009P4010P4011P4012P4013P4014P4015P4016P4017P4018P4019P4020P4021P4022P4023P4024P4025P4026P4027P4028P4029P4030P4031P4032P4033P4034P4035P4036P4037P4038P4039P4040P4041P4042P4043P4044P4045P4046P4047P4048P4049
2516202516202516202516202520253020253020253020253020253020253020253020253020253020253020253020253020253020253020253020253020
80006000600060006000600060008000800080008000800080006000600060006000600060008000800080008000800080006000600060006000600060008000800080008000800080006000600060006000600060008000800080008000800080006000600060006000600060008000800080008000800080006000
30003000300030003000300030003000300030003000300030004000400040004000400040004000400040004000400040004000400040004000400040004000400040004000400040004000400040004000400040004000400040004000400040004000400040004000400040004000400040004000400040004000
120404040
120120120404040
120120120606060
150150150606060
150150150606060
150150150606060
150150150606060
150150150606060
150150150606060
150150150606060
15015015060
10001000100010001000100010001000100010001000100010001200120012001200120012001200120012001200120012001200120012001200120012001200120012001200120012001200120012001200120012001200120012001200120012001200120012001200120012001200120012001200120012001200
20003000300030003000300030003000300030003000300030001000100010001000100010001000100010001000100010002000200020002000200020002000200020002000200020003000300030003000300030003000300030003000300030001000100010001000100010001000100010001000100010002000
285285285285285285285285285285285285285985985985985985985985985985985985985985985985985985985985985985985985985985985985985985985985985985985985985385385385385385385385385385385385385385
3030303030303030303030303030303030303030303030303030303030303030303030303030303030303030303030303030303030303030303030303030
300300300300300300300300300300300300300300300300300300300300300300300300300300300300300300300300300300300300300300300300300300300300300300300300300300300300300300300300300300300300300300
12 071 7 129 9 860
13 124 7 822
10 821 14 761 6 290 8 272
10 531 7 027 9 536
13 149 6 161 8 607 11 236 7 731
10 952 14 490 5 970 8 465 11 366 7 594
10 874 14 393 7 911
11 469 15 487 8 890
13 009 17 766 7 546 11 194 16 122 8 693
13 046 17 868 9 630 14 119 19 244 10 439 15 528 21 678 8 851
13 409 20 504 9 887
15 514 21 913 7 481
10 028 12 884 9 676
13 278 17 009 7 119 9 826
12 777 9 252
12 528 15 973 10 017
0,170,210,270,350,090,120,160,240,310,380,100,140,190,080,100,130,040,060,080,100,140,180,060,080,100,100,140,180,050,070,090,130,180,250,060,090,130,120,170,220,060,080,120,150,220,320,070,110,160,090,120,150,050,070,090,120,160,200,070,090,110,12
1,281,741,571,361,621,481,331,631,381,141,541,371,231,321,211,131,201,131,071,241,181,171,151,151,121,191,191,181,091,111,121,251,271,331,171,211,211,261,261,261,151,191,221,271,311,451,201,291,341,711,541,421,661,541,431,751,601,491,711,551,421,87

APPENDIX A: Patch Loading - Specimen Data
141
Table A.20: 47 of the numerical simulations presented in Davaine (2005).
Specimentw
[mm]a
[mm]hw
[mm]tf
[mm]bf
[mm]ss
[mm]b1
[mm]tst
[mm]bst
[mm]Fexp[kN]
ME/MR
Fexp/FRproposal
P4050P4051P4052P4053P4054P4055P4056P4057P4058P4059P4060P4061P4062P4063P4064P4065P4066P4067P4068P4069P4070P4071P4072P5001P5002P5003P5004P5005P5006P5007P5008P5009P5010P5011P5012P5013P5014P5015P5016P5017P5018P5019P5020P5021P5022P5023P5024
2530202530202530202530202530202530202530202530253025302530253025302530253025302530253025302530
60006000600060006000800080008000800080008000600060006000600060006000800080008000800080008000800080008000800080008000800080008000800080008000800080008000800080008000800080008000800080008000
40004000400040004000400040004000400040004000400040004000400040004000400040004000400040004000500050005000500050005000500050005000500050005000500050005000500050005000500050005000500050005000
6060
150150150606060
150150150606060
150150150606060
1501501506060
1501506060
1501506060
1501506060
1501506060
1501506060
150150
12001200120012001200120012001200120012001200120012001200120012001200120012001200120012001200120012001200120012001200120012001200120012001200120012001200120012001200120012001200120012001200
20002000200020002000200020002000200020002000300030003000300030003000300030003000300030003000100010001000100020002000200020003000300030003000100010001000100020002000200020003000300030003000
385385385385385385385385385385385385385385385385385385385385385385385
123512351235123512351235123512351235123512351235485485485485485485485485485485485485
3030303030303030303030303030303030303030303030303030303030303030303030303030303030303030303030
300300300300300300300300300300300300300300300300300300300300300300300300300300300300300300300300300300300300300300300300300300300300300300300
13 626 17 522 11 017 15 204 19 421 9 085
12 415 15 914 10 239 13 844 17 690 11 175 15 478 20 088 12 079 16 882 21 818 10 119 13 831 17 578 11 156 15 202 19 480 8 283
10 860 10 551 13 976 10 304 13 924 12 135 16 767 11 851 16 158 13 784 19 750 9 643
12 528 12 698 16 353 12 946 16 808 14 560 18 644 14 710 18 751 16 171 20 684
0,160,200,060,080,100,150,200,240,070,100,130,140,180,230,070,090,120,170,220,270,080,110,140,100,130,060,080,130,160,070,090,150,190,080,110,120,150,070,090,160,190,080,100,180,220,090,11
1,691,551,671,551,421,831,641,491,671,501,371,811,661,531,661,551,431,761,581,411,651,481,351,351,261,271,201,241,231,201,221,231,221,231,291,681,571,681,561,831,691,691,551,791,621,691,54

142

APPENDIX B: Patch Loading - Further Evaluation
143
APPENDIX B:
Patch Loading - Further Evaluation
In Appendix B.1 additional statistical information and supplementary graphs is provided. Three sections focused on the herein proposed design model, the design model by Graciano and the design model by Davaine are enclosed in this appendix. This additional material is presented as complement to the presented tables and graphs in chapter 4.
Appendix B.2 contains a statistical evaluation of the herein proposed design model. The method for calculating the partial safety factor M1 by the recommendations of EN 1990 (2002) is presented along with the results of the corresponding evaluation with respect to the experimental data base of 160 tests (136 + 24) and the 366 numerical simulations.
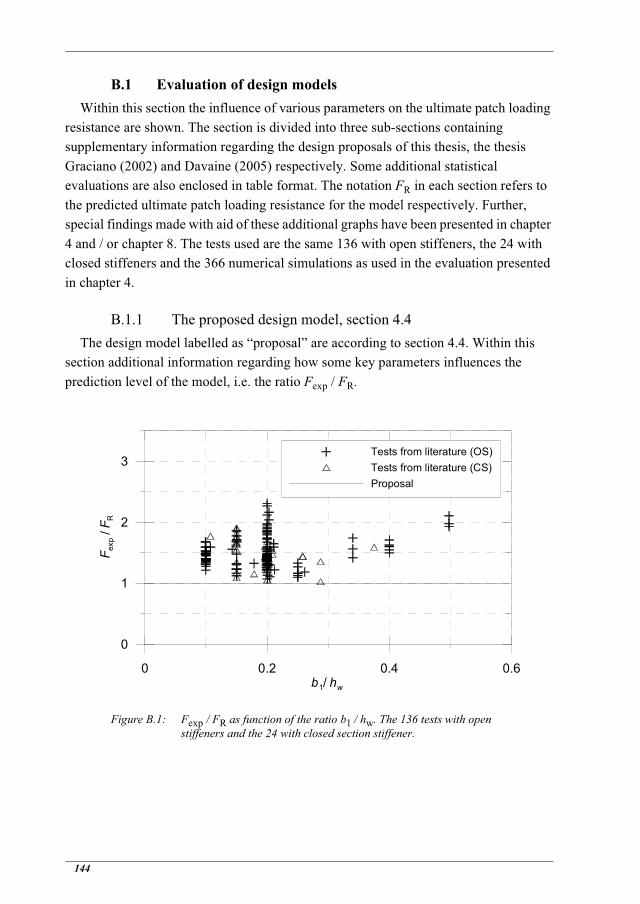
144
B.1 Evaluation of design modelsWithin this section the influence of various parameters on the ultimate patch loading
resistance are shown. The section is divided into three sub-sections containing supplementary information regarding the design proposals of this thesis, the thesis Graciano (2002) and Davaine (2005) respectively. Some additional statistical evaluations are also enclosed in table format. The notation FR in each section refers to the predicted ultimate patch loading resistance for the model respectively. Further, special findings made with aid of these additional graphs have been presented in chapter 4 and / or chapter 8. The tests used are the same 136 with open stiffeners, the 24 with closed stiffeners and the 366 numerical simulations as used in the evaluation presented in chapter 4.
B.1.1 The proposed design model, section 4.4The design model labelled as “proposal” are according to section 4.4. Within this
section additional information regarding how some key parameters influences the prediction level of the model, i.e. the ratio Fexp / FR.
Figure B.1: Fexp / FR as function of the ratio b1 / hw. The 136 tests with open stiffeners and the 24 with closed section stiffener.
0 0.2 0.4 0.6b1/ hw
0
1
2
3
F exp
/FR
Tests from literature (OS)Tests from literature (CS)Proposal

APPENDIX B: Patch Loading - Further Evaluation
145
Figure B.2: Fexp / FR as function of the web thickness, tw. The 136 tests with open stiffeners and the 24 with closed section stiffener.
Figure B.3: Fexp / FR as function of the yield stress ratio fyf / fyw. The 136 tests with open stiffeners and the 24 with closed section stiffener.
0 2 4 6 8tw [mm]
0
1
2
3F e
xp/F
R
Tests from literature (OS)Tests from literature (CS)Proposal
0 0.5 1 1.5 2 2.5fyf / fyw
0
1
2
3
F exp
/FR
Tests from literature (OS)Tests from literature (CS)Proposal

146
Figure B.4: Fexp / FR as function of the ratio ss / b1. The 136 tests with open stiffeners and the 24 with closed section stiffener.
Figure B.5: Fexp / FR as function of the ratio ss / a. The 136 tests with open stiffeners and the 24 with closed section stiffener.
0 1 2 3ss / b1
0
1
2
3F e
xp/F
RTests from literature (OS)Tests from literature (CS)Proposal
0 0.1 0.2 0.3 0.4ss / a
0
1
2
3
F exp
/FR
Tests from literature (OS)Tests from literature (CS)Proposal

APPENDIX B: Patch Loading - Further Evaluation
147
Figure B.6: Fexp / FR as function of the ratio ss / hw. The 136 tests with open stiffeners and the 24 with closed section stiffener.
Figure B.7: Fexp / FR as function of the ratio ss / a. The 136 tests with open stiffeners and the 24 with closed section stiffener.
0 0.2 0.4 0.6ss / hw
0
1
2
3F e
xp/F
R
Tests from literature (OS)Tests from literature (CS)Proposal
0 0.4 0.8 1.2 1.6hw / a
0
1
2
3
F exp
/FR
Tests from literature (OS)Tests from literature (CS)Proposal

148
Figure B.8: Fexp / FR as function of the ratio bf / tf. The 136 tests with open stiffeners and the 24 with closed section stiffener.
Figure B.9: Fexp / FR as function of the ratio tf / tw. The 136 tests with open stiffeners and the 24 with closed section stiffener.
0 5 10 15 20 25bf / tf
0
1
2
3
F exp
/FR
Tests from literature (OS)Tests from literature (CS)Proposal
0 2 4 6 8 10tf / tw
0
1
2
3
F exp
/FR
Tests from literature (OS)Tests from literature (CS)Proposal

APPENDIX B: Patch Loading - Further Evaluation
149
Figure B.10: Fexp / FR as function of the ratio hw / tw. The 136 tests with open stiffeners and the 24 with closed section stiffener.
Figure B.11: Fexp / FR as function of the ratio b1 / tw. The 136 tests with open stiffeners and the 24 with closed section stiffener.
0 100 200 300 400 500hw / tw
0
1
2
3F e
xp/F
R
Tests from literature (OS)Tests from literature (CS)Proposal
0 40 80 120 160b1 / tw
0
1
2
3
F exp
/FR
Tests from literature (OS)Tests from literature (CS)Proposal

150
Figure B.12: Fexp / FR as function of the ratio b1 / hw. The 366 numerical simulations with open stiffeners.
Figure B.13: Fexp / FR as function of the ratio b1 / a. The 366 numerical simulations with open stiffeners.
0 0.2 0.4 0.6b1/ hw
0
1
2
3F e
xp/F
RNumerical simulationsProposal
0 0.1 0.2 0.3 0.4b1/ a
0
1
2
3
F exp
/FR
Numerical simulationsProposal

APPENDIX B: Patch Loading - Further Evaluation
151
B.1.2 The proposed design model of Graciano (2002)In this section some additional information regarding the performance of the model
presented in Graciano (2002) is provided. In section 4.6 a statistical comparison regarding the 136 tests with open stiffeners was presented. In this section the same comparative study is presented with respect to the 24 tests on panels with closed section stiffeners and the 366 numerical simulations. The proposed approach of Graciano (2002) is compared to the approach presented in section 4.4. Further some additional graphs presenting the experimental results in relation to the prediction of the model by Graciano is provided within this section.
Table B.1: Statistical comparison between the proposal of Graciano (2002) and the herein proposed design approach with respect to the ratio Fexp / FR. Tests with closed section stiffeners (CS) and the numerical simulations (FEA).
CS with respect to proposal
CS with respect to Graciano
FEA with respect to proposal
FEA with respect to Graciano
Number of tests 24 24 366 366
Mean 1,499 1,265 1,410 1,344
Standard deviation 0,271 0,286 0,235 0,234
Coefficient of variation 0,180 0,226 0,167 0,174
Lower 5-percent fractile 1,060 0,874 1,125 1,029
Upper 5-percent fractile 1,879 1,623 1,793 1,701

152
Figure B.14: Fexp / FR as function of the ratio b1 / hw. The 136 tests with open stiffeners and the 24 with closed section stiffener.
Figure B.15: Fexp / FR as function of the ratio b1 / a. The 136 tests with open stiffeners and the 24 with closed section stiffener.
0 0.2 0.4 0.6b1/ hw
0
1
2
3
F exp
/FR
Tests from literature (OS)Tests from literature (CS)Graciano (2002)
0 0.1 0.2 0.3 0.4b1/ a
0
1
2
3
F exp
/FR
Tests from literature (OS)Tests from literature (CS)Graciano (2002)

APPENDIX B: Patch Loading - Further Evaluation
153
Figure B.16: Fexp / FR as function of the ratio b1 / hw. The 366 numerical simulations with open stiffeners.
Figure B.17: Fexp / FR as function of the ratio b1 / a. The 366 numerical simulations with open stiffeners.
B.1.3 The proposed design model of Davaine (2005)The corresponding additional information presented in the previous section is in this
section presented with the focus on the model of Davaine (2005). In this section the same comparative study is presented with respect to the 24 tests on panels with closed section
0 0.2 0.4 0.6b1/ hw
0
1
2
3F e
xp/F
R
Numerical simulationsGraciano (2002)
0 0.1 0.2 0.3 0.4b1/ a
0
1
2
3
F exp
/FR
Numerical simulationsGraciano (2002)

154
stiffeners and the 366 numerical simulations. The proposed approach of Davaine (2005) is compared to the approach presented in section 4.4.
Table B.2: Statistical comparison between the proposal of Davaine (2005) and the herein proposed design approach with respect to the ratio Fexp / FR. Tests with closed section stiffeners (CS) and the numerical simulations (FEA).
Figure B.18: Fexp / FR as function of the ratio b1 / hw. The 136 tests with open stiffeners and the 24 with closed section stiffener
CS with respect to proposal
CS with respect to Davaine
FEA with respect to proposal
FEA with respect to Davaine
Number of tests 24 24 366 366
Mean 1,499 1,525 1,410 1,330
Standard deviation 0,271 0,285 0,235 0,162
Coefficient of variation 0,180 0,187 0,167 0,122
Lower 5-percent fractile 1,060 1,059 1,125 1,113
Upper 5-percent fractile 1,879 1,890 1,793 1,576
0 0.2 0.4 0.6b1/ hw
0
1
2
3
F exp
/FR
Tests from literature (OS)Tests from literature (CS)Davaine (2005)

APPENDIX B: Patch Loading - Further Evaluation
155
Figure B.19: Fexp / FR as function of the ratio b1 / a. The 136 tests with open stiffeners and the 24 with closed section stiffener.
Figure B.20: Fexp / FR as function of the ratio b1 / hw. The 366 numerical simulations with open stiffeners.
0 0.1 0.2 0.3 0.4b1/ a
0
1
2
3F e
xp/F
R
Tests from literature (OS)Tests from literature (CS)Davaine (2005)
0 0.2 0.4 0.6b1/ hw
0
1
2
3
F exp
/FR
Numerical simulationsDavaine (2005)

156
Figure B.21: Fexp / FR as function of the ratio b1 / a. The 366 numerical simulations with open stiffeners.
0 0.1 0.2 0.3 0.4b1/ a
0
1
2
3
F exp
/FR
Numerical simulationsDavaine (2005)

APPENDIX B: Patch Loading - Further Evaluation
157
B.2 Statistical evaluation of the proposed design modelTo ensure that the proposed patch loading resistance model for longitudinally
stiffened webs (according to section 4.8) is safe to use in design, an evaluation according to the recommendations in EN 1990 (2002), Annex D was carried out. The target of this evaluation is to establish the partial safety factor M1 to be used with eq. (4.30) to determine the design resistance according to the proposed approach. Variations in the geometry and the yield resistance, fy, were assumed to be the parameters influencing the ultimate resistance the most, hence treated as stochastic variables in this evaluation.
B.2.1 Evaluation procedure according to EN 1990 (2002)The evaluation procedure used herein is the standard procedure for statistical
determination of resistance models according to Annex D in EN 1990 (2002). The evaluation is initiated putting the established resistance function, i.e. according to section 4.8, on the form
(B.1)
in which grt symbolizes the equations in the proposed approach for predicting the ultimate patch loading resistance and the stochastic variables are denoted with X.Further, the probabilistic model of the resistance is put according to
(B.2)
in which is an error term for each individual experimental value (divergence between the experimental and predicted values), and b is a correction factor estimated by the “Least Square”-best fit to the experimental values, i.e.
(B.3)
A mean value of the proposed resistance function is calculated using the mean values of the basic variables, Xm, according to
(B.4)
Determine the coefficient of variation of the error term is the following step to take. This is done using the error term for each individual experimental value, i, calculated according to
rt grt X=
r b rt=
bre rt
rt2
----------------------=
rm b rt Xm b grt Xm= =

158
(B.5)
An estimated value for the coefficient of variation of the error should then be determined according to the following four equations, eq. (B.6) - eq. (B.9).
(B.6)
(B.7)
(B.8)
and finally the coefficient of the variation of the error terms according to
(B.9)
The herein proposed resistance function is on the form, by EN 1990 (2002) called, “more complex” according to
(B.10)
and the coefficient of variation for the resistance function is obtained by
(B.11)
The attentive reader here grasps the complexity of the partial derivative according to eq. (B.11) and the resistance model. However, in Müller (2003) a conservative value of Vrt = 0,08 has been used concerning similar issues. The coefficient of variation denoted Vrtregards the variations in the geometry and the yield resistance. By using this the coefficient of variation for the probabilistic model may be calculated according to
(B.12)
irei
b rti------------=
i iln=
1n--- i
i 1=
n
=
s2 1n 1–------------ i –
2
i 1=
n
=
V es2
1–=
r b rt b grt X1 Xj= =
Vrt2 VAR grt Xm
grt2 Xm
----------------------------------- 1grt
2 Xm
------------------grtXi
--------- i
2
i 1=
j
=
Vr V2 Vrt2+=

APPENDIX B: Patch Loading - Further Evaluation
159
Furthermore, since the population of tests comprises more than 100 individual experiments the characteristic resistance is calculated according to
(B.13)
in which
(B.14)
The characteristic fractile factor, kn, for a population comprising a large number of experimental values, i.e. , the fractile factor in eq. (B.13) is set to 1,64. To acquire the design resistance basically the same equation as eq. (B.13) is used, however with a different fractile factor.
(B.15)
The design fractile factor, , for a population comprising a large number of tests, is denoted and set to 3,04. Then the partial factor for the resistance, M, may
be determined according to
(B.16)
and further, the corrected partial factor, , is calculated after
(B.17)
in where the resistance using the nominal values of the basic variables is denoted rn and the error term for this case, kc, taking into account that fy is a minimum value and not an average, is determined as
(B.18)
B.2.2 Calculation of the partial safety factor - ExperimentsThe herein enclosed statistical evaluation focused on the experimental values only.
The tests on the welded girders wit both open and closed section stiffeners have been
rk b grt Xm ek Q 0 5 Q2,––
=
Q rln Vr2 1+ln= =
n k
rd b grt Xm ekd Q 0 5 Q2,––
=
kd nn kd
Mrkrd---- e
k Q 0 5 Q2,––
ekd Q 0 5 Q2,––
-----------------------------------------= =
M
M
rnrd---- kc M= =
kc1b--- e
2 Vfy0 5 Vfy
2,––
ek Q 0 5 Q2,––
---------------------------------------=

160
chosen to be evaluated as one population tests. Hence the whole population evaluated comprises a total of 160 individual tests, i.e. all of the tests evaluated in section 4.5. The coefficient of variation regarding the yield resistance Vfy was set to 0,07 and the lumped coefficient of variation of the geometry and the yield resistance, Vrt was as previously mentioned set to 0,08. Furthermore the variables was assumed to be log-normal distributed. The 160 test results as a function of the proposed prediction model is showed in Figure B.22.
According to eq. (B.3) the mean value of the correction factor, b, was determined and the coefficient of variation regarding the error term, V , was determined using eq. (B.5) - eq. (B.9).
b = 1,498V = 0,171
With use of the in section B.2.1 discussed coefficient of variation considering the resistance function, Vrt, the coefficient of variation of the probabilistic model is calculated according to eq. (B.12), i.e.
Figure B.22: The 160 tests results denoted re as a function of the predicted resistance, rt, according to the proposed design model.
Vr V2 Vrt2+ 0 1712 0 082,+, 0 189,= = =
0
400
800
1200
r e [k
N]
0 400 800 1200rt [kN]
Tests from literature (OS)Tests from literature (CS)

APPENDIX B: Patch Loading - Further Evaluation
161
The parameter Q is the calculated according to eq. (B.14)
which is used for the next step, calculating the partial factor for the resistance according to eq. (B.16) with the values of and used.
In order to calculate the corrected partial factor, kc needs to be determined using eq. (B.18) according to
When this is determined the corrected partial factor of the resistance may be determined according to eq. (B.17)
Hence, based on the evaluated tests, comprising 160 specimens with open and closed longitudinal stiffeners, the partial safety factor to be used for determining the design resistance according to the resistance model presented in section 4.4 is proposed to be approximated to 1,0.
B.2.3 Calculation of the partial safety factor - Numerical simulationsThe same procedure of evaluation as for the experiments presented in the previous
section was performed concerning the 366 simulations of Davaine (2005) used herein. Since the procedure of evaluation should be know to the reader at this point, only the calculated key values and the graph showing the simulated loads versus the predicted (see Figure B.23) are presented within this section.
b = 1,395V = 0,142Vr = 0,163
Q rln Vr2 1+ln 0 189, 2 1+ln 0 187,= = = =
k kd
Mrkrd---- e
k Q 0 5 Q2,––
ekd Q 0 5 Q2,––
----------------------------------------- e 1 64, 0 187, 0 5 0 187, 2,––
e 3 04, 0 187, 0 5 0 187, 2,––-------------------------------------------------------- 1 299,= = = =
kc1b--- e
2 Vfy0 5 Vfy
2,––
ek Q 0 5 Q2,––
--------------------------------------- 11 498,------------- e 2 0 07, 0 5 0 07, 2,––
e 1 64, 0 187, 0 5 0 187, 2,––-------------------------------------------------------- 0 801,= = =
M
rnrd---- kc M 1 299 0 801,, 1 040,= = = =
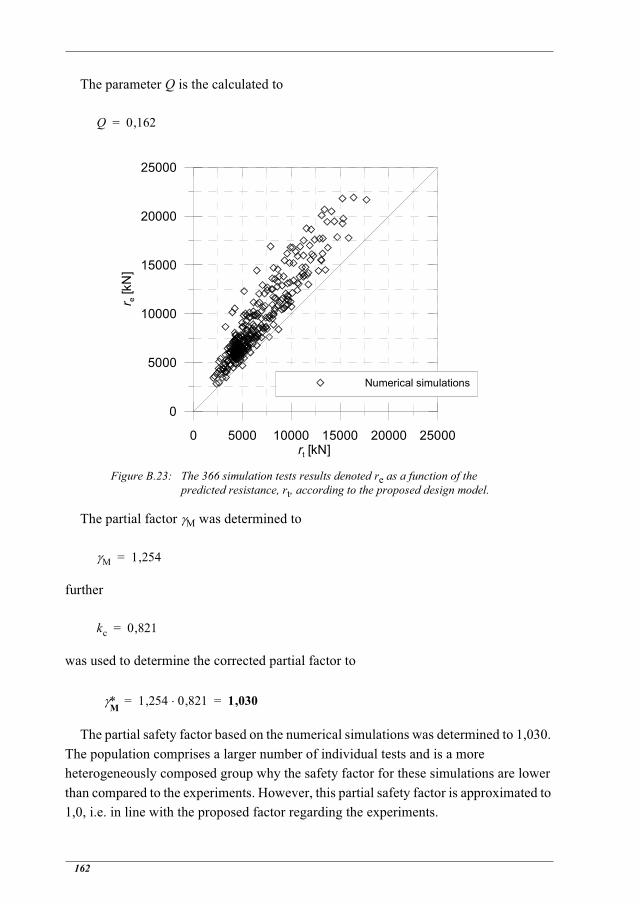
162
The parameter Q is the calculated to
Figure B.23: The 366 simulation tests results denoted re as a function of the predicted resistance, rt, according to the proposed design model.
The partial factor M was determined to
further
was used to determine the corrected partial factor to
The partial safety factor based on the numerical simulations was determined to 1,030. The population comprises a larger number of individual tests and is a more heterogeneously composed group why the safety factor for these simulations are lower than compared to the experiments. However, this partial safety factor is approximated to 1,0, i.e. in line with the proposed factor regarding the experiments.
Q 0 162,=
0
5000
10000
15000
20000
25000
r e [k
N]
0 5000 10000 15000 20000 25000rt [kN]
Numerical simulations
M 1 254,=
kc 0 821,=
M 1 254 0 821,, 1 030,= =

APPENDIX C: Local Buckling - Further Evaluation
163
APPENDIX C:
Local Buckling - Further Evaluation
In Appendix C.1 the stress - strain curves from the tensile coupon tests described in chapter 6 are enclosed. This in the form of 6 figures containing the results from three coupon tests each.
Appendix C.2 contains the measured dimensions of the 48 box specimens used for the local buckling tests. Furthermore, for each specimen, the calculated plate slenderness according to EN 1993-1-5 is provided.
All of the load - mean axial deformation graphs are enclosed in Appendix C.3. This in the form of 14 figures describing the behaviour of all the 48 specimens tested.
In Appendix C.4 the evaluated test results from the local buckling tests are enclosed. Furthermore, the cross section areas with included weld areas are shown along with measured ultimate loads and evaluated ultimate stress levels.
The Appendix C.5 displays the measurement equipment used in the experimental work. All of the gauges and other equipment are described individually.
The statistical evaluation of the partial safety factor for the proposed reduction function with respect to local buckling is presented in Appendix C.6.

164

APPENDIX C: Local Buckling - Further Evaluation
165
C.1 Stress - strain curves from uniaxial tests
Figure C.1: Stress - strain curves from tension tests along the rolling direction on Domex 420.
Figure C.2: Stress - strain curves from tension tests transverse the rolling direction on Domex 420.
0 10 20 30 40
, Strain [%]
0
200
400
600
, Ten
sile
str
ess
[MPa
]
D1D2D3
0 10 20 30 40
, Strain [%]
0
200
400
600
, Ten
sile
str
ess
[MPa
]
D4D5D6

166
Figure C.3: Stress - strain curves from tension tests along the rolling direction on Weldox 700.
Figure C.4: Stress - strain curves from tension tests transverse the rolling direction on Weldox 700.
0 4 8 12 16
, Strain [%]
0
200
400
600
800
1000
, Ten
sile
str
ess
[MPa
]
W1W2W3
0 4 8 12 16
, Strain [%]
0
200
400
600
800
1000
, Ten
sile
str
ess
[MPa
]
W4W5W6
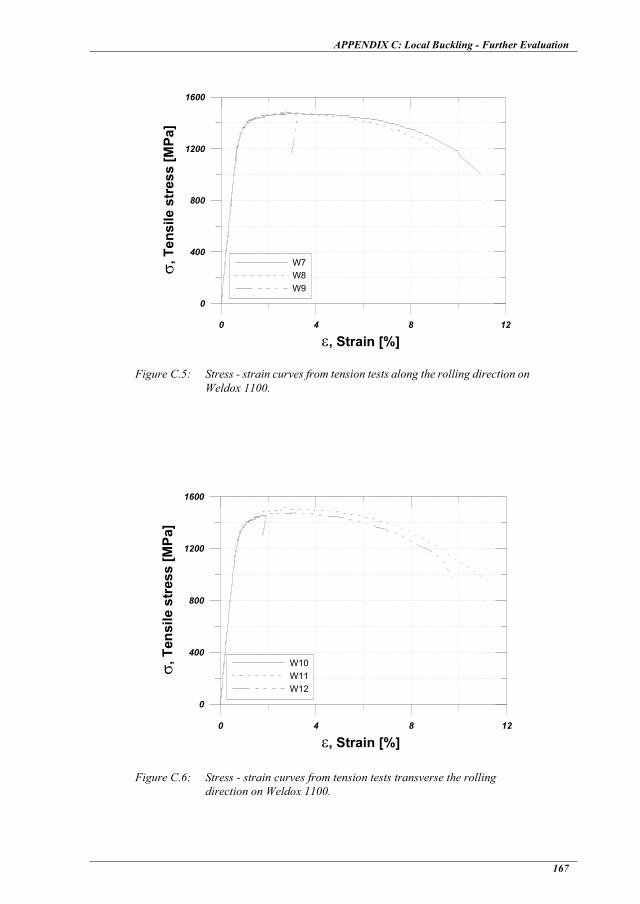
APPENDIX C: Local Buckling - Further Evaluation
167
Figure C.5: Stress - strain curves from tension tests along the rolling direction on Weldox 1100.
Figure C.6: Stress - strain curves from tension tests transverse the rolling direction on Weldox 1100.
0 4 8 12
, Strain [%]
0
400
800
1200
1600
, Ten
sile
str
ess
[MPa
]
W7W8W9
0 4 8 12
, Strain [%]
0
400
800
1200
1600
, Ten
sile
str
ess
[MPa
]
W10W11W12

168
C.2 Measured dimensions - Box specimensTable C.1: Specimen dimensions, measured mechanical properties and
according to EN 1993-1-5, the calculated plate slenderness values.
Specimen Mean Width,
bw [mm]
MeanHeight,h [mm]
Mean Plate Thickness,
t [mm]
Yield Strength, fy [MPa]
Proof Stress,Rp0.2 [MPa]
Plate Slenderness,
p
Dom
ex 4
20
S10-0aS10-0b
S10-90aS10-90bS20-0a
S20-90aS20-90bS30-0aS30-0b
S30-90aS30-90bS40-0aS40-0b
S40-90aS40-90b
82,482,582,582,1
101,3101,3101,2119,4119,5119,5119,4181,3180,8181,5181,1
268,1268,0268,1268,3325,5327,6323,5379,7380,8379,8380,7571,1571,1570,1571,2
3,05
441,3441,3471,0471,0441,3471,0471,0441,3441,3471,0471,0441,3441,3471,0471,0
-
0,650,650,670,670,800,830,830,940,950,980,981,431,431,481,48
Wel
dox
700
W71-0aW71-0bW71-0c
W71-90aW71-90bW71-90cW72-0aW72-90aW72-90bW73-0aW73-0bW73-90aW73-90bW74-0aW74-0bW74-90aW74-90b
89,490,089,590,089,589,5
109,3109,5109,7129,6129,6129,2129,4196,2196,0195,4195,2
276,7276,1276,6276,7277,3277,1336,6335,9336,7395,8396,8396,0396,6593,8594,8593,0594,0
4.09 -
772,7772,7772,7794,0794,0794,0772,7794,0794,0772,7772,7794,0794,0772,7772,7794,0794,0
0,700,700,700,710,710,710,850,870,871,011,011,021,021,531,531,551,54
Wel
dox
1100
W111-0aW111-0bW111-0c
W111-90aW111-90bW111-90cW112-0a
W112-90aW112-90W113-0aW113-0b
W113-90aW113-90bW114-0aW114-0b
W114-90aW114-90b
70,370,469,870,169,469,585,585,585,3
101,3101,3101,3101,2154,9154,9154,8155,2
220,2221,3220,6218,8220,3220,2266,8265,2267,6312,4312,2312,1312,1471,9469,6472,2472,2
3,98 -
1350,71350,71350,71335,01335,01335,01350,71335,01335,01350,71350,71335,01335,01350,71350,71335,01335,0
0,750,750,740,740,730,730,910,900,901,071,071,071,071,641,641,631,64

APPENDIX C: Local Buckling - Further Evaluation
169
C.3 Load - mean axial deformation curves
Figure C.7: Load - mean deformation curves for Domex 420 specimens with nominal plate slenderness of 0,7.
Figure C.8: Load - mean deformation curves for Domex 420 specimens with nominal plate slenderness of 0,85. S20-0b saved for residual stress measurements.
0 2 4 6
, Mean deformation [mm]
0
200
400
600Lo
ad [k
N]
S10-0aS10-0bS10-90aS10-90b
0 2 4 6
, Mean deformation [mm]
0
200
400
600
Load
[kN
]
S20-0aS20-90aS20-90b

170
Figure C.9: Load - mean deformation curves for Domex 420 specimens with nominal plate slenderness of 1,0.
Figure C.10: Load - mean deformation curves for Domex 420 specimens with nominal plate slenderness of 1,5.
0 2 4 6
, Mean deformation [mm]
0
200
400
600Lo
ad [k
N]
S30-0aS30-0bS30-90aS30-90b
0 2 4 6
, Mean deformation [mm]
0
200
400
600
Load
[kN
]
S40-0aS40-0bS40-90aS40-90b
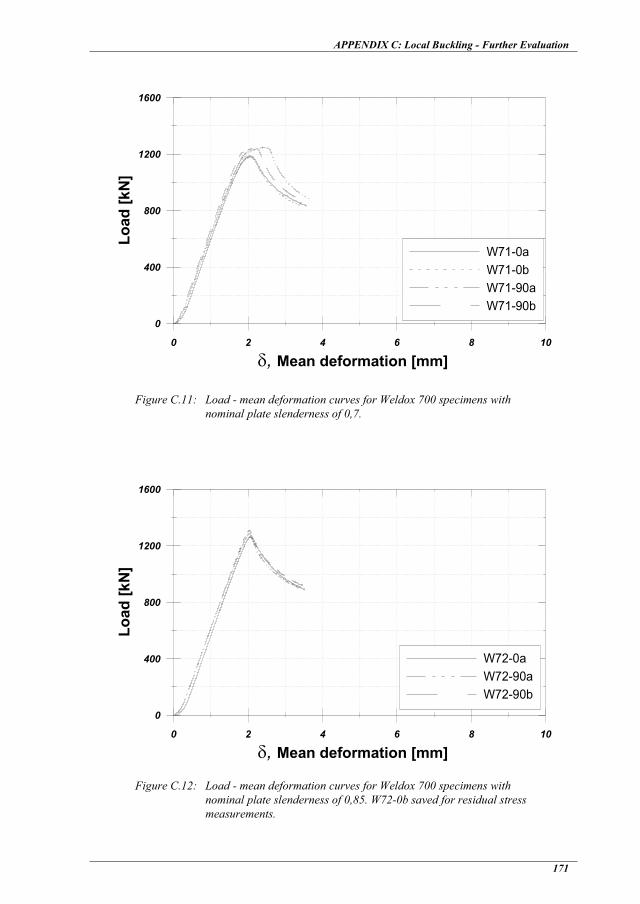
APPENDIX C: Local Buckling - Further Evaluation
171
Figure C.11: Load - mean deformation curves for Weldox 700 specimens with nominal plate slenderness of 0,7.
Figure C.12: Load - mean deformation curves for Weldox 700 specimens with nominal plate slenderness of 0,85. W72-0b saved for residual stress measurements.
0 2 4 6 8 10
, Mean deformation [mm]
0
400
800
1200
1600
Load
[kN
]
W71-0aW71-0bW71-90aW71-90b
0 2 4 6 8 10
, Mean deformation [mm]
0
400
800
1200
1600
Load
[kN
]
W72-0aW72-90aW72-90b

172
Figure C.13: Load - mean deformation curves for Weldox 700 specimens with nominal plate slenderness of 1,0.
Figure C.14: Load - mean deformation curves for Weldox 700 specimens with nominal plate slenderness of 1,5. Specimen W72-0a removed due to testing problems.
0 2 4 6 8 10
, Mean deformation [mm]
0
400
800
1200
1600Lo
ad [k
N]
W73-0aW73-0bW73-90aW73-90b
0 2 4 6 8 10
, Mean deformation [mm]
0
400
800
1200
1600
Load
[kN
]
W74-0bW74-90aW74-90b

APPENDIX C: Local Buckling - Further Evaluation
173
Figure C.15: Load - mean deformation curves for Weldox 700 specimens with nominal plate slenderness of 0,7. Extra tests.
Figure C.16: Load - mean deformation curves for Weldox 1100 specimens with nominal plate slenderness of 0,7. W111-0b failed in weld after ultimate load was reached.
0 2 4 6 8 10
, Mean deformation [mm]
0
400
800
1200
1600
Load
[kN
]
W71-0cW71-90c
0 2 4 6 8 10
, Mean deformation [mm]
0
400
800
1200
1600
2000
Load
[kN
]
W111-0aW111-0bW111-90aW111-90b

174
Figure C.17: Load - mean deformation curves for Weldox 1100 specimens with nominal plate slenderness of 0,85. W112-0b saved for residual stress measurements.
Figure C.18: Load - mean deformation curves for Weldox 1100 specimens with nominal plate slenderness of 1,0.
0 2 4 6 8 10
, Mean deformation [mm]
0
400
800
1200
1600
2000Lo
ad [k
N]
W112-0aW112-90aW112-90b
0 2 4 6 8 10
, Mean deformation [mm]
0
400
800
1200
1600
2000
Load
[kN
]
W113-0aW113-0bW113-90aW113-90b

APPENDIX C: Local Buckling - Further Evaluation
175
Figure C.19: Load - mean deformation curves for Weldox 1100 specimens with nominal plate slenderness of 1,5.
Figure C.20: Load - mean deformation curves for Weldox 1100 specimens with nominal plate slenderness of 0,7. Extra tests.
0 2 4 6 8 10
, Mean deformation [mm]
0
400
800
1200
1600
Load
[kN
]
W114-0aW114-0bW114-90aW114-90b
0 2 4 6 8 10
, Mean deformation [mm]
0
400
800
1200
1600
2000
Load
[kN
]
W111-0cW111-90c

176
C.4 Test Results - Buckling TestsTable C.2: Evaluated test results. Cross section areas with included weld areas.
Yield strength used for Domex 420 and 0,2% proof stress for Weldox specimens.
Specimen Ultimate Load,Fexp [kN]
Area of cross section [mm2]
Ultimate stress,u [MPa]
Ratio u/fy or u/Rp0.2
Dom
ex 4
20
S10-0aS10-0b
S10-90aS10-90bS20-0a
S20-90aS20-90bS30-0aS30-0b
S30-90aS30-90bS40-0aS40-0b
S40-90aS40-90b
502,3502,2514,9530,6505,9517,6492,6468,4484,0496,1487,1502,4484,2492,1493,9
1023,91025,11024,51020,51254,51254,91253,21475,71476,11476,61474,92230,12224,52232,92228,6
490,5489,9502,6520,0403,3412,4393,1317,4327,9336,0330,3225,3217,7220,4221,6
1,111,111,071,100,910,880,830,720,740,710,700,510,490,470,47
Wel
dox
700
W71-0aW71-0bW71-0c
W71-90aW71-90bW71-90cW72-0a
W72-90aW72-90bW73-0aW73-0b
W73-90aW73-90bW74-0b
W74-90aW74-90b
1186,51193,51191,61254,41246,31216,81269,81289,21310,81182,61192,71228,11222,61241,11253,41260,4
1496,21505,31497,71505,21497,21497,61820,81824,51828,52153,02154,02146,72150,93239,63231,03227,4
793,0792,9795,6833,4832,4812,5697,4706,6716,8549,3553,7572,1568,4383,1387,9390,5
1,031,031,031,051,051,020,900,890,900,710,720,720,720,500,490,49
Wel
dox
1100
W111-0aW111-0bW111-0c
W111-90aW111-90bW111-90cW112-0a
W112-90aW112-90W113-0aW113-0b
W113-90aW113-90bW114-0aW114-0b
W114-90aW114-90b
1433,51490,81428,71378,51413,41523,51650,61607,11667,71529,71543,21522,11551,01591,61560,91538,61557,4
1151,01151,91142,21147,01136,01138,11393,61392,61389,01645,11644,81643,81643,22497,62497,82496,82502,5
1245,41294,21250,81201,91244,11338,61184,41154,11200,7929,9938,2925,9943,9637,3624,9616,2622,4
0,920,960,930,900,931,000,880,860,900,690,690,690,710,470,460,460,47

APPENDIX C: Local Buckling - Further Evaluation
177
C.5 Gauges used in TestsAll 5 position gauges (LVDT) were from Measurements Group, U.K. LTD., Vishay.
The specifications for the 4 Welwyn HS10B LVDT’s used for measurement of axial displacement are:
Gauge No. 9554: L = 11,0 mm, Non.linearity 0,1%, Sensibility 4,9 mV/V.
Gauge No. 9556: L = 11,0 mm, Non.linearity 0,1%, Sensibility 5,1 mV/V.
Gauge No. 9952: L = 10,9 mm, Non.linearity 0,1%, Sensibility 4,8 mV/V.
Gauge No. 10544: L = 11,1 mm, Non.linearity 0,1%, Sensibility 4,9 mV/V.
The specifications for the Welwyn HS25B LVDT used for the measurement of buckle growth is:
Gauge No. 10168: L = 25,8 mm, Non.linearity 0,1%, Sensibility 6,4 mV/V.
A SPIDER 8, 600 Hz from HBM were used to sample and translate measurements to PC-environment. Serial No. F02439.
The load cell from DARTEC used for load measurement was calibrated in 2004 with a measurement error of < 0,6% in the whole measurement range up to 2 MN. Serial No. 89086/A.

178
C.6 Calculation of the partial safety factor - TestsThe same procedure of evaluation as for the experiments regarding the ultimate patch
loading resistance (presented in Appendix B) was used to evaluate the proposal of reduction function regarding local buckling resistance. Since the procedure of evaluation should be know to the reader at this point, only the calculated key values and the graph showing the experimentally determined ultimate loads versus the predicted loads (see Figure C.21) are presented within this section. A total of 85 specimens were used in this evaluation.
b = 1,143Vd = 0,078Vr = 0,111
The parameter Q is the calculated to
Figure C.21: The 85 experimental results, re, as a function of the predicted resistance, rt, according to the proposed reduction function.
The partial factor M was determined to
further
Q 0 111,=
0
2000
4000
6000
8000
r e [k
N]
0 2000 4000 6000 8000rt [kN]
Tests made at LTUTests from the literature
M 1 168,=

APPENDIX C: Local Buckling - Further Evaluation
179
was used to determine the corrected partial factor to
The partial safety factor based on the 85 individual tests results was determined to 1,07.
However, according to the discussion in chapter 7 this evaluation was also conducted using only tests made from the 1990’ies and forward. Disregarding the earlier conducted tests, the statistical evaluation of the partial safety factor will be determined to 1,03 according to following calculations. A total of 60 individual specimens are left when the earlier tests are excluded.
b = 1,165Vd = 0,071Vr = 0,107
The parameter Q is the calculated to
The partial factor M was determined to
further
was used to determine the corrected partial factor to
kc 0 916,=
M 1 168 0 916,, 1 07,= =
Q 0 107,=
M 1 161,=
kc 0 891,=
M 1 161 0 891,, 1 03,= =