Embed Size (px)
Citation preview
EconomicResearchService
Electronic Publications from the Food Assistance & Nutrition Research Program
Plate Waste in School NutritionPrograms
Final Report to Congress
Jean C. Buzby and Joanne F. Guthrie
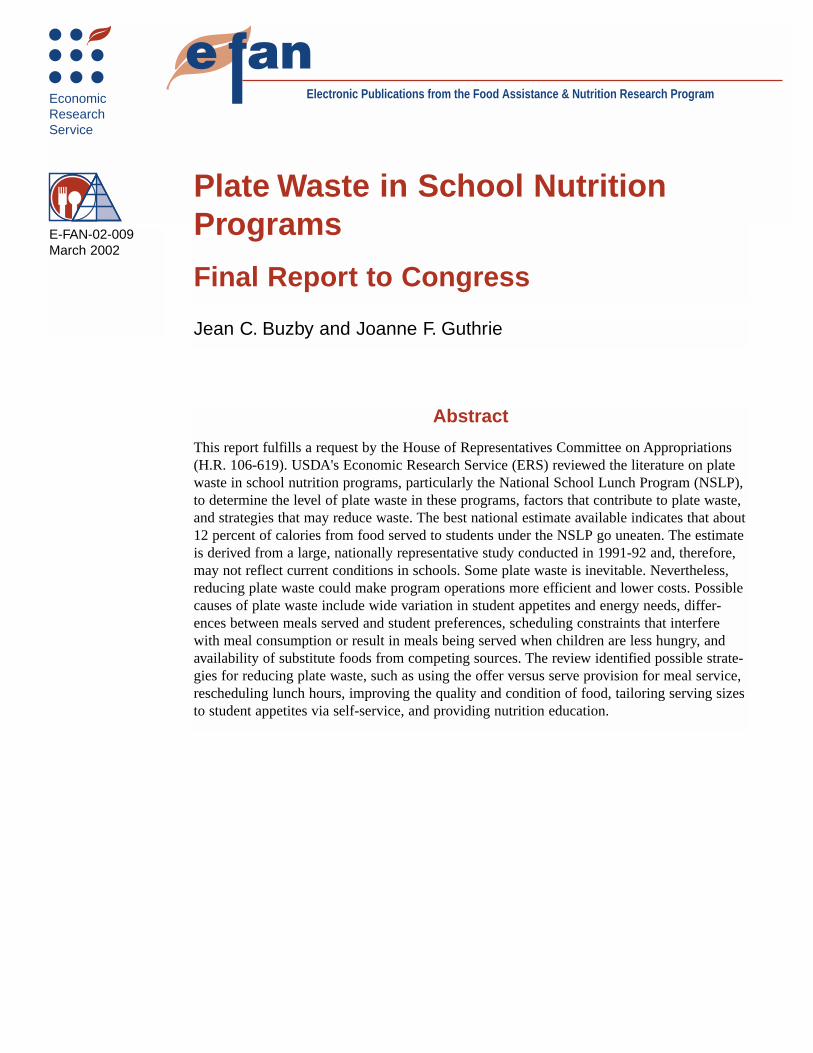
Abstract
This report fulfills a request by the House of Representatives Committee on Appropriations(H.R. 106-619). USDA's Economic Research Service (ERS) reviewed the literature on platewaste in school nutrition programs, particularly the National School Lunch Program (NSLP),to determine the level of plate waste in these programs, factors that contribute to plate waste,and strategies that may reduce waste. The best national estimate available indicates that about12 percent of calories from food served to students under the NSLP go uneaten. The estimateis derived from a large, nationally representative study conducted in 1991-92 and, therefore,may not reflect current conditions in schools. Some plate waste is inevitable. Nevertheless,reducing plate waste could make program operations more efficient and lower costs. Possiblecauses of plate waste include wide variation in student appetites and energy needs, differ-ences between meals served and student preferences, scheduling constraints that interferewith meal consumption or result in meals being served when children are less hungry, andavailability of substitute foods from competing sources. The review identified possible strate-gies for reducing plate waste, such as using the offer versus serve provision for meal service,rescheduling lunch hours, improving the quality and condition of food, tailoring serving sizesto student appetites via self-service, and providing nutrition education.
E-FAN-02-009March 2002
2 � Plate Waste in School Nutrition Programs: Report to Congress Economic Research Service/USDA
the ability to apply this finding to school meals is questionable.
Plate Waste Findings
Our analysis of the past 15 years of literature on platewaste in the NSLP yielded some general findings:
The School Nutrition Dietary Assessment Study-I (SNDA-I) (school year (SY) 1991-92), a nation-wide study, found that NSLP participants waste about 12 percent of the calories in the food that they are served (Burghardt and Devaney, 1993; Devaney et al., 1995). According to Devaney et al.,the most comprehensive measure of plate waste is the percentage of total food energy content (calo-ries) selected but not consumed. Plate waste esti-mates from smaller studies range from 10 to 37 percent, probably indicating both local variation in plate waste and the effects of methodological dif-ferences in the studies (USDA, 1992; Reger et al.,1996).
Girls tend to waste more food and nutrients thando boys (Bark, 1998; Devaney et al., 1995; Reger et al., 1996; USGAO, May 1996).
Younger children tend to waste a higher proportion of their food and nutrients than do older children (USGAO, May 1996; Dillon and Lane, 1989).
Plate waste varies by food type, with salad, vegeta-bles, and fruit generally reported to be the most wasted items (Bark, 1998; Reger et al., 1996; USGAO, July 1996; USDA/FNS, 1992; Robichaux and Adams, 1985). Although the nationally repre-sentative SNDA-I study found little difference in the percentage wasted of most nutrients, folate, a vitamin found primarily in fresh vegetables and fruit, had the highest waste, at 15 percent (Devaneyet al., 1995). This is consistent with the food cate-gories generally reported to be most wasted.
Cost of Plate Waste
No one has estimated the economic costs of platewaste. A simple way to do this is to multiply the platewaste estimate of 12 percent calories from food by$5.49 billion, the portion of the $6.2 billion NSLPallocation for fiscal year (FY) 2000 that went to cashpayments for meals. This method does not adjust fordifferences in costs of food items wasted (e.g., more
expensive entrees vs. less expensive side dishes)because these data are not available. The method alsoassumes that the economic costs of plate waste includethe overhead and labor costs of preparing and servingthe meals. This simple methodology yields an annualcost of plate waste in the NSLP of over $600 million.This estimate does not include the costs of the Federalshare of State administrative expenses, any wastedcommodity entitlements or bonus food, or the privatecosts of wasted foods purchased by students under theNSLP program. Also, the estimate does not include thevalue of lost nutrition and health benefits.
Nutrition Benefits ofSchool Meals
In addition to the direct loss of food, plate waste mayreduce benefits that children can receive from theNSLP. Healthful eating and regular physical activityhelp in optimizing physical and cognitive develop-ment, maintaining a healthful weight, and reducingrisk of some chronic diseases (Johnson and Nicklas,1999). Because of the large number of school mealsserved and the considerable contribution of schoolmeals to the diets of school children, school nutritionprograms could affect whether children fully obtainthese benefits. The benefits of school meals to childrenmay include: (1) immediately improved nutrition,health, and well-being; (2) promotion of healthygrowth and development; (3) protection against dis-eases and chronic health conditions; and (4) develop-ment of good eating habits that may be carried throughto adulthood. Of course, strategies for reducing platewaste must be careful not to encourage children to eatmore than needed, hence promoting obesity.Approaches to plate waste reduction that seem toaddress this concern are those that emphasize increas-ing meal flexibility, such as using the offer vs. serveprovision for meal service or using strategies to tailorportion sizes to appetites and needs.
Strategies for ReducingPlate Waste
Offer vs. Serve Provision
Research indicates that the offer vs. serve (OVS) pro-vision for meal service (see box), if well-implemented,can decrease plate waste and improve acceptance ofnutritious foods (Allaway, 1994). The OVS provisionencourages children to make selections of the foods

8 � Plate Waste in School Nutrition Programs: Report to Congress Economic Research Service/USDA
Reger et al. (1996) assessed plate waste in the NSLPusing information from 248 African-American chil-dren (50 percent boys), in grades three to six, in a lowsocioeconomic elementary school in New Orleans in1993. Two trained observers visually estimated platewaste using a six-point scale. Although boys and girlsselected the same number of menu items, girls wastedsignificantly more of the vegetable servings (p < 0.01).Contrary to results in some other studies, this studyfound that older students (fifth and sixth grades)tended to waste more than younger students (third andfourth grades). Overall, plate waste was roughly 37percent in this sample, which is relatively high com-pared with estimates found in other plate waste stud-ies. When observing mean plate waste by food item,salad scored highest (63.4 percent) followed by veg-etables (54.3 percent, excluding potatoes) and bread(54.2 percent).
The visual monitoring method has also been used inintervention studies that evaluate the impacts of modi-fications in school lunch meals. Some examplesinclude analysis of school intervention to switch toreduced-fat entrées (Snyder et al., 1996) and lower fatand higher fiber breakfast foods (Hurd-Crixell andFriedman, 1999).
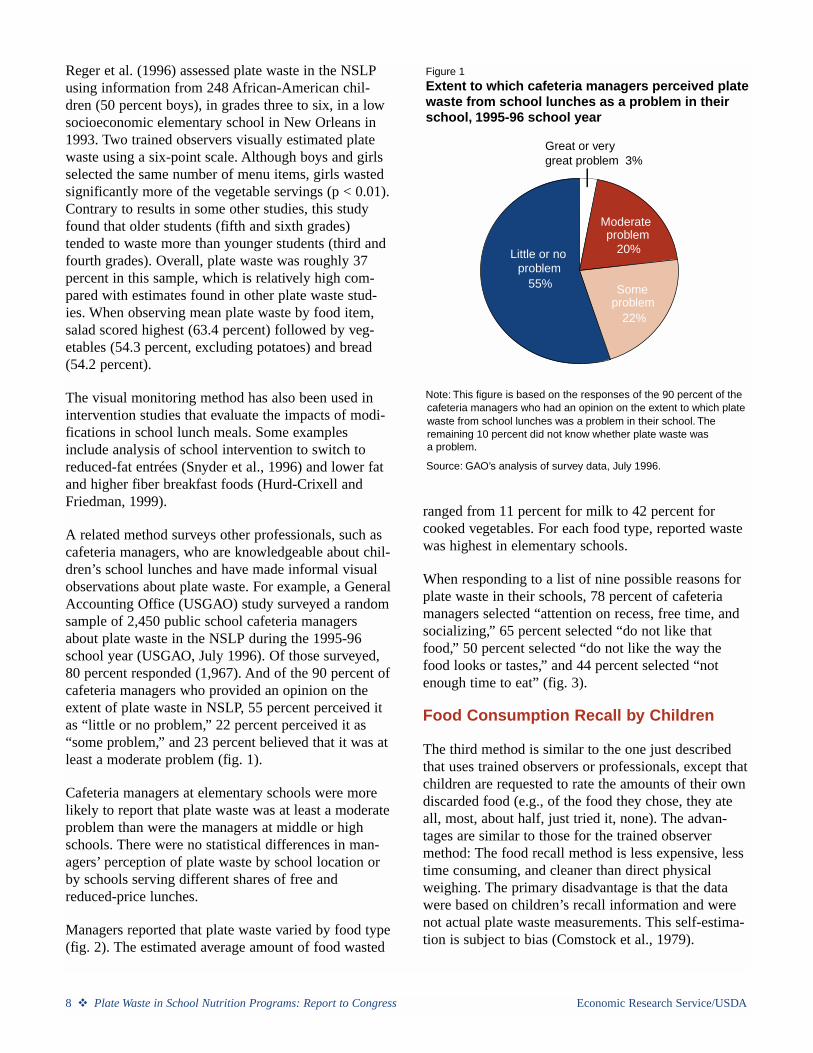
A related method surveys other professionals, such ascafeteria managers, who are knowledgeable about chil-dren’s school lunches and have made informal visualobservations about plate waste. For example, a GeneralAccounting Office (USGAO) study surveyed a randomsample of 2,450 public school cafeteria managersabout plate waste in the NSLP during the 1995-96school year (USGAO, July 1996). Of those surveyed,80 percent responded (1,967). And of the 90 percent ofcafeteria managers who provided an opinion on theextent of plate waste in NSLP, 55 percent perceived itas “little or no problem,” 22 percent perceived it as“some problem,” and 23 percent believed that it was atleast a moderate problem (fig. 1).
Cafeteria managers at elementary schools were morelikely to report that plate waste was at least a moderateproblem than were the managers at middle or highschools. There were no statistical differences in man-agers’ perception of plate waste by school location orby schools serving different shares of free andreduced-price lunches.
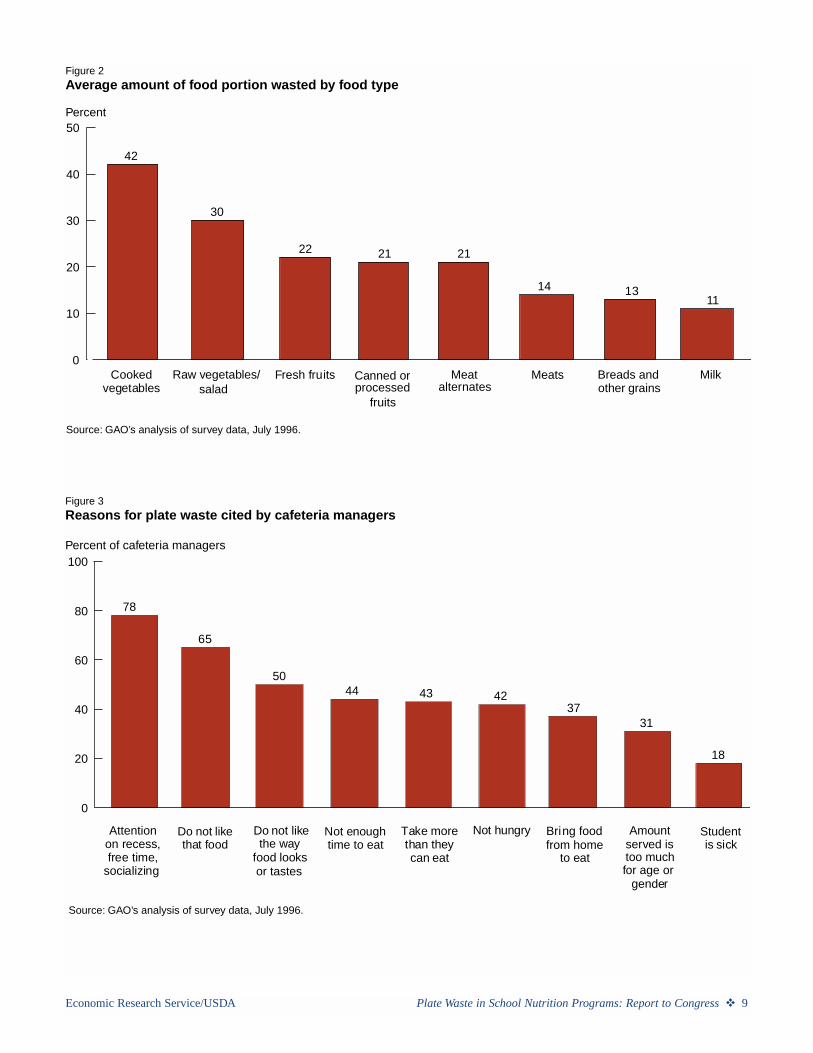
Managers reported that plate waste varied by food type(fig. 2). The estimated average amount of food wasted
ranged from 11 percent for milk to 42 percent forcooked vegetables. For each food type, reported wastewas highest in elementary schools.
When responding to a list of nine possible reasons forplate waste in their schools, 78 percent of cafeteriamanagers selected “attention on recess, free time, andsocializing,” 65 percent selected “do not like thatfood,” 50 percent selected “do not like the way thefood looks or tastes,” and 44 percent selected “notenough time to eat” (fig. 3).
Food Consumption Recall by Children
The third method is similar to the one just describedthat uses trained observers or professionals, except thatchildren are requested to rate the amounts of their owndiscarded food (e.g., of the food they chose, they ateall, most, about half, just tried it, none). The advan-tages are similar to those for the trained observermethod: The food recall method is less expensive, lesstime consuming, and cleaner than direct physicalweighing. The primary disadvantage is that the datawere based on children’s recall information and werenot actual plate waste measurements. This self-estima-tion is subject to bias (Comstock et al., 1979).
Great or verygreat problem 3%
Moderateproblem
20%
Someproblem
22%
Little or noproblem
55%
Figure 1Extent to which cafeteria managers perceived plate waste from school lunches as a problem in their school, 1995-96 school year
Note: This figure is based on the responses of the 90 percent of the cafeteria managers who had an opinion on the extent to which plate waste from school lunches was a problem in their school. The remaining 10 percent did not know whether plate waste was a problem.
Source: GAO’s analysis of survey data, July 1996.
Economic Research Service/USDA Plate Waste in School Nutrition Programs: Report to Congress � 9
Source: GAO’s analysis of survey data, July 1996.
42
30
22 21 21
14 1311
0
10
20
30
40
50
Fresh fruitsCookedvegetables
Meats MilkCanned or
fruits
Meat Breads andother grains
Figure 2Average amount of food portion wasted by food type
Percent
alternatesprocessedRaw vegetables/ salad
Do not likethat food
Not enough Not hungry
78
65
5044 43 42
3731
18
0
20
40
60
80
100
Attentionon recess,free time,
socializing
Take morethan theycan eat
Bring food
to eat
Amount
too much
gender
Studentis sick
Figure 3Reasons for plate waste cited by cafeteria managers
Percent of cafeteria managers
Do not like
food looksserved isfrom homethe way
or tastes
time to eat
Source: GAO’s analysis of survey data, July 1996.
for age or
10 � Plate Waste in School Nutrition Programs: Report to Congress Economic Research Service/USDA
One example of a study that used this type of platewaste measurement technique is USDA’s SNDA-Istudy (1993). For the 1991-92 school year, this studyinterviewed about 3,350 students in grades 1 through12 in public and private schools across the country andasked them to recall what they ate and drank duringthe 24-hour period prior to the interview. This studyfound that students in the NSLP wasted roughly 12percent of the calories from food served in the NSLP(Burghardt and Devaney, 1993; Devaney et al., 1995).The average waste of individual nutrients ranged from10 percent for vitamin B12 and cholesterol to 15 per-cent for folate (Devaney et al., 1995).
A USGAO study (May 1996) extended the SNDA-I byusing the same data to evaluate the percentage ofselected nutrients (i.e., calories, protein, saturated fat,and total fat) wasted by students with different demo-graphic characteristics. In essence, this study had fivekey findings (pp. 2-3):
Students participating in the school lunch program wasted a higher percentage of the nutrients in their lunch than nonparticipants.
Younger participants (those under 15) wasted a higher percentage of nutrients than older partici-pants. Younger participants also wasted a higher percentage of nutrients than younger nonpartici-pants.
Female participants wasted a higher percentageof nutrients than male participants. Furthermore,female participants wasted a higher percentageof nutrients than female nonparticipants.
Participants in urban schools wasted a larger percentage of protein, saturated fat, and total fat
than participants in suburban schools. USGAO found no difference in the percentage of calories wasted by participants on the basis of school loca-tion. Participants in urban schools wasted a higher percentage of the nutrients than nonparticipants in urban schools.
Participants receiving a free school lunch wasted a larger percentage of the nutrients than participants paying full price.
The finding that NSLP participants wasted a higherpercentage of nutrients than nonparticipants wasexpected, as lunches purchased outside of NSLP orbrought from home are generally tailored to the prefer-ences of individual children. Although nonparticipantswasted fewer nutrients than participants, nonpartici-pants did not consume the variety and amount of foodnecessary to meet one-third of their daily nutritionalneeds, while participants reached this NSLP programgoal.
A fourth method that can provide data on plate wastein children’s school lunches is waste stream analysis.With this method, researchers essentially sort all solidwaste from a school cafeteria to identify the amountand type of waste generated by the cafeteria. Forexample, waste may be categorized as cardboard,grease, milk cartons, paper, glass, tin cans/foil, plastic,plate waste, and food waste. Waste stream analysis isless appropriate for the purposes of this report and istherefore mentioned only briefly here. It has been usedto evaluate the effect of operational factors on thequantity of waste (for example, Hollingsworth et al.(1992) explored alternate milk packaging) and to com-pare waste composition across foodservice operations(Hollingsworth et al., 1995).
Economic Research Service/USDA Plate Waste in School Nutrition Programs: Report to Congress � 11
[* indicates a plate waste study.]
* Allaway, D. “Offer versus Serve and Food Choicesin Elementary School Cafeterias: Waste PreventionPilot Projects at North Plains Elementary School,Charles F. Tigard Elementary School, Metzger Ele-mentary School.” Flyer written for Harding LawsonAssociates, May 1994.
American Institute of Cancer Research. “New SurveyShows Americans Ignore Importance of Portion Sizein Managing Weight.” Press Release, Mar. 24, 2000.
Andrews, M., M. Nord, G. Bickel, and S. Carlson.Household Food Security in the United States, 1999.Food Assistance and Nutrition Research Report 8. U.S.Department of Agriculture, Economic Research Ser-vice, Fall 2000.
Andrews, S. “A Different Way to Plan a Menu,”School Food Service & Nutrition, 49,2(Feb. 1995):18.
Auld, G.W., C. Romaniello, J. Heimendinger, C. Ham-bidge, and M. Hambidge. “Outcomes from a School-Based Nutrition Education Program Using ResourceTeachers and Cross-Disciplinary Models,” Journal ofNutrition Education, 30,5(Sept.-Oct. 1998):268-280.
Azuma, A.M., and A. Fisher. Healthy Farms, HealthyKids: Evaluating the Barriers and Opportunities forFarm-to-School Programs. Venice, CA: CommunityFood Security Coalition, Jan. 2001.
* Bark, K. What are Montana Children Eating in theSchool Lunch Program? Results of a School LunchPlate Waste Study in a Rural State. Bozeman, MT:Montana Team Nutrition Program, Office of PublicInstruction, Montana State University, 1998.
Baranowski, T., J. Mendlein, K. Resnicow, E. Frank,K.W. Cullen, and J. Baranowski. “Physical Activityand Nutrition in Children and Youth: An Overview ofObesity Prevention,” Preventive Medicine,21(2000):S1-S10.
Baranowski, T., M. Smith, M.D. Hearn, L.S. Lin, J.Baranowski, C. Doyle, K. Resnicow, and D.T. Wang.“Patterns in Children’s Fruit and Vegetable Consump-tion by Meal and Day of the Week,” Journal of theAmerican College of Nutrition, 16,3(1997):216-23.
Bergman, E.A., N.S. Buergel, J. Enamuthu, and A.Sánchez. Time Required for Schoolchildren to EatLunch. University, MS: National Food Service Man-agement Institute, University of Mississippi, Feb. 26,1999.
Borja, M.E., P.L. Bordi, and C.U. Lambert. “NewLower-Fat Dessert Recipes for the School Lunch Program are Well Accepted by Children,” Journal ofthe American Dietetic Association, 96,9(Sept. 1996):908-10.
Brown, N.E., J.C. Hutchinson, and S.A. Gilmore.“Increasing Participation by High School Students inthe School Lunch Program,” Insight, the NationalFood Service Management Institute, 11(Oct. 1998).http://www.nfsmi.org/Information/Newsletters/Insight_index.html, accessed Dec. 6, 2000.
* Burghardt, J., and B. Devaney. The School NutritionDietary Assessment Study: Summary of Findings. Pre-pared by Mathematica Policy Research, Inc., Prince-ton, NJ, under Contract No. 53-3198-0-16, with theFood and Nutrition Service, U.S. Department of Agri-culture, Oct. 1993.
Caldwell, D.R., and V.B. Pliant. “Position of theAmerican Dietetic Association: Competitive Foods inSchools,” ADA Reports, 91,9(Sept. 1991):1123-5.
Carlson, Andi. CNPP economist; personal communica-tion, 2001.
Cline, T., and G. White. “Local Support for NutritionIntegrity in Schools-Position of ADA,” Journal of theAmerican Dietetic Association, 100(2000):108-11.
Code of Federal Regulations. Title 7, Chapter II,210.12 1-1-00 Edition.
Colditz, G.A., and A.L. Frazier. “Models of BreastCancer Show that Risk is Set by Events of Early Life: Prevention Efforts Must Shift Focus,” Cancer,
Appendix B Bibliography4
4 Includes all references consulted for Plate Waste in SchoolNutrition Programs, whether or not they are specifically citedin the report.
12 � Plate Waste in School Nutrition Programs: Report to Congress Economic Research Service/USDA
Epidemiology, Biomarkers, & Prevention, 4,(July/Aug.1995):567-571.
* Comstock, E.M., R.G. St. Pierre, and Y.D. Mackier-nan. Measures of Individual Plate Waste in SchoolLunches: Relationships among Weights, Visual Esti-mates, and Child Ratings. AAI Report #80-78. Cam-bridge MA: Abt Associates Inc., Contract No. 53-3198-9-38, June 16, 1980.
* Comstock, E.M., L.E. Symington, H.E. Chmielin-ski, and J.S. McGuire. Plate Waste in School FeedingPrograms: Individual and Aggregate Measures. ReportNo. NATICK/TR-81-011. Natick, MA: Food SciencesLaboratory, U.S. Army Natick Research and Develop-ment Command, Dec. 1979.
Crepinsek, M.K., N.R. Burstein, E.B. Lee, and W.L.Hamilton. Effects of Reimbursement Tiering on Nutri-tional Aspects of Tier 2 Meals: A Report of the FamilyChild Care Homes Legislation Study. ForthcomingFood Assistance and Nutrition Research Report. Economic Research Service, U.S. Department of Agriculture.
Croce, A.L. Nutrition Education and the School SiteAdministrator: Target Nutrition, Nutrition EducationTactics. Publication No. 1-B-80-191980. San Diego,CA: San Diego City Schools, pp. 6, ill.
Cullen, K.W., J. Eagan, T. Baranowski, E. Owens, andC. de Moor. “Effect of a la Carte and Snack Bar Foodsat School on Children’s Lunchtime Intake of Fruitsand Vegetables,” Journal of the American DieteticAssociation, 100,12(Dec. 2000):1482-6.
DeBrosse, J. “School-age Spread,” Minnesota Star Tri-bune, Mar. 10, 1997:E1.
Demas, A. “Low-Fat School Lunch Programs:Achieving Acceptance,” The American Journal ofCardiology, 82,10B(Nov. 26 1998):80T-82T.
* Devan, K.S., M.B. Gregoire, and M.C. Spears.“Evaluation of a Vegetable Preparation Training Pro-gram: Part II: Assessment by Plate Waste Observationand Student and Sensory Panel Ratings,” School FoodService Research Review, 12,1(Spring 1988):24-7.
* Devaney, B.L., A.R. Gordon, and J.A. Burghardt.“Dietary Intakes of Students,” American Journal ofClinical Nutrition, 61, suppl.(1995):205S-212S.
* Dillon, M.S., and H.W. Lane. “Evaluation of theOffer vs. Serve Option Within Self-Serve, ChoiceMenu Lunch Program at the Elementary SchoolLevel,” Journal of the American Dietetic Association,89,12(Dec. 1989):1780-5.
Domel, S.B., T. Baranowski, H. Davis, W.O. Thomp-son, S.B. Leonard, P. Riley, J. Baranowski, B.Dudovitz, and M. Smyth. “Development and Evalua-tion of a School Intervention to Increase Fruit andVegetable Consumption among 4th and 5th Grade Stu-dents,” Journal of Nutrition Education, 25,6(Nov.-Dec.1993):345-9.
Earnest, O. “Self-Serve System Keeps Students Com-ing,” School Food Service Journal, 41,2(Feb 1987):85, ill.
Edmundson, E., G.S. Parcel, H.A. Feldman, J. Elder,C.L. Perry, and others. “The Effects of the Child andAdolescent Trial for Cardiovascular Health upon Psy-chosocial Determinants of Diet and Physical ActivityBehavior,” Preventive Medicine, 25(1996):442-54.
Evers, C. “More Nutrition, Less Waste,” School Food-service & Nutrition, 49,10(Nov. 1995):76, 78, 93.
Federal Interagency Forum on Child and Family Sta-tistics. America’s Children: Key National Indicators ofWell-being. Washington, DC: U.S. Government Print-ing Office, 1998.
Fogler-Levitt, E., D. Lau, A. Csima, M. Krondl, and P. Coleman. “Utilization of Home-Delivered Meals byRecipients 75 Years of Age or Older.” Journal of theAmerican Dietetic Association, 95,5(May 1995):550-8.
Frank, G.C., T.A. Nicklas, J.E. Forcier, and G.S.Berenson. “Cardiovascular Health Promotion forSchool Children, Part 2: Observations on InstitutionalFood Service Change Affecting Student Eating Behav-ior,” School Food Service Research Review, 13,2 (Fall1989):137-45.
Frazão, E. (ed.) “High Costs of Poor Eating Patterns inthe United States,” America’s Eating Habits: Changesand Consequences. Agriculture Information BulletinNo. 750. U.S. Department of Agriculture, EconomicResearch Service, Apr. 1999.
Economic Research Service/USDA Plate Waste in School Nutrition Programs: Report to Congress � 13
General Foods Corporation. “Dayton Students Cleanthem Up,” School Food Service Journal, 40,2(Mar.1986):88-89, ill.
Getlinger, M.J., C.V. Laughlin, E. Bell, C. Arek, andB.H. Armandi. “Food Waste is Reduced when Elemen-tary-School Children have Recess Before Lunch,”Journal of the American Dietetic Association,96,6(Sept. 1996):906-8.
Gittelsohn, J., E.G. Toporoff, M. Story, M. Evans, J.Anliker, S. Davis, A. Sharma, and J. White. “Food Per-ceptions and Dietary Behavior of American-IndianChildren, Their Caregivers, and Educators: FormativeAssessment Findings from Pathways,” Journal ofNutrition Education, 32,1(Jan.-Feb., 2000):2-13.
Gortmaker, S.L., A. Must, J.M. Perrin, A.M. Sobol,and W.H. Dietz. “Social and Economic Consequencesof Overweight in Adolescence and Young Adulthood,”The New England Journal of Medicine, 239,14(Sept.30, 1993):1008-1012.
* Green, N.R., and S.G. Munroe. “Evaluating Nutri-ent-Based Nutrition Education by Nutrition Knowl-edge and School Lunch Plate Waste,” School FoodService Research Review, 11,2(Fall 1987):112-5.
Guo, S.S., A.F. Roche, W.C. Chumlea, J.D. Gardner,and R.M. Siervogel. “The Predictive Value of Child-hood Body Mass Index Values for Overweight at Age35 Years,” American Journal of Clinical Nutrition,59(1994):810-9.
Gustafson-Larson, A.M., and R. D. Terry. “Weight-related Behaviors and Concerns of Fourth-Grade Chil-dren,” Journal of the American Dietetic Association,92,7(July 1992):818-22.
Harnack, L., P. Snyder, M. Story, R. Holliday, L. Lytle,and D. Neumark-Sztainer. “Availability of a la CarteFood Items in Junior and Senior High Schools: ANeeds Assessment,” Journal of the American DieteticAssociation, 100,6(June 2000):701-3.
Ho, C.S., R.A. Gould, L.N. Jensen, S.J. Kiser, A.Mozar, and J.B. Jensen. “Evaluation of the NutrientContent of School, Sack and Vending Lunch of JuniorHigh Students,” School Food Service Research Review,15,2(Fall 1991):85-90.
* Hollingsworth, M.D., C.W. Shanklin, and E.W.Cross. “Waste Stream Analyses in Seven Selected
School Food Service Operations,” School Food ServiceResearch Review, 19,2(1995):81-7.
* Hollingsworth, M.D., C. Shanklin, B. Gench, and M. Hinson. “Composition of Waste Generated in SixSelected School Food Service Operations,” SchoolFood Service Research Review, 16,2(Fall 1992):125-31.
Hunt, S.M. “Ensuring Quality Programs,” School FoodService Journal, 37,5(May 1983):64-5.
Hurd, S.L., and B.J. Friedman. “The Texas SchoolBreakfast Intervention Project: Part I. Children willAccept Foods Higher in Fiber and Lower in Fat,”School Food Service Research Review, 21,2(1997):82-7.
* Hurd-Crixell, S.L, and B.J. Friedman. “The TexasSchool Breakfast Intervention Project: Part II. NutrientIntake of Children Offered Foods Higher in Fiber andLower in Fat,” The Journal of Child Nutrition & Man-agement, 23,2(1999):91-5.
Johnson, R.K., and T.A. Nicklas. “Dietary Guidancefor Healthy Children Aged 2 to 11 years—Position ofADA,” Journal of the American Dietetic Association,99(1999):93-101.
Kantor, L.S., K. Lipton, A. Manchester, and V.Oliveira. “Estimating and Addressing America’s FoodLosses,” FoodReview, 20,1(Jan.-Apr. 1997):2-12.
Kelder, S.H., C.L. Perry, K.-I. Klepp, and L.L. Lytle.“Longitudinal Tracking of Adolescent Smoking, Physi-cal Activity, and Food Choice Behaviors,” AmericanJournal of Public Health, 84,7(July 1994):1121-6.
Kerfoot, B.A., and R.M. Fournet. “Evaluation of theUse of a Self-Service Fruit and Vegetable Bar on Con-sumption and Plate Waste.” Journal of the AmericanDietetic Association 96, 9 suppl. (1996):A-10.
Kim, T., and C.W. Shanklin. “Menu Item Acceptabilityin Conventional and Cook-Chill Food Production Sys-tems,” The Journal of Child Nutrition & Management,23,2(1999):61-6.
Krupin, N.E., and C.C. Georgiou. “Serving Lower FatSchool Lunches: the Effect on 24-Hour Fat Intake byFifth Graders,” School Food Service Research Review,17,1(1993):30-6.
14 � Plate Waste in School Nutrition Programs: Report to Congress Economic Research Service/USDA
Law, M. “Dietary Fat and Adult Diseases and theImplications for Childhood Nutrition: an Epidemio-logic Approach,” American Journal of Clinical Nutri-tion, 72 suppl. (2000):1291S-6S.
Lin, B.-H. “Food Consumption and Nutrient IntakeTables.” Source CSFII 1994-96.http://www.ers.usda.gov/briefing/dietandhealth/data/foods/table4.html, accessed Jan. 8, 2001.
Lin, B.-H., J. Guthrie, and J.R. Blaylock. The Diets ofAmerica’s Children: Influences of Dining Out, House-hold Characteristics, and Nutrition Knowledge. Agri-cultural Economic Report 746. U.S. Department ofAgriculture, Economic Research Service, Dec. 1996.
Lin, B.-H., J. Guthrie, and E. Frazao. “Quality of Chil-dren’s Diets at and Away From Home, 1977-96,”FoodReview, 24,2(May-Aug. 2001), forthcoming.
*Lind, B.A., G.K. Newell, A.D Dayton, A.G. Vaden,and S. Greig. “Effect of Family versus Cafeteria StyleService on Students’ Attitudes, Food Intake, and FoodWaste,” School Food Service Research Review,10,1(Spring 1986):18-25.
* Liquori, T., P.D. Koch, I.R. Contento, and J. Castle.“The Cookshop Program: Outcome Evaluation of aNutrition Education Program Linking LunchroomExperiences with Classroom Cooking Experiences,”Journal of Nutrition Education, 30,5(1998):302-13.
Lucas, B. “Normal Nutrition from Infancy throughAdolescence,” Handbook of Pediatric Nutrition, 2ndEdition, P.Q. Samour, K.K. Helm, and C.E. Lang(eds.) Gaithersburg, MD: Aspen Publishers, Inc. 1999,pp. 99-120.
Luepker, R.V., C.L. Perry, S.M. McKinlay, P.R. Nador,G.S. Parcel, E.J. Stone, L.S. Webber, J.P. Elder, H.A.Feldman, C.C. Johnson, S.H. Kelder, and M.W. Wu,for the CATCH Collaborative Group. “Outcomes of aField Trial to Improve Children’s Dietary Patterns andPhysical Activity: The Child and Adolescent Trial forCardiovascular Health (CATCH),” Journal of theAmerican Medical Association, 275,10(Mar. 13,1996):766-76.
Martin, L. Personal correspondence on “Mealtalk”internet discussion group, Nov. 18, 1996.
Mellin, L.M., C.E. Irwin, and S. Scully. “Prevalence ofDisordered Eating in Girls: A Survey of Middle-Class
Children,” Journal of the American Dietetic Associa-tion, 92, 7(July 1992):851-53.
Merrill, D. “The New Dietary Guidelines and Kids:Will They Sit at the Same Table?” School-Business-Affairs, 63,1(Jan. 1997):22-6.
Montague, Patti. Personal communication, April 16,2001.
Nicklas, T.A. “Dietary Studies of Children: TheBogalusa Heart Study Experience,” Journal of theAmerican Dietetic Association, 95,10(Oct.1995):1127-33.
Nicklas, T.A., E. Stone, D. Montgomery, P. Snyder, M.Zive, M.K. Ebzery, M.A. Evans, A. Clesi, B. Hann,and J. Dwyer. “Meeting the Dietary Goals for SchoolMeals By the Year 2000: The CATCH Eat SmartSchool Nutrition Program,” Journal of Health Educa-tion, 25,5(Sept.-Oct. 1994):299-307.
Nicklas, T.A., L.S. Webber, S.R. Srinivasan, and G.S.Berenson. “Secular Trends in Dietary Intakes and Car-diovascular Risk Factors of 10-year-old Children: TheBogalusa Heart Study (1973-1988),” American Journalof Clinical Nutrition, 57(1993):930-7.
NIH Technology Assessment Conference Panel.“Methods for Voluntary Weight Loss and Control,”Annals of Internal Medicine, 119,7 part 2(Oct. 1,1993):764-70.
Oliveira, V. “Cost of Food Assistance ProgramsDeclined Slightly in First Half of 1996,” FoodReview,19,3(Sept.-Dec., 1996):26-33.
Oregon Department of Education Child Nutrition Pro-grams. “Food Pyramid Choice Menus: Bridging theGap Between Classroom & Cafeteria.” Undated flyer.
Perry, C.L., D.B. Bishop, G. Taylor, D.M. Murray,R.W. Mays, B.S. Dudovitz, M. Smyth, and M. Story.“Changing Fruit and Vegetable Consumption AmongChildren: The 5-a-Day Power Plus Program in St.Paul, Minnesota,” American Journal of Public Health,88,4(Apr. 1998):603-9.
Pi-Sunyer, F.X. “Medical Hazards of Obesity,” Annalsof Internal Medicine, 119,7 part 2 (Oct. 1, 1993):655-60.
Economic Research Service/USDA Plate Waste in School Nutrition Programs: Report to Congress � 15
Price, C., and B. Kuhn. “Public and Private Efforts forthe National School Lunch Program,” FoodReview,19,2(May-Aug. 1996):51-7.
* Read, M.H., and N. Moosburner. “The Scheduling ofRecess and the Effect of Plate Waste at the ElementarySchool Level,” School Food Service Research Review,9,1(1985):40-4.
* Reger, C., C.E. O’Neil, T.A. Nicklas, L. Myers, andG.S. Berenson. “Plate Waste of School LunchesServed to Children in a Low-Socioeconomic Elemen-tary School in South Louisiana,” School Food ServiceResearch Review, 20, suppl.(1996):13-19.
Resnicow, K., M. Smith, T. Baranowski, J. Bara-nowski, R. Vaughan, and M. Davis. “2-Year Trackingof Children’s Fruit and Vegetable Intake,” Journal ofthe American Dietetic Association, 98,7(July1998):785-89.
* Robichaux, F., and S. Adams. “Offer vs. Serve Food-service in Lower Elementary School Lunchrooms,”Journal of the American Dietetic Association,85,7(July 1985):853-4.
Rodgers, P., T. Schuster, and J. Anderson (technicaladvisor A. Sánchez). Time Required by School Chil-dren to Eat Lunch. National Food Service Manage-ment Institute, University of Mississippi, Oct. 26,1999.
Rolls, B.J., D. Engell, and L.L. Birch. “Serving Por-tion Size Influences 5-Year-Old but not 3-Year-OldChildren’s Food Intakes,” Journal of the AmericanDietetic Association, 100,2(Feb. 2000):232-4.
Rowland, T.W. “Is There a Scientific Rationale Sup-porting the Value of Exercise for the Present andFuture Cardiovascular Health of Children? The ConArgument,” Pediatric Exercise Science, 8(1996):303-9.
* Ruppenthel, B. “Playground and Plate Waste Revis-ited,” School Foodservice Journal, (July-Aug.1978):145-6.
* Ruppenthel, B., and W. Hogue. “Playground andPlate Waste,” School Foodservice Journal, (Apr.1977):66-70.
* Ryan, L.D., J.E. Anderson, and P.J. Bechtel. “Con-sumption and Waste of Fresh and Canned Fruits and
Vegetables in a School Lunch Program,” Journal ofChild Nutrition and Management, 24,2(2000):99-106.
Sánchez, A., L.C. Hoover, J.B. Cater, N.F Sánchez,and J.L. Miller. “Measuring and Evaluating the Ade-quacy of the School Lunch Period,” Insight, NationalFood Service Management Institute, 12(Apr. 1999).http://www.nfsmi.org/Information/Newsletters/Insight_index.html, accessed Dec. 6, 2000.
Sánchez, A., L.C. Hoover, and N.F Sánchez, in coop-eration with Texas Tech University. Time Required bySchool Children to Eat Lunch: A Final Report from aContracted Study with Texas Tech University, LubbockTexas. University of Mississippi: National Food Ser-vice Management Institute, Oct.15, 1997.
* Sandoval, W.M., D.W. Lockner, and E.W. Adkins.“Modified School Lunch Menus Based on the DietaryGuidelines II: Acceptability as Determined by PlateWaste,” School Food Service Research Review,10,1(1986):31-4.
Schwab, M.G. “Participatory Research with Children:A New Approach to Nutrition Education,” Journal ofNutrition Education, 21,4(Aug. 1989):184-B, ill.
Shannon, E.C., and J.M. Weiss. “Self-Serve Dishes upNutrition,” School Food Service Journal, 42,9(Oct.1988):40-1, ill.
Smith, A.P., A. Kendrick, A.L. Maben, and J. Salmon.“Effects of Fat Content, Weight, and Acceptability ofthe Meal on Postlunch Changes in Mood, Perfor-mance, and Cardiovascular Function,” Physiology andBehavior, 55,3(Mar. 1994):417-22.
* Snyder, M.P., R.M. Fee, L. Lytle, and B. Hann. “Visually Monitoring Students’ Consumption ofSchool Lunch Entrees,” School Food Service ResearchReview, 20,2(1996):63-8.
Snyder, M.P., M. Story, and L.L. Trenkner. “ReducingFat and Sodium in School Lunch Programs: theLUNCHPOWER! Intervention Study,” Journal of the American Dietetic Association, 92,9(Sept.1992):1087-91.
Stafford, J.R. “Regs, Challenges and Directions,”School Foodservice & Nutrition, 50,3(Mar 1996):28-30, 32.
16 � Plate Waste in School Nutrition Programs: Report to Congress Economic Research Service/USDA
* Stallings, S.F. and C.G. Brown. “Relationship of Calo-rie Content and Meal Weight to Plate Waste of SchoolLunches in Selected Elementary Schools in South Car-olina,” School Food Service Research Review,8,1(Spring 1984):22-5.
Story, M., M. Hayes, and B. Kalina. “Availability ofFoods in High Schools: Is There Cause for Concern?”Journal of the American Dietetic Association, 96,2(Feb.1996):123-6.
U.S. Centers for Disease Control and Prevention.“Update: Prevalence of Overweight Among Children,Adolescents, and Adults—United States, 1988-1994,”Morbidity and Mortality Weekly Report, 46, 9(Mar. 7,1997):199-202.
U.S. Department of Agriculture Food and Nutrition Ser-vice (USDA/FNS). “Foods Sold in Competition withUSDA School Meal Programs.” 2001.http://www.fns.usda.gov/cnd/Lunch/CompetitveFoods/competitive.foods.report.to.congress.html, accessed Jan.30, 2001.
U.S. Department of Agriculture, Food and NutritionService, Office of Analysis, Nutrition, and Evaluation(USDA/FNS). “Children’s Diets in the Mid-1990s:Dietary Intake and Its Relationship with School MealParticipation.” Nutrition Assistance Program ReportSeries, Report No. CN-01-CD1, Jan. 2001.
* U.S. Department of Agriculture, Food and NutritionService (USDA/FNS). The School Meals InitiativeImplementation Study: First Year Report. S. Abraham,M. Chattopadhyay, C. Sullivan, L. Mallory, and D.M.Steiger of the Gallup Organization and L. Daft, A.Arcos, and B. Wilbraham of PROMAR International,Oct. 2000.
U.S. Department of Agriculture, Food and NutritionService (USDA/FNS). Small Farms/School Meal Initia-tive: Town Hall Meetings: A Step-by-Step Guide onHow to Bring Small Farms and Local Schools Together.FNS-316. Mar. 2000.
U.S. Department of Agriculture, Food and NutritionService (USDA/FNS). “ National School Lunch Pro-gram and School Breakfast Program: Additional MenuPlanning Alternatives; Proposed Rule,” Federal Register,7 CFR Parts 210 and 220, 63,85(May 4, 1998):24685-24709.
U.S. Department of Agriculture, Food and NutritionService (USDA/FNS). “Child Nutrition Programs:School Meal Initiatives for Healthy Children; FinalRule,” Federal Register, 7 CFR Parts 210 and 220,60,113(June 13, 1995):31187-222.
U.S. Department of Agriculture, Food and NutritionService, Office of Analysis, Nutrition, and Evaluation(USDA/FNS). School Nutrition Dietary AssessmentStudy-II: Summary of Findings. M.K. Fox, M.K. Cre-pinsek, P. Connor, and M. Battaglia, Project Officer, P.McKinney. Alexandria, VA, Jan. 2001.
* U.S. Department of Agriculture, Food and NutritionService, Office of Analysis, Nutrition, and Evaluation(USDA/FNS). Child Nutrition Program OperationsStudy, Second Year Report: Executive Summary. R. St.Pierre, M.K. Fox, M. Puma, F. Glantz, and M. Moss,and Project Officer, J. Endahl. Alexandria, VA,June 1992.
U.S. Department of Agriculture, Food and NutritionService, Office of Analysis, Nutrition, and Evaluation(USDA/FNS). The Story of Team Nutrition: Pilot StudyOutcome Report: Final Report. Prepared by ProspectAssociates and Westat, Contract 53-3198-4-038, Winter1998.
U.S. Department of Health and Human Services.Healthy People 2010, 2nd Edition. Washington, DC:U.S. Government Printing Office, 2000, Vol. II:19-40.
U.S. Department of Health and Human Services. Sur-geon General’s Report on Nutrition and Health. DHHSPublication No. (PHS) 88-50310. Washington DC: U.S.Government Printing Office, 1998.
U.S. General Accounting Office (USGAO). “PublicEducation: Commercial Activities in Schools.”Washington DC, Report to Congressional requestersGAO/HEHS-00-156, Sept. 2000.
U.S. General Accounting Office (USGAO). SchoolLunch Program: Role and Impacts of Private Food Ser-vice Companies. GAO/RCED-96-217. Washington DC,Report to Congressional Committees, Aug. 1996.
* U.S. General Accounting Office (USGAO). SchoolLunch Program: Cafeteria Managers’ Views on FoodWasted by Students. GAO/RCED-96-191. WashingtonDC, Report to the Chairman, Committee on Economic
Economic Research Service/USDA Plate Waste in School Nutrition Programs: Report to Congress � 17
and Educational Opportunities, House of Representa-tives, July 1996.
* U.S. General Accounting Office (USGAO). Wastefrom School Lunches. GAO/RCED-96-128R. Washing-ton DC, May 8, 1996.
Washington State Potato Commission. “PotatoesAccent Lunch with Flair,” School Food Service Jour-nal, 40,6(Aug. 1986):88.
Wechsler, H., C.E. Basch, P. Zybert, and S. Shea.“Promoting the Selection of Low-Fat Milk in Elemen-tary School Cafeterias in an Inner-City Latino Com-munity: Evaluation of an Intervention,” AmericanJournal of Public Health, 88,3(Mar. 1998):427-33.
Wechsler, H., N.D. Brener, S. Kuester, and C. Miller.“Food Service and Foods and Beverages Available at School: Results from the School Health Policies andPrograms Study 2000,” Journal of School Health, 71,7(Sept. 2001): 313-24.
Wechsler, H., R.S. Devereaux, M. Davis, and J.Collins. “Using the School Environment to PromotePhysical Activity and Healthy Eating,” PreventiveMedicine, 31(2000):S121-7.
* Whatley, J.E., J.E. Donnelly, D.J. Jacobsen, J.O. Hill,and M.K. Carlson. “Energy and Macronutrient Con-sumption of Elementary School Children Served Mod-ified Lower Fat and Sodium Lunches or StandardHigher Fat and Sodium Lunches,” Journal of theAmerican College of Nutrition, 15,6(Dec. 1996):602-7.