Embed Size (px)
Citation preview

Plotting the path from RNA to Plotting the path from RNA to microarray:microarray: the importance of the importance of
experimental planning and experimental planning and methodsmethods
Glenn ShortGlenn ShortMicroarray Core Facility/Lipid Metabolism UnitMicroarray Core Facility/Lipid Metabolism Unit
Massachusetts General HospitalMassachusetts General Hospital

Talk OutlineTalk Outline Why perform a microarray experiment?Why perform a microarray experiment? Choosing a microarray platformChoosing a microarray platform Sources of variability that lend to Sources of variability that lend to
experimental considerationsexperimental considerations Overcoming experimental variabilityOvercoming experimental variability

Why perform a microarray Why perform a microarray experiment?experiment? Genomic vantage pointGenomic vantage point
– Detect gene expressionDetect gene expression– Compare gene expression levelsCompare gene expression levels
• Over timeOver time
• Over treatment courseOver treatment course
– Map genes to phenotypesMap genes to phenotypes– Map deleted or duplicated regionsMap deleted or duplicated regions– Identify genes that modulate other Identify genes that modulate other
genesgenes
Binary decision-makingBinary decision-making
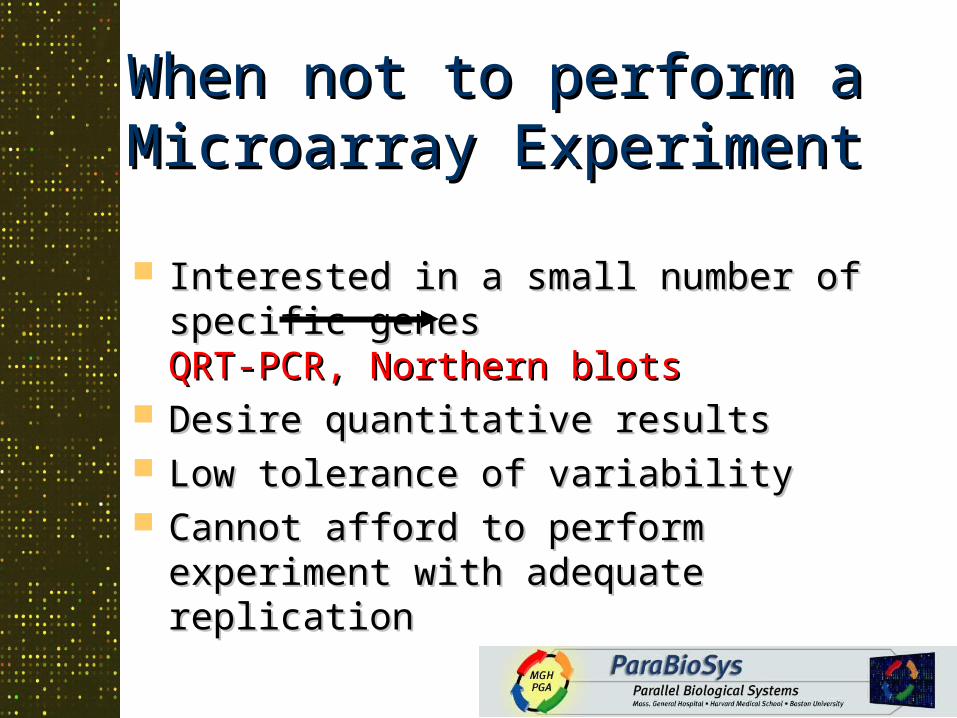
When not to perform a When not to perform a Microarray ExperimentMicroarray Experiment
Interested in a small number of specific Interested in a small number of specific genes genes QRT-PCR, Northern blotsQRT-PCR, Northern blots
Desire quantitative resultsDesire quantitative results Low tolerance of variabilityLow tolerance of variability Cannot afford to perform experiment with Cannot afford to perform experiment with
adequate replicationadequate replication
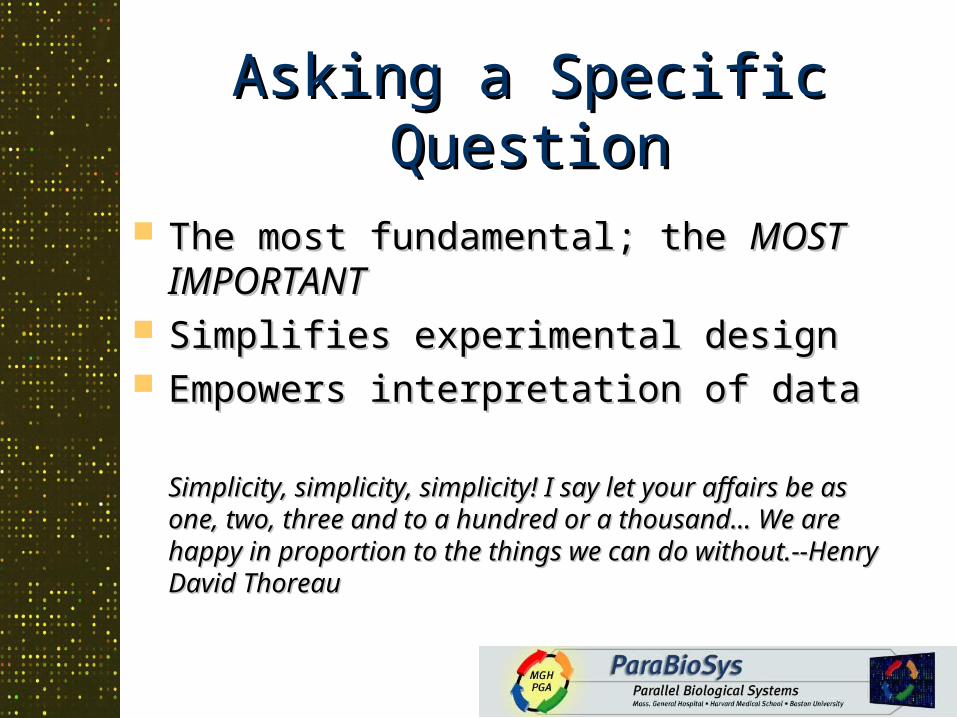
Asking a Specific QuestionAsking a Specific Question
The most fundamental; the The most fundamental; the MOST MOST IMPORTANTIMPORTANT
Simplifies experimental designSimplifies experimental design Empowers interpretation of dataEmpowers interpretation of data
Simplicity, simplicity, simplicity! I say let your affairs Simplicity, simplicity, simplicity! I say let your affairs be as one, two, three and to a hundred or a be as one, two, three and to a hundred or a thousand… We are happy in proportion to the things thousand… We are happy in proportion to the things we can do without.--Henry David Thoreau we can do without.--Henry David Thoreau

Considerations of Microarray Considerations of Microarray Experimental DesignExperimental Design
Which microarray platform will be used?Which microarray platform will be used? What is the end goal of the experiment?What is the end goal of the experiment? What is the specific question being asked?What is the specific question being asked? What are the most pertinent comparisons?What are the most pertinent comparisons? What controls will be applied to the experiments?What controls will be applied to the experiments? Which statistical methods will be used during data Which statistical methods will be used during data
analysis? analysis? What methods will be used to verify results from the What methods will be used to verify results from the
microarrays?microarrays?

Choosing a Microarray PlatformChoosing a Microarray Platform
Are Are genes of interestgenes of interest included on the included on the array?array?
Are genes replicated?Are genes replicated? Tiling of genes that undergo splicingTiling of genes that undergo splicing Controls on arrayControls on array Quantity of RNA needed for testingQuantity of RNA needed for testing Are the arrays adequately QC’d?Are the arrays adequately QC’d? CostCost

Affymetrix PlatformAffymetrix Platform

Affymetrix PlatformAffymetrix Platform

Affymetrix PlatformAffymetrix Platform
Pro’sPro’s– standardized productionstandardized production– gene replicationgene replication– probe tiling across geneprobe tiling across gene– ReproducibleReproducible– Affymetrix custom Affymetrix custom
database user-friendlydatabase user-friendly
Con’sCon’s– ExpensiveExpensive– Annotation differencesAnnotation differences– single sample per chipsingle sample per chip

cDNA PlatformcDNA PlatformcDNA clonescDNA clones(probes)(probes)
1. PCR product 1. PCR product amplificationamplification2. Purification2. Purification3. Printing3. Printing
Pro’sPro’s– Genome sequence Genome sequence
independentindependent– High stringency High stringency
hybridizationhybridization– Little need for signal Little need for signal
amplificationamplification
Con’sCon’s– Clone handlingClone handling– Clone authenticationClone authentication– cDNA resources difficult to cDNA resources difficult to
access and often cross- access and often cross- contaminatedcontaminated
PCR products PCR products used as probesused as probes

Spotted oligonucleotide PlatformSpotted oligonucleotide Platform
Pro’sPro’s– Complete control over oligo Complete control over oligo
sequencessequences– Absence of contaminationAbsence of contamination– Additional probes may be added Additional probes may be added
when neededwhen needed– Flexibility of design, probe Flexibility of design, probe
replication, and tilingreplication, and tiling– Inexpensive, enabling Inexpensive, enabling
experimental replicationexperimental replication Con’sCon’s
– Sequence data required for Sequence data required for probe designprobe design
– No consensus set of probe No consensus set of probe design algorithmsdesign algorithms
– Must have arraying Must have arraying instrumentationinstrumentation
Synthesized Synthesized oligonucleotides oligonucleotides
in 384 well in 384 well platesplates
1.1. PurificationPurification2.2. QCQC3.3. PrintingPrinting
Oligonucleotides Oligonucleotides used as probesused as probes

Spotted Oligonucleotide vs Affymetrix Spotted Oligonucleotide vs Affymetrix ArraysArrays
probe setprobe set
Probe design and synthesisProbe design and synthesis
Oligonulceotide AffymetrixOligonulceotide Affymetrix

ParaBioSys PlatformParaBioSys Platform Long Oligonucleotides, 70mer Long Oligonucleotides, 70mer Designed and synthesized in-houseDesigned and synthesized in-house 5’-amine modified5’-amine modified Extensively QC’dExtensively QC’d Probes designed to the 5’-Probes designed to the 5’-orforf Set is updated as known Set is updated as known orforf list grows list grows
– Currently 20,000 probesCurrently 20,000 probes

ParaBioSys probe design and synthesisParaBioSys probe design and synthesis
Probe design using Probe design using OligoPickerOligoPicker– based on gen-pept databasebased on gen-pept database– Tm’s of selected oligos approx. the Tm’s of selected oligos approx. the
samesame– improved specificityimproved specificity

Oligonucleotide Quality ControlOligonucleotide Quality Control
passpass
failfail
Use of mass spectral Use of mass spectral analysisanalysis
– Identifies relative Identifies relative abundanceabundance
– Ensures probe is of the Ensures probe is of the expected mass based expected mass based upon sequenceupon sequence
Capillary ElectrophoresisCapillary Electrophoresis– Identifies relative Identifies relative
abundance of full-abundance of full-length productlength product

Array Quality Control Array Quality Control
Spotted probes are 3’-Spotted probes are 3’-labeled with dCTP-Cy3 labeled with dCTP-Cy3 using terminal using terminal deoxynucleotidyl deoxynucleotidyl transferasetransferase
First and last array of First and last array of the print-run are QC’dthe print-run are QC’d

Understanding sources of variability Understanding sources of variability in microarray experimentsin microarray experiments
???? ??

Sources of VariationSources of Variation
Differences in identical treatmentsDifferences in identical treatments Intrinsic biological variationIntrinsic biological variation Technical variation in extraction and labeling Technical variation in extraction and labeling
of RNA samplesof RNA samples Technical variation in hybridizationTechnical variation in hybridization Spot size variationSpot size variation Measurement error in scanningMeasurement error in scanning

When graphing expression data, use logWhen graphing expression data, use log
0 5 10 15 20 -4 -2 0 2 40 5 10 15 20 -4 -2 0 2 4
ratio (T/C) logratio (T/C) log2 2 ratio (T/C) ratio (T/C)
loglog22 T T
log
log 22
C C
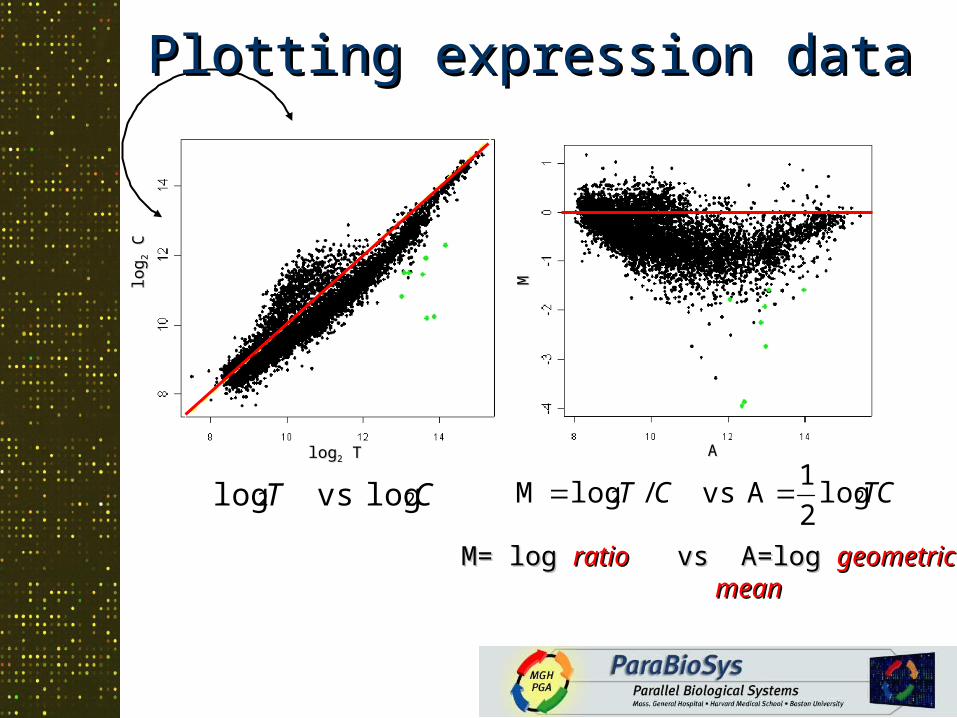
CT 22 log vslog
Plotting expression dataPlotting expression data
TCCT 22 log2
1A vs/logM
AA
MM
M= log M= log ratioratio vs A=log vs A=log geometric geometric meanmean

Expression data-Expression data-contcont
Low expressed Highly expressed
log 2
(Ti /
Ci)
Genes expressed Genes expressed up relative to up relative to reference by a reference by a factor of 32.factor of 32.
)(log2
12 iiCT
Genes expressed Genes expressed down relative to down relative to reference by a factor reference by a factor of 1/32.of 1/32.

Differences Due to TreatmentDifferences Due to Treatment RNA isolation protocol differencesRNA isolation protocol differences Cell-culture media changesCell-culture media changes Expression differences over timeExpression differences over time
– Cell cycle genes (synchronization)Cell cycle genes (synchronization)
Variables need to be minimized!Variables need to be minimized!

Biological VariabilityBiological Variability
Self-self hybridizations of four independent biological replicates Biological variability of inhibitory PAS domain protein

Technical VariabilityTechnical Variability
Sample 1Sample 1
Sa
mp
le 2
Sa
mp
le 2
Sample 1Sample 1
Sa
mp
le 3
Sa
mp
le 3
Self-self hybridization (Cerebellar vs cerebellar)Self-self hybridization (Cerebellar vs cerebellar)– Sample 1 and 2 labeled together and hybridized on separate Sample 1 and 2 labeled together and hybridized on separate
slidesslides– Sample 3 labeled separatelySample 3 labeled separately
Arises from differences in labeling, efficiency in RT, Arises from differences in labeling, efficiency in RT, hybridization, arrays, etc.hybridization, arrays, etc.
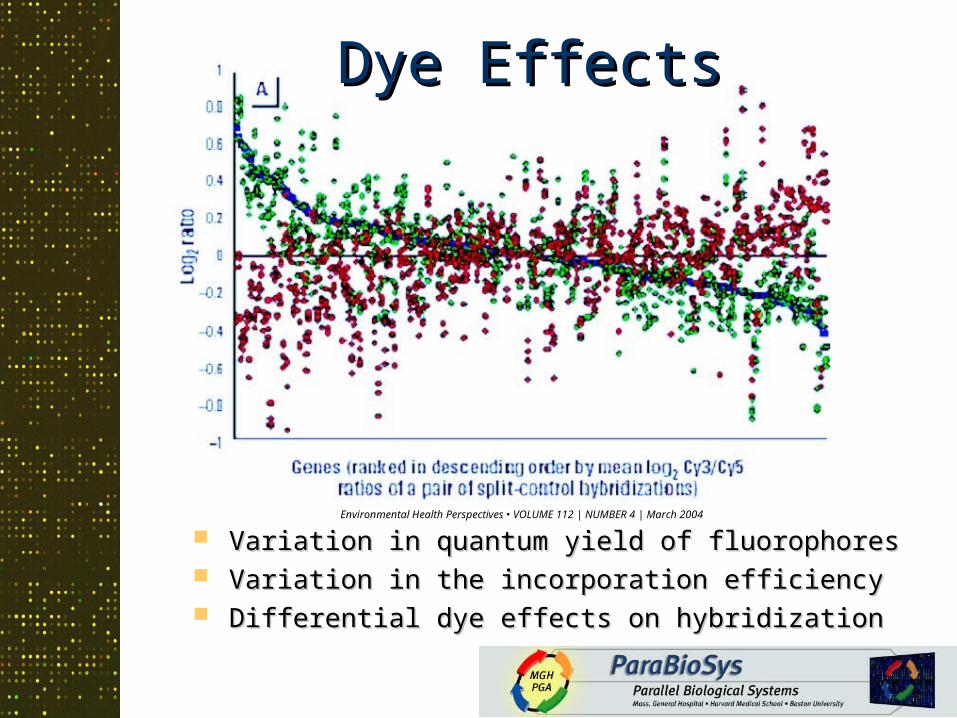
Dye EffectsDye Effects
Variation in quantum yield of fluorophoresVariation in quantum yield of fluorophores Variation in the incorporation efficiencyVariation in the incorporation efficiency Differential dye effects on hybridizationDifferential dye effects on hybridization
Environmental Health Perspectives • VOLUME 112 | NUMBER 4 | March 2004

Hybridization VariabilityHybridization Variability

Printing VariabilityPrinting Variability

Differences in Probe PerformanceDifferences in Probe Performance
Academic_1Academic_1Academic_2Academic_2ParaBioSysParaBioSysVendorVendor
Probe design algorithms will cause changes in the Probe design algorithms will cause changes in the expression patternexpression pattern
Once a platform is chosen all future comparisons should Once a platform is chosen all future comparisons should be performed on the same platformbe performed on the same platform
Cross-platform comparisons as a means of validationCross-platform comparisons as a means of validation

Differences Across Commercial Differences Across Commercial PlatformsPlatforms
P<0.001P<0.001
Nucleic Acids Research, 2003, Vol. 31, No. 19, 5676-5684Nucleic Acids Research, 2003, Vol. 31, No. 19, 5676-5684

Controlling VariabilityControlling Variability
Experimental Plan

Increased Quality ControlIncreased Quality Control
18S
28S
Fluo
resc
ence
Time (seconds)
0
1
2
3
4
5
6
19 24 29 34 39 44 49 54 59 64 69
18S
28S
Fluo
resc
ence
Time (seconds)
0.0
2.5
5.0
7.5
10.0
12.5
15.0
17.5
20.0
22.5
19 24 29 34 39 44 49 54 59 64 69
Probe QC Array QC Total RNA QC
– denaturing agarose gel – Agilent Bioanalyzer
Labeling QC

Controlling biological and technical variability with replicationControlling biological and technical variability with replication
Average across replicatesAverage across replicatesEssential to the estimation of varianceEssential to the estimation of variance
Critical for valid statistical analysisCritical for valid statistical analysis
Replicates = 5
-4
-3
-2
-1
0
1
2
3
4
1 2 3 4 5 6
A log10(sqrt(T*C))
M lo
g2(T
/C)
Replicates = 10
-4
-3
-2
-1
0
1
2
3
4
1 2 3 4 5 6 7
A log10(sqrt(T*C))
M l
og
2(T
/C)
Replicates = 2
-4
-3
-2
-1
0
1
2
3
4
5
1 2 3 4 5 6 7
A log10 (sqrt(T*C))
M l
og
2(T
/C)
Single array
-4
-3
-2
-1
0
1
2
3
4
5
1 2 3 4 5 6 7
A log10(sqrt(T*C))
M
lo
g2(T
/C)
Integrin alpha 2b Pro-platelet basic protein
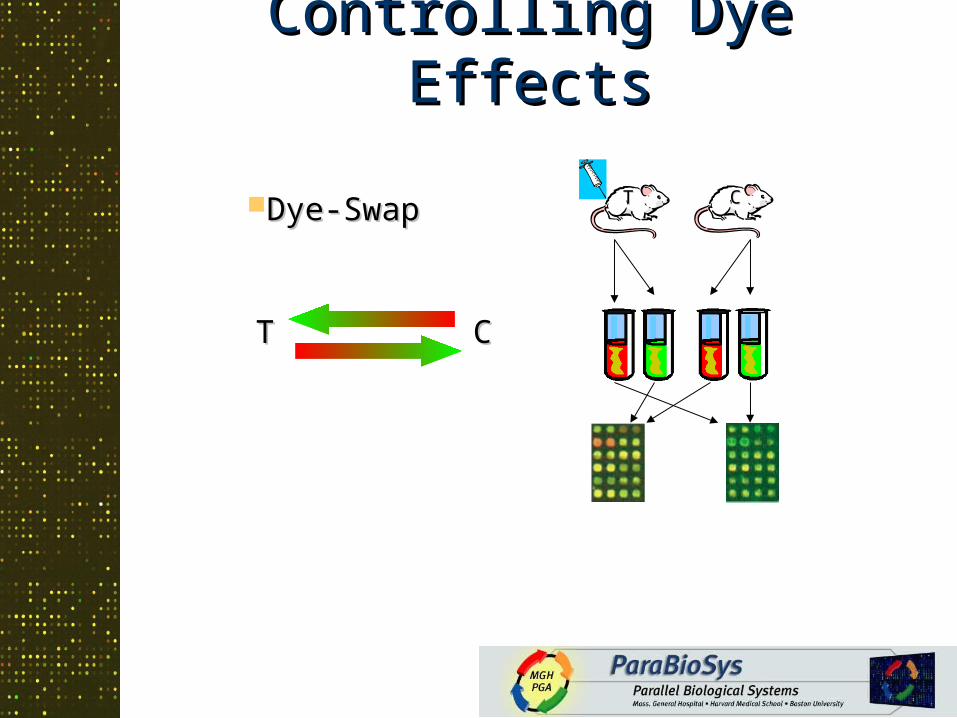
Controlling Dye EffectsControlling Dye Effects
Dye-SwapDye-Swap
TT CC
TT CC

Controlling Variability through Controlling Variability through Experimental DesignExperimental Design
ReplicationReplication– SpotSpot– Multiple arrays per sample comparison (technical)Multiple arrays per sample comparison (technical)
• DyeDye swapswap
– Multiple samples per treatment group (biological)Multiple samples per treatment group (biological)
Increased precision and quality controlIncreased precision and quality control Estimate measurement errorEstimate measurement error Estimate biological variationEstimate biological variation PoolingPooling
– Reduce biological variationReduce biological variation
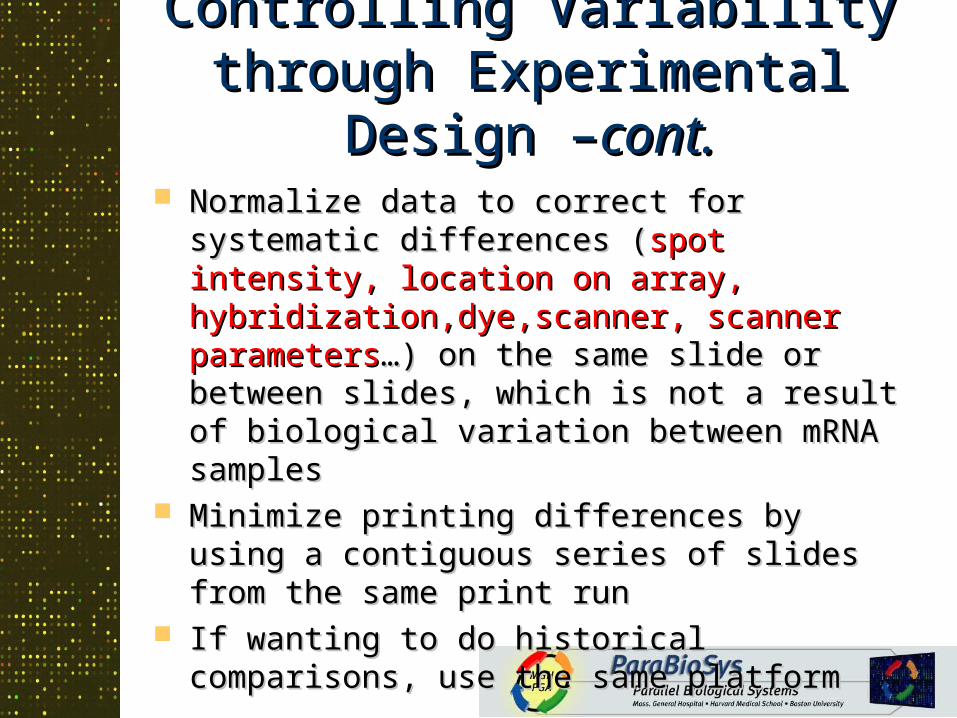
Controlling Variability through Controlling Variability through Experimental Design –Experimental Design –cont.cont.
Normalize data to correct for systematic Normalize data to correct for systematic differences (differences (spot intensity, location on array, spot intensity, location on array, hybridization,dye,scanner, scanner parametershybridization,dye,scanner, scanner parameters…) …) on the same slide or between slides, which is not a on the same slide or between slides, which is not a result of biological variation between mRNA result of biological variation between mRNA samples samples
Minimize printing differences by using a contiguous Minimize printing differences by using a contiguous series of slides from the same print runseries of slides from the same print run
If wanting to do historical comparisons, use the If wanting to do historical comparisons, use the same platformsame platform
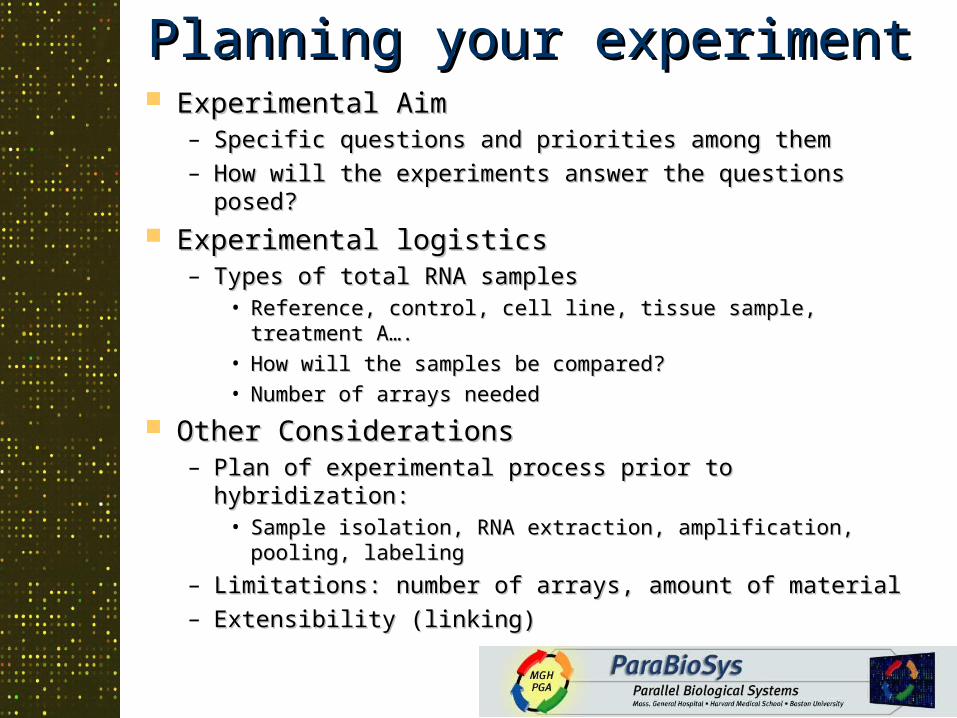
Planning your experimentPlanning your experiment Experimental AimExperimental Aim
– Specific questions and priorities among themSpecific questions and priorities among them– How will the experiments answer the questions posed?How will the experiments answer the questions posed?
Experimental logisticsExperimental logistics– Types of total RNA samplesTypes of total RNA samples
• Reference, control, cell line, tissue sample, treatment A….Reference, control, cell line, tissue sample, treatment A….
• How will the samples be compared?How will the samples be compared?
• Number of arrays neededNumber of arrays needed
Other ConsiderationsOther Considerations– Plan of experimental process prior to hybridization:Plan of experimental process prior to hybridization:
• Sample isolation, RNA extraction, amplification, pooling, Sample isolation, RNA extraction, amplification, pooling, labelinglabeling
– Limitations: number of arrays, amount of materialLimitations: number of arrays, amount of material– Extensibility (linking)Extensibility (linking)

Planning your Experiment- Planning your Experiment- contcont
Other Considerations-Other Considerations-contcont– Controls: positive, negative, in-spike controlsControls: positive, negative, in-spike controls– Methods of verification:Methods of verification:
• QRT-PCR, Northern, QRT-PCR, Northern, in situ hybridizationin situ hybridization,…,…
Performing the experimentPerforming the experiment – Reagents (arrays-from same print run), equipment Reagents (arrays-from same print run), equipment
(scanners), order of hybridizations(scanners), order of hybridizations

ControlsControls Positive ControlsPositive Controls
– used to ensure that target DNAs are labeled to an acceptable used to ensure that target DNAs are labeled to an acceptable specific activityspecific activity
– single pool of all probe elements on arraysingle pool of all probe elements on array Negative ControlsNegative Controls
– used to assess the degree of non-specific cross- hybridizationused to assess the degree of non-specific cross- hybridization– probes derived from organisms with no known homologs/paralogs probes derived from organisms with no known homologs/paralogs
to the organism of studyto the organism of study– derived derived in silicoin silico (alien sequences) (alien sequences)
In-spike controlsIn-spike controls– Known amounts of polyadenylated mRNAs added to each labeling Known amounts of polyadenylated mRNAs added to each labeling
reactionreaction– Should not cross-hybridize with with any probe sequencesShould not cross-hybridize with with any probe sequences
• Alien sequencesAlien sequences• Spot-report (Stratagene)Spot-report (Stratagene)• Lucidea ScoreCard (Amersham Biosciences)Lucidea ScoreCard (Amersham Biosciences)
– Can be used to assess dynamic range of the systemCan be used to assess dynamic range of the system

ValidationValidation
If you have failed to If you have failed to
validate your array data,validate your array data,
you have NOT completedyou have NOT completed
your analysisyour analysis
ParaBioSys has developedParaBioSys has developed
Primer BankPrimer Bank for QRT-PCR for QRT-PCR
primer sequencesprimer sequences
http://pga.mgh.harvard.edu/primerbank/http://pga.mgh.harvard.edu/primerbank/

Many thanks for your attentionMany thanks for your attention
Glenn ShortGlenn Short
Microarray CoreMicroarray Core
Massachusetts General HospitalMassachusetts General Hospital
https://dnacore.mgh.harvard.edu
http://pga.mgh.harvard.edu

![Microarray analysis of adipocytes treated with protease ...€¦ · Web view] and lipid metabolism [43] in non-ARV-treated adipocytes. This finding is supported by evidence from](https://img.pdfslide.net/doc/110x75/5e27dbd605c1826b8578f3b6/microarray-analysis-of-adipocytes-treated-with-protease-web-view-and-lipid.jpg)