Embed Size (px)
Citation preview

Fabiana Latorre 1,2 & Jordina Belmonte1
1. Botany Unit, Autonomous University of Barcelona, Spain.2. CONICET, Argentina.
Temporal and spatialdistribution of atmospheric
Poaceae pollenin Catalonia (Northeast Spain)

7th ICA, Montebello, 2002 Poaceae pollen in Catalonia 2
Catalonian grasses• 296 grass species are cited of Catalonia1.
• They have an ubiquitous presence in the territory.
• One unique species is flowering all the year round: Poaannua1.
• Grass pollen is one of the most important cause of rhinitisand/or seasonal asthma in Spain2.
• In the Barcelona area Poaceae is the second taxa withallergenic significance, showing a pathogenic effect on the35% of the patients3.
1. Flora PPCC, 1985.
2. Subiza et al., 1989.
3. Belmonte et al., 1995
1. Flora PPCC, 1985.
2. Subiza et al., 1989.
3. Belmonte et al., 1995

7th ICA, Montebello, 2002 Poaceae pollen in Catalonia 3
Objectives
• To compare Poaceae airborne pollen data of a 8 years-period at 6 localities in Catalonia.
• To evaluate possible differences in pollen concentrations.
• To determine if the differences found could be associatedto particularities in climate, biogeography or humanactivity.
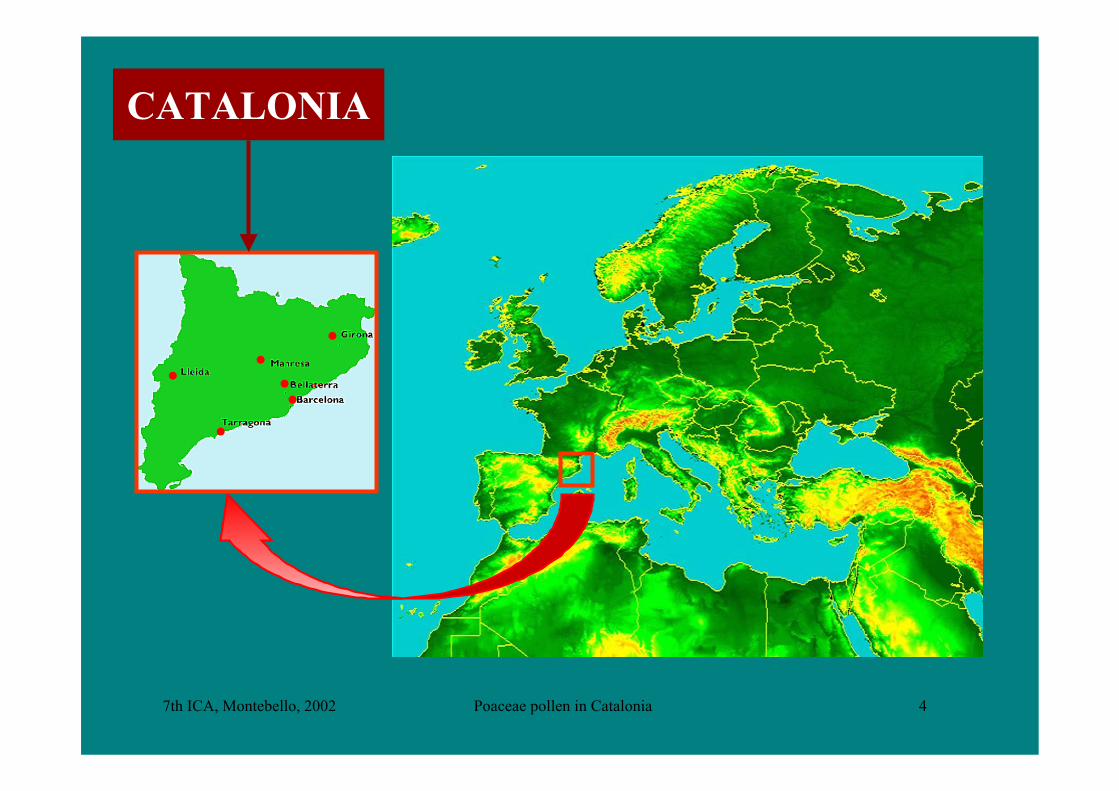
7th ICA, Montebello, 2002 Poaceae pollen in Catalonia 4
CATALONIA

7th ICA, Montebello, 2002 Poaceae pollen in Catalonia 5
Locality Altitudemasl
MeanAnnual
TemperatureºC
AnnualRainfall
mm
Phytoclimate(Allue, 1990)
Barcelona 12 16.4 683 Fresh - TethycSemiarid
Bellaterra 190 15.2 594 Fresh - ContinentalSemihumid
Girona 70 15.0 740 Fresh - ContinentalSemihumid
Lleida 221 15.1 385 Fresh - TransicionalSemiarid
Manresa 238 13.6 619 Fresh - ContinentalSemihumid
Tarragona 20 15.8 478 Fresh - TethycSemiarid
Geographical and Climatic characteristics

7th ICA, Montebello, 2002 Poaceae pollen in Catalonia 6
Material and methods• Study period: 1994-2001.• Hirst volumetric sampling traps.• Pollen counted following the Spanish Aerobiological Network
methodology (REA). 4
• Base pollen data expressed as mean daily pollen concentrationsmean daily pollen concentrations (p/m 3).• Other pollen parameters:
• mean weeklymean weekly pollen concentrations: average of the 7 mean daily pollenconcentration corresponding to a given week.
• annual indexannual index or annual totals: summation of the mean daily pollenconcentration corresponding to 1 year.
• Daily, weekly and annual means for the study periodmeans for the study period.
• Meteorological data was supplied by both the National Institute ofMeteorology and the Catalonian Meteorological Services.
• Basic statistics, Correlation and Regression Analysis.
4. Dominguez et al., 1991.4. Dominguez et al., 1991.

7th ICA, Montebello, 2002 Poaceae pollen in Catalonia 7
Minimum MaximumLocality
Annualindex
YearMean
Annualindex
Year
% of thetotal
pollen
% of thenon
arborealpollen
BCN 894 1994 1122 1311 2001 2.4 17.1
BTU 1193 1999 1644 1952 1996 4.7 24.4
GIC 1474 2001 2084 3000 1996 3.9 30.3
LLE 1394* 1997 2060 3391 1998 8.1 30.3
MAN 927 * 2000 1540 2594 1997 4.7 21.1
TAU 649 2000 1134 1673 1996 4.0 16.1
Absolute and relative annual indexMinimum Maximum
Locality
Annualindex
YearMean
Annualindex
Year
% of thetotal
pollen
% of thenon
arborealpollen
BCN 894 1994 1122 1311 2001 2.4 17.1
BTU 1193 1999 1644 1952 1996 4.7 24.4
GIC 1474 2001 2084 3000 1996 3.9 30.3
LLE 1394* 1997 2060 3391 1998 8.1 30.3
MAN 927 * 2000 1540 2594 1997 4.7 21.1
TAU 649 2000 1134 1673 1996 4.0 16.1
Minimum MaximumLocality
Annualindex
YearMean
Annualindex
Year
% of thetotal
pollen
% of thenon
arborealpollen
BCN 894 1994 1122 1311 2001 2.4 17.1
BTU 1193 1999 1644 1952 1996 4.7 24.4
GIC 1474 2001 2084 3000 1996 3.9 30.3
LLE 1394* 1997 2060 3391 1998 8.1 30.3
MAN 927 * 2000 1540 2594 1997 4.7 21.1
TAU 649 2000 1134 1673 1996 4.0 16.1
* within the mediumrange (mean ± 1 st dv).* within the medium
range (mean ± 1 st dv).

7th ICA, Montebello, 2002 Poaceae pollen in Catalonia 8
Annual index
±Std. Dev.±Std. Err.Mean
polle
n gr
ains
600
1000
1400
1800
2200
2600
3000
3400
BCN BTU GIC LLE MAN TAU
7th ICA, Montebello, 2002 Poaceae pollen in Catalonia 9
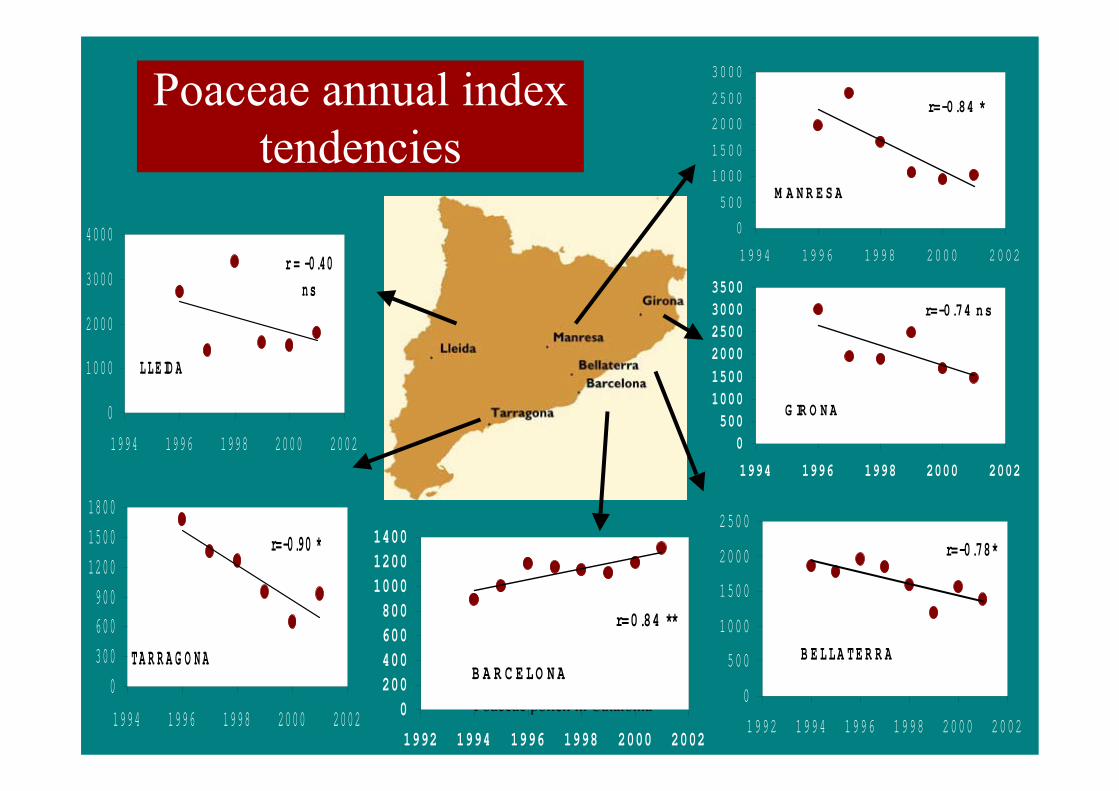
Poaceae annual indextendencies
B A R C E LO N A
0200400600800
100012001400
1992 1994 1996 1998 2000 2002
r=0.84 **
B E L LA T E R R A
0
5 00
1 00 0
1 50 0
2 00 0
2 50 0
1 99 2 1 99 4 1 99 6 1 99 8 2 00 0 2 00 2
r=-0.78*
G IR O N A
0500
100015002000250030003500
1994 1996 1998 2000 2002
r=-0.74 ns
LLE ID A
r = -0.40ns
0
1000
2000
3000
4000
1994 1996 1998 2000 2002
M A N R E S A
0
500
1000
1500
2000
2500
3000
1994 1996 1998 2000 2002
r=-0.84 *
TA R R A G O N A0
300
600
900
1200
1500
1800
1994 1996 1998 2000 2002
r=-0.90 *

7th ICA, Montebello, 2002 Poaceae pollen in Catalonia 10
General pattern of annual index(for each year, mean annual pollen index of all localities)
r = - 0.92 * *po
llen
grai
ns
1100
1300
1500
1700
1900
2100
2300
1995 1996 1997 1998 1999 2000 2001 2002
Regression95% confid.
r = -0.455 * * n = 36r = -0.455 * * n = 36
7th ICA, Montebello, 2002 Poaceae pollen in Catalonia 11
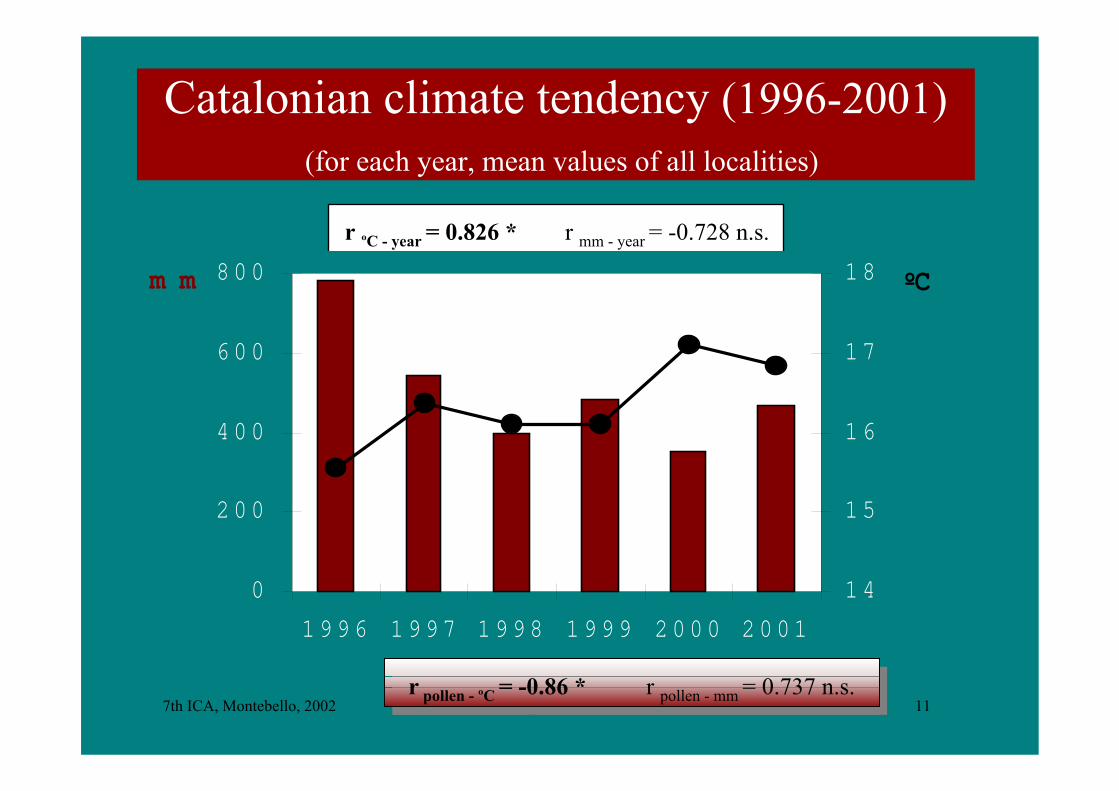
Catalonian climate tendency (1996-2001) (for each year, mean values of all localities)
r ºC - year = 0.826 * r mm - year = -0.728 n.s.
0
2 0 0
4 0 0
6 0 0
8 0 0
1 9 9 6 1 9 9 7 1 9 9 8 1 9 9 9 2 0 0 0 2 0 0 1
m m
1 4
1 5
1 6
1 7
1 8 ºC
r pollen - ºC = -0.86 * r pollen - mm = 0.737 n.s.r pollen - ºC = -0.86 * r pollen - mm = 0.737 n.s.
7th ICA, Montebello, 2002 Poaceae pollen in Catalonia 12
B A R C E L O N A (94-01)
0
20
40
60
1-
gen
1-feb
1-
març
1-abr
1-
maig
1-
juny
1-jul
1-ag
1-set
1-oct
1-
nov
1-
des
B E L L A T E R R A (94-01)
0
20
40
60
1-gen
1-feb
1-m
arç
1-abr
1-m
aig
1-juny
1-jul
1-ag
1-set
1-oct
1-nov
1-des
�����������������������������������������������������������������������������������������������������������������������������������������������������������������������������������������������������������������������������������������������������������������������������������������������
�����������������������������������������������������������������������������������������������������������������������������������������������������������������������������������������������������������������������������������������������������������������������������������������������
�����������������������������������������������������������������������������������������������������������������������������������������������������������������������������������������������������������������������������������������������������������������������������������������������
�����������������������������������������������������������������������������������������������������������������������������������������������������������������������������������������������������������������������������������������������������������������������������������������������
�����������������������������������������������������������������������������������������������������������������������������������������������������������������������������������������������������������������������������������������������������������������������������������������������
G IR O N A (96-01)
0
20
40
60
1-
1-
1-
1-
1-
1-
1-
1-
1-
1-
1-
1-
L L E ID A (96-01)
0
20
40
60
1-
1-
1-
1-
1-
1-
1-
1-
1-
1-
1-
1-
M A N R E S A (96-01)
0
20
40
60
1-
1-
1-
1-
1-
1-
1-
1-
1-
1-
1-
1-
TA R R A G O N A (96-01)
0
20
40
60
g f m a m j j a s o n d
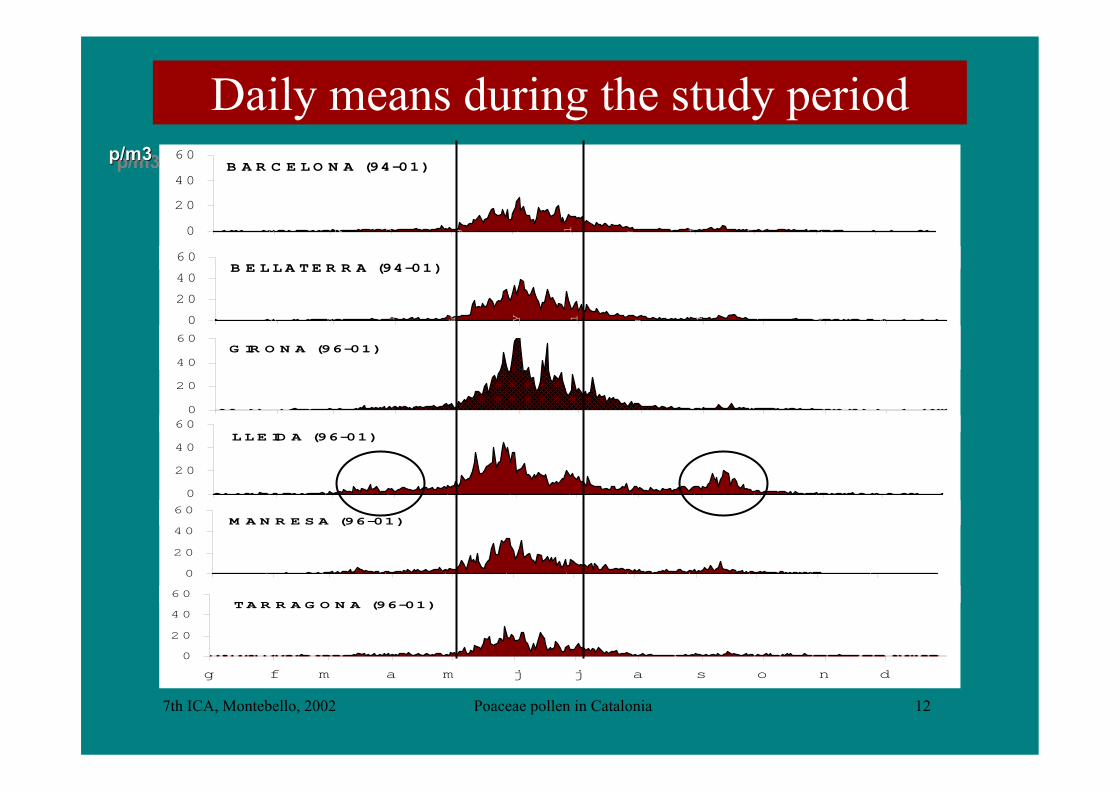
p/m3p/m3p/m3
Daily means during the study period

7th ICA, Montebello, 2002 Poaceae pollen in Catalonia 13
B C N 1994 1995 1996 1997 1998 1999 2000 2001
daily m axim um 50,4 61,6 55,3 32,9 34,3 49,7 53,2 83,3
daily m ean 2,9 2,7 3,3 3,3 3,1 3,1 3,3 3,6
st dv 5,7 5,5 6,4 5,5 5,6 6,4 7,4 7,8
cv 2,0 2,0 2,0 1,7 1,8 2,1 2,2 2,2
rainfall m m 1,3 0,8 2,3 1,3 1,0 1,0 1,0 1,1
T ºC 16,4 15,8 15,7 17,1 16,9 16,8 17,4 17,9
B T U 1994 1995 1996 1997 1998 1999 2000 2001
daily m axim um 91,7 93,1 84,0 90,3 46,9 68,6 81,2 53,9
daily m ean 5,2 5,1 5,7 5,1 4,4 3,4 4,4 3,8
st dv 10,7 9,4 11,6 9,6 7,4 7,0 10,2 7,9
cv 1,6 2,0 1,9 2,0 1,9 1,7 2,1 2,3
rainfall m m 1,2 1,2 2,8 1,6 1,2 1,2 0,9 1,2
T ºC 17,0 16,6 16,4 16,8 17,0 16,8 16,8 17,2
G IC 1994 1995 1996 1997 1998 1999 2000 2001
daily m axim um 75,6 49,0 119,0 76,3 123,9 123,9
daily m ean 5,8 6,0 7,1 5,1 4,5 4,4
st dv 9,7 10,6 15,6 11,6 13,3 13,3
cv 1,7 1,8 2,2 2,3 3,0 3,0
rainfall m m 2,4 1,5 1,6 2,0 1,5 1,7
T ºC 15,4 16,1 15,6 15,8 15,9 16,5
L L E 1994 1995 1996 1997 1998 1999 2000 2001
daily m axim um 34,3 93,1 40,6 47,6 64,4 64,4
daily m ean 4,1 9,5 4,4 4,3 5,1 5,0
st dv 6,0 15,3 6,7 6,7 9,7 9,7
cv 1,5 1,6 1,5 1,6 1,9 1,9
rainfall m m 1,3 1,4 0,6 1,0 1,1 1,0
T ºC 15,0 15,6 15,1 15,2 15,5 16,6
M A N 1994 1995 1996 1997 1998 1999 2000 2001
daily m axim um 76,3 58,1 34,3 35,7 32,9 32,9
daily m ean 7,4 4,6 3,0 2,6 2,8 2,8
st dv 11,9 8,5 5,2 5,1 4,8 4,8
cv 1,6 1,8 1,7 2,0 1,7 1,7
rainfall m m 2,6 1,9 1,1 1,5 1,6 1,2
T ºC 14,4 15,3 14,6 14,6 14,8 15,0
T A U 1994 1995 1996 1997 1998 1999 2000 2001
daily m axim um 45,5 46,2 39,9 28,7 44,1 44,1
daily m ean 3,8 3,5 2,6 1,8 2,6 2,6
st dv 6,2 6,1 5,5 4,0 6,0 5,9
cv 1,6 1,7 2,1 2,2 2,3 2,3
rainfall m m 1,4 1,3 1,1 1,2 1,0 1,5
T ºC 16,4 17,2 17,4 17,4 17,6 17,7
Pollen and meteorological daily mean dataB C N 1994 1995 1996 1997 1998 1999 2000 2001
daily m axim um 50,4 61,6 55,3 32,9 34,3 49,7 53,2 83,3
daily m ean 2,9 2,7 3,3 3,3 3,1 3,1 3,3 3,6
st dv 5,7 5,5 6,4 5,5 5,6 6,4 7,4 7,8
cv 2,0 2,0 2,0 1,7 1,8 2,1 2,2 2,2
rainfall m m 1,3 0,8 2,3 1,3 1,0 1,0 1,0 1,1
T ºC 16,4 15,8 15,7 17,1 16,9 16,8 17,4 17,9
B T U 1994 1995 1996 1997 1998 1999 2000 2001
daily m axim um 91,7 93,1 84,0 90,3 46,9 68,6 81,2 53,9
daily m ean 5,2 5,1 5,7 5,1 4,4 3,4 4,4 3,8
st dv 10,7 9,4 11,6 9,6 7,4 7,0 10,2 7,9
cv 1,6 2,0 1,9 2,0 1,9 1,7 2,1 2,3
rainfall m m 1,2 1,2 2,8 1,6 1,2 1,2 0,9 1,2
T ºC 17,0 16,6 16,4 16,8 17,0 16,8 16,8 17,2
G IC 1994 1995 1996 1997 1998 1999 2000 2001
daily m axim um 75,6 49,0 119,0 76,3 123,9 123,9
daily m ean 5,8 6,0 7,1 5,1 4,5 4,4
st dv 9,7 10,6 15,6 11,6 13,3 13,3
cv 1,7 1,8 2,2 2,3 3,0 3,0
rainfall m m 2,4 1,5 1,6 2,0 1,5 1,7
T ºC 15,4 16,1 15,6 15,8 15,9 16,5
L L E 1994 1995 1996 1997 1998 1999 2000 2001
daily m axim um 34,3 93,1 40,6 47,6 64,4 64,4
daily m ean 4,1 9,5 4,4 4,3 5,1 5,0
st dv 6,0 15,3 6,7 6,7 9,7 9,7
cv 1,5 1,6 1,5 1,6 1,9 1,9
rainfall m m 1,3 1,4 0,6 1,0 1,1 1,0
T ºC 15,0 15,6 15,1 15,2 15,5 16,6
M A N 1994 1995 1996 1997 1998 1999 2000 2001
daily m axim um 76,3 58,1 34,3 35,7 32,9 32,9
daily m ean 7,4 4,6 3,0 2,6 2,8 2,8
st dv 11,9 8,5 5,2 5,1 4,8 4,8
cv 1,6 1,8 1,7 2,0 1,7 1,7
rainfall m m 2,6 1,9 1,1 1,5 1,6 1,2
T ºC 14,4 15,3 14,6 14,6 14,8 15,0
T A U 1994 1995 1996 1997 1998 1999 2000 2001
daily m axim um 45,5 46,2 39,9 28,7 44,1 44,1
daily m ean 3,8 3,5 2,6 1,8 2,6 2,6
st dv 6,2 6,1 5,5 4,0 6,0 5,9
cv 1,6 1,7 2,1 2,2 2,3 2,3
rainfall m m 1,4 1,3 1,1 1,2 1,0 1,5
T ºC 16,4 17,2 17,4 17,4 17,6 17,7

7th ICA, Montebello, 2002 Poaceae pollen in Catalonia 14
ALLERGENICITY SCALE 5(weekly mean pollen data)
1994 x x x x1995 B A R C E L O N A199619971998199920002001
1 2 3 4 5 6 7 8 9 10 11 12 13 14 15 16 17 18 19 20 21 22 23 24 25 26 27 28 29 30 31 32 33 34 35 36 37 38 39 40 41 42 43 44 45 46 47 48 49 50 51 52 5319941995 B E L L A T E R R A1996 x1997 x1998199920002001
1 2 3 4 5 6 7 8 9 10 11 12 13 14 15 16 17 18 19 20 21 22 23 24 25 26 27 28 29 30 31 32 33 34 35 36 37 38 39 40 41 42 43 44 45 46 47 48 49 50 51 52 531996 x x x x x x x1997 G IR O N A x x1998 x x x1999 x x2000 x x x x x2001 x x x
1 2 3 4 5 6 7 8 9 10 11 12 13 14 15 16 17 18 19 20 21 22 23 24 25 26 27 28 29 30 31 32 33 34 35 36 37 38 39 40 41 42 43 44 45 46 47 48 49 50 51 52 531996 x x x x1997 L L E ID A x x19981999 x2000 x x2001 x
1 2 3 4 5 6 7 8 9 10 11 12 13 14 15 16 17 18 19 20 21 22 23 24 25 26 27 28 29 30 31 32 33 34 35 36 37 38 39 40 41 42 43 44 45 46 47 48 49 50 51 52 531996 x x x x x x1997 M A N R E SA x19981999 x x2000 x2001 x
1 2 3 4 5 6 7 8 9 10 11 12 13 14 15 16 17 18 19 20 21 22 23 24 25 26 27 28 29 30 31 32 33 34 35 36 37 38 39 40 41 42 43 44 45 46 47 48 49 50 51 52 531996 x x x x x1997 T A R R A G O N A19981999 x2000 x2001 x
1 2 3 4 5 6 7 8 9 10 11 12 13 14 15 16 17 18 19 20 21 22 23 24 25 26 27 28 29 30 31 32 33 34 35 36 37 38 39 40 41 42 43 44 45 46 47 48 49 50 51 52 53J F M A M J J A S O N D
x no data0 null 01 low 0-4.92 m edium 5-19.93 high 20-29.94 very high > 30
5. Belmonte et al., 20005. Belmonte et al., 2000

7th ICA, Montebello, 2002 Poaceae pollen in Catalonia 15
Mean weekly temperaturesMean weekly temperatures corresponding to theyearly maximum weekly pollen concentrationmaximum weekly pollen concentration
0 null 01 low 0-4.92 m edium 5-19.93 high 20-29.94 very high > 30
B arcelona
18
20
22
24
26
1994 1995 1996 1997 1998 1999 2000 2001
B ellaterra
18
20
22
24
26
1994 1995 1996 1997 1998 1999 2000 2001
G irona
18
20
22
24
26
1996 1997 1998 1999 2000 2001
Lleida
18
20
22
24
26
1996 1997 1998 1999 2000 2001
M anresa
18
20
22
24
26
1996 1997 1998 1999 2000 2001
T arragona
18
20
22
24
26
1996 1997 1998 1999 2000 2001
ºC
5. Belmonte et al., 2000.
5

7th ICA, Montebello, 2002 Poaceae pollen in Catalonia 16
ConclusionsSpatialSpatial and TemporalTemporal distribution of Poaceae pollen
Decreasing annual indexranking
Girona Lleida Bellaterra Manresa Tarragona Barcelona
Diversity of species butsimilar behaviours
n= 40
0
10
20
30
40
Jan M ar M ay Jul S ep N ov
%Pollen all the year round
Highest interannual variability in Lleida
Annual index decreasing tendency duringthe study period except in Barcelona

7th ICA, Montebello, 2002 Poaceae pollen in Catalonia 17
Further researches
• To cross meteorological data and formalisegrasses pollen dynamics.
• To cross clinical data and improve theallergenicity scale.
• To compare Poaceae pollen dynamics amongCatalonia (Spain) and Buenos Aires Province(Argentina).

7th ICA, Montebello, 2002 Poaceae pollen in Catalonia 18
Acknowledgements
Slide analysis:JordinaJordina Belmonte BelmonteMarta CañoElenaElena Gabarra GabarraAnna GuàrdiaDavidDavid Navarro NavarroRutRut Puigdemunt PuigdemuntJoan M. RoureSbai LarbiMercè Vendrell
Economical support:LaboratoriosLaboratorios CBF-LETI, S.A. CBF-LETI, S.A.
Consejo Nacional Consejo Nacional de de Investigaciones Científicas Investigaciones Científicas y y TecnológicasTecnológicas, Argentina, Argentina
Technical support:Susanna BenítezMartaMarta Sardà SardàSilvia Silvia RenomRenom
Medical collaboration:Dr. Jaume BoteyDr.Dr. Àlvar Cadahía Àlvar CadahíaDr.Dr. José José--Luís EseverriLuís EseverriSocietat Catalana d’AlSocietat Catalana d’Al·· lergologialergologia i i Immunologia ClínicaImmunologia Clínica