Embed Size (px)
Citation preview
Polar and brown bear genomes reveal ancientadmixture and demographic footprints of pastclimate changeWebb Millera,1, Stephan C. Schustera,b,1, Andreanna J. Welchc, Aakrosh Ratana, Oscar C. Bedoya-Reinaa,Fangqing Zhaob,d, Hie Lim Kima, Richard C. Burhansa, Daniela I. Drautzb, Nicola E. Wittekindtb, Lynn P. Tomshoa,Enrique Ibarra-Laclettee, Luis Herrera-Estrellae,2, Elizabeth Peacockf, Sean Farleyg, George K. Sagef, Karyn Rodeh,Martyn Obbardi, Rafael Montiele, Lutz Bachmannj, Ólafur Ingólfssonk,l, Jon Aarsm, Thomas Mailundn, Øystein Wiigj,Sandra L. Talbotf, and Charlotte Lindqvistc,1,2
aCenter for Comparative Genomics and Bioinformatics, Pennsylvania State University, University Park, PA 16802; bSingapore Centre on Environmental LifeSciences Engineering, Nanyang Technological University, Singapore 637551; cDepartment of Biological Sciences, University at Buffalo, Buffalo, NY 14260;dComputational Genomics Laboratory, Beijing Institutes of Life Science, Chinese Academy of Sciences, Beijing 100101, China; eLaboratorio Nacional deGenómica para la Biodiversidad, Centro de Investigación y de Estudios Avanzados del Instituto Politécnico Nacional, Irapuato, 36821, Mexico; fUS GeologicalSurvey, Alaska Science Center, Anchorage, AK 99508; gAlaska Department of Fish and Game, Anchorage, AK 99518; hUS Fish and Wildlife Service, Anchorage,AK 99503; iOntario Ministry of Natural Resources, Peterborough, ON, Canada K9J 8M5; jNational Centre for Biosystematics, Natural History Museum,University of Oslo, 0318 Oslo, Norway; kDepartment of Earth Sciences, University of Iceland, 101 Reykjavik, Iceland; lUniversity Centre in Svalbard, 9171Longyearbyen, Norway; mFram Centre, Norwegian Polar Institute, 9296 Tromsø, Norway; and nBioinformatics Research Centre, Aarhus University, 8000Aarhus, Denmark
Contributed by Luis Herrera-Estrella, June 25, 2012 (sent for review May 29, 2012)
Polar bears (PBs) are superbly adapted to the extreme Arcticenvironment and have become emblematic of the threat tobiodiversity from global climate change. Their divergence fromthe lower-latitude brown bear provides a textbook example ofrapid evolution of distinct phenotypes. However, limited mito-chondrial and nuclear DNA evidence conflicts in the timing of PBorigin as well as placement of the species within versus sister tothe brown bear lineage. We gathered extensive genomic sequencedata from contemporary polar, brown, and American black bearsamples, in addition to a 130,000- to 110,000-y old PB, to examinethis problem from a genome-wide perspective. Nuclear DNAmarkers reflect a species tree consistent with expectation, show-ing polar and brown bears to be sister species. However, for theenigmatic brown bears native to Alaska’s Alexander Archipelago,we estimate that not only their mitochondrial genome, but also 5–10% of their nuclear genome, is most closely related to PBs, in-dicating ancient admixture between the two species. Explicit ad-mixture analyses are consistent with ancient splits among PBs,brown bears and black bears that were later followed by occa-sional admixture. We also provide paleodemographic estimatesthat suggest bear evolution has tracked key climate events, andthat PB in particular experienced a prolonged and dramatic declinein its effective population size during the last ca. 500,000 years.We demonstrate that brown bears and PBs have had sufficientlyindependent evolutionary histories over the last 4–5 million yearsto leave imprints in the PB nuclear genome that likely are associ-ated with ecological adaptation to the Arctic environment.
demographic history | hybridization | mammalian genomics | phylogenetics
Genome-scale studies of speciation and admixture have becomeessential tools in evolutionary analyses of recently diverged
lineages. For example, paradigm-shifting genomic research on ar-chaic and anatomically modern humans has identified critical geneflow events during hominin history (1, 2). However, aside fromseveral analyses of domesticated species and their wild relatives (e.g.,ref. 3), studies that use whole-genome sequencing to investigateadmixture in wildlife populations are only now beginning to emerge.The bear family (Ursidae, Mammalia) represents an excellent,
largely untapped model for investigating complex speciation andrapid evolution of distinct phenotypes. Although polar bears (PBs;Ursus maritimus) and brown bears (Ursus arctos) are consideredseparate species, analyses of fossil evidence and mitochondrialsequence data have indicated a recent divergence of PBs from
within brown bears (surveyed in ref. 4). For example, phylogeneticanalyses of complete mitochondrial genomes, including from aunique 130,000- to 110,000-y-old PB jawbone from Svalbard,Norway, confirmed a particularly close relationship between PBand a genetically isolated population of brown bears from theAdmiralty, Baranof, and Chichagof islands in Alaska’s AlexanderArchipelago (hereafter referred to as ABC brown bears) and sug-gested a split of their maternal lineages ∼150 kya (4). This recentdivergence and paraphyletic relationship raises questions whetherthere has been sufficient time for full reproductive isolation todevelop (5). Despite being fully distinct species throughout mostof their ranges (6), interbreeding between polar and brown bearshas occurred in captivity (7), and although extremely rare, naturalhybrids have recently been documented. Indeed, limited evidencefrom short stretches of mitochondrial DNA suggests that hybrid-ization may have occurred between polar and brown bears shortlyafter they diverged from one another (8). However, furtherevidence from biparentally inherited nuclear DNA is required tocritically evaluate this possibility, and in particular to determinewhat fraction of the extant bear genome has been sculpted bygene flow between brown bears and PBs. Although nuclearDNA sequence data recently indicated that the PB may havebecome genetically distinct from brown bears approximately600 kya (9), a gene-by-gene sequencing approach of single nuclearmarkers clearly lacks sufficient power to detect potential ancientadmixture.
Author contributions: W.M., S.C.S., L.H.-E., and C.L. designed research; W.M., S.C.S.,A.J.W., D.I.D., N.E.W., L.P.T., E.I.-L., L.H.-E., G.K.S., L.B., S.L.T., and C.L. performed research;E.P., S.F., G.K.S., K.R., M.O., R.M., L.B., O.I., J.A., Ø.W., and S.L.T. contributed new reagents/analytic tools; W.M., S.C.S., A.J.W., A.R., O.C.B.-R., F.Z., H.L.K., R.C.B., E.I.-L., L.H.-E., T.M.,and C.L. analyzed data; and W.M., S.C.S., A.J.W., L.H.-E., and C.L. wrote the paper.
The authors declare no conflict of interest.
Freely available online through the PNAS open access option.
Data deposition: The sequence reported in this paper has been deposited in the GenBankdatabase (accession nos. JX196366-JX196392 and SRA054912).1W.M., S.C.S., and C.L. contributed equally to this work.2To whom correspondence may be addressed. E-mail: [email protected] [email protected].
See Author Summary on page 14295 (volume 109, number 36).
This article contains supporting information online at www.pnas.org/lookup/suppl/doi:10.1073/pnas.1210506109/-/DCSupplemental.
E2382–E2390 | PNAS | Published online July 23, 2012 www.pnas.org/cgi/doi/10.1073/pnas.1210506109
Although field and molecular studies have produced criticalinformation about the ecology and evolutionary relationships ofthe PB, advances in next-generation sequencing technology haveonly recently made full-genome studies of such wildlife speciespossible (10, 11). A whole-genome analysis of the PB may pro-vide a more complete picture of its evolutionary history, possiblesignatures of admixture, and clues about the genetic basis ofadaptive phenotypic features facilitating life in the Arctic, all ofwhich are imperative for gaining a better understanding of pos-sible responses to current and future climatic changes.We gathered extensive genome sequence data from modern
polar, brown, and American black bear samples, plus a ∼120,000-y-old PB, to address the following questions. (i) What is the moreprecise association between the PB and its sister species, the brownbear; and do we find any signatures of past genetic interchangebetween the two species? (ii) Did the PB indeed evolve recently, assuggested bymitochondrial DNA and fossil evidence, or did it havean older origin, as demonstrated by nuclear DNA loci? (iii) Can wededuce any past responses in ancient bear population histories thatmay be connected with climatic changes? Our comparative genomicanalyses have facilitated investigation of the timing of divergenceand hybridization in brown and PB lineages through the last 4 to 5million years of climatic variation, and provide a window intogenetic underpinnings of adaptive features, making it possible tobegin to investigate the unique characteristics of the PB and howthese may reflect its excellent adaptation to the extreme Arcticenvironment.
Results and DiscussionGenome-Scale Sequencing of Three Bear Species. We performeddeep genome sequencing (SI Appendix) for a PB (referred to as“PB7”), twoABC brown bears (“ABC1” and “ABC2”), a non-ABCbrown bear (“GRZ”), and an American black bear (Ursus ameri-canus, hereafter referred to as black bear). We generated from 25-fold to 100-fold coverage for each of these individuals, with deepestcoverage for the PB (SI Appendix, Table S1). We assembled the3.15 billion reads for PB7 using SOAPdenovo (12). Mate-pairinformation produced 1,229,681 scaffolds and contigs, with anN50 length of 61 kb and span of 2.53 billion bases (Gb), which isclose to the estimated genome size of the giant panda (2.4 Gb)(13). Low-coverage genome sequence data, between threefoldand 10-fold each, were produced for an additional 22 PBs (SIAppendix, Table S1). As a means of validating our PB assemblyand making nuclear genomic sequences more useful, we also se-quenced transcriptomes of individual polar and brown bears (SIAppendix, Table S2).We aligned the reads from all 27 individuals to our PB assembly
and searched for genomic positions where two different nucleo-tides could be confidently identified (SI Appendix). We term suchpositions SNPs, even though the different nucleotides can be fromdifferent species, e.g., a nucleotide fixed in PBs but differing fromthe orthologous black bear nucleotide. This procedure yielded13,038,705 SNPs, of which 2,540,010 are polymorphic in PB. Weproduced a second set of SNPs by aligning the reads from allsamples to the dog genome (Canis familiaris assembly version 2.0)and applying the same SNP-calling procedure. That approachproduced 12,023,192 SNPs, of which 1,914,757 are polymorphicamong PBs. This latter set contains a slightly smaller number ofSNP calls (compared with using the PB assembly), which could bea result of genomic regions deleted in the dog lineage since thesplit between dog and bear. SNPs based on the dog genome,however, benefit from excellent gene annotations, which make itsimple to identify synonymous and nonsynonymous coding SNPswith good reliability, and allow SNPs to be mapped to the corre-sponding locations on dog chromosomes. Having two sets of SNPsproduced by different but complementary approaches helped us toevaluate the robustness of the observations made below. Amongour discovered SNPs, 26,001 result in amino acid replacements
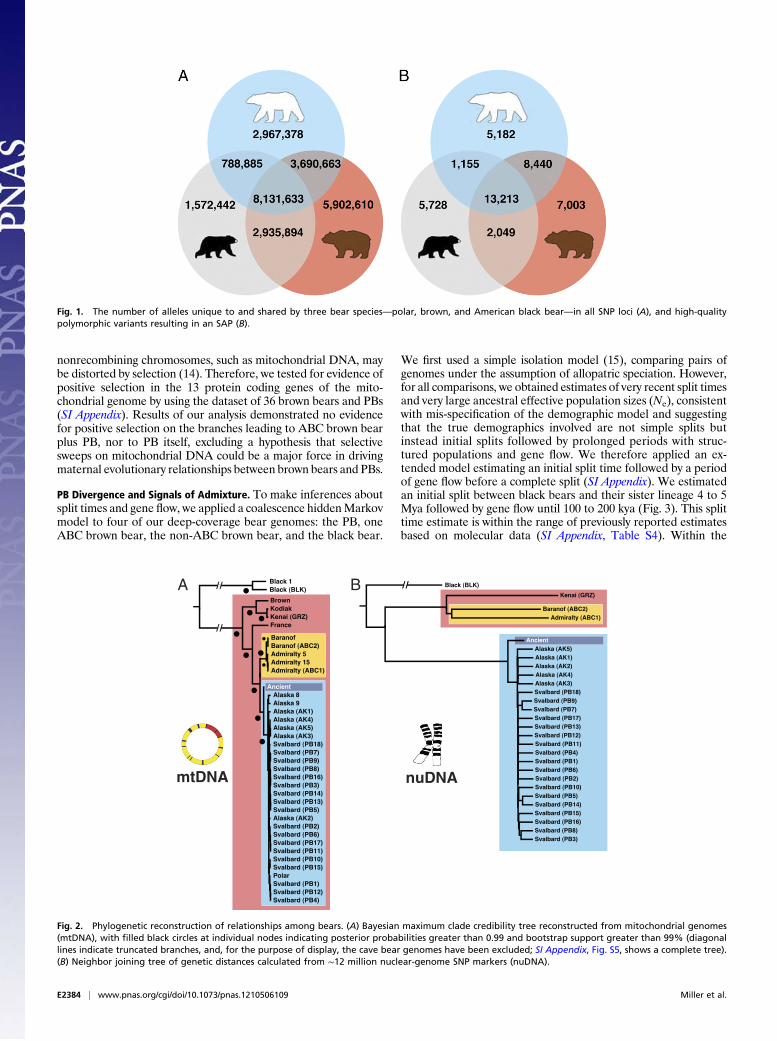
[single amino acid polymorphisms (SAPs)] as traced to codingregions of putatively orthologous genes known from the dog ge-nome (canFam2). Of these SAPs, 7,014 were found to be possiblyor probably “damaging” by computational predictions, i.e., osten-sibly causing protein functional changes (SIAppendix). The numberof alleles in all polymorphic SNP loci and number of high-qualitypolymorphic SAP alleles shared among the three bear species(Fig. 1) demonstrate a significant number of fixed alleles withineach species, as well as a higher number of shared alleles betweenpolar and brown bear, and brown and black bear, than betweenpolar and black bear. The relatively lower overall number of allelesin the black bear may, however, derive from the lower sequencecoverage compared with the other two deeply sequenced species(SI Appendix, Table S1).We also produced 164 Gb of nonamplified shotgun sequence
data for a 130,000- to 110,000-y-old PB specimen from Svalbard,Norway (SI Appendix, Table S1). The sequence reads from thisancient bear were aligned to our PB genome assembly, and, for3,293,332 SNPs, we could confidently determine at least oneallele in the ancient sample. We observed 16,338 alleles in theancient PB sample that were similar to alleles in the three brownbears but not to modern PB alleles. With the SNPs based on thedog assembly, we determined one or both alleles for 2,837,892SNPs in the ancient sample, and found 15,527 ancient PB allelesthat were identical to alleles in brown bears but not modern PBs.
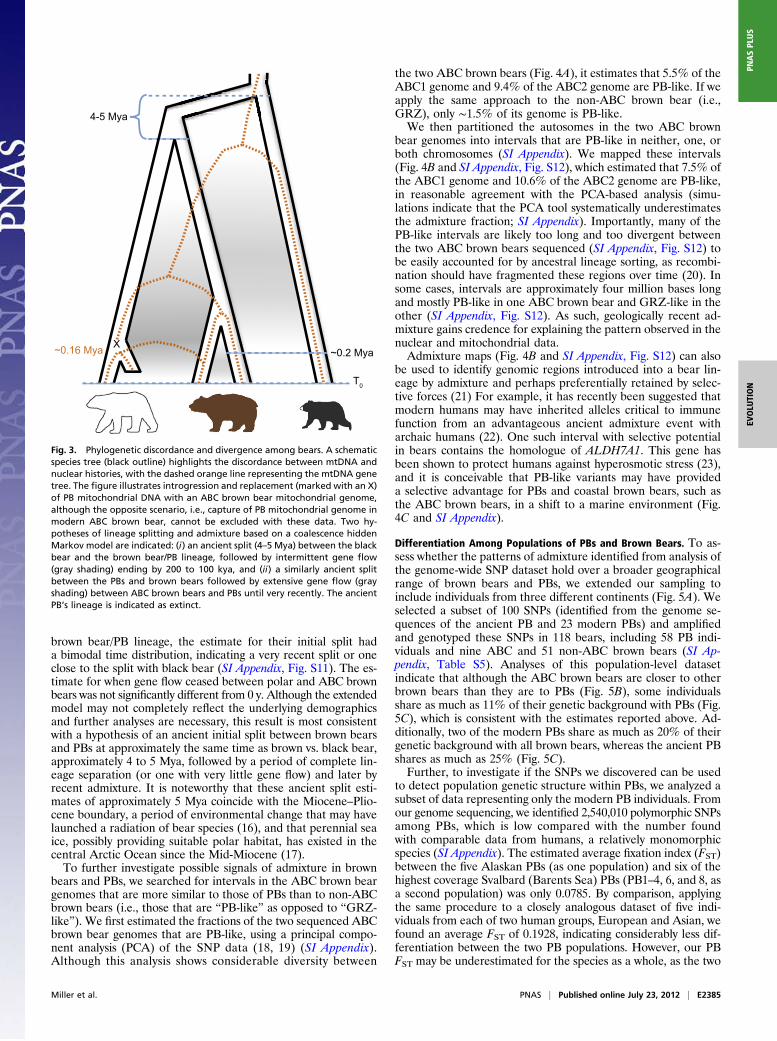
Discordance of Mitochondrial and Nuclear Evolutionary Histories. Afundamental question in the evolution of the PB concerns theexact nature of its close relationship with the brown bear. For all thebear individuals sequenced, even those with a low average coverageof the nuclear genome, we had ample data to assemble their mito-chondrial genomes. Phylogenetic analyses (SI Appendix), which alsoincluded previously assembled and publicly available mitochondrialgenomes (SI Appendix, Table S3), confirm that ABC brown bearsare, with these data, more closely related to PBs than to otherbrown bears (Fig. 2A). As such, maternal relationships amongthese bear species do not follow taxonomic boundaries. To fur-ther address the enigmatic phylogenetic position of the ABCbrown bears, we reconstructed a phylogenetic tree based on ge-nome-wide SNPs from nuclear autosomal loci. These markersexhibit a different pattern from the mitochondrial genome: thetwo ABC brown bear individuals, which group together, are astheir morphology suggests, more closely related to the non-ABCbrown bear (GRZ) than they are to PBs (Fig. 2B).Moreover, theseanalyses confirm the ancient PB groups as sister to all modern PBssampled, including modern bears from Svalbard, in the BarentsSea (4). Although this demonstrates that the ancient PB is indeedmost closely related to modern PBs, it is important that extantSvalbard PBs are more closely related to extant PBs from Alaskathan they are to this extinct Svalbard lineage. Although data frommore extant and extinct PBs is needed for confirmation, theserelationships support a hypothesis of extinction and replacementof earlier progenitor lineages in the Barents Sea PB population,and perhaps the entire extant PB genetic stock.The clear discordance between mitochondrial and nuclear
genomes in the phylogenetic placement of the ABC brown bears(Figs. 2 and 3) mirrors that found in the evolutionary histories ofarchaic and anatomically modern human lineages (2). Similarly,we hypothesize that two main evolutionary scenarios may explainthese patterns. First, the ABC brown bears and PBs may share amaternal history as a result of admixture between ancestors ofthese two lineages, followed by capture of one bear mitochondrialgenome by the other bear lineage. The discordancemay also resultfrom random assortment of ancestral genetic lineages due to ge-netic drift (incomplete lineage sorting), which may have alloweddivergent mitochondrial lineages to survive, perhaps in small,isolated bear populations, while becoming lost in others. It has alsobeen suggested that phylogenies inferred from sequence data on
Miller et al. PNAS | Published online July 23, 2012 | E2383
EVOLU
TION
PNASPL
US
nonrecombining chromosomes, such as mitochondrial DNA, maybe distorted by selection (14). Therefore, we tested for evidence ofpositive selection in the 13 protein coding genes of the mito-chondrial genome by using the dataset of 36 brown bears and PBs(SI Appendix). Results of our analysis demonstrated no evidencefor positive selection on the branches leading to ABC brown bearplus PB, nor to PB itself, excluding a hypothesis that selectivesweeps on mitochondrial DNA could be a major force in drivingmaternal evolutionary relationships between brown bears and PBs.
PB Divergence and Signals of Admixture. To make inferences aboutsplit times and gene flow, we applied a coalescence hiddenMarkovmodel to four of our deep-coverage bear genomes: the PB, oneABC brown bear, the non-ABC brown bear, and the black bear.
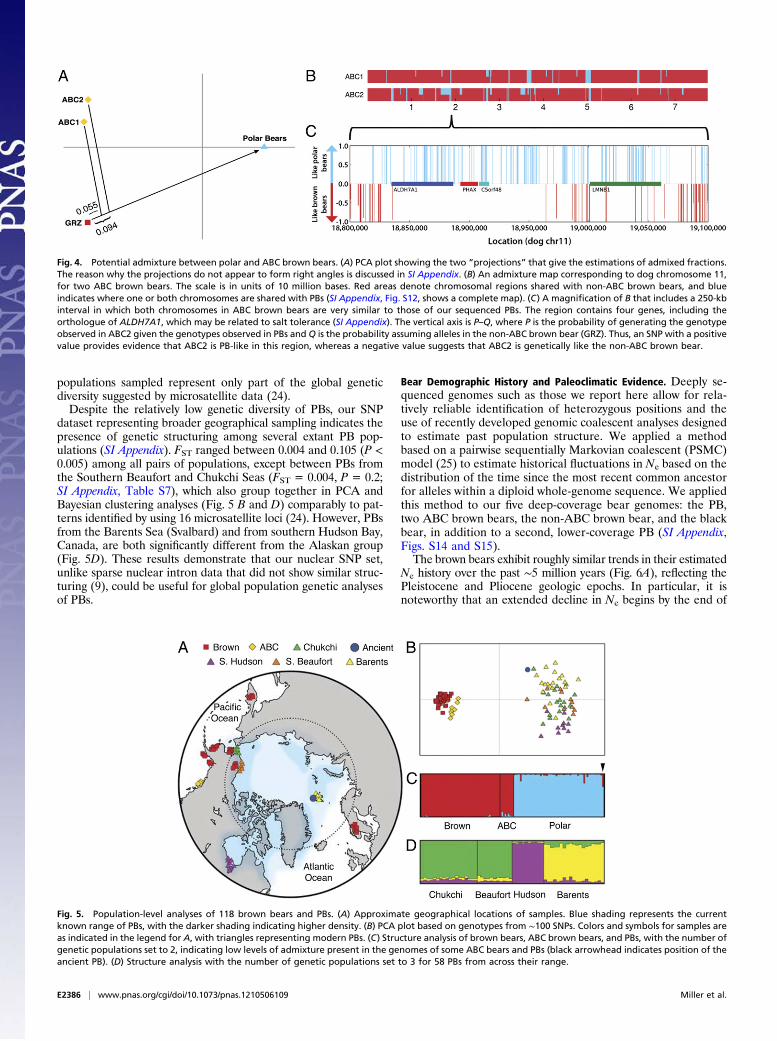
We first used a simple isolation model (15), comparing pairs ofgenomes under the assumption of allopatric speciation. However,for all comparisons, we obtained estimates of very recent split timesand very large ancestral effective population sizes (Ne), consistentwith mis-specification of the demographic model and suggestingthat the true demographics involved are not simple splits butinstead initial splits followed by prolonged periods with struc-tured populations and gene flow. We therefore applied an ex-tended model estimating an initial split time followed by a periodof gene flow before a complete split (SI Appendix). We estimatedan initial split between black bears and their sister lineage 4 to 5Mya followed by gene flow until 100 to 200 kya (Fig. 3). This splittime estimate is within the range of previously reported estimatesbased on molecular data (SI Appendix, Table S4). Within the
Fig. 1. The number of alleles unique to and shared by three bear species—polar, brown, and American black bear—in all SNP loci (A), and high-qualitypolymorphic variants resulting in an SAP (B).
A B
nuDNAmtDNA
//
//
//
Fig. 2. Phylogenetic reconstruction of relationships among bears. (A) Bayesian maximum clade credibility tree reconstructed from mitochondrial genomes(mtDNA), with filled black circles at individual nodes indicating posterior probabilities greater than 0.99 and bootstrap support greater than 99% (diagonallines indicate truncated branches, and, for the purpose of display, the cave bear genomes have been excluded; SI Appendix, Fig. S5, shows a complete tree).(B) Neighbor joining tree of genetic distances calculated from ∼12 million nuclear-genome SNP markers (nuDNA).
E2384 | www.pnas.org/cgi/doi/10.1073/pnas.1210506109 Miller et al.
brown bear/PB lineage, the estimate for their initial split hada bimodal time distribution, indicating a very recent split or oneclose to the split with black bear (SI Appendix, Fig. S11). The es-timate for when gene flow ceased between polar and ABC brownbears was not significantly different from 0 y. Although the extendedmodel may not completely reflect the underlying demographicsand further analyses are necessary, this result is most consistentwith a hypothesis of an ancient initial split between brown bearsand PBs at approximately the same time as brown vs. black bear,approximately 4 to 5 Mya, followed by a period of complete lin-eage separation (or one with very little gene flow) and later byrecent admixture. It is noteworthy that these ancient split esti-mates of approximately 5 Mya coincide with the Miocene–Plio-cene boundary, a period of environmental change that may havelaunched a radiation of bear species (16), and that perennial seaice, possibly providing suitable polar habitat, has existed in thecentral Arctic Ocean since the Mid-Miocene (17).To further investigate possible signals of admixture in brown
bears and PBs, we searched for intervals in the ABC brown beargenomes that are more similar to those of PBs than to non-ABCbrown bears (i.e., those that are “PB-like” as opposed to “GRZ-like”). We first estimated the fractions of the two sequenced ABCbrown bear genomes that are PB-like, using a principal compo-nent analysis (PCA) of the SNP data (18, 19) (SI Appendix).Although this analysis shows considerable diversity between
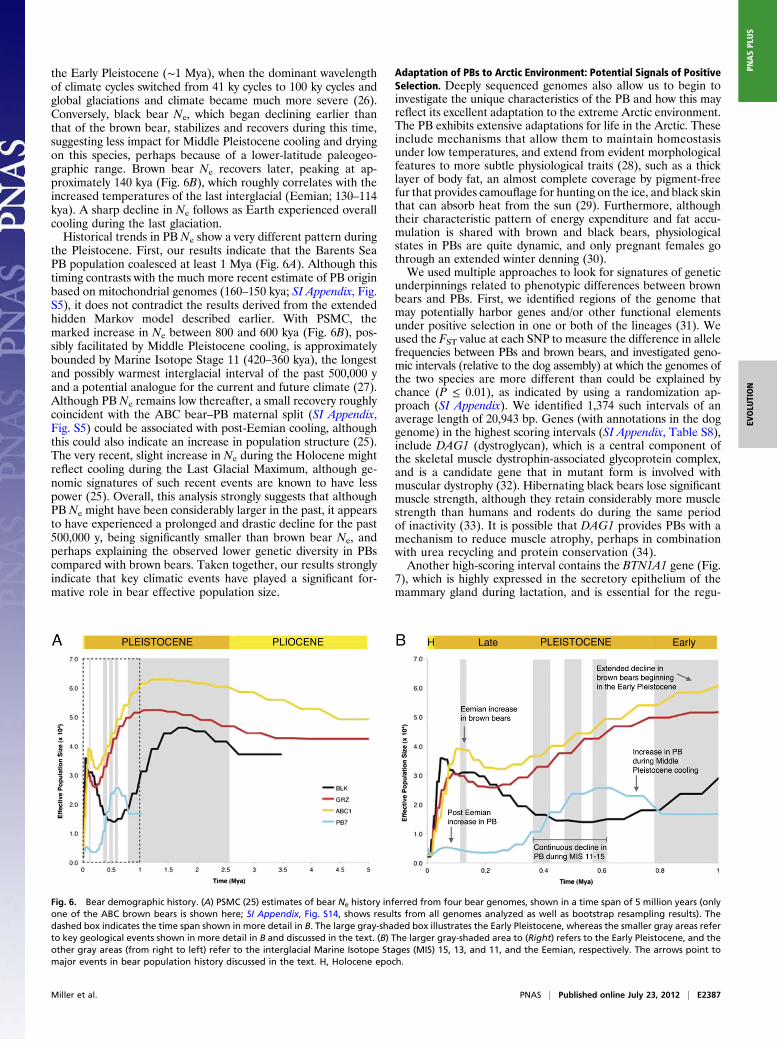
the two ABC brown bears (Fig. 4A), it estimates that 5.5% of theABC1 genome and 9.4% of the ABC2 genome are PB-like. If weapply the same approach to the non-ABC brown bear (i.e.,GRZ), only ∼1.5% of its genome is PB-like.We then partitioned the autosomes in the two ABC brown
bear genomes into intervals that are PB-like in neither, one, orboth chromosomes (SI Appendix). We mapped these intervals(Fig. 4B and SI Appendix, Fig. S12), which estimated that 7.5% ofthe ABC1 genome and 10.6% of the ABC2 genome are PB-like,in reasonable agreement with the PCA-based analysis (simu-lations indicate that the PCA tool systematically underestimatesthe admixture fraction; SI Appendix). Importantly, many of thePB-like intervals are likely too long and too divergent betweenthe two ABC brown bears sequenced (SI Appendix, Fig. S12) tobe easily accounted for by ancestral lineage sorting, as recombi-nation should have fragmented these regions over time (20). Insome cases, intervals are approximately four million bases longand mostly PB-like in one ABC brown bear and GRZ-like in theother (SI Appendix, Fig. S12). As such, geologically recent ad-mixture gains credence for explaining the pattern observed in thenuclear and mitochondrial data.Admixture maps (Fig. 4B and SI Appendix, Fig. S12) can also
be used to identify genomic regions introduced into a bear lin-eage by admixture and perhaps preferentially retained by selec-tive forces (21) For example, it has recently been suggested thatmodern humans may have inherited alleles critical to immunefunction from an advantageous ancient admixture event witharchaic humans (22). One such interval with selective potentialin bears contains the homologue of ALDH7A1. This gene hasbeen shown to protect humans against hyperosmotic stress (23),and it is conceivable that PB-like variants may have provideda selective advantage for PBs and coastal brown bears, such asthe ABC brown bears, in a shift to a marine environment (Fig.4C and SI Appendix).
Differentiation Among Populations of PBs and Brown Bears. To as-sess whether the patterns of admixture identified from analysis ofthe genome-wide SNP dataset hold over a broader geographicalrange of brown bears and PBs, we extended our sampling toinclude individuals from three different continents (Fig. 5A). Weselected a subset of 100 SNPs (identified from the genome se-quences of the ancient PB and 23 modern PBs) and amplifiedand genotyped these SNPs in 118 bears, including 58 PB indi-viduals and nine ABC and 51 non-ABC brown bears (SI Ap-pendix, Table S5). Analyses of this population-level datasetindicate that although the ABC brown bears are closer to otherbrown bears than they are to PBs (Fig. 5B), some individualsshare as much as 11% of their genetic background with PBs (Fig.5C), which is consistent with the estimates reported above. Ad-ditionally, two of the modern PBs share as much as 20% of theirgenetic background with all brown bears, whereas the ancient PBshares as much as 25% (Fig. 5C).Further, to investigate if the SNPs we discovered can be used
to detect population genetic structure within PBs, we analyzed asubset of data representing only the modern PB individuals. Fromour genome sequencing, we identified 2,540,010 polymorphic SNPsamong PBs, which is low compared with the number foundwith comparable data from humans, a relatively monomorphicspecies (SI Appendix). The estimated average fixation index (FST)between the five Alaskan PBs (as one population) and six of thehighest coverage Svalbard (Barents Sea) PBs (PB1–4, 6, and 8, asa second population) was only 0.0785. By comparison, applyingthe same procedure to a closely analogous dataset of five indi-viduals from each of two human groups, European and Asian, wefound an average FST of 0.1928, indicating considerably less dif-ferentiation between the two PB populations. However, our PBFST may be underestimated for the species as a whole, as the two
X
4-5 Mya
~0.2 Mya~0.16 Mya
T0
Fig. 3. Phylogenetic discordance and divergence among bears. A schematicspecies tree (black outline) highlights the discordance between mtDNA andnuclear histories, with the dashed orange line representing the mtDNA genetree. The figure illustrates introgression and replacement (marked with an X)of PB mitochondrial DNA with an ABC brown bear mitochondrial genome,although the opposite scenario, i.e., capture of PB mitochondrial genome inmodern ABC brown bear, cannot be excluded with these data. Two hy-potheses of lineage splitting and admixture based on a coalescence hiddenMarkov model are indicated: (i) an ancient split (4–5 Mya) between the blackbear and the brown bear/PB lineage, followed by intermittent gene flow(gray shading) ending by 200 to 100 kya, and (ii) a similarly ancient splitbetween the PBs and brown bears followed by extensive gene flow (grayshading) between ABC brown bears and PBs until very recently. The ancientPB’s lineage is indicated as extinct.
Miller et al. PNAS | Published online July 23, 2012 | E2385
EVOLU
TION
PNASPL
US
populations sampled represent only part of the global geneticdiversity suggested by microsatellite data (24).Despite the relatively low genetic diversity of PBs, our SNP
dataset representing broader geographical sampling indicates thepresence of genetic structuring among several extant PB pop-ulations (SI Appendix). FST ranged between 0.004 and 0.105 (P <0.005) among all pairs of populations, except between PBs fromthe Southern Beaufort and Chukchi Seas (FST = 0.004, P = 0.2;SI Appendix, Table S7), which also group together in PCA andBayesian clustering analyses (Fig. 5 B and D) comparably to pat-terns identified by using 16 microsatellite loci (24). However, PBsfrom the Barents Sea (Svalbard) and from southern Hudson Bay,Canada, are both significantly different from the Alaskan group(Fig. 5D). These results demonstrate that our nuclear SNP set,unlike sparse nuclear intron data that did not show similar struc-turing (9), could be useful for global population genetic analysesof PBs.
Bear Demographic History and Paleoclimatic Evidence. Deeply se-quenced genomes such as those we report here allow for rela-tively reliable identification of heterozygous positions and theuse of recently developed genomic coalescent analyses designedto estimate past population structure. We applied a methodbased on a pairwise sequentially Markovian coalescent (PSMC)model (25) to estimate historical fluctuations in Ne based on thedistribution of the time since the most recent common ancestorfor alleles within a diploid whole-genome sequence. We appliedthis method to our five deep-coverage bear genomes: the PB,two ABC brown bears, the non-ABC brown bear, and the blackbear, in addition to a second, lower-coverage PB (SI Appendix,Figs. S14 and S15).The brown bears exhibit roughly similar trends in their estimated
Ne history over the past ∼5 million years (Fig. 6A), reflecting thePleistocene and Pliocene geologic epochs. In particular, it isnoteworthy that an extended decline in Ne begins by the end of
Fig. 4. Potential admixture between polar and ABC brown bears. (A) PCA plot showing the two “projections” that give the estimations of admixed fractions.The reason why the projections do not appear to form right angles is discussed in SI Appendix. (B) An admixture map corresponding to dog chromosome 11,for two ABC brown bears. The scale is in units of 10 million bases. Red areas denote chromosomal regions shared with non-ABC brown bears, and blueindicates where one or both chromosomes are shared with PBs (SI Appendix, Fig. S12, shows a complete map). (C) A magnification of B that includes a 250-kbinterval in which both chromosomes in ABC brown bears are very similar to those of our sequenced PBs. The region contains four genes, including theorthologue of ALDH7A1, which may be related to salt tolerance (SI Appendix). The vertical axis is P–Q, where P is the probability of generating the genotypeobserved in ABC2 given the genotypes observed in PBs and Q is the probability assuming alleles in the non-ABC brown bear (GRZ). Thus, an SNP with a positivevalue provides evidence that ABC2 is PB-like in this region, whereas a negative value suggests that ABC2 is genetically like the non-ABC brown bear.
Fig. 5. Population-level analyses of 118 brown bears and PBs. (A) Approximate geographical locations of samples. Blue shading represents the currentknown range of PBs, with the darker shading indicating higher density. (B) PCA plot based on genotypes from ∼100 SNPs. Colors and symbols for samples areas indicated in the legend for A, with triangles representing modern PBs. (C) Structure analysis of brown bears, ABC brown bears, and PBs, with the number ofgenetic populations set to 2, indicating low levels of admixture present in the genomes of some ABC bears and PBs (black arrowhead indicates position of theancient PB). (D) Structure analysis with the number of genetic populations set to 3 for 58 PBs from across their range.
E2386 | www.pnas.org/cgi/doi/10.1073/pnas.1210506109 Miller et al.
the Early Pleistocene (∼1 Mya), when the dominant wavelengthof climate cycles switched from 41 ky cycles to 100 ky cycles andglobal glaciations and climate became much more severe (26).Conversely, black bear Ne, which began declining earlier thanthat of the brown bear, stabilizes and recovers during this time,suggesting less impact for Middle Pleistocene cooling and dryingon this species, perhaps because of a lower-latitude paleogeo-graphic range. Brown bear Ne recovers later, peaking at ap-proximately 140 kya (Fig. 6B), which roughly correlates with theincreased temperatures of the last interglacial (Eemian; 130–114kya). A sharp decline in Ne follows as Earth experienced overallcooling during the last glaciation.Historical trends in PB Ne show a very different pattern during
the Pleistocene. First, our results indicate that the Barents SeaPB population coalesced at least 1 Mya (Fig. 6A). Although thistiming contrasts with the much more recent estimate of PB originbased on mitochondrial genomes (160–150 kya; SI Appendix, Fig.S5), it does not contradict the results derived from the extendedhidden Markov model described earlier. With PSMC, themarked increase in Ne between 800 and 600 kya (Fig. 6B), pos-sibly facilitated by Middle Pleistocene cooling, is approximatelybounded by Marine Isotope Stage 11 (420–360 kya), the longestand possibly warmest interglacial interval of the past 500,000 yand a potential analogue for the current and future climate (27).Although PB Ne remains low thereafter, a small recovery roughlycoincident with the ABC bear–PB maternal split (SI Appendix,Fig. S5) could be associated with post-Eemian cooling, althoughthis could also indicate an increase in population structure (25).The very recent, slight increase in Ne during the Holocene mightreflect cooling during the Last Glacial Maximum, although ge-nomic signatures of such recent events are known to have lesspower (25). Overall, this analysis strongly suggests that althoughPB Ne might have been considerably larger in the past, it appearsto have experienced a prolonged and drastic decline for the past500,000 y, being significantly smaller than brown bear Ne, andperhaps explaining the observed lower genetic diversity in PBscompared with brown bears. Taken together, our results stronglyindicate that key climatic events have played a significant for-mative role in bear effective population size.
Adaptation of PBs to Arctic Environment: Potential Signals of PositiveSelection. Deeply sequenced genomes also allow us to begin toinvestigate the unique characteristics of the PB and how this mayreflect its excellent adaptation to the extreme Arctic environment.The PB exhibits extensive adaptations for life in the Arctic. Theseinclude mechanisms that allow them to maintain homeostasisunder low temperatures, and extend from evident morphologicalfeatures to more subtle physiological traits (28), such as a thicklayer of body fat, an almost complete coverage by pigment-freefur that provides camouflage for hunting on the ice, and black skinthat can absorb heat from the sun (29). Furthermore, althoughtheir characteristic pattern of energy expenditure and fat accu-mulation is shared with brown and black bears, physiologicalstates in PBs are quite dynamic, and only pregnant females gothrough an extended winter denning (30).We used multiple approaches to look for signatures of genetic
underpinnings related to phenotypic differences between brownbears and PBs. First, we identified regions of the genome thatmay potentially harbor genes and/or other functional elementsunder positive selection in one or both of the lineages (31). Weused the FST value at each SNP to measure the difference in allelefrequencies between PBs and brown bears, and investigated geno-mic intervals (relative to the dog assembly) at which the genomes ofthe two species are more different than could be explained bychance (P ≤ 0.01), as indicated by using a randomization ap-proach (SI Appendix). We identified 1,374 such intervals of anaverage length of 20,943 bp. Genes (with annotations in the doggenome) in the highest scoring intervals (SI Appendix, Table S8),include DAG1 (dystroglycan), which is a central component ofthe skeletal muscle dystrophin-associated glycoprotein complex,and is a candidate gene that in mutant form is involved withmuscular dystrophy (32). Hibernating black bears lose significantmuscle strength, although they retain considerably more musclestrength than humans and rodents do during the same periodof inactivity (33). It is possible that DAG1 provides PBs with amechanism to reduce muscle atrophy, perhaps in combinationwith urea recycling and protein conservation (34).Another high-scoring interval contains the BTN1A1 gene (Fig.
7), which is highly expressed in the secretory epithelium of themammary gland during lactation, and is essential for the regu-
Fig. 6. Bear demographic history. (A) PSMC (25) estimates of bear Ne history inferred from four bear genomes, shown in a time span of 5 million years (onlyone of the ABC brown bears is shown here; SI Appendix, Fig. S14, shows results from all genomes analyzed as well as bootstrap resampling results). Thedashed box indicates the time span shown in more detail in B. The large gray-shaded box illustrates the Early Pleistocene, whereas the smaller gray areas referto key geological events shown in more detail in B and discussed in the text. (B) The larger gray-shaded area to (Right) refers to the Early Pleistocene, and theother gray areas (from right to left) refer to the interglacial Marine Isotope Stages (MIS) 15, 13, and 11, and the Eemian, respectively. The arrows point tomajor events in bear population history discussed in the text. H, Holocene epoch.
Miller et al. PNAS | Published online July 23, 2012 | E2387
EVOLU
TION
PNASPL
US
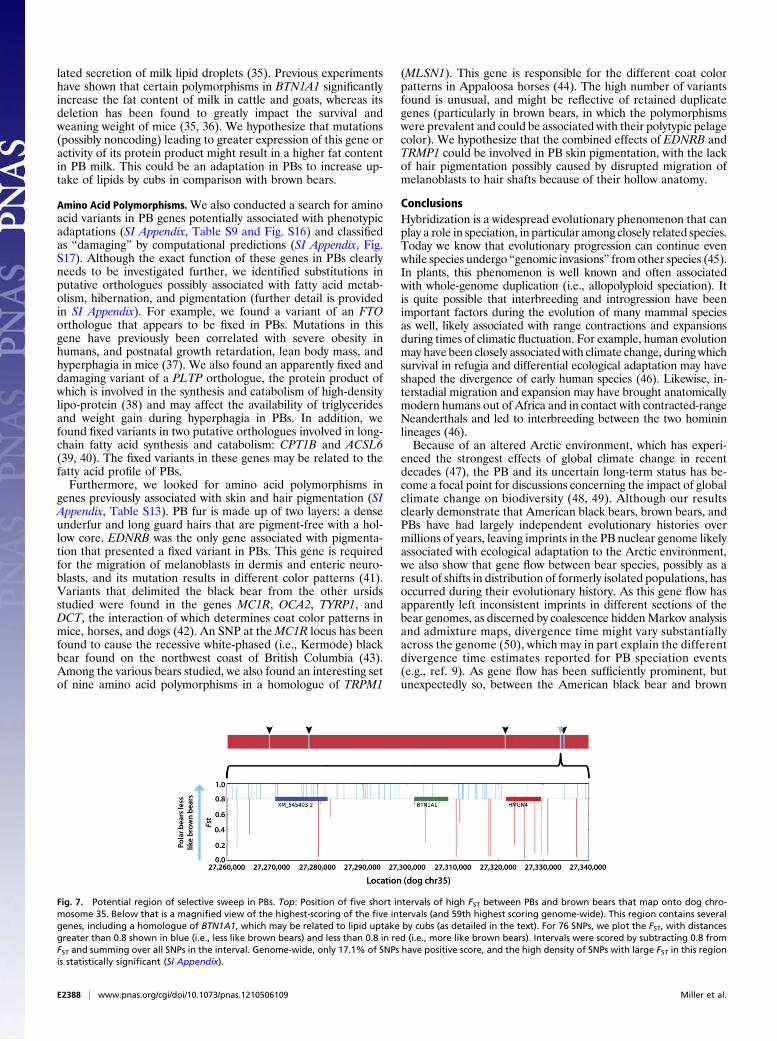
lated secretion of milk lipid droplets (35). Previous experimentshave shown that certain polymorphisms in BTN1A1 significantlyincrease the fat content of milk in cattle and goats, whereas itsdeletion has been found to greatly impact the survival andweaning weight of mice (35, 36). We hypothesize that mutations(possibly noncoding) leading to greater expression of this gene oractivity of its protein product might result in a higher fat contentin PB milk. This could be an adaptation in PBs to increase up-take of lipids by cubs in comparison with brown bears.
Amino Acid Polymorphisms.We also conducted a search for aminoacid variants in PB genes potentially associated with phenotypicadaptations (SI Appendix, Table S9 and Fig. S16) and classifiedas “damaging” by computational predictions (SI Appendix, Fig.S17). Although the exact function of these genes in PBs clearlyneeds to be investigated further, we identified substitutions inputative orthologues possibly associated with fatty acid metab-olism, hibernation, and pigmentation (further detail is providedin SI Appendix). For example, we found a variant of an FTOorthologue that appears to be fixed in PBs. Mutations in thisgene have previously been correlated with severe obesity inhumans, and postnatal growth retardation, lean body mass, andhyperphagia in mice (37). We also found an apparently fixed anddamaging variant of a PLTP orthologue, the protein product ofwhich is involved in the synthesis and catabolism of high-densitylipo-protein (38) and may affect the availability of triglyceridesand weight gain during hyperphagia in PBs. In addition, wefound fixed variants in two putative orthologues involved in long-chain fatty acid synthesis and catabolism: CPT1B and ACSL6(39, 40). The fixed variants in these genes may be related to thefatty acid profile of PBs.Furthermore, we looked for amino acid polymorphisms in
genes previously associated with skin and hair pigmentation (SIAppendix, Table S13). PB fur is made up of two layers: a denseunderfur and long guard hairs that are pigment-free with a hol-low core. EDNRB was the only gene associated with pigmenta-tion that presented a fixed variant in PBs. This gene is requiredfor the migration of melanoblasts in dermis and enteric neuro-blasts, and its mutation results in different color patterns (41).Variants that delimited the black bear from the other ursidsstudied were found in the genes MC1R, OCA2, TYRP1, andDCT, the interaction of which determines coat color patterns inmice, horses, and dogs (42). An SNP at theMC1R locus has beenfound to cause the recessive white-phased (i.e., Kermode) blackbear found on the northwest coast of British Columbia (43).Among the various bears studied, we also found an interesting setof nine amino acid polymorphisms in a homologue of TRPM1
(MLSN1). This gene is responsible for the different coat colorpatterns in Appaloosa horses (44). The high number of variantsfound is unusual, and might be reflective of retained duplicategenes (particularly in brown bears, in which the polymorphismswere prevalent and could be associated with their polytypic pelagecolor). We hypothesize that the combined effects of EDNRB andTRMP1 could be involved in PB skin pigmentation, with the lackof hair pigmentation possibly caused by disrupted migration ofmelanoblasts to hair shafts because of their hollow anatomy.
ConclusionsHybridization is a widespread evolutionary phenomenon that canplay a role in speciation, in particular among closely related species.Today we know that evolutionary progression can continue evenwhile species undergo “genomic invasions” from other species (45).In plants, this phenomenon is well known and often associatedwith whole-genome duplication (i.e., allopolyploid speciation). Itis quite possible that interbreeding and introgression have beenimportant factors during the evolution of many mammal speciesas well, likely associated with range contractions and expansionsduring times of climatic fluctuation. For example, human evolutionmay have been closely associatedwith climate change, during whichsurvival in refugia and differential ecological adaptation may haveshaped the divergence of early human species (46). Likewise, in-terstadial migration and expansion may have brought anatomicallymodern humans out of Africa and in contact with contracted-rangeNeanderthals and led to interbreeding between the two homininlineages (46).Because of an altered Arctic environment, which has experi-
enced the strongest effects of global climate change in recentdecades (47), the PB and its uncertain long-term status has be-come a focal point for discussions concerning the impact of globalclimate change on biodiversity (48, 49). Although our resultsclearly demonstrate that American black bears, brown bears, andPBs have had largely independent evolutionary histories overmillions of years, leaving imprints in the PB nuclear genome likelyassociated with ecological adaptation to the Arctic environment,we also show that gene flow between bear species, possibly as aresult of shifts in distribution of formerly isolated populations, hasoccurred during their evolutionary history. As this gene flow hasapparently left inconsistent imprints in different sections of thebear genomes, as discerned by coalescence hiddenMarkov analysisand admixture maps, divergence time might vary substantiallyacross the genome (50), which may in part explain the differentdivergence time estimates reported for PB speciation events(e.g., ref. 9). As gene flow has been sufficiently prominent, butunexpectedly so, between the American black bear and brown
Fig. 7. Potential region of selective sweep in PBs. Top: Position of five short intervals of high FST between PBs and brown bears that map onto dog chro-mosome 35. Below that is a magnified view of the highest-scoring of the five intervals (and 59th highest scoring genome-wide). This region contains severalgenes, including a homologue of BTN1A1, which may be related to lipid uptake by cubs (as detailed in the text). For 76 SNPs, we plot the FST, with distancesgreater than 0.8 shown in blue (i.e., less like brown bears) and less than 0.8 in red (i.e., more like brown bears). Intervals were scored by subtracting 0.8 fromFST and summing over all SNPs in the interval. Genome-wide, only 17.1% of SNPs have positive score, and the high density of SNPs with large FST in this regionis statistically significant (SI Appendix).
E2388 | www.pnas.org/cgi/doi/10.1073/pnas.1210506109 Miller et al.
bear so as to leave a clear signature in their genomes today, an-cient admixture in response to climate change may prove to havebeen a more general phenomenon in the ursid lineage as a whole.However, the current trend toward an increasingly warmer cli-mate in the Arctic has caused sea ice to retreat dramatically andpossibly at a pace never experienced before (51). If this trendcontinues, it is possible that future PBs throughout most of theirrange may be forced to spend increasingly more time on land,perhaps even during the breeding season, and therefore comeinto contact with brown bears more frequently. Recently, wildhybrids and even second-generation offspring have been docu-mented in the Northern Beaufort Sea of Arctic Canada, wherethe ranges of brown bears and PBs appear to overlap, perhaps as arecent response to climatic changes. Similar interbreeding amongother Arctic species could have large impacts on polar bio-diversity in general (52). Perhaps even more dramatically, weshow that a prolonged decline in PB Ne has occurred during thelast approximately 500,000 y, possibly followed by recent expan-sions from small founder populations that may have survived inrefugia during interglacials. One such “surviving population”maybe represented by our 130,000- to 110,000-y-old PB specimen,suggesting that Svalbard may have constituted an important re-fugium during past interglacials, acting as a source population forrange expansions during subsequent cooler periods. If modern PBpopulations result from Holocene range expansions from a fewsmall, contracted populations inMiddle-Late Pleistocene refugia,this may explain the observed low genetic diversity in PBs today,and possibly leave modern PB populations even more vulnerableto future climatic and other environmental disturbances.Many questions concerning evolution of the PB and its close
relatives still remain, and future paleogenomic and expandedpopulation genomic approaches will undoubtedly shed furtherlight on some of these questions. Until the present, only limitedgenetic resources have been available to investigate questions ofdivergence and adaptation of bears, but here we have developedand analyzed extensive genomic and transcriptomic sequencedata from three different species. Thus, the resources and resultspresented here are important for gaining a better understandingof past responses during bear evolutionary history, which mayinform predictions of current and future responses. In additionto making our assembly available, we have placed our SNP callson the Galaxy web server (usegalaxy.org) and provided a suiteof tools to analyze them, which can be run through a straight-forward interface that requires only an internet browser. Forexample, the PCA, admixture, and selective-sweep analyses wereperformed with Galaxy commands, and we provide Galaxyworkflows such that all command parameters and options used inour analysis are made explicit.
Materials and MethodsDetails of sampling and experimental procedures are provided in SI Appendix.
Genome Sequencing. For genomic DNA sequencing, blood and tissue sampleswere collected from one American black bear (U. americanus), one brownbear (U. arctos) from the Kenai Peninsula, two brown bears from Alaska’sAlexander Archipelago (i.e., ABC brown bears), five PBs (U. maritimus) fromAlaska (Chukchi Sea and Southern Beaufort Sea populations), and 18 PBsfrom Svalbard (Barents Sea population). Except for one ABC brown bearblood sample (ABC2), which was collected from a rescued cub in a rehabil-itation center in Sitka, AK, all samples were collected from wild populationsby using standard procedures and with proper permits. All samples weresequenced to generate paired-end reads of average length 101 bp by usingthe Illumina HiSeq 2000 sequencing platform. The sample PB7 was se-quenced to a greater depth of coverage by using multiple paired-end li-braries with span sizes of 160 bp, 180 bp, and 300 bp, in addition to a mate-pair library of 3 kb (SI Appendix, Table S1).
Genome Assemblies and Identification of SNPs. Illumina short reads and thepaired-end reads from the short-insert libraries were assembled into contigs
for PB7 using SOAPdenovo (12). All available sequence data were thenaligned to these contigs by using the mate-pair information in the order ofestimated insert size (160 bp to 3 kbp) to generate the scaffolds. Scaffoldingwas followed by local reassembly of sequences in the intrascaffold gaps. Toevaluate the accuracy of the draft sequence, we aligned all the paired-endreads from PB7 back to the assembly by using Burrows–Wheeler alignment(BWA) (53). Mitochondrial reads were mapped to a reference sequence(GenBank accession no. NC003428) by using BWA with default parametersor, in the case of the black bear, using LASTZ (54). These alignments wereinput to a reference-based assembler to assemble the mtDNA of the blackbear sample, and BWA to assemble the mtDNA for the remaining samples.The identification of nuclear SNPs, as aligned to both our draft assembly andthe dog genome (C. familiaris assembly version 2.0), and the identification ofmitochondrial SNPs are described in SI Appendix.
Transcriptome Sequencing. Transcriptomes of two bear individuals, a PB and abrown bear, were sequenced on a Personal Genome Machine sequencer,generating a total of 9million reads, with an estimated average length of 190bases. Using Genome Sequencer Reference Mapper software (Newbler ver-sion 2.6), masked reads from each bear weremapped against our PB assemblyas well as 22,291 dog (C. familiaris) cDNA sequences (mRNA; SI Appendix,Table S2 and Fig. S3).
SNP Genotyping. From the SNPs discovered by genome sequencing of 23modern PBs, a set of 100 high-quality, autosomal SNPs were identified basedon the criteria that loci would be variable among the 23 PBs and that bothalleles in each locus were unambiguous in the ancient PB (primers are listed inSI Appendix, Table S6). From a total of 118 modern polar and brown bears(Fig. 5 and SI Appendix, Table S5), we conducted multiplex PCR amplificationof the SNP loci. Barcoded Illumina TruSeq libraries were prepared for eachmultiplex PCR product. Twenty-four libraries were pooled in equimolaramounts and sequenced in a single run on the Illumina MiSeq platform.
Analytical Procedures. Phylogenetic analyses of nuclear genome SNP data,calculations of estimates of admixture, as well as search for genomic intervalspossibly affected by selective sweeps, were conducted by using tools availablein Galaxy (usegalaxy.org). Bootstrap analysis of the nuclear SNP data was notsuccessful as a result of computational limits imposed by the requirednumber of massive pseudoreplicate data sets. Mitochondrial genome phy-logenetic analyses were conducted by using maximum likelihood andBayesian inference, and the estimates for dates of molecular divergencewere calculated by using the software BEAST (55). Positive selection analyseswere carried out using the program TreeSAAP (56). Analyses of genetic di-versity and differentiation among samples amplified for selected SNP lociwere performed in GenALEx 6.41 (57). The Bayesian clustering programStructure version 2.3.3 (58) was used to investigate the presence of admix-ture between brown bears and PBs, and of population structuring inside PBs.To analyze bear demographic history, we applied a coalescence hiddenMarkov model to four of our deep-coverage bear genomes: the PB (PB7),one ABC brown bear (ABC1), the non-ABC brown bear (i.e., GRZ), and theblack bear. To obtain a detailed history of ancestral population sizes, weimplemented the PSMC (25) to analyze the aforementioned four genomes inaddition to the second ABC brown bear (ABC2) and a second, lower-cover-age PB (PB3).
Amino Acid Polymorphisms. Among our discovered SNPs, we searched for SNPsthat could be traced to putative orthologue genes known from the doggenome (canFam2) and that resulted in SAPs. The functional effect of each SAPwas predictedwith PolyPhen 2 (59), which provides a classification of “possiblydamaging,” “probably damaging,” or “benign.” By using those SAPs classifiedas damaging (i.e., possibly damaging and probably damaging), we ranked aset of KEGG pathways based on three different metrics: percentage of genesaffected, change in the number of paths, and change in the length of paths.We defined high-quality SAPs as those being called with at least two se-quences, and as many as 60 sequences, having a quality value higher than48. To determine the possible role of these mutations in the evolution ofPBs, we traced them into metabolic pathways and analyzed their possiblerole in specific adaptations of interest.
ACKNOWLEDGMENTS. The authors thank Anders Götherström (UppsalaUniversity), Francesca Chiaromonte (Penn State University), and Victor A.Albert (University at Buffalo) for support during different stages of the pro-ject; and the Centre for Scientific Computing Aarhus (Aarhus University) forfree computer time. LaVern Beier, Rod Flynn, and Neil Barten (Alaska De-partment of Fish and Game) and Bill Leacock (US Fish and Wildlife Service)
Miller et al. PNAS | Published online July 23, 2012 | E2389
EVOLU
TION
PNASPL
US
facilitated field sampling. This study received financial support from PennState University; the College of Arts and Sciences, University at Buffalo; USGeological Survey’s Changing Arctic Ecosystem Initiative; US Fish and Wild-life Service; Ontario Ministry of Natural Resources, Canada; and Alaska De-partment of Fish and Game. Funding of the Galaxy tools to analyze medium-coverage sequence data from multiple individuals is supported by National
Institutes of Health Grant UL1 RR033184-01 to the Penn State Clinical andTranslational Science Institute. This work was supported by National ScienceFoundation Award DEB 0733029 (to W.M.), Howard Hughes Medical In-stitute Grant 55005946 (to L.H.-E.), and a grant from the PennsylvaniaDepartment of Health using Tobacco Commonwealth Universal ResearchEnhancement Funds (W.M.).
1. Green RE, et al. (2010) A draft sequence of the Neandertal genome. Science 328:710–722.
2. Reich D, et al. (2010) Genetic history of an archaic hominin group from Denisova Cavein Siberia. Nature 468:1053–1060.
3. vonHoldt BM, et al. (2011) A genome-wide perspective on the evolutionary history ofenigmatic wolf-like canids. Genome Res 21:1294–1305.
4. Lindqvist C, et al. (2010) Complete mitochondrial genome of a Pleistocene jawboneunveils the origin of polar bear. Proc Natl Acad Sci USA 107:5053–5057.
5. Stirling I (2011) Polar Bears: A Natural History of a Threatened Species (Fitzhenry andWhiteside, Brighton, MA).
6. Doupé JP, England JH, Furze M, Paetkau D (2007) Most northerly observation ofa grizzly bear (Ursus arctos) in Canada: Photographic and DNA evidence fromMelvilleIsland, Northwest Territories. Arctic 60:271–276.
7. Gray AP (1972) Mammalian Hybrids. A Check-List With Bibliography (CommonwealthAgricultural Bureaux, Slough, UK), 2nd Ed.
8. Edwards CJ, et al. (2011) Ancient hybridization and an Irish origin for the modernpolar bear matriline. Curr Biol 21:1251–1258.
9. Hailer F, et al. (2012) Nuclear genomic sequences reveal that polar bears are an oldand distinct bear lineage. Science 336:344–347.
10. Miller W, et al. (2011) Genetic diversity and population structure of the endangeredmarsupial Sarcophilus harrisii (Tasmanian devil). Proc Natl Acad Sci USA 108:12348–12353.
11. Perry GH, et al. (2012) A genome sequence resource for the aye-aye (Daubentoniamadagascariensis), a nocturnal lemur from Madagascar. Genome Biol Evol 4:126–135.
12. Li R, et al. (2010) De novo assembly of human genomes with massively parallel shortread sequencing. Genome Res 20:265–272.
13. Li R, et al. (2010) The sequence and de novo assembly of the giant panda genome.Nature 463:311–317.
14. Ballard JWO, Whitlock MC (2004) The incomplete natural history of mitochondria.Mol Ecol 13:729–744.
15. Mailund T, Dutheil JY, Hobolth A, Lunter G, Schierup MH (2011) Estimatingdivergence time and ancestral effective population size of Bornean and Sumatranorangutan subspecies using a coalescent hidden Markov model. PLoS Genet 7:e1001319.
16. Krause J, et al. (2008) Mitochondrial genomes reveal an explosive radiation of extinctand extant bears near the Miocene-Pliocene boundary. BMC Evol Biol 8:220.
17. Polyak L, et al. (2010) History of sea ice in the Arctic. Quat Sci Rev 29:1757–1778.18. Paschou P, et al. (2007) PCA-correlated SNPs for structure identification in worldwide
human populations. PLoS Genet 3:1672–1686.19. Bryc K, et al. (2010) Genome-wide patterns of population structure and admixture in
West Africans and African Americans. Proc Natl Acad Sci USA 107:786–791.20. Pugach I, Matveyev R, Wollstein A, Kayser M, Stoneking M (2011) Dating the age of
admixture via wavelet transform analysis of genome-wide data. Genome Biol 12:R19.21. Tang H, et al. (2007) Recent genetic selection in the ancestral admixture of Puerto
Ricans. Am J Hum Genet 81:626–633.22. Abi-Rached L, et al. (2011) The shaping of modern human immune systems by
multiregional admixture with archaic humans. Science 334:89–94.23. Brocker C, et al. (2010) Aldehyde dehydrogenase 7A1 (ALDH7A1) is a novel enzyme
involved in cellular defense against hyperosmotic stress. J Biol Chem 285:18452–18463.
24. Paetkau D, et al. (1999) Genetic structure of the world’s polar bear populations. MolEcol 8:1571–1584.
25. Li H, Durbin R (2011) Inference of human population history from individual whole-genome sequences. Nature 475:493–496.
26. Lisiecki LE, Raymo ME (2005) A Pliocene-Pleistocene stack of 57 globally distributedbenthic δ18O records. Paleoceanography 20:PA103.
27. Howard WR (1997) Palaeoclimatology: A warm future in the past. Nature 388:418–419.
28. Øritsland NA (1970) Temperature regulation of the polar bear (Thalarctos maritimus).Comp Biochem Physiol 37:225.
29. Harington CR (2008) The evolution of Arctic marine mammals. Ecol Appl 18(2, Suppl):S23–S40.
30. Bruce DS, et al. (1990) Is the polar bear (Ursus maritimus) a hibernator? Continuedstudies on opioids and hibernation. Pharmacol Biochem Behav 35:705–711.
31. Akey JM, Zhang G, Zhang K, Jin L, Shriver MD (2002) Interrogating a high-density SNPmap for signatures of natural selection. Genome Res 12:1805–1814.
32. Ibraghimov-Beskrovnaya O, et al. (1992) Primary structure of dystrophin-associatedglycoproteins linking dystrophin to the extracellular matrix. Nature 355:696–702.
33. Harlow HJ, Lohuis T, Beck TDI, Iaizzo PA (2001) Muscle strength in overwinteringbears. Nature 409:997.
34. Barboza PS, Farley SD, Robbins CT (1997) Whole-body urea cycling and proteinturnover during hyperphagia and dormancy in growing bears (Ursus americanus andU. arctos). Can J Zool 75:2129–2136.
35. Ogg SL, Weldon AK, Dobbie L, Smith AJH, Mather IH (2004) Expression ofbutyrophilin (Btn1a1) in lactating mammary gland is essential for the regulatedsecretion of milk-lipid droplets. Proc Natl Acad Sci USA 101:10084–10089.
36. Qu Y, et al. (2011) Novel SNPs of butyrophilin (BTN1A1) and milk fat globuleepidermal growth factor (EGF) 8 (MFG-E8) are associated with milk traits in dairygoat. Mol Biol Rep 38:371–377.
37. Fischer J, et al. (2009) Inactivation of the Fto gene protects from obesity. Nature 458:894–898.
38. Kaser S, et al. (2004) Effects of weight loss on PLTP activity and HDL particle size. Int JObes Relat Metab Disord 28:1280–1282.
39. Miljkovic I, et al. (2009) Association of the CPT1B gene with skeletal muscle fatinfiltration in Afro-Caribbean men. Obesity (Silver Spring) 17:1396–1401.
40. Soupene E, Dinh NP, Siliakus M, Kuypers FA (2010) Activity of the acyl-CoA synthetaseACSL6 isoforms: Role of the fatty acid Gate-domains. BMC Biochem 11:18.
41. Shin MK, Levorse JM, Ingram RS, Tilghman SM (1999) The temporal requirement forendothelin receptor-B signalling during neural crest development. Nature 402:496–501.
42. Cieslak M, Reissmann M, Hofreiter M, Ludwig A (2011) Colours of domestication. BiolRev Camb Philos Soc 86:885–899.
43. Hedrick PW, Ritland K (2012) Population genetics of the white-phased “Spirit” blackbear of British Columbia. Evolution 66:305–313.
44. Bellone RR, et al. (2008) Differential gene expression of TRPM1, the potential cause ofcongenital stationary night blindness and coat spotting patterns (LP) in theAppaloosa horse (Equus caballus). Genetics 179:1861–1870.
45. Mallet J (2005) Hybridization as an invasion of the genome. Trends Ecol Evol 20:229–237.
46. Stewart JR, Stringer CB (2012) Human evolution out of Africa: The role of refugia andclimate change. Science 335:1317–1321.
47. Hansen J, et al. (2006) Global temperature change. Proc Natl Acad Sci USA 103:14288–14293.
48. Hunter CM, et al. (2010) Climate change threatens polar bear populations: Astochastic demographic analysis. Ecology 91:2883–2897.
49. Wiig Ø, Aars J, Born EW (2008) Effects of climate change on polar bears. Sci Prog 91:151–173.
50. Patterson N, Richter DJ, Gnerre S, Lander ES, Reich D (2006) Genetic evidence forcomplex speciation of humans and chimpanzees. Nature 441:1103–1108.
51. MacDonald GM (2010) Global warming and the Arctic: A new world beyond the reachof the Grinnellian niche? J Exp Biol 213:855–861.
52. Kelly BP, Whiteley A, Tallmon D (2010) The Arctic melting pot. Nature 468:891.53. Li H, Durbin R (2009) Fast and accurate short read alignment with Burrows-Wheeler
transform. Bioinformatics 25:1754–1760.54. Harris RS (2007) Improved pairwise alignment of genomic DNA. PhD dissertation
(Pennsylvania State Univ, University Park, PA).55. Drummond AJ, Rambaut A (2007) BEAST: Bayesian evolutionary analysis by sampling
trees. BMC Evol Biol 7:214.56. Woolley S, Johnson J, Smith MJ, Crandall KA, McClellan DA (2003) TreeSAAP:
Selection on amino acid properties using phylogenetic trees. Bioinformatics 19:671–672.
57. Peakall R, Smouse PE (2006) GENALEX 6: Genetic analysis in Excel. Population geneticsoftware for teaching and research. Mol Ecol Notes 6:288–295.
58. Pritchard JK, Stephens M, Donnelly P (2000) Inference of population structure usingmultilocus genotype data. Genetics 155:945–959.
59. Adzhubei IA, et al. (2010) A method and server for predicting damaging missensemutations. Nat Methods 7:248–249.
E2390 | www.pnas.org/cgi/doi/10.1073/pnas.1210506109 Miller et al.