Embed Size (px)
Citation preview

1
Polarization and Dielectric Study of Methylammonium Lead Iodide Thin Film
to Reveal its Non-Ferroelectric Nature under Solar Cell Operating Conditions
Md Nadim Ferdous Hoque,1 Mengjin Yang,2 Zhen Li,2 Nazifah Islam,1 Xuan Pan,3 Kai Zhu,2* and
Zhaoyang Fan1*
1 Department of Electrical and Computer Engineering and Nano Tech Center, Texas Tech
University, Lubbock, Texas, 79409, USA
2 Chemistry and Nanoscience Center, National Renewable Energy Laboratory, Golden, Colorado
80401, USA
3 Beijing Institute of Hydrogeology and Engineering Geology, Haidian, Beijing, 100195, China
* Contact email: [email protected]; [email protected]
Abstract
Researchers have debated whether methylammonium lead iodide (MAPbI3), with a perovskite
crystal structure, is ferroelectric and therefore contributes to the current-voltage hysteresis
commonly observed in hybrid perovskite solar cells (PSCs). We thoroughly investigated
temperature-dependent polarization, dielectric, and impedance spectroscopies, and we found no
evidence of ferroelectric effect in a MAPbI3 thin film at normal operating conditions. Therefore,
the effect does not contribute to the hysteresis in PSCs, whereas the large component of ionic
migration observed may play a critical role. Our temperature-based polarization and dielectric
studies find that MAPbI3 exhibits different electrical behaviors below and above ca. 45 oC,
suggesting a phase transition around this temperature. In particular, we report the activation
energies of ionic migration for the two phases and temperature-dependent permittivity of MAPbI3.
This study contributes to understanding the material properties and device performance of hybrid
perovskites.

2
TOC Graphic

3
Organic-inorganic perovskite solar cells (PSCs), particularly those based on
methylammonium lead iodide (MAPbI3), have shown rapid growth, with efficiencies exceeding
20%.1 They are challenging existing silicon-based solar cell technology with their simple solution
process, low fabrication cost, and possibilities of stacking with other cells for tandem structures.
Along with exciting progress in terms of device efficiency, PSCs are also facing issues related to
their practical application and are under careful scrutiny. One such issue is the so-called current
density-voltage (J-V) hysteresis phenomenon that provides a nominal efficiency depending on how
the J-V measurement is conducted.2 Many studies have reported an understanding of the possible
nature of the hysteresis mechanism,3-11 such as the ferroelectric effect,12 ion migration,3 trapping
of electronic carriers at interfaces,13 and others, as was recently reviewed.14 Each of these proposed
mechanisms has strengths and weaknesses in explaining the hysteresis behavior. Further studies
are necessary to understand many unresolved issues that may govern J−V hysteresis and to guide
the PSC design to overcome this adverse phenomenon.
Considering the commonly observed ferroelectric property of many inorganic perovskites
in their tetragonal phase, it is intriguing to explore whether hybrid perovskites are ferroelectrics
that contribute to J-V hysteresis.12,15,16 From the perspective of perovskites with tetragonal crystal
structure, the polarization of MAPbI3 could be due to three components: (1) ionic polarization by
the off-center shift of Pb in the PbI6 octahedral,15 (2) ionic polarization by the displacement of the
positive charge center (MA+) from the negative charge center (PbI3-), and (3) the orientation
polarization of the MA+ dipole.6 Conclusions from different publications, based on macroscopic
polarization-electric field (P-E) measurements,5,12,17 microscopic probing of ferroelectric
domains,16,17 or first-principles calculations,6,15,18,19 are still being debated. At least three factors
may contribute to this unsolved issue. First, MA+ groups at room temperature exhibit strongly
dynamic disorder20 that could invalidate the assumption in the first-principles calculations and lead
to zero averaged polarization in a macro scale, even though a dipole moment might be formed at
the unit-cell scale.6 Second, as a narrow-bandgap semiconductor, MAPbI3 thin films investigated
typically contain a high density of charge carriers with reasonable high mobility. Such samples
contribute a large conduction current during polarization measurements that may obscure the
observation of a small remnant polarization—if one does exist.5 Third, the ionic conduction and
its related capacitance will further complicate the analysis of the P-E loop. Therefore, further

4
experimental studies are still needed to determine unambiguously if MAPbI3 polycrystalline thin
films have a ferroelectric property that could possibly contribute to the J-V hysteresis of PSCs.
A ferroelectric material shows characteristic signatures in electric-field-dependent
polarization studies and temperature-dependent dielectric spectroscopy.21 For typical perovskite-
structure-based ferroelectrics (e.g., perovskite oxide), in the phase transition from the high-
temperature paraelectric cubic phase to the low-temperature ferroelectric tetragonal phase, the P-
E and the related C-E (C: capacitance) curves also change correspondingly, giving an indication
of a paraelectric to ferroelectric transition. The temperature of a MAPbI3 layer in an encapsulated
PSC can easily reach more than 60 oC under typical terrestrial operating conditions, while the
phase transition of MAPbI3 from a tetragonal to cubic structure occurs in this temperature range.
Thus, it is also important to understand the effect of temperature on the possible ferroelectric
property change and its impact on the J-V hysteresis behavior. Observation of the P-E loop change
across the phase transition may also provide clues in determining whether a ferroelectric feature
exists. Various measurements20,22,23 have shown evidence of a MAPbI3 phase change in the broad
temperature range of 42 oC~57 oC.22 Correspondingly, the electrical and optoelectrical properties
of perovskites, including the dielectric constant,24 have been reported as having a clear temperature
dependence.25-27 However, the polarization response of MAPbI3 perovskite is still unknown in the
typical PSC operating temperature range, and a temperature-based polarization study should
provide useful information. Moreover, ferroelectric (and antiferroelectric) polar materials also
show typical signatures in dielectric spectroscopy.21 Particularly, when approaching the phase
transition temperature TC from high-temperature paraelectric to low-temperature ferroelectric, the
dielectric constant will strongly increase and then decrease again below TC. Therefore, the
dielectric constant and loss tangent will exhibit a characteristic peak or jump in their temperature
dependence. Thus, temperature-dependent dielectric spectroscopy provides another approach to
verify the possible occurrence of ferroelectricity in hybrid perovskites.
In this work, we thoroughly investigated a temperature-dependent P-E loop, and we
conducted remnant polarization measurements using two different Positive(P)-Up(U)-
Negative(N)-Down(D), or PUND, methods. Polarization studies were further corroborated by
temperature-dependent impedance and dielectric spectroscopies. All the polarization and dielectric
measurements were done under dark condition to exclude the effect of any photo-induced carrier
generation or recombination. Even though our macroscale studies could not exclude the possibility

5
of ferroelectricity at nanoscale—and particularly at low temperature—we conclude that MAPbI3
thin films used in PSCs exhibit no apparent ferroelectric property at the normal solar cell operating
temperatures (10 oC−70 oC). Therefore, ferroelectricity is not a mechanism that contributes to the
J-V hysteresis in PSCs. Temperature-based studies reveal that MAPbI3 exhibits different electrical
behaviors below and above ca. 45 oC, suggesting the phase transition around such a temperature.
We found significant ionic conduction, and we report the activation energies of ionic migration
for the two phases. Ionic conduction and its related capacitance contribute to the asymmetric
features in the P-E loop. The results unambiguously exclude ferroelectricity as one factor in
governing the PSC hysteresis, whereas ionic migration contributes, if not exclusively, to the
hysteresis.
The perovskite solar cell exhibits typical hysteresis in J-V measurements when comparing
the data taken from forward scan and reverse scan at various rates. As shown in Fig. S1 in the
Supplementary Information (SI), the J-V curves of a typical cell exhibit similar short-circuit
current density (Jsc) but less open-circuit voltage (Voc) for forward scans compared to the reverse
scans, resulting in a power conversion efficiency of 15.78% (reverse scans) to 10.67% (forward
scans). To determine if MAPbI3 is a ferroelectric that contributes such hysteresis in PSCs, we
studied MAPbI3 thin films directly sandwiched between fluorine-doped tin oxide (FTO) and Au
contacts, to avoid the potential effects of hole and electron transport layers in the polarization
measurements. After cleaning the FTO glass properly, a perovskite layer was deposited by the
anti-solvent method in a spin-coating process.28,29 Large crystallites of several hundred nanometers
can be noticed from the top view of the scanning electron microscope (SEM) imaging of the
perovskite layer (Fig. 1a). The inset is the SEM cross-sectional view of the perovskite layer
sandwiched between the FTO and Au contact. The X-ray diffraction (XRD) pattern of the
perovskite film (Fig. 1b) also suggests good crystallinity of the material in its tetragonal phase.
The polycrystalline feature ensures that the ferroelectric polarization will be detected along the
out-of-plane (vertical) orientation used in our measurements, if it does exist. For all the
measurements, devices from the same batch were used to maintain conformity in various
characterizations.

6
To determine if MAPbI3 is a ferroelectric material, we first measured its P-E hysteresis
loop. Figure 1c is the schematic of our experimental setup that measures polarization charges
through current integration. Unlike the conventional Sawyer-Tower configuration (Fig. S2), which
may introduce error by the “back voltage” on the sensing capacitor,30 the instrument we used is
based on a virtual ground configuration to minimize potential errors. As illustrated schematically
in Fig. S3, when driven by a triangular waveform pulse, the measured polarization charge in time
domain or its dependence on electric field exhibits characteristic profiles for ideal ferroelectrics,
dielectrics, and conductors. Their field-dependent differential capacitance, 𝐶𝐶 = 𝑑𝑑𝑑𝑑 𝑑𝑑𝑑𝑑⁄ , can also
be obtained.
Figure 1. (a) SEM image of the surface of MAPbI3 film. The inset shows a cross-sectional view of the sample with MAPbI3 (blue) being sandwiched between FTO (green) and Au (yellow). The scale bar is 200 nm. (b) The XRD pattern of the MAPbI3 sample on FTO, indicating the polycrystalline feature. (c) Schematic of the polarization measurement setup under controlled sample temperature.
Figure 2a is a representative polarization loop measured for the MAPbI3 perovskite sample
when driven by a triangular waveform pulse with 30 ms pulse width and voltage amplitude of 1.2
V (corresponding to a field of 40 kV/cm). Measurements at other pulse frequencies are shown in
Fig. S4 with similar loop profile. Referring to Fig. S3, no obvious features of a ferroelectric
material can be noticed, whereas the polarization loop seems more like a non-linear conductor-like
parabolic shape. One common practice to identify a ferroelectric feature from the P-E loop when
a large leakage current component dominates is to study the differential capacitance, 𝐶𝐶 = 𝑑𝑑𝑑𝑑 𝑑𝑑𝑑𝑑⁄ ,
10 15 20 25 30 35 40 45 50
(314
)(2
24)
(312
)(2
20)
(202
)(2
11)
Inte
nsity
(arb
. uni
t)
2θ (degree)
(110
)
(112
)
�
�

7
which is also plotted in the same figure. Again, no signatures of ferroelectric capacitance can be
identified from the C-E plot. We also did measurements (not shown here) under a voltage of up to
3 V, or a field up to 100 kV/cm, and did not observe any features of nonlinear polarization
switching. On the other hand, the parabolic-like shape indicates a dominant conducting current.
The polarization curve in Fig. 2a shows asymmetric behavior, for the positive and negative voltage
triangular pulse, i.e., traces 1−2 vs 3−4, and in each triangular pulse, i.e., trace 1 vs 2, and trace 3
vs. 4, unlike the symmetric curve shown in Fig. S3b for an ideal conductor. In particular, a
polarization gap opens up in the loop at 0 V. Such a polarization loop can be approximately
simulated by linear resistance and capacitance circuits, shown in Fig. 2b. In this simulation, we
select R1 = 47 kΩ, C1 = 0.26 nF, R2 = 145 kΩ, and C2 = 0.34 μF, the values extracted from
impedance measurement that will be discussed later. It is observed that when C1 is connected in
parallel to R1, the symmetric mouth-shaped loop of an ideal resistor will be tilted. However, to
open up a gap in the loop, a series-connected branch R2 and C2 has to be introduced, which is
further connected in parallel with R1//C1. As will be discussed in Fig. 4c, R1 can be modeled as the
normal electron-conducting resistance in the MAPbI3 perovskite film (Re), and C1 as the film bulk
capacitance (Cbulk), whereas R2 and C2 can be treated as ionic conduction resistance (Rion) and its
related capacitance (Cion). From the polarization loop and the capacitance behavior, it is safe to
conclude that the measured polarization response comes from a combination of conducting current
along with dielectric and other capacitances. No obvious features are observed of a ferroelectric
material, either remnant polarization in the P-E loop, or spike in the C-E plot. In addition, we noted
that neither changing the frequency nor the applied electric field range results in so-called “S”-
shaped polarization, which was attributed as a feature of ferroelectric MAPbI3.12 The same non-
ferroelectric loop was observed for the Au/MAPbI3/PEDOT:PSS/ITO structure6 and thus rules out
the dependence of our observation on the device structure.
8
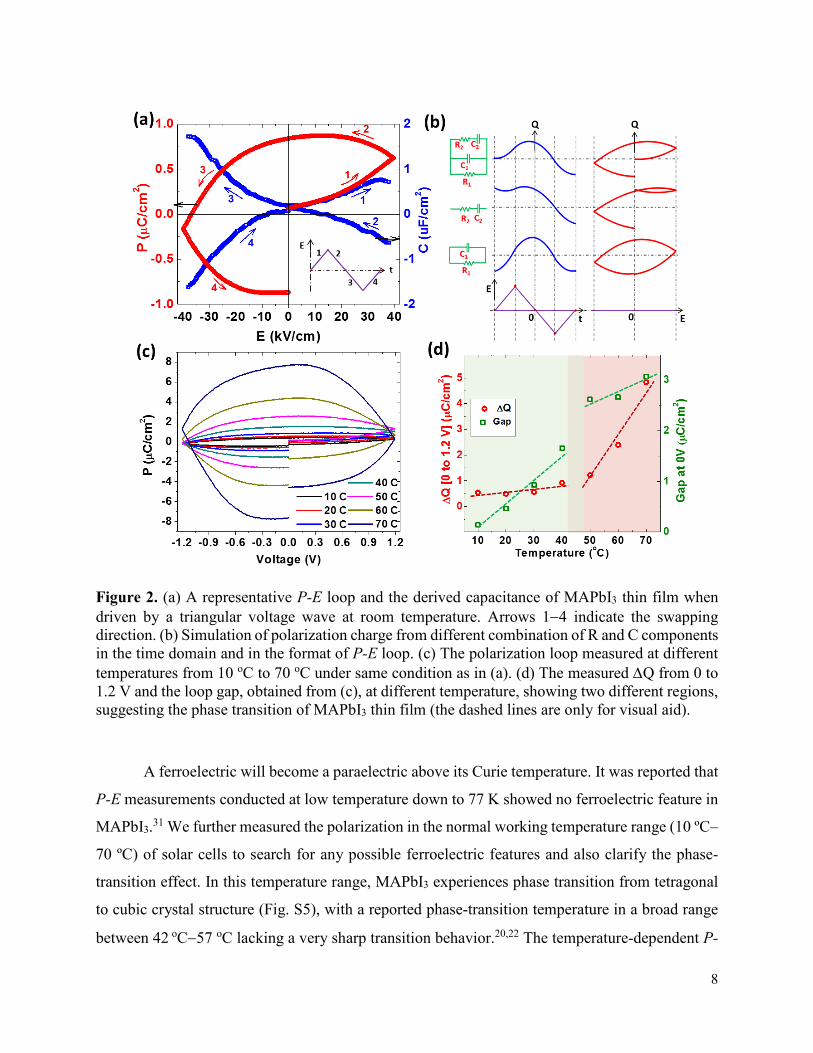
Figure 2. (a) A representative P-E loop and the derived capacitance of MAPbI3 thin film when driven by a triangular voltage wave at room temperature. Arrows 1−4 indicate the swapping direction. (b) Simulation of polarization charge from different combination of R and C components in the time domain and in the format of P-E loop. (c) The polarization loop measured at different temperatures from 10 oC to 70 oC under same condition as in (a). (d) The measured ∆Q from 0 to 1.2 V and the loop gap, obtained from (c), at different temperature, showing two different regions, suggesting the phase transition of MAPbI3 thin film (the dashed lines are only for visual aid).
A ferroelectric will become a paraelectric above its Curie temperature. It was reported that
P-E measurements conducted at low temperature down to 77 K showed no ferroelectric feature in
MAPbI3.31 We further measured the polarization in the normal working temperature range (10 ºC–
70 ºC) of solar cells to search for any possible ferroelectric features and also clarify the phase-
transition effect. In this temperature range, MAPbI3 experiences phase transition from tetragonal
to cubic crystal structure (Fig. S5), with a reported phase-transition temperature in a broad range
between 42 oC−57 oC lacking a very sharp transition behavior.20,22 The temperature-dependent P-

9
E loops are shown in Fig. 2c. Again, no ferroelectric behavior can be identified. As temperature
increases, the measured polarization charges increase as conducting current becomes large, but
their parabolic profiles have no change. This suggests that from the high-temperature cubic crystal
structure to the low-temperature tetragonal structure, a transition from paraelectric to ferroelectric
does not occur. Despite no sharp boundary, we observed that for temperatures below ca. 40 oC,
polarization charges only increase slightly with temperature, whereas above that temperature, this
increment rate becomes larger. We attribute this phenomenon to the crystal phase transition of
MAPbI3 perovskite that results in conductivity and capacitance change. To quantify the measured
charge change with temperature, the charge generated between 0 to 1.2 V, ∆Q, and polarization
gap at different temperatures are plotted in Fig. 2(d). The graph indicates two different regions
with a boundary between 40 oC and 50 oC. This can be considered as the phase-transition
temperature range of MAPbI3 samples measured by polarization loop.
The ferroelectric polarization from MAPbI3 could be small, if it does exist. Therefore, its
contribution in the P-E loop may be hidden in the dominant effect of conducting current, and may
not be identified easily from the above polarization measurement. To further detect the possible
ferroelectric polarization, we explored two different PUND methods. The conventional PUND
method using sine pulses is shown schematically in Fig. S6a.32 In this technique, the charge
contributed from the conduction current is assumed to be the same with a small value for the P and
U pulses; therefore, during pulse U, only the conduction charge is measured, which is deducted
from the total charge measured in pulse P to obtain the remnant polarization Pr. The same is true
for the N and D pulses. Using this method, the measured results at room temperature are shown in
Fig. S6b. A zero remnant polarization charge was measured.
Conduction current could have hysteresis. So for more accurate PUND measurement
without assuming equal conducting current in the two pulses, we further adopted the approach in
Ref. 33, which is shown schematically in Fig. 3a, where driving pulses are in rectangular shape
(constant field). For a leaky ferroelectric, the measured polarization charge consists of ferroelectric
polarization PF, dielectric polarization PD, and charges from conduction current flow QC. Here, a
negative poling pulse (not shown) was first applied to initialize the sample into the state of –PF.
The driving P pulse causes an abrupt ferroelectric polarization inversion that generates a total
polarization charge of 2PF in the sensing circuit; it remains constant until a negative pulse (not

10
shown) is applied. The P pulse also abruptly produces a constant dielectric polarization PD that
disappears at the end of each pulse. Here, PT is defined as the sum of 2PF and PD. In the duration
of the P pulse, the field also produces a conduction current through the sample, generating a time-
dependent QC. For the very leaky MAPbI3 sample, the transient period for capacitive charging will
be much shorter; on the other hand, the possible ionic screening effect may be neglected on a
timescale of sub-milliseconds.34 Therefore, a constant conduction current will produce a linearly
increased QC with time. As shown schematically, from the measured response, which is the sum
of three polarization contributions, ferroelectric polarization can be determined as PF = (PT - PD)/2
from a single pulse measurement. Our measured results, with sub-millisecond driving pulses, are
shown in Fig. 3b. Again, a trivial ferroelectric polarization, with an upper limit of 5 nC/cm2, which
is comparable with noise level, was measured for both P and U pulses. Furthermore, neither the
temperature-dependent measurement nor voltage-dependent measurement, as shown in Fig. S7,
suggests the existence of a ferroelectric component.
Figure 3. (a) Schematic showing the method of how to determine the ferroelectric polarization PF. Here, after each pulse, the measured charge is not reset to zero. (b) The measured results that give a trivial PF value for both P and U pulses.

11
Figure 4. (a) Dependence of dielectric constant and loss tangent with temperature at specific frequencies. (b) Spectra of dielectric constant, dielectric loss, and loss tangent at different temperatures. (c) Conductivity contribution from ionic and electronic species in the perovskite at different temperatures. The inset shows the equivalent circuit to model the impedance spectrum.
Further, we measured the impedance spectra (Fig. S8) of the sample in a temperature range
of 10 oC−70 oC, from which we derived the frequency-dependent dielectric constant(𝜀𝜀𝑟𝑟′ ), dielectric
loss(𝜀𝜀𝑟𝑟′′), loss tangent (𝜀𝜀𝑟𝑟′′/𝜀𝜀𝑟𝑟′ ), and conductivity (𝜎𝜎′). To find the possible presence of ferroelectric
behavior, temperature dependence of dielectric constant and loss tangent at several selected
frequencies are plotted in Fig 4a. It is known that a peak in dielectric constant and loss tangent is
a characteristic of a ferroelectric material when crossing its ferroelectric-paraelectric phase
transition (Tc).21,35,36 However, no such peaks, either sharp or broad, were found in the temperature
range of 10 oC–70 oC, which covers the tetragonal-cubic phase transition temperature range. This
further supports the lack of a ferroelectric feature observed in MAPbI3 thin films in the polarization
studies. Moreover, two different regions, below 40 oC and above 50 oC, can be observed,
1 Hz 10 Hz 102 Hz 103 Hz 104 Hz
102
103
10 20 30 40 50 60 70
10-1
100
101
ε' r
tan
δ
Temperature (oC)
(b)Lo
ss T
ange
nt(ta
n δ )
Diel
ectri
c Co
nsta
nt (ε
' r)

12
suggesting the phase change across the regions. The temperature dependence of dielectric loss and
conductivity (Fig. S9) also suggests a phase transition between 40 oC−50 oC. Figure 4b shows
frequency spectra of dielectric constant, dielectric loss, and loss tangent. Unusually high values of
𝜀𝜀𝑟𝑟′ , similar to those in Refs. 37,38, can be seen at low frequencies (970 at 1 Hz and 30 oC), which
dramatically decrease by more than one order at higher frequencies. Such a strong dependence of
dielectric permittivity, particularly at low frequencies, is not a favorable sign of a ferroelectric
nature of the material. At low frequencies, the value of 𝜀𝜀𝑟𝑟′ increases with temperature, whereas at
high frequencies the trend is opposite but at a much smaller rate. This low-/high-frequency
boundary is at ~103 Hz for our MAPbI3 thin film. The dielectric loss 𝜀𝜀𝑟𝑟′′ shows a 1/f behavior for
frequencies below a few kHz, following the so-called Jonscher’s law, which accurately reveals the
ionic conductivity of the material.39,40 As temperature increases, a small and wide shoulder
(indicated by the arrow in Fig. 4b) begins to appear and shifts toward higher frequency with
temperature. Such a behavior is typical for relaxation processes, found in the generic Debye
expression of permitivity.37 Considering the low frequency and broad peak feature, this relaxation
process could be a Maxwell-Wagner type interfacial polarization relaxation, possibly attributed to
grain boundary effects or blocking at the contacts. The dielectric loss tangent of the material was
found to be high at lower frequencies, especially at lower temperature. The peak value of loss
tangent shifts toward higher frequency as the temperature is increased (~1 Hz for 10 oC to ~200
Hz for 70 oC). Moreover, the loss tangent starts increasing with temperature at >100 Hz, and below
this frequency the loss tangent decreases with increasing temperature. More work is expected to
be done in the future to understand this phenomenon.
As shown in Fig. S8, the Nyquist plots of impedance spectra exhibit two distinct charge-
transport regimes associated with two semicircles. This is particularly obvious at higher
temperatures. The first semicircle in the high-frequency regime arises from fast electron transport,
whereas the second semicircle in the low-frequency regime may be attributed to slow ionic
migration to the contact interface. Different models have been applied to fit the spectra to gain
insight on the physical processes. Here, we employ the model previously used by Yang et al.38 and
Beilsten-Edmands et al.5 in their studies of perovskite materials, to explain our measured data. It
is understood that this simplified model will not capture all the subtleties but does explain the
dominant processes. As shown by the equivalent circuit (inset of Fig. 4c), this model considers
contributions from both electrons and mobile ions.38 Here, Re represents electronic resistances, and

13
the ionic migration effects are modelled as a series RionCion branch in parallel to the electronic
processes. The series Cion is used to model the contact blocking of mobile ions. The geometric and
chemical capacitances (excluding ionic effects) are represented by Cbulk. The fitting curves to the
original measurements are shown in Fig. S10. After plotting the various ionic and electronic
elements of the equivalent circuit against temperature, we observed a clear change of Rion and Re
resistivity as shown in Fig. S11. Cion also showed one order of change from 10 oC to 70 oC whereas
Cbulk did not change significantly. Two different regimes for all these four parameters, although
with weak contrast, can still be differentiated. This gives an indication of a soft phase transition at
a temperature between 40 oC and 50 oC, consistent with the measurement of polarization. Both
these results confirm a similar trend of charge-conduction change between two phases. The
Arrhenius plot of the extracted ionic conductivity is shown in Fig. 4c, from which the thermal
activation energy for ionic conductivity in the MAPbI3 sample was derived. In the low-temperature
tetragonal phase, an activation energy for ionic migration was found to be 0.69 ± 0.02 eV, whereas
it was 0.47 ± 0.06 eV in the high-temperature cubic phase. Our results are roughly in line with
recent calculations by Eames et al.,4 who reported a migration activation energy for I- vacancy of
0.58 eV and for MA+ of 0.84 eV, and by Haruyama et al.,41 who reported values of 0.44 and 0.57
eV, respectively, in a tetragonal cell. In another study, Azpiroz et al.11 calculated 0.5 eV for MA+
ion migration. We further noticed that Yang et al.38 experimentally measured an activation energy
of 0.43 eV, attributed to I- migration. But these theoretical and experimental studies did not report
the activation energy differences between two phases. We speculate that the two different slopes
(two different activation energies) in the Arrhenius plot were caused by the phase transition with
cell volume change and atomic configuration distortion. Interestingly, it is further noticed from
Fig. 4c that the electronic conductivity increases in the cubic phase more dramatically when
compared to the tetragonal phase, suggesting a larger bandgap in the cubic phase. It was previously
reported that the bandgap may be reduced from the tetragonal phase to cubic phase.20 However,
our reflection spectra-based measurements, as shown in Fig. S12, indicate a positive bandgap
change with temperature dEg/dT, in contrasting to most common semiconductors. This
phenomenon was recently reported.26,42 Although there is no clear-cut phase transition from the
bandgap measurement, we can still observe a larger dEg/dT in the high-temperature regime (cubic
phase).

14
Ferroelectrics exhibit essential characteristic signatures in field-dependent polarization
measurements and in temperature-dependent dielectric spectra across the phase transition.
However, in our systematic polarization measurements and dielectric spectroscopic study, no
signatures were detected; but we found significant ionic conduction. Our results suggest that
MAPbI3 thin films do not exhibit ferroelectricity at a macroscale in the normal solar cell working
temperature range. Other reports at low temperature31 also did not find any ferroelectric
characteristic. Recent theoretical studies6 suggest that for MAPbI3, the off-center motion of Pb in
the PbI6 octahedral is trivial, in contrast to previous calculations that included a large off-center
motion component;15 therefore, only a small ferroelectric polarization could exist, contributed
mainly by MA+ group. However, the dynamic orientation disorder of the MA+ group at normal
operating temperatures may result in an average zero polarization at a macro scale, even though a
dipole moment may exist in a unit cell or at nanoscale. Our different measurements confirm that
no net remnant polarization exists in MAPbI3 thin film at macroscales in the PSC normal operating
temperature range. Therefore, the hysteresis phenomenon in PSCs is not caused by a ferroelectric
effect, but most likely is a result of ionic migration-related processes, with or without electron
trapping.3,4,14,43 To gain further insight on the relationship between ionic conductivity and PSC
hysteresis, temperature-dependent J−V curve hysteresis of PSC was measured, as shown in Figure
S13, indicating the hysteresis decreases when the temperature is increased from 20 to 70 oC. This
observation agrees with two recent studies,44,45 and is consistent with our observed faster ionic
migration at higher temperature (Figure 4c), further suggesting the critical role of ionic migration
in PSC hysteresis.
In summary, we studied polarization, dielectric, and impedance spectroscopies of MAPbI3
perovskite at the normal operating temperature range. We found that large conduction currents and
capacitive effects govern the measured polarization charges in MAPbI3 thin films, along with a
small contribution from dielectric polarization. Polarization depends on temperature and shows
clear evidence of phase transition. A set of thorough macroscale polarization measurements,
corroborated by temperature-dependent dielectric spectroscopic study, reveals the absence of
ferroelectricity in MAPbI3 thin films under normal solar cell operating conditions. Therefore,
ferroelectricity is not a factor contributing to the PSC hysteresis problem, but ionic migration, with
15
or without electron trapping, should be a key factor contributing to the hysteresis. Temperature-
dependent studies find that MAPbI3 exhibits different polarization, dielectric, and electrical
behaviors below 40 oC and above 50 oC, suggesting the phase transition from tetragonal to cubic
structure across this temperature range. The activation energies of ionic migration, most likely the
migration of I- vacancies, are reported for the two phases. This study will improve our
understanding of MAPbI3 material properties and may also provide useful information on the
ultimate solution of hysteresis-free PSCs.
ACKNOWLEDGMENTS
Funding for the work at Texas Tech University from the National Science Foundation (CBET-
1438681) is greatly acknowledged. The work at the National Renewable Energy Laboratory was
supported by the U.S. Department of Energy under Contract No. DE-AC36-08-GO28308.
Supporting Information Available:
Experimental details, J-V curve, explanation of polarization curves, crystal structures, polarization
measurements at different conditions, impedance spectra (IS), fitted parameters from IS, and
absorbance spectra.
References
(1) Yang, W. S.; Noh, J. H.; Jeon, N. J.; Kim, Y. C.; Ryu, S.; Seo, J.; Seok, S. I. High-Performance
Photovoltaic Perovskite Layers Fabricated through Intramolecular Exchange. Science 2015, 348, 1234-
1237.
(2) Snaith, H. J.; Abate, A.; Ball, J. M.; Eperon, G. E.; Leijtens, T.; Noel, N. K.; Stranks, S. D.;
Wang, J. T.-W.; Wojciechowski, K.; Zhang, W. Anomalous Hysteresis in Perovskite Solar Cells. J.
Phys. Chem. Lett. 2014, 5, 1511-1515.
(3) Tress, W.; Marinova, N.; Moehl, T.; Zakeeruddin, S.; Nazeeruddin, M. K.; Grätzel, M.
Understanding the Rate-Dependent J–V Hysteresis, Slow Time Component, and Aging in CH3NH3PbI3
Perovskite Solar Cells: The Role of a Compensated Electric Field. Energy & Environ. Sci. 2015, 8, 995-
1004.

16
(4) Eames, C.; Frost, J. M.; Barnes, P. R.; O’regan, B. C.; Walsh, A.; Islam, M. S. Ionic Transport in
Hybrid Lead Iodide Perovskite Solar Cells. Nat. Commun. 2015, 6, 8497.
(5) Beilsten-Edmands, J.; Eperon, G.; Johnson, R.; Snaith, H.; Radaelli, P. Non-Ferroelectric Nature
of the Conductance Hysteresis in CH3NH3PbI3 Perovskite-Based Photovoltaic Devices. Appl. Phys.
Lett. 2015, 106, 173502.
(6) Fan, Z.; Xiao, J.; Sun, K.; Chen, L.; Hu, Y.; Ouyang, J.; Ong, K. P.; Zeng, K.; Wang, J.
Ferroelectricity of CH3NH3PbI3 Perovskite. J. Phys. Chem. Lett. 2015, 6, 1155-1161.
(7) Wu, B.; Fu, K.; Yantara, N.; Xing, G.; Sun, S.; Sum, T. C.; Mathews, N. Charge Accumulation
and Hysteresis in Perovskite‐Based Solar Cells: An Electro‐Optical Analysis. Adv. Energy Mater.
2015, 5, 1500829.
(8) Zhao, C.; Chen, B.; Qiao, X.; Luan, L.; Lu, K.; Hu, B. Revealing Underlying Processes Involved
in Light Soaking Effects and Hysteresis Phenomena in Perovskite Solar Cells. Adv. Energy Mater.
2015, 5, 1500279.
(9) van Reenen, S.; Kemerink, M.; Snaith, H. J. Modeling Anomalous Hysteresis in Perovskite Solar
Cells. J. Phys. Chem. Lett. 2015, 6, 3808-3814.
(10) Zhang, Y.; Liu, M.; Eperon, G. E.; Leijtens, T. C.; McMeekin, D.; Saliba, M.; Zhang, W.; De
Bastiani, M.; Petrozza, A.; Herz, L. M. Charge Selective Contacts, Mobile Ions and Anomalous
Hysteresis in Organic–Inorganic Perovskite Solar Cells. Mater. Horiz. 2015, 2, 315-322.
(11) Azpiroz, J. M.; Mosconi, E.; Bisquert, J.; De Angelis, F. Defect Migration in Methylammonium
Lead Iodide and Its Role in Perovskite Solar Cell Operation. Energy Environ. Sci. 2015, 8, 2118-2127.
(12) Wei, J.; Zhao, Y.; Li, H.; Li, G.; Pan, J.; Xu, D.; Zhao, Q.; Yu, D. Hysteresis Analysis Based on
the Ferroelectric Effect in Hybrid Perovskite Solar Cells. J. Phys. Chem. Lett. 2014, 5, 3937-3945.
(13) Shao, Y.; Xiao, Z.; Bi, C.; Yuan, Y.; Huang, J. Origin and Elimination of Photocurrent Hysteresis
by Fullerene Passivation in CH3NH3PbI3 Planar Heterojunction Solar Cells. Nat. Commun. 2014, 5,
5784.
(14) Chen, B.; Yang, M.; Priya, S.; Zhu, K. Origin of JV Hysteresis in Perovskite Solar Cells. J. Phys.
Chem. Lett. 2016, 7, 905-917.
(15) Frost, J. M.; Butler, K. T.; Walsh, A. Molecular Ferroelectric Contributions to Anomalous
Hysteresis in Hybrid Perovskite Solar Cells. APL Mater. 2014, 2, 081506.
(16) Kutes, Y.; Ye, L.; Zhou, Y.; Pang, S.; Huey, B. D.; Padture, N. P. Direct Observation of
Ferroelectric Domains in Solution-processed CH3NH3PbI3 Perovskite Thin Films. J. Phys. Chem. Lett.
2014, 5, 3335-3339.

17
(17) Xiao, Z.; Yuan, Y.; Shao, Y.; Wang, Q.; Dong, Q.; Bi, C.; Sharma, P.; Gruverman, A.; Huang, J.
Giant Switchable Photovoltaic Effect in Organometal Trihalide Perovskite Devices. Nat. Mater. 2015,
14, 193-198.
(18) Stroppa, A.; Quarti, C.; De Angelis, F.; Picozzi, S. Ferroelectric Polarization of CH3NH3PbI3: A
Detailed Study Based on Density Functional Theory and Symmetry Mode Analysis. J. Phys. Chem.
Lett. 2015, 6, 2223-2231.
(19) Zheng, F.; Takenaka, H.; Wang, F.; Koocher, N. Z.; Rappe, A. M. First-Principles Calculation of
the Bulk Photovoltaic Effect in CH3NH3PbI3 and CH3NH3PbI3–xClx. J. Phys. Chem. Lett. 2014, 6, 31-
37.
(20) Baikie, T.; Fang, Y.; Kadro, J. M.; Schreyer, M.; Wei, F.; Mhaisalkar, S. G.; Graetzel, M.; White,
T. J. Synthesis and Crystal Chemistry of the Hybrid Perovskite (CH3NH3)PbI3 for Solid-State
Sensitised Solar Cell Applications. J. Mater. Chem. A 2013, 1, 5628-5641.
(21) Lines, M. E.; Glass, A. M.: Principles and Applications of Ferroelectrics and Related Materials;
Oxford university press: New York, U.S.A.; 1977.
(22) Milot, R. L.; Eperon, G. E.; Snaith, H. J.; Johnston, M. B.; Herz, L. M. Temperature‐Dependent
Charge‐Carrier Dynamics in CH3NH3PbI3 Perovskite Thin Films. Adv. Funct. Mater. 2015, 25, 6218-
6227.
(23) Labram, J. G.; Fabini, D. H.; Perry, E. E.; Lehner, A. J.; Wang, H.; Glaudell, A. M.; Wu, G.;
Evans, H.; Buck, D.; Cotta, R. Temperature-Dependent Polarization in Field-Effect Transport and
Photovoltaic Measurements of Methylammonium Lead Iodide. J. Phys. Chem. Lett. 2015, 6, 3565-
3571.
(24) Onoda-Yamamuro, N.; Matsuo, T.; Suga, H. Dielectric Study of CH3NH3PbX3 (X= Cl, Br, I). J.
Phys. Chem. Solids 1992, 53, 935-939.
(25) Jiang, Y.; Soufiani, A. M.; Gentle, A.; Huang, F.; Ho-Baillie, A.; Green, M. A. Temperature
Dependent Optical Properties of CH3NH3PbI3 Perovskite by Spectroscopic Ellipsometry. Appl. Phys.
Lett. 2016, 108, 061905.
(26) Foley, B. J.; Marlowe, D. L.; Sun, K.; Saidi, W. A.; Scudiero, L.; Gupta, M. C.; Choi, J. J.
Temperature Dependent Energy Levels of Methylammonium Lead Iodide Perovskite. Appl. Phys. Lett.
2015, 106, 243904.
(27) Yamada, Y.; Nakamura, T.; Endo, M.; Wakamiya, A.; Kanemitsu, Y. Near-Band-Edge Optical
Responses of Solution-Processed Organic–Inorganic Hybrid Perovskite CH3NH3PbI3 on Mesoporous
TiO2 Electrodes. Appl. Phys. Express 2014, 7, 032302.

18
(28) Xiao, M.; Huang, F.; Huang, W.; Dkhissi, Y.; Zhu, Y.; Etheridge, J.; Gray‐Weale, A.; Bach, U.;
Cheng, Y. B.; Spiccia, L. A Fast Deposition‐Crystallization Procedure for Highly Efficient Lead
Iodide Perovskite Thin‐Film Solar Cells. Angew. Chem. 2014, 126, 10056-10061.
(29) Islam, N.; Yang, M.; Zhu, K.; Fan, Z. Mesoporous Scaffolds Based on TiO2 Nanorods and
Nanoparticles for Efficient Hybrid Perovskite Solar Cells. J. Mater. Chem. A 2015, 3, 24315-24321.
(30) Almora, O.; Guerrero, A.; Garcia-Belmonte, G. Ionic Charging by Local Imbalance at Interfaces
in Hybrid Lead Halide Perovskites. Applied Physics Letters 2016, 108, 043903.
(31) Zhao, Y.; Liang, C.; Zhang, H.; Li, D.; Tian, D.; Li, G.; Jing, X.; Zhang, W.; Xiao, W.; Liu, Q.
Anomalously Large Interface Charge in Polarity-Switchable Photovoltaic Devices: An Indication of
Mobile Ions in Organic–Inorganic Halide Perovskites. Energy Environ. Sci. 2015, 8, 1256-1260.
(32) Fukunaga, M.; Noda, Y. New Technique for Measuring Ferroelectric and Antiferroelectric
Hysteresis Loops. J. Phys. Soc. Jpn. 2008, 77, 064706.
(33) Naganuma, H.; Inoue, Y.; Okamura, S. Evaluation of Electrical Properties of Leaky BiFeO3
Films in High Electric Field Region by High-Speed Positive-Up–Negative-Down Measurement. Appl.
Phys. Express 2008, 1, 061601.
(34) Yuan, Y.; Chae, J.; Shao, Y.; Wang, Q.; Xiao, Z.; Centrone, A.; Huang, J. Photovoltaic Switching
Mechanism in Lateral Structure Hybrid Perovskite Solar Cells. Adv. Energy Mater. 2015, 5, 1500615.
(35) Qiao, L.; Bi, X.: Epitaxial Integration of Ferroelectric BaTiO3 with Semiconductor Si: From a
Structure-Property Correlation Point of View. In Ferroelectrics - Material Aspects; Lallart, M., Ed.;
INTECH Open Access Publisher, 2011.
(36) Lunkenheimer, P.; Krohns, S.; Gemander, F.; Schmahl, W.; Loidl, A. Dielectric Characterization
of a Nonlinear Optical Material. Sci. Rep. 2014, 4, 6020.
(37) Juarez-Perez, E. J.; Sanchez, R. S.; Badia, L.; Garcia-Belmonte, G.; Kang, Y. S.; Mora-Sero, I.;
Bisquert, J. Photoinduced Giant Dielectric Constant in Lead Halide Perovskite Solar Cells. J. Phys.
Chem. Lett. 2014, 5, 2390-2394.
(38) Yang, T. Y.; Gregori, G.; Pellet, N.; Grätzel, M.; Maier, J. The Significance of Ion Conduction in
a Hybrid Organic–Inorganic Lead‐Iodide‐Based Perovskite Photosensitizer. Angew. Chem. 2015,
127, 8016-8021.
(39) Jonscher, A. Analysis of the Alternating Current Properties of Ionic Conductors. J. Mater. Sci.
1978, 13, 553-562.
(40) Lin, Q.; Armin, A.; Nagiri, R. C. R.; Burn, P. L.; Meredith, P. Electro-Optics of Perovskite Solar
Cells. Nat. Photonics 2015, 9, 106-112.

19
(41) Haruyama, J.; Sodeyama, K.; Han, L.; Tateyama, Y. First-Principles Study of Ion Diffusion in
Perovskite Solar Cell Sensitizers. J. Am. Chem. Soc. 2015, 137, 10048-10051.
(42) Leong, W. L.; Ooi, Z. E.; Sabba, D.; Yi, C.; Zakeeruddin, S. M.; Graetzel, M.; Gordon, J. M.;
Katz, E. A.; Mathews, N. Identifying Fundamental Limitations in Halide Perovskite Solar Cells. Adv.
Mater. 2016, 28, 2439–2445.
(43) Meloni, S.; Moehl, T.; Tress, W.; Franckevičius, M.; Saliba, M.; Lee, Y. H.; Gao, P.;
Nazeeruddin, M. K.; Zakeeruddin, S. M.; Rothlisberger, U. Ionic Polarization-Induced Current-Voltage
Hysteresis in CH3NH3PbX3 Perovskite Solar Cells. Nat. Commun. 2016, 7, 10334.
(44) Ono, L. K.; Raga, S. R.; Wang, S.; Kato, Y.; Qi, Y. Temperature-Dependent Hysteresis Effects in
Perovskite-Based Solar Cells. J. Mater. Chem. A 2015, 3, 9074-9080.
(45) Yu, H.; Lu, H.; Xie, F.; Zhou, S.; Zhao, N. Native Defect-Induced Hysteresis Behavior in
Organolead Iodide Perovskite Solar Cells. Adv. Funct. Mater. 2016, 26, 1411-1419.