Embed Size (px)
Citation preview
New York City CouncilChristine C. Quinn, Speaker
Finance DivisionPreston Niblack, DirectorJeffrey Rodus, First Deputy Director
Hearing on the Mayor’s Fiscal Year 2011 Executive Budget
Police DepartmentJune 3, 2010
Committee on FinanceHon. Domenic M. Recchia, Jr., Chair
Committee on Public SafetyHon. Peter F. Vallone Jr., Chair
Andy Grossman, Deputy Director, Finance DivisionLionel Francois, Legislative Financial Analyst
Finance Division Briefing Paper Police Department
Page 1
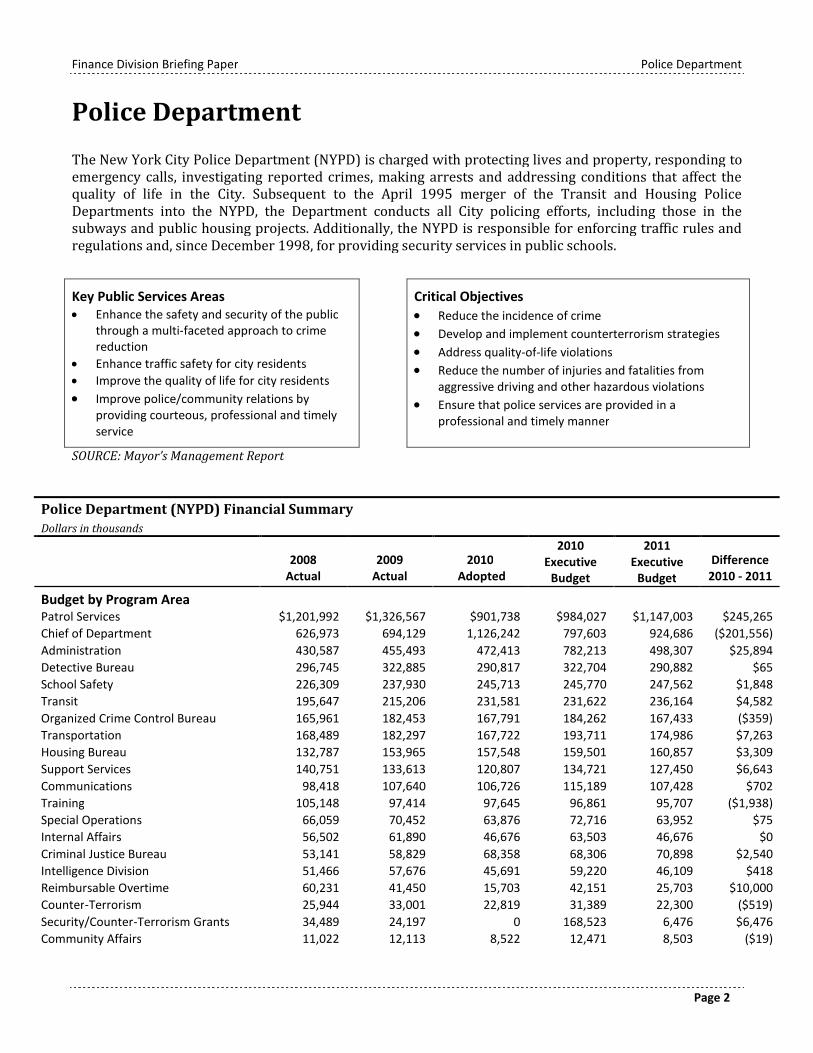
Summary and Highlights
Police Department (NYPD)
Dollars in Thousands
2008Actual
2009Actual
2010Adopted
2010Executive
Plan
2011Executive
Plan
Difference2010 – 2011*
Personal Services $3,804,089 $4,137,610 $4,096,022 $4,297,352 $4,200,344 $104,322
Other Than Personal Services 344,572 331,590 262,366 469,113 268,735 6,369
Total $4,148,661 $4,469,200 $4,358,388 $4,766,465 $4,469,079 $110,691
*Change to appropriation between the 2010 Adopted Budget and the 2011 Executive.
The Fiscal 2011 Executive Budget would constitute an increase over the Department’s Fiscal 2010 AdoptedBudget appropriation of $110.7 million or approximately 2.5 percent: $104.3 million (2.5 percent) to theDepartment’s PS budget and $6.4 million (2.4 percent) to its OTPS budget.
Summary of Major Budget Actions and Other Police Department Issues
Restoration of Uniform Headcount Reduction. The January Plan included a proposal to reduce 892uniform positions through attrition beginning in Fiscal 2011 and into the outyears, to meet theDepartment’s PEG reduction targets. The Executive Budget proposes to restore the $55.4 millionreduction in Fiscal 2011 along with the 892 positions.
Revised Recruit Class Schedule. The Executive Budget proposes to delay the hiring of theDepartment's January 2011 to April of 2011 thus accruing $11.3 million or three months of budgetedsalaries which the Department will use to meet its current reduction target.
Restoration of Uniform Overtime (OT) Reduction. The January Plan included a proposal to reduceuniform overtime expenditures by $25 million in Fiscal 2011 and $50 million in the outyears, to meetthe Department’s PEG reduction targets. The Executive Budget proposes to restore the $25 millionreduction in Fiscal 2010 and $50 million in Fiscal 2011.
Reduction in “Block The Box” Revenue Projections. The Fiscal 2011 Executive Budget revisesprojected revenues from the “Block the Box” traffic enforcement program downward by $43 million inFiscal 2010 and $54.8 million in Fiscal 2011 and Fiscal 2012 to reflect the disappointing ticketingrevenues generated by the program due to greater compliance by motorists.
Pilot Program with the Civilian Complaint Review Board (CCRB). The Department has agreed to apilot program which will allow the CCRB to prosecute cases stemming from complaints againstuniformed officers which the CCRB investigates rather than sending the results of those investigationsto the Department to be tried in the Department’s Trial Room as is currently the procedure.
Trials of Accused 9/11 Terrorists. The decision by the Department of Justice to hold the trials of thefive accused terrorists related to the “9/11 Plot” is currently being reevaluated by DoJ since it has comeunder fire from the local community board as well as local officials. The trials could cost upwards of$200 million annually, according to Commissioner Kelly, and take up to five years to complete (see“Counter-Terrorism” Program section).
Finance Division Briefing Paper Police Department
Page 2
Police Department
The New York City Police Department (NYPD) is charged with protecting lives and property, responding toemergency calls, investigating reported crimes, making arrests and addressing conditions that affect thequality of life in the City. Subsequent to the April 1995 merger of the Transit and Housing PoliceDepartments into the NYPD, the Department conducts all City policing efforts, including those in thesubways and public housing projects. Additionally, the NYPD is responsible for enforcing traffic rules andregulations and, since December 1998, for providing security services in public schools.
Key Public Services Areas Enhance the safety and security of the public
through a multi-faceted approach to crimereduction
Enhance traffic safety for city residents
Improve the quality of life for city residents
Improve police/community relations byproviding courteous, professional and timelyservice
Critical Objectives
Reduce the incidence of crime
Develop and implement counterterrorism strategies
Address quality-of-life violations
Reduce the number of injuries and fatalities fromaggressive driving and other hazardous violations
Ensure that police services are provided in aprofessional and timely manner
SOURCE: Mayor’s Management Report
Police Department (NYPD) Financial Summary
Dollars in thousands
2008Actual
2009Actual
2010Adopted
2010Executive
Budget
2011Executive
Budget
Difference2010 - 2011
Budget by Program AreaPatrol Services $1,201,992 $1,326,567 $901,738 $984,027 $1,147,003 $245,265
Chief of Department 626,973 694,129 1,126,242 797,603 924,686 ($201,556)
Administration 430,587 455,493 472,413 782,213 498,307 $25,894
Detective Bureau 296,745 322,885 290,817 322,704 290,882 $65
School Safety 226,309 237,930 245,713 245,770 247,562 $1,848
Transit 195,647 215,206 231,581 231,622 236,164 $4,582
Organized Crime Control Bureau 165,961 182,453 167,791 184,262 167,433 ($359)
Transportation 168,489 182,297 167,722 193,711 174,986 $7,263
Housing Bureau 132,787 153,965 157,548 159,501 160,857 $3,309
Support Services 140,751 133,613 120,807 134,721 127,450 $6,643
Communications 98,418 107,640 106,726 115,189 107,428 $702
Training 105,148 97,414 97,645 96,861 95,707 ($1,938)
Special Operations 66,059 70,452 63,876 72,716 63,952 $75
Internal Affairs 56,502 61,890 46,676 63,503 46,676 $0
Criminal Justice Bureau 53,141 58,829 68,358 68,306 70,898 $2,540
Intelligence Division 51,466 57,676 45,691 59,220 46,109 $418
Reimbursable Overtime 60,231 41,450 15,703 42,151 25,703 $10,000
Counter-Terrorism 25,944 33,001 22,819 31,389 22,300 ($519)
Security/Counter-Terrorism Grants 34,489 24,197 0 168,523 6,476 $6,476
Community Affairs 11,022 12,113 8,522 12,471 8,503 ($19)
Finance Division Briefing Paper Police Department
Page 3
TOTAL $4,148,661 $4,469,200 $4,358,388 $4,766,465 $4,469,079 $110,691
Funding2008
Actual2009
Actual2010
Adopted
2010Executive
Budget
2011Executive
BudgetDifference
2010 - 2011
City Funds $3,734,724 $4,057,374 $4,036,947 $4,195,273 $4,127,425 $90,477
Memo: Council Initiative Funds* 0 0 0 0 0 $0
Other Categorical 98,911 106,451 69,082 104,486 69,082 $0
Capital- IFA 1,797 1,797 1,797 1,797 1,797 $0
State 20,208 22,229 4,932 21,745 6,232 $1,300
Federal - Other 88,520 57,055 18,254 210,996 34,730 $16,476
Intra City 204,501 224,294 227,376 232,168 229,813 $2,437
TOTAL $4,148,661 $4,469,200 $4,358,388 $4,766,465 $4,469,079 $110,691
Positions
Full-Time Positions - Uniform 35,405 35,641 33,217 34,511 34,413 1,196
Full-Time Positions - Civilian 14,897 15,034 14,166 14,523 14,521 355
TOTAL 50,302 50,675 47,383 49,034 48,934 1,551
*City Council initiative funding normally provides little to none of the Department’s annual City-funds operating budget. ForFiscal 2010, City Council initiative funding represents none of the Department’s city-funded budget allocation.
Expense Budget Summary
When comparing planned spending for the NYPD’s Fiscal 2010 Adopted Budget to that for the Fiscal 2011Executive Budget, the Executive grows by a total of $110.7 million, or 2.7 percent. Approximately 16.5percent of this planned increase ($14.9 million) occurs within the Department’s federal funds while anadditional 81.8 percent ($90.5 million) occurs within the City-funded portion of the Department’s budget.By far, the program areas sustaining the greatest changes to their Fiscal 2010 Adopted Budgetappropriations in the current Fiscal 2011 Executive Budget are “Patrol Services” and “Chief ofDepartment”: the former with a planned increase of $245.3 million (27.2 percent) and the latter sustaininga decrease below its Adopted appropriation of $201.6 million (17.9 percent). Other program-level changesto the Department’s Fiscal 2011 budget include an increase 0f 104 uniformed officers and $5.4 million dueto the hiring of 104 officers in January using federal funds as well as an increase of $2.5 million (7.9percent) in the Intelligence Division which is especially significant in the wake of the recently attemptedbombing in Times Square.
The Executive Plan proposes to restore the 892 uniform positions originally cut in the Fiscal 2011Preliminary Budget. The civilianization proposal hiring 400 new civilians to backfill non-law enforcementfunctions currently being performed by uniformed officers and moving those 400 uniformed officers frombehind the desk and into law enforcement duties will continue as originally proposed. In addition, theExecutive budget proposes to delay the hiring of the January 2011 Academy class to April of 2011 thusaccruing 3 months of budgeted salaries and saving the Department $11.3 million. The Department wouldalso reduce its Cadet Corps classes for Fiscal 2011 to save another $2.3 million as well delayingmaintenance on 425 Department vehicles to save an additional $10.6 million in Fiscal 2011.
Finance Division Briefing Paper Police Department
Page 4
Issue of Note Regarding the Civilian Complaint Review Board (CCRB)
Pilot Program: Extension of Prosecutorial Authority to the CCRB
The Department has agreed to a pilot program which will allow the CCRB to prosecute cases stemmingfrom complaints against uniformed officers which it investigates rather than sending the results of thoseinvestigations (along with its own recommendations) to the Department to be tried in the Department’sTrial Room by Department advocates, and assisting or “second seating” the prosecution of those cases. Incalendar 2009, there were 130 administrative trials, all of which were prosecuted by NYPD advocates. Ofthose, 20 were submitted to the Department by the CCRB. The CCRB’s attorneys served as co-counsels insome of these trials. The pilot is currently scheduled to last for approximately one fiscal year.
The idea of allowing the CCRB to prosecute its own cases dates back to an MOU (Memorandum ofUnderstanding) between the CCRB and the Department issued in 2001 during the Giuliani Administration.At that time, it was stipulated that the trials would be held at OATH (Office of Administrative Trials andHearing). The Patrolman’s Benevolent Association (PBA), the Department’s largest union, challenged theproposed policy and the New York Sate Court of Appeals ruled that disciplinary trials for police officers hadto be held within the Department and that OATH was not a legally permissible venue for these proceedings.Subsequently, political support for the agreement waned and it was never implemented. Other questionsregarding disciplinary trials against police officers have been raised in the intervening years such aswhether resources to enact such a policy would be reallocated from the Department to the CCRB in order toproperly implement the policy and, how large a prospective “Administrative Prosecution Unit” should be inorder to handle the potential caseload. As part of the 2011 Executive budget, the CCRB would hire 4additional staff for Fiscal 2011 to help implement the pilot program.
Summary of Department Headcount Issues
An analysis of historical trends and current budget proposals regarding the NYPD’s uniform headcountrequires the examination of several factors as well as a discussion of the various ways in which headcountis reported and compared.
First, uniform headcount is reported (and discussed) in three basic ways: peak, average and year-end. Alsodiscussed (though less so) are the notions of total headcount, operational strength (the total number ofuniformed officers serving in a capacity requiring law enforcement expertise, as opposed to those servingin “civilianizable” positions not requiring such expertise), enforcement strength (the total number availablefor direct enforcement duty), and patrol strength (the total number available for traditional patrol duty).
Additionally, headcount is reported according to planned funding levels as well as actual levels. The factthat Police Academy hiring classes are designed to allow the Department to reach certain fundedheadcount levels by replacing attrition occurring since the previous class must also be taken into account.This gets more complicated when financial plans alter the budgeted funding levels (either upward ordownward) and when attrition rates differ from those previously planned. Lastly, the change several yearsago from hiring one Academy class annually to having two dramatically altered the peaks and valleys ofagency headcount.
Funded Peak Headcount
In Fiscal 1989, before the Safe Streets/Safe City (SS/SC) program increased uniformed headcount, thebudgeted peak NYPD uniform headcount was 32,037, including officers funded in the pre-merger Transit
Finance Division Briefing Paper Police Department
Page 5
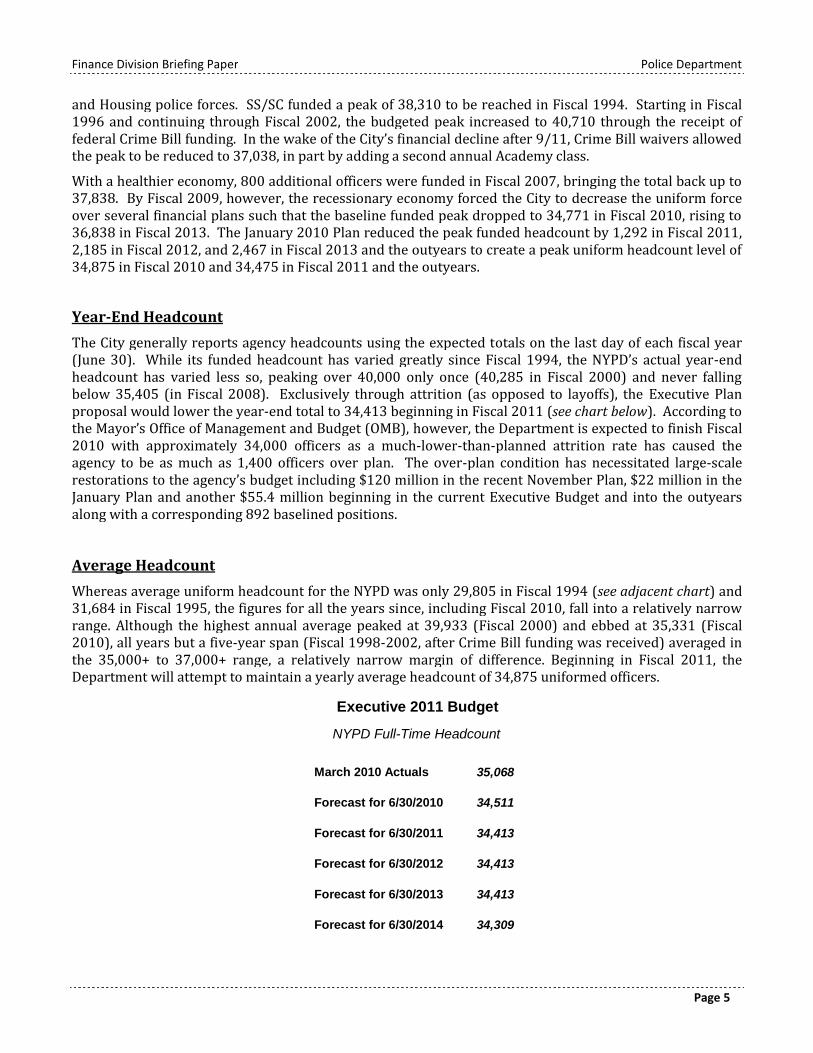
March 2010 Actuals 35,068
Forecast for 6/30/2010 34,511
Forecast for 6/30/2011 34,413
Forecast for 6/30/2012 34,413
Forecast for 6/30/2013 34,413
Forecast for 6/30/2014 34,309
NYPD Full-Time Headcount
Executive 2011 Budget
and Housing police forces. SS/SC funded a peak of 38,310 to be reached in Fiscal 1994. Starting in Fiscal1996 and continuing through Fiscal 2002, the budgeted peak increased to 40,710 through the receipt offederal Crime Bill funding. In the wake of the City’s financial decline after 9/11, Crime Bill waivers allowedthe peak to be reduced to 37,038, in part by adding a second annual Academy class.
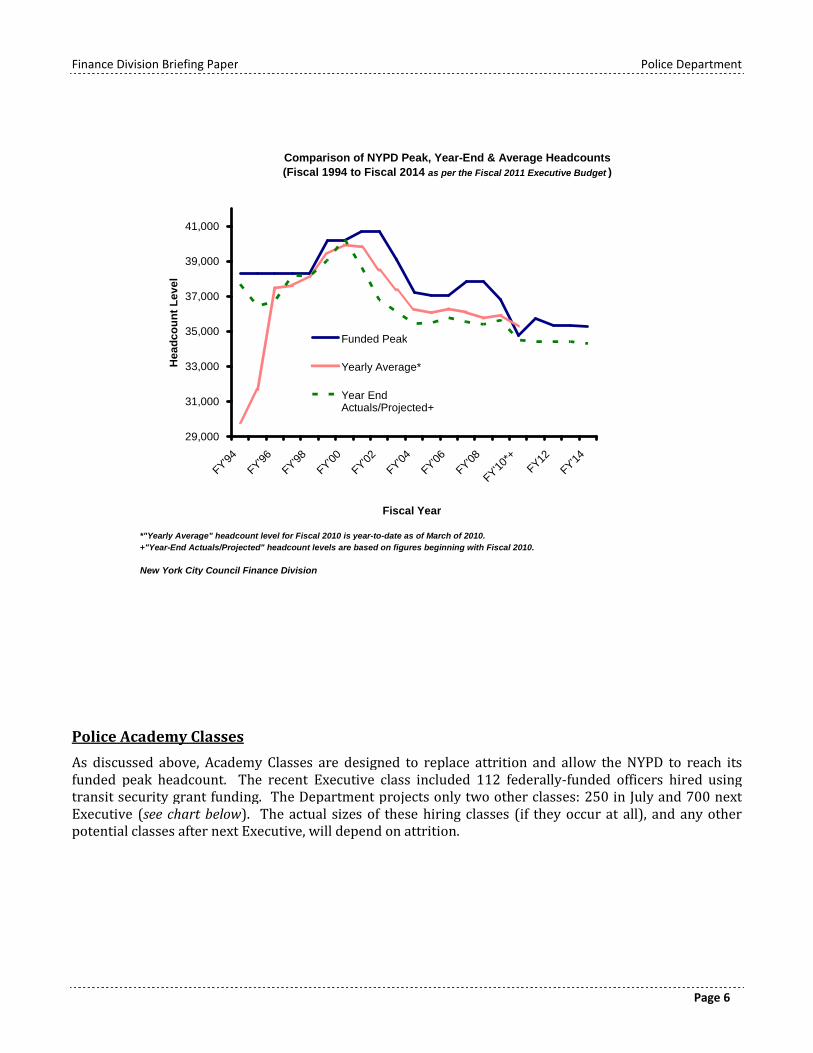
With a healthier economy, 800 additional officers were funded in Fiscal 2007, bringing the total back up to37,838. By Fiscal 2009, however, the recessionary economy forced the City to decrease the uniform forceover several financial plans such that the baseline funded peak dropped to 34,771 in Fiscal 2010, rising to36,838 in Fiscal 2013. The January 2010 Plan reduced the peak funded headcount by 1,292 in Fiscal 2011,2,185 in Fiscal 2012, and 2,467 in Fiscal 2013 and the outyears to create a peak uniform headcount level of34,875 in Fiscal 2010 and 34,475 in Fiscal 2011 and the outyears.
Year-End Headcount
The City generally reports agency headcounts using the expected totals on the last day of each fiscal year(June 30). While its funded headcount has varied greatly since Fiscal 1994, the NYPD’s actual year-endheadcount has varied less so, peaking over 40,000 only once (40,285 in Fiscal 2000) and never fallingbelow 35,405 (in Fiscal 2008). Exclusively through attrition (as opposed to layoffs), the Executive Planproposal would lower the year-end total to 34,413 beginning in Fiscal 2011 (see chart below). According tothe Mayor’s Office of Management and Budget (OMB), however, the Department is expected to finish Fiscal2010 with approximately 34,000 officers as a much-lower-than-planned attrition rate has caused theagency to be as much as 1,400 officers over plan. The over-plan condition has necessitated large-scalerestorations to the agency’s budget including $120 million in the recent November Plan, $22 million in theJanuary Plan and another $55.4 million beginning in the current Executive Budget and into the outyearsalong with a corresponding 892 baselined positions.
Average Headcount
Whereas average uniform headcount for the NYPD was only 29,805 in Fiscal 1994 (see adjacent chart) and31,684 in Fiscal 1995, the figures for all the years since, including Fiscal 2010, fall into a relatively narrowrange. Although the highest annual average peaked at 39,933 (Fiscal 2000) and ebbed at 35,331 (Fiscal2010), all years but a five-year span (Fiscal 1998-2002, after Crime Bill funding was received) averaged inthe 35,000+ to 37,000+ range, a relatively narrow margin of difference. Beginning in Fiscal 2011, theDepartment will attempt to maintain a yearly average headcount of 34,875 uniformed officers.
Finance Division Briefing Paper Police Department
Page 6
Police Academy Classes
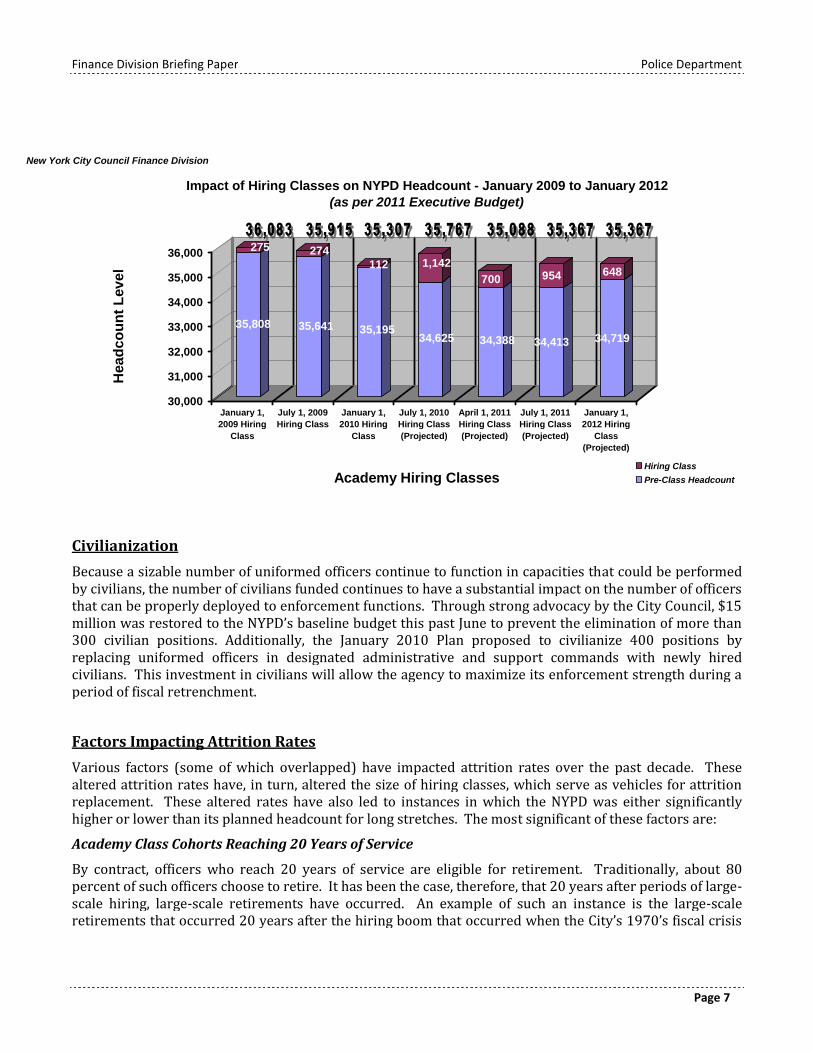
As discussed above, Academy Classes are designed to replace attrition and allow the NYPD to reach itsfunded peak headcount. The recent Executive class included 112 federally-funded officers hired usingtransit security grant funding. The Department projects only two other classes: 250 in July and 700 nextExecutive (see chart below). The actual sizes of these hiring classes (if they occur at all), and any otherpotential classes after next Executive, will depend on attrition.
*"Yearly Average" headcount level for Fiscal 2010 is year-to-date as of March of 2010.
+"Year-End Actuals/Projected" headcount levels are based on figures beginning with Fiscal 2010.
New York City Council Finance Division
Comparison of NYPD Peak, Year-End & Average Headcounts
(Fiscal 1994 to Fiscal 2014 as per the Fiscal 2011 Executive Budget )
29,000
31,000
33,000
35,000
37,000
39,000
41,000
FY'94
FY'96
FY'98
FY'00
FY'02
FY'04
FY'06
FY'08
FY'10*
+
FY12
FY'14
Fiscal Year
He
ad
co
un
tL
ev
el
Funded Peak
Yearly Average*
Year EndActuals/Projected+
Finance Division Briefing Paper Police Department
Page 7
Civilianization
Because a sizable number of uniformed officers continue to function in capacities that could be performedby civilians, the number of civilians funded continues to have a substantial impact on the number of officersthat can be properly deployed to enforcement functions. Through strong advocacy by the City Council, $15million was restored to the NYPD’s baseline budget this past June to prevent the elimination of more than300 civilian positions. Additionally, the January 2010 Plan proposed to civilianize 400 positions byreplacing uniformed officers in designated administrative and support commands with newly hiredcivilians. This investment in civilians will allow the agency to maximize its enforcement strength during aperiod of fiscal retrenchment.
Factors Impacting Attrition Rates
Various factors (some of which overlapped) have impacted attrition rates over the past decade. Thesealtered attrition rates have, in turn, altered the size of hiring classes, which serve as vehicles for attritionreplacement. These altered rates have also led to instances in which the NYPD was either significantlyhigher or lower than its planned headcount for long stretches. The most significant of these factors are:
Academy Class Cohorts Reaching 20 Years of Service
By contract, officers who reach 20 years of service are eligible for retirement. Traditionally, about 80percent of such officers choose to retire. It has been the case, therefore, that 20 years after periods of large-scale hiring, large-scale retirements have occurred. An example of such an instance is the large-scaleretirements that occurred 20 years after the hiring boom that occurred when the City’s 1970’s fiscal crisis
New York City Council Finance Division
35,808
275
35,641
274
35,195
112
34,625
1,142
34,388
700
34,413
954
34,719
648
30,000
31,000
32,000
33,000
34,000
35,000
36,000
Hea
dc
ou
nt
Lev
el
January 1,
2009 Hiring
Class
July 1, 2009
Hiring Class
January 1,
2010 Hiring
Class
July 1, 2010
Hiring Class
(Projected)
April 1, 2011
Hiring Class
(Projected)
July 1, 2011
Hiring Class
(Projected)
January 1,
2012 Hiring
Class
(Projected)
Academy Hiring Classes
Impact of Hiring Classes on NYPD Headcount - January 2009 to January 2012(as per 2011 Executive Budget)
Hiring Class
Pre-Class Headcount
Finance Division Briefing Paper Police Department
Page 8
finally ended. A similar large-scale exodus is expected to begin in a few years when the cohort of SafeStreet/Safe City hires start to become eligible for retirement.
Economic Declines and Ascents
Simply put, when the economy is booming, attrition increases as officers choose to separate from theDepartment (either prior to or at retirement eligibility) to seek more lucrative job opportunities.Conversely, when the economy is depressed, NYPD employment is relatively more attractive and attritiondecreases dramatically as is the case currently.
Salary Stagnation, Salary Decreases and Salary Increases
When salaries either stagnate or actually decrease (as was the case a few years ago when the PBA agreed tovastly lower starting salaries in exchange for increases for veteran officers), attrition increases.Conversely, when salaries increase (as was the case when an arbitrator increased starting and veteranssalaries significantly) attrition decreases.
9/11 Overtime Earnings
Police officer pension calculations are based on earnings in the last year of service. In the wake of massiveovertime earnings stemming from 9/11, an enormous cohort of officers retired from the force.
Felony Crime TrendsThere is almost nothing but good news to report in terms of crime trends in New York City. As the trenddata show (see “Summary of Recent Crime Statistics” in Patrol Services program section), felony crime hascontinued a steady decline for the past two decades, yielding crime rates lower than at any time since theearly 1960’s. Additionally, crime reduction successes in New York City continue to outpace – and evendrive down -- regional, statewide and national crime statistics.
Summary of Department Overtime Issues
Overtime has been an especially important indicator for the Department over the past few Fiscal Years.Until recently, the Department’s starting salary for rookies of about $25,000 made recruiting and hiring upto the agency’s authorized headcount a problem. In conjunction with the retirement of a large cohort ofveteran officers who had reached the 20-year threshold, understaffing has been a persistent problem forthe Department. A recent contractual agreement which raised the starting salary to just over $42,000 peryear has made the prospect of recruiting new officers and reaching the Department’s authorized peakheadcount more feasible. In order to maintain staffing levels across tours, it became necessary for theDepartment to authorize overtime assignments as a gap-filler. These overtime assignments were usuallyfunded by PS accruals generated by the Department’s chronic understaffing as well as turnover savings thatresult when newer, lower-paid officers replace older, higher-paid officers as the latter retire. Traditionally,the Department “under-appropriates” for its planned overtime spending and then moves funds from itsFull-time normal gross codes into its overtime codes.
This was a simpler proposition when the Department generated enough accruals in its Full-time normalgross codes to cover the overages, but now that its Full-time spending will increase and its accrualsdiminish, it will be interesting to see how the Department plans to cover its likely overtime need. One ofthe Department’s PEG proposals is to reduce the Department’s overtime spending by $50 million in Fiscal2011 and the outyears. This proposal represents a 15.7 percent reduction to its planned overtimespending in Fiscal 2011.
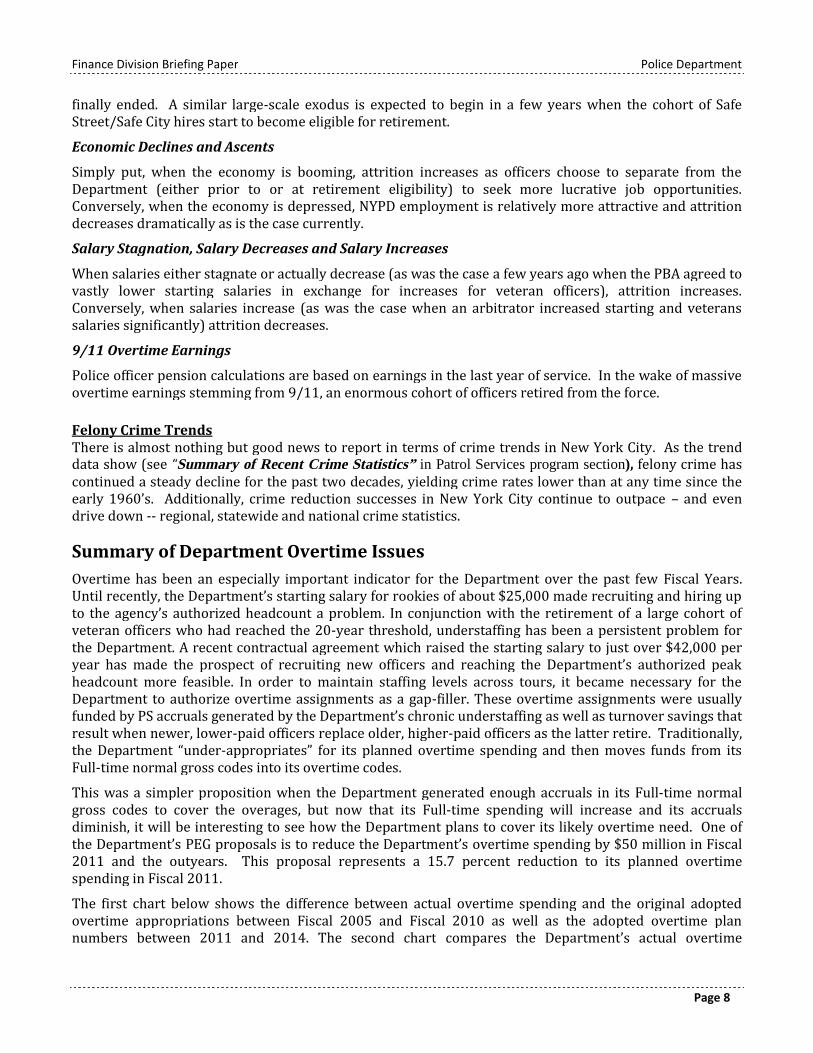
The first chart below shows the difference between actual overtime spending and the original adoptedovertime appropriations between Fiscal 2005 and Fiscal 2010 as well as the adopted overtime plannumbers between 2011 and 2014. The second chart compares the Department’s actual overtime
Finance Division Briefing Paper Police Department
Page 9
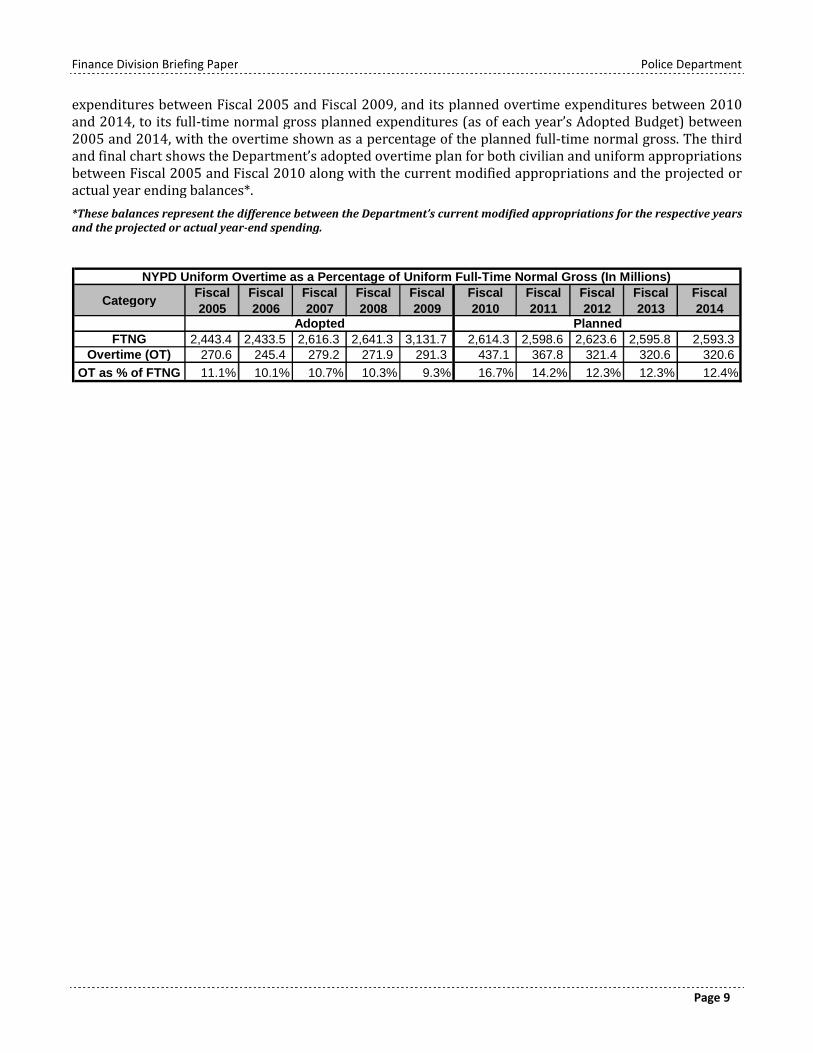
expenditures between Fiscal 2005 and Fiscal 2009, and its planned overtime expenditures between 2010and 2014, to its full-time normal gross planned expenditures (as of each year’s Adopted Budget) between2005 and 2014, with the overtime shown as a percentage of the planned full-time normal gross. The thirdand final chart shows the Department’s adopted overtime plan for both civilian and uniform appropriationsbetween Fiscal 2005 and Fiscal 2010 along with the current modified appropriations and the projected oractual year ending balances*.
*These balances represent the difference between the Department’s current modified appropriations for the respective yearsand the projected or actual year-end spending.
CategoryFiscal
2005
Fiscal
2006
Fiscal
2007
Fiscal
2008
Fiscal
2009
Fiscal
2010
Fiscal
2011
Fiscal
2012
Fiscal
2013
Fiscal
2014
FTNG 2,443.4 2,433.5 2,616.3 2,641.3 3,131.7 2,614.3 2,598.6 2,623.6 2,595.8 2,593.3Overtime (OT) 270.6 245.4 279.2 271.9 291.3 437.1 367.8 321.4 320.6 320.6
OT as % of FTNG 11.1% 10.1% 10.7% 10.3% 9.3% 16.7% 14.2% 12.3% 12.3% 12.4%
Adopted Planned
NYPD Uniform Overtime as a Percentage of Uniform Full-Time Normal Gross (In Millions)
Finance Division Briefing Paper Police Department
Page 10
Adopted Current Modified
Year-to-Date
Expenditures Surplus/(Deficit)
Subtotal for Uniform Overtime 328,099,765$ 440,040,782$ 361,468,867$ 78,571,915$
Subtotal for Civilian Overtime 45,241,147$ 49,664,385$ 60,289,685$ (10,625,300)$
Total for NYPD 373,340,912$ 489,705,167$ 421,758,552$ 67,946,615$
Adopted Final Modified
Actual
Expenditures Surplus/(Deficit)
Subtotal for Uniform Overtime 291,267,765$ 369,809,835$ 431,162,052$ (61,352,217)$
Subtotal for Civilian Overtime 39,991,169$ 48,114,877$ 73,461,444$ (25,346,567)$
Total for NYPD 331,258,934$ 417,924,712$ 504,623,496$ (86,698,784)$
Adopted Final Modified
Actual
Expenditures Surplus/(Deficit)
Subtotal for Uniform Overtime 271,848,682$ 306,305,097$ 406,471,046$ (100,165,949)$
Subtotal for Civilian Overtime 39,991,169$ 44,687,097$ 69,222,924$ (24,535,827)$
Total for NYPD 311,839,851$ 350,992,194$ 475,693,970$ (124,701,776)$
Adopted Final Modified
Actual
Expenditures Surplus/(Deficit)
Subtotal for Uniform Overtime 279,230,253$ 366,412,996$ 365,697,594$ 715,402$
Subtotal for Civilian Overtime 15,991,169$ 60,535,491$ 60,296,896$ 238,595$
Total for NYPD 295,221,422$ 426,948,487$ 425,994,490$ 953,997$
Adopted Final Modified
Actual
Expenditures Surplus/(Deficit)
Subtotal for Uniform Overtime 245,327,053$ 299,570,058$ 358,582,494$ (59,012,436)$
Subtotal for Civilian Overtime 15,641,169$ 18,469,452$ 53,408,214$ (34,938,762)$
Total for NYPD 260,968,222$ 318,039,510$ 411,990,708$ (93,951,198)$
Adopted Final Modified
Actual
Expenditures Surplus/(Deficit)
Subtotal for Uniform Overtime 270,618,713$ 441,642,917$ 400,985,794$ 40,657,123$
Subtotal for Civilian Overtime 14,077,053$ 15,249,719$ 43,559,041$ (28,309,322)$
Total for NYPD 284,695,766$ 456,892,636$ 444,544,834$ 12,347,802$*Source: FMS
NYPD OVERTIME HISTORY*
Fiscal 2006 Year-to-Date as of 6/30/06
Fiscal 2005 Year-to-Date as of 6/30/05
Fiscal 2010 Year-to-Date as of 4/30/2010
Fiscal 2009 Year-to-Date as of 6/30/09
Fiscal 2008 Year-to-Date as of 6/30/08
Fiscal 2007 Year-to-Date as of 6/30/07
Finance Division Briefing Paper Police Department
Page 11
Summary of Miscellaneous Revenues
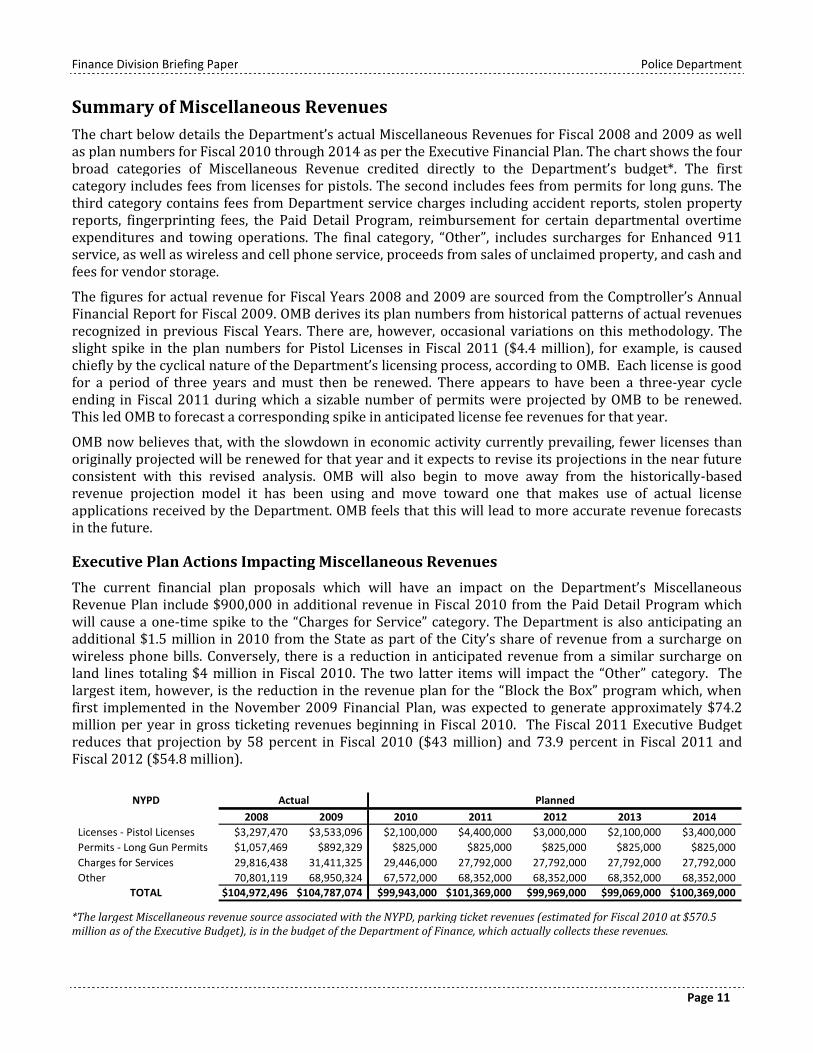
The chart below details the Department’s actual Miscellaneous Revenues for Fiscal 2008 and 2009 as wellas plan numbers for Fiscal 2010 through 2014 as per the Executive Financial Plan. The chart shows the fourbroad categories of Miscellaneous Revenue credited directly to the Department’s budget*. The firstcategory includes fees from licenses for pistols. The second includes fees from permits for long guns. Thethird category contains fees from Department service charges including accident reports, stolen propertyreports, fingerprinting fees, the Paid Detail Program, reimbursement for certain departmental overtimeexpenditures and towing operations. The final category, “Other”, includes surcharges for Enhanced 911service, as well as wireless and cell phone service, proceeds from sales of unclaimed property, and cash andfees for vendor storage.
The figures for actual revenue for Fiscal Years 2008 and 2009 are sourced from the Comptroller’s AnnualFinancial Report for Fiscal 2009. OMB derives its plan numbers from historical patterns of actual revenuesrecognized in previous Fiscal Years. There are, however, occasional variations on this methodology. Theslight spike in the plan numbers for Pistol Licenses in Fiscal 2011 ($4.4 million), for example, is causedchiefly by the cyclical nature of the Department’s licensing process, according to OMB. Each license is goodfor a period of three years and must then be renewed. There appears to have been a three-year cycleending in Fiscal 2011 during which a sizable number of permits were projected by OMB to be renewed.This led OMB to forecast a corresponding spike in anticipated license fee revenues for that year.
OMB now believes that, with the slowdown in economic activity currently prevailing, fewer licenses thanoriginally projected will be renewed for that year and it expects to revise its projections in the near futureconsistent with this revised analysis. OMB will also begin to move away from the historically-basedrevenue projection model it has been using and move toward one that makes use of actual licenseapplications received by the Department. OMB feels that this will lead to more accurate revenue forecastsin the future.
Executive Plan Actions Impacting Miscellaneous Revenues
The current financial plan proposals which will have an impact on the Department’s MiscellaneousRevenue Plan include $900,000 in additional revenue in Fiscal 2010 from the Paid Detail Program whichwill cause a one-time spike to the “Charges for Service” category. The Department is also anticipating anadditional $1.5 million in 2010 from the State as part of the City’s share of revenue from a surcharge onwireless phone bills. Conversely, there is a reduction in anticipated revenue from a similar surcharge onland lines totaling $4 million in Fiscal 2010. The two latter items will impact the “Other” category. Thelargest item, however, is the reduction in the revenue plan for the “Block the Box” program which, whenfirst implemented in the November 2009 Financial Plan, was expected to generate approximately $74.2million per year in gross ticketing revenues beginning in Fiscal 2010. The Fiscal 2011 Executive Budgetreduces that projection by 58 percent in Fiscal 2010 ($43 million) and 73.9 percent in Fiscal 2011 andFiscal 2012 ($54.8 million).
NYPD
2008 2009 2010 2011 2012 2013 2014
Licenses - Pistol Licenses $3,297,470 $3,533,096 $2,100,000 $4,400,000 $3,000,000 $2,100,000 $3,400,000
Permits - Long Gun Permits $1,057,469 $892,329 $825,000 $825,000 $825,000 $825,000 $825,000
Charges for Services 29,816,438 31,411,325 29,446,000 27,792,000 27,792,000 27,792,000 27,792,000
Other 70,801,119 68,950,324 67,572,000 68,352,000 68,352,000 68,352,000 68,352,000
TOTAL $104,972,496 $104,787,074 $99,943,000 $101,369,000 $99,969,000 $99,069,000 $100,369,000
Actual Planned
*The largest Miscellaneous revenue source associated with the NYPD, parking ticket revenues (estimated for Fiscal 2010 at $570.5million as of the Executive Budget), is in the budget of the Department of Finance, which actually collects these revenues.
Finance Division Briefing Paper Police Department
Page 12
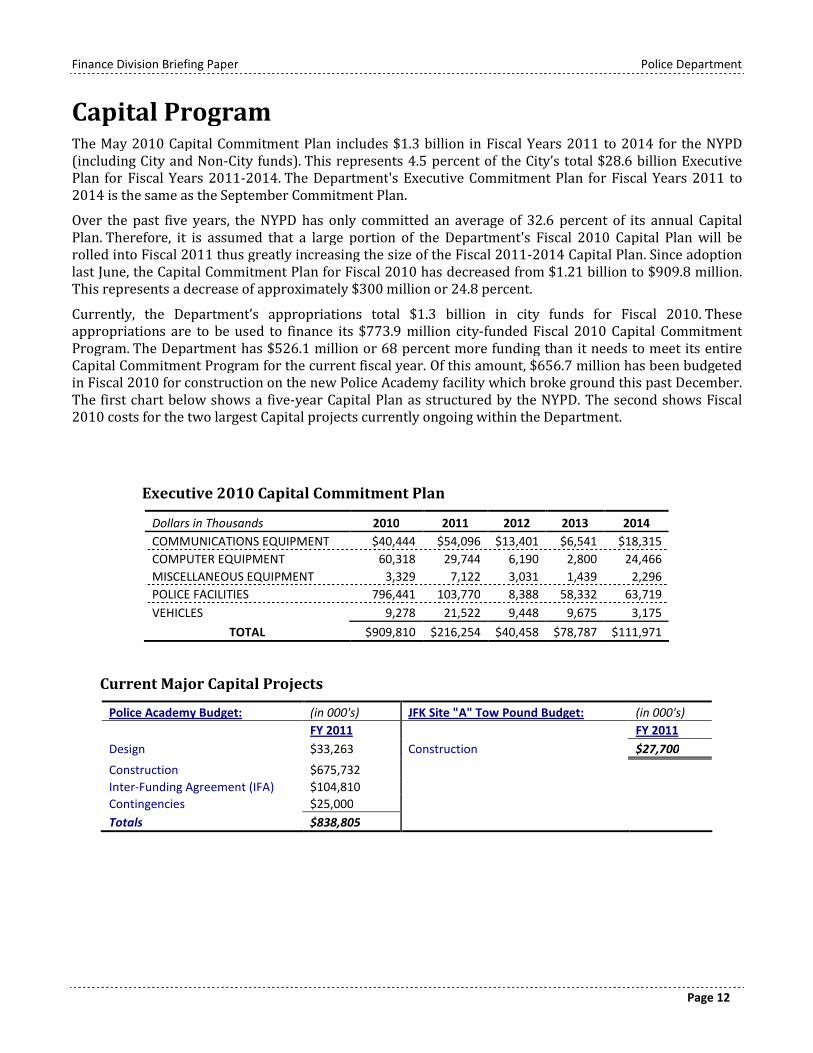
Capital ProgramThe May 2010 Capital Commitment Plan includes $1.3 billion in Fiscal Years 2011 to 2014 for the NYPD(including City and Non-City funds). This represents 4.5 percent of the City’s total $28.6 billion ExecutivePlan for Fiscal Years 2011-2014. The Department's Executive Commitment Plan for Fiscal Years 2011 to2014 is the same as the September Commitment Plan.
Over the past five years, the NYPD has only committed an average of 32.6 percent of its annual CapitalPlan. Therefore, it is assumed that a large portion of the Department's Fiscal 2010 Capital Plan will berolled into Fiscal 2011 thus greatly increasing the size of the Fiscal 2011-2014 Capital Plan. Since adoptionlast June, the Capital Commitment Plan for Fiscal 2010 has decreased from $1.21 billion to $909.8 million.This represents a decrease of approximately $300 million or 24.8 percent.
Currently, the Department’s appropriations total $1.3 billion in city funds for Fiscal 2010. Theseappropriations are to be used to finance its $773.9 million city-funded Fiscal 2010 Capital CommitmentProgram. The Department has $526.1 million or 68 percent more funding than it needs to meet its entireCapital Commitment Program for the current fiscal year. Of this amount, $656.7 million has been budgetedin Fiscal 2010 for construction on the new Police Academy facility which broke ground this past December.The first chart below shows a five-year Capital Plan as structured by the NYPD. The second shows Fiscal2010 costs for the two largest Capital projects currently ongoing within the Department.
Executive 2010 Capital Commitment Plan
Dollars in Thousands 2010 2011 2012 2013 2014
COMMUNICATIONS EQUIPMENT $40,444 $54,096 $13,401 $6,541 $18,315
COMPUTER EQUIPMENT 60,318 29,744 6,190 2,800 24,466
MISCELLANEOUS EQUIPMENT 3,329 7,122 3,031 1,439 2,296
POLICE FACILITIES 796,441 103,770 8,388 58,332 63,719
VEHICLES 9,278 21,522 9,448 9,675 3,175
TOTAL $909,810 $216,254 $40,458 $78,787 $111,971
Current Major Capital Projects
Police Academy Budget: (in 000's) JFK Site "A" Tow Pound Budget: (in 000's)
FY 2011 FY 2011
Design $33,263 Construction $27,700
Construction $675,732
Inter-Funding Agreement (IFA) $104,810
Contingencies $25,000
Totals $838,805
Finance Division Briefing Paper Police Department
Page 13
Program Areas
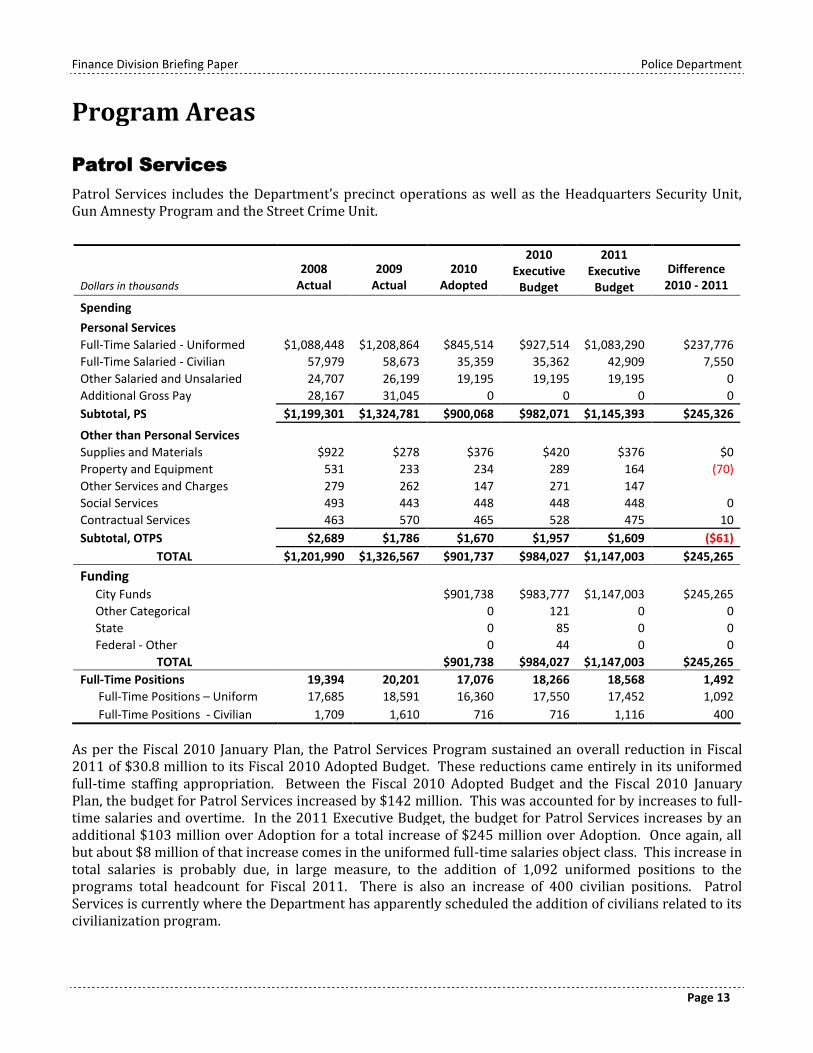
Patrol Services
Patrol Services includes the Department’s precinct operations as well as the Headquarters Security Unit,Gun Amnesty Program and the Street Crime Unit.
Dollars in thousands
2008Actual
2009Actual
2010Adopted
2010Executive
Budget
2011Executive
Budget
Difference2010 - 2011
Spending
Personal Services
Full-Time Salaried - Uniformed $1,088,448 $1,208,864 $845,514 $927,514 $1,083,290 $237,776
Full-Time Salaried - Civilian 57,979 58,673 35,359 35,362 42,909 7,550
Other Salaried and Unsalaried 24,707 26,199 19,195 19,195 19,195 0
Additional Gross Pay 28,167 31,045 0 0 0 0
Subtotal, PS $1,199,301 $1,324,781 $900,068 $982,071 $1,145,393 $245,326
Other than Personal Services
Supplies and Materials $922 $278 $376 $420 $376 $0
Property and Equipment 531 233 234 289 164 (70)
Other Services and Charges 279 262 147 271 147
Social Services 493 443 448 448 448 0
Contractual Services 463 570 465 528 475 10
Subtotal, OTPS $2,689 $1,786 $1,670 $1,957 $1,609 ($61)
TOTAL $1,201,990 $1,326,567 $901,737 $984,027 $1,147,003 $245,265
FundingCity Funds $901,738 $983,777 $1,147,003 $245,265
Other Categorical 0 121 0 0
State 0 85 0 0
Federal - Other 0 44 0 0
TOTAL $901,738 $984,027 $1,147,003 $245,265
Full-Time Positions 19,394 20,201 17,076 18,266 18,568 1,492
Full-Time Positions – Uniform 17,685 18,591 16,360 17,550 17,452 1,092
Full-Time Positions - Civilian 1,709 1,610 716 716 1,116 400
As per the Fiscal 2010 January Plan, the Patrol Services Program sustained an overall reduction in Fiscal2011 of $30.8 million to its Fiscal 2010 Adopted Budget. These reductions came entirely in its uniformedfull-time staffing appropriation. Between the Fiscal 2010 Adopted Budget and the Fiscal 2010 JanuaryPlan, the budget for Patrol Services increased by $142 million. This was accounted for by increases to full-time salaries and overtime. In the 2011 Executive Budget, the budget for Patrol Services increases by anadditional $103 million over Adoption for a total increase of $245 million over Adoption. Once again, allbut about $8 million of that increase comes in the uniformed full-time salaries object class. This increase intotal salaries is probably due, in large measure, to the addition of 1,092 uniformed positions to theprograms total headcount for Fiscal 2011. There is also an increase of 400 civilian positions. PatrolServices is currently where the Department has apparently scheduled the addition of civilians related to itscivilianization program.
Finance Division Briefing Paper Police Department
Page 14
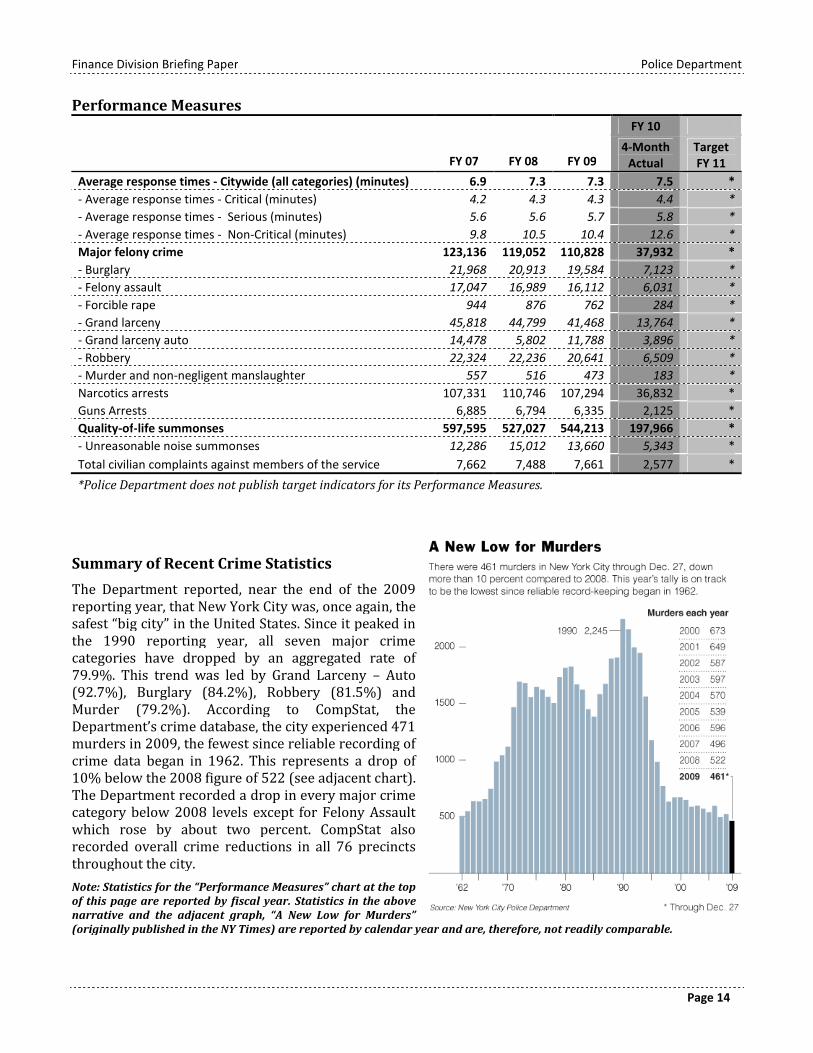
Performance MeasuresFY 10
FY 07 FY 08 FY 094-Month
ActualTargetFY 11
Average response times - Citywide (all categories) (minutes) 6.9 7.3 7.3 7.5 *
- Average response times - Critical (minutes) 4.2 4.3 4.3 4.4 *
- Average response times - Serious (minutes) 5.6 5.6 5.7 5.8 *
- Average response times - Non-Critical (minutes) 9.8 10.5 10.4 12.6 *
Major felony crime 123,136 119,052 110,828 37,932 *
- Burglary 21,968 20,913 19,584 7,123 *
- Felony assault 17,047 16,989 16,112 6,031 *
- Forcible rape 944 876 762 284 *
- Grand larceny 45,818 44,799 41,468 13,764 *
- Grand larceny auto 14,478 5,802 11,788 3,896 *
- Robbery 22,324 22,236 20,641 6,509 *
- Murder and non-negligent manslaughter 557 516 473 183 *
Narcotics arrests 107,331 110,746 107,294 36,832 *
Guns Arrests 6,885 6,794 6,335 2,125 *
Quality-of-life summonses 597,595 527,027 544,213 197,966 *
- Unreasonable noise summonses 12,286 15,012 13,660 5,343 *
Total civilian complaints against members of the service 7,662 7,488 7,661 2,577 *
*Police Department does not publish target indicators for its Performance Measures.
Summary of Recent Crime Statistics
The Department reported, near the end of the 2009reporting year, that New York City was, once again, thesafest “big city” in the United States. Since it peaked inthe 1990 reporting year, all seven major crimecategories have dropped by an aggregated rate of79.9%. This trend was led by Grand Larceny – Auto(92.7%), Burglary (84.2%), Robbery (81.5%) andMurder (79.2%). According to CompStat, theDepartment’s crime database, the city experienced 471murders in 2009, the fewest since reliable recording ofcrime data began in 1962. This represents a drop of10% below the 2008 figure of 522 (see adjacent chart).The Department recorded a drop in every major crimecategory below 2008 levels except for Felony Assaultwhich rose by about two percent. CompStat alsorecorded overall crime reductions in all 76 precinctsthroughout the city.
Note: Statistics for the “Performance Measures” chart at the topof this page are reported by fiscal year. Statistics in the abovenarrative and the adjacent graph, “A New Low for Murders”(originally published in the NY Times) are reported by calendar year and are, therefore, not readily comparable.
Finance Division Briefing Paper Police Department
Page 15
RELEVANT BUDGET ACTIONS FOR PATROL SERVICES
PEG Restorations and Surplus/(Needs) Adjustment. The Fiscal 2011 Executive Budget proposes torestore $55.4 million along with 892 uniformed positions that it proposed to eliminate during the 2010January Plan beginning in Fiscal 2011 and into the outyears. The January Plan also restored $120million in funding from prior-year PEG programs ($40 million from the 2010 Executive Plan, $60million from the 2010 Executive Budget and $20 million from the 2008 November Plan), andappropriated to the Department, an additional $22 million to cover year-to-date overspending forFiscal 2010. All programs sought to reduce uniform personnel costs through attrition. Since theDepartment’s attrition rate has been significantly lower than anticipated during that period due to thesluggish economy, the Office of Management and Budget (OMB) has elected to restore funding for thesereduction programs.
Uniformed Headcount Reductions Through Attrition. The Fiscal 2011 Preliminary Budget proposedto reduce its baseline uniformed headcount by 892 positions through attrition beginning in Fiscal 2011.This proposed action would have reduced the Department’s planned year-end uniformed headcount for2011 to 32,817 from 34,109 saving the Department $55.4 million in uniformed salaries. TheDepartment’s year-end headcount would have remained at 32,817 into the outyears but the savingsassociated with the reduction would have grown to $112.6 million in Fiscal 2012, $132 million in 2013and $134 million in 2014. These increases were due to the fact that the Fiscal 2011 figure was a partialyear savings and the figures in the outyears accounted for planned salary increases budgeted foreliminated positions. Because of the currently proposed baseline restoration, however, the adjustedPEG item would be entirely restored in Fiscal 2011 and the outyear reduction totals would be adjusteddownward by $56.2 million in Fiscal 2012, $56.9 million in Fiscal 2013 and $57.9 million in Fiscal 2014.All savings as well as restoration figures include PEG credits for fringe benefits which were offset as“Other Adjustment” items elsewhere in the financial plan.
Civilianization of Support and Administrative Functions. In addition to the reduction in uniforms,the Department will hire 400 civilians to perform administrative and clerical functions currently beingperformed by uniformed officers. Likewise, 400 uniformed officers will be reassigned to dutiesrequiring law enforcement expertise thereby bolstering the enforcement and patrol strength of theDepartment by 400 officers. The savings associated with this civilianization initiative will come in theform of differentials in salaries between uniformed and civilian employees (uniforms earn significantlymore, on average, than civilians) as well as differentials in pensions between the two classes ofemployees which will “kick-in” beginning in Fiscal 2013. This would yield the Department savings of$1.3 million in Fiscal 2011, $2.8 million in Fiscal 2012 and $13.4 million in Fiscal Years 2013 and 2014.These figures also include “Health and Welfare” PEG credits as well as “Pension” PEG credits (beginningin Fiscal 2013) which are offset as “Other Adjustment” items elsewhere in the financial plan.
Finance Division Briefing Paper Police Department
Page 16
Chief of Department
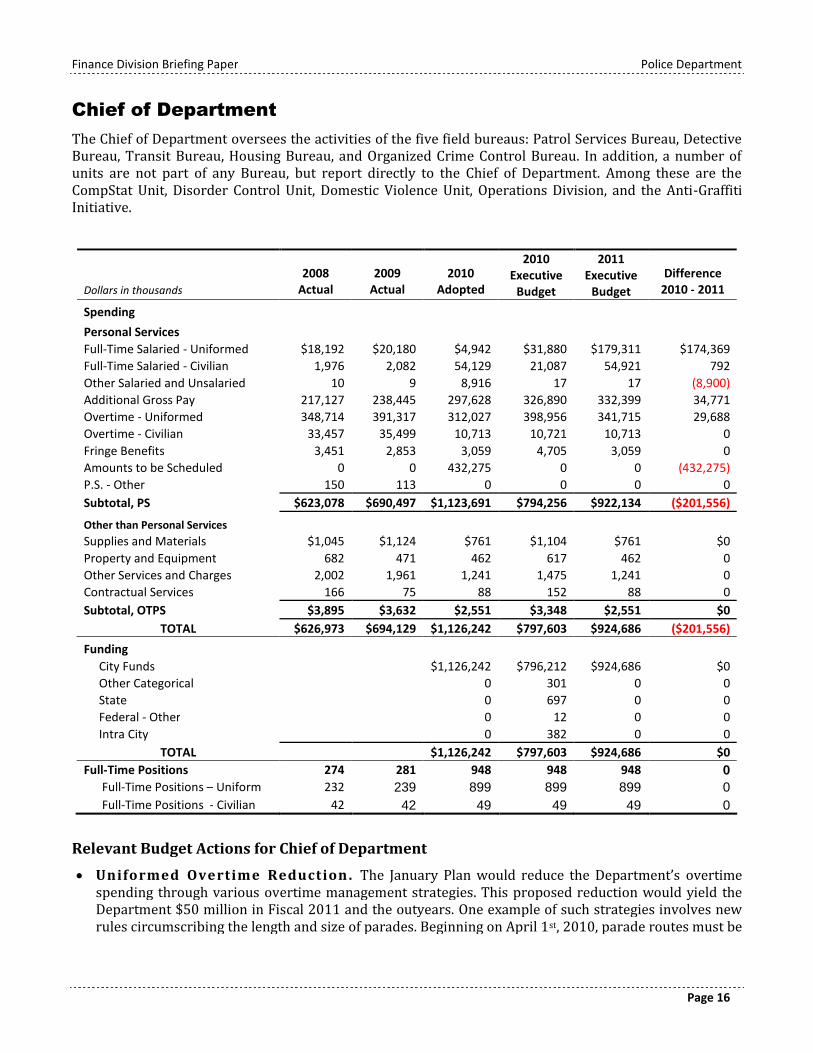
The Chief of Department oversees the activities of the five field bureaus: Patrol Services Bureau, DetectiveBureau, Transit Bureau, Housing Bureau, and Organized Crime Control Bureau. In addition, a number ofunits are not part of any Bureau, but report directly to the Chief of Department. Among these are theCompStat Unit, Disorder Control Unit, Domestic Violence Unit, Operations Division, and the Anti-GraffitiInitiative.
Dollars in thousands
2008Actual
2009Actual
2010Adopted
2010Executive
Budget
2011Executive
Budget
Difference2010 - 2011
Spending
Personal Services
Full-Time Salaried - Uniformed $18,192 $20,180 $4,942 $31,880 $179,311 $174,369
Full-Time Salaried - Civilian 1,976 2,082 54,129 21,087 54,921 792
Other Salaried and Unsalaried 10 9 8,916 17 17 (8,900)
Additional Gross Pay 217,127 238,445 297,628 326,890 332,399 34,771
Overtime - Uniformed 348,714 391,317 312,027 398,956 341,715 29,688
Overtime - Civilian 33,457 35,499 10,713 10,721 10,713 0
Fringe Benefits 3,451 2,853 3,059 4,705 3,059 0
Amounts to be Scheduled 0 0 432,275 0 0 (432,275)
P.S. - Other 150 113 0 0 0 0
Subtotal, PS $623,078 $690,497 $1,123,691 $794,256 $922,134 ($201,556)
Other than Personal Services
Supplies and Materials $1,045 $1,124 $761 $1,104 $761 $0
Property and Equipment 682 471 462 617 462 0
Other Services and Charges 2,002 1,961 1,241 1,475 1,241 0
Contractual Services 166 75 88 152 88 0
Subtotal, OTPS $3,895 $3,632 $2,551 $3,348 $2,551 $0
TOTAL $626,973 $694,129 $1,126,242 $797,603 $924,686 ($201,556)
Funding
City Funds $1,126,242 $796,212 $924,686 $0
Other Categorical 0 301 0 0
State 0 697 0 0
Federal - Other 0 12 0 0
Intra City 0 382 0 0
TOTAL $1,126,242 $797,603 $924,686 $0
Full-Time Positions 274 281 948 948 948 0
Full-Time Positions – Uniform 232 239 899 899 899 0
Full-Time Positions - Civilian 42 42 49 49 49 0
Relevant Budget Actions for Chief of Department
Uniformed Overtime Reduction . The January Plan would reduce the Department’s overtimespending through various overtime management strategies. This proposed reduction would yield theDepartment $50 million in Fiscal 2011 and the outyears. One example of such strategies involves newrules circumscribing the length and size of parades. Beginning on April 1st, 2010, parade routes must be

Finance Division Briefing Paper Police Department
Page 17
25 percent shorter than previously and must occur within a five-hour time frame. According to theDepartment, this could save the City as much as $3.1 million, primarily in overtime savings.
Finance Division Briefing Paper Police Department
Page 18
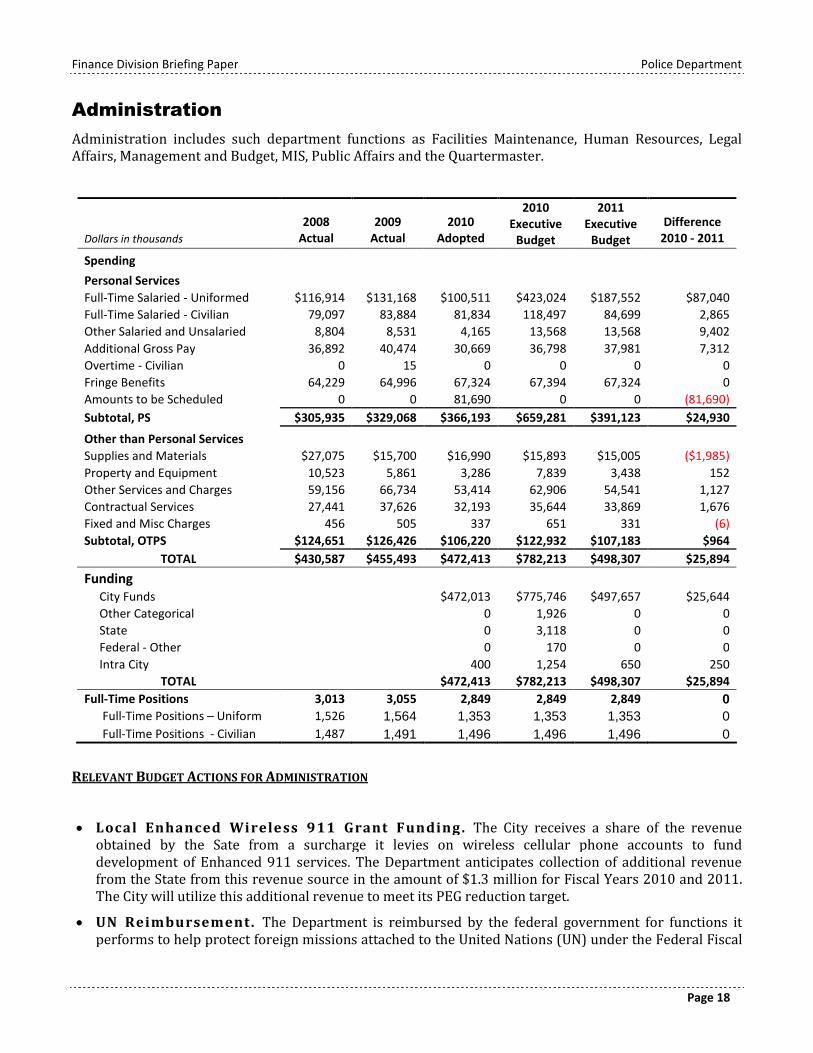
Administration
Administration includes such department functions as Facilities Maintenance, Human Resources, LegalAffairs, Management and Budget, MIS, Public Affairs and the Quartermaster.
Dollars in thousands
2008Actual
2009Actual
2010Adopted
2010Executive
Budget
2011Executive
Budget
Difference2010 - 2011
Spending
Personal Services
Full-Time Salaried - Uniformed $116,914 $131,168 $100,511 $423,024 $187,552 $87,040
Full-Time Salaried - Civilian 79,097 83,884 81,834 118,497 84,699 2,865
Other Salaried and Unsalaried 8,804 8,531 4,165 13,568 13,568 9,402
Additional Gross Pay 36,892 40,474 30,669 36,798 37,981 7,312
Overtime - Civilian 0 15 0 0 0 0
Fringe Benefits 64,229 64,996 67,324 67,394 67,324 0
Amounts to be Scheduled 0 0 81,690 0 0 (81,690)
Subtotal, PS $305,935 $329,068 $366,193 $659,281 $391,123 $24,930
Other than Personal Services
Supplies and Materials $27,075 $15,700 $16,990 $15,893 $15,005 ($1,985)
Property and Equipment 10,523 5,861 3,286 7,839 3,438 152
Other Services and Charges 59,156 66,734 53,414 62,906 54,541 1,127
Contractual Services 27,441 37,626 32,193 35,644 33,869 1,676
Fixed and Misc Charges 456 505 337 651 331 (6)
Subtotal, OTPS $124,651 $126,426 $106,220 $122,932 $107,183 $964
TOTAL $430,587 $455,493 $472,413 $782,213 $498,307 $25,894
FundingCity Funds $472,013 $775,746 $497,657 $25,644
Other Categorical 0 1,926 0 0
State 0 3,118 0 0
Federal - Other 0 170 0 0
Intra City 400 1,254 650 250
TOTAL $472,413 $782,213 $498,307 $25,894
Full-Time Positions 3,013 3,055 2,849 2,849 2,849 0
Full-Time Positions – Uniform 1,526 1,564 1,353 1,353 1,353 0
Full-Time Positions - Civilian 1,487 1,491 1,496 1,496 1,496 0
RELEVANT BUDGET ACTIONS FOR ADMINISTRATION
Local Enhanced Wireless 911 Grant Funding . The City receives a share of the revenueobtained by the Sate from a surcharge it levies on wireless cellular phone accounts to funddevelopment of Enhanced 911 services. The Department anticipates collection of additional revenuefrom the State from this revenue source in the amount of $1.3 million for Fiscal Years 2010 and 2011.The City will utilize this additional revenue to meet its PEG reduction target.
UN Reimbursement. The Department is reimbursed by the federal government for functions itperforms to help protect foreign missions attached to the United Nations (UN) under the Federal Fiscal
Finance Division Briefing Paper Police Department
Page 19
Year (FFY) 2010 Appropriation Act for the Protection of Foreign Missions. This grant will be increasefrom $7 million in Fiscal 2010 to $25 million in Fiscal 2011, an increment of $18 million which theDepartment will use to help meet its Fiscal 2011 PEG reduction target.
Additional Revenue from Paid Detail Program. Under the “Paid Detail Program”, the Departmentallows uniformed officers to accept off-duty assignments from private vendors. The Department is thenreimbursed by the vendors for any administrative overhead it incurs as a result of managing theprogram. The Department anticipates an additional $900,000 in such reimbursements in Fiscal 2010and will use the additional revenue to obtain PEG credit to meet its reduction targets.
Technology Maintenance. The Department will receive funding for basic technologymaintenance and operational costs totaling $2 million beginning in Fiscal 2010 and growing to $4million in Fiscal 2011 and the outyears.
Various Collective Bargaining Adjustments. Baselined funds totaling $11.3 millionbeginning in Fiscal 2010 are being transferred from the Labor Reserve in the Miscellaneous Budget tothe Department’s PS budget to cover the costs associated with recent collective bargaining settlementswith Managers and Original Jurisdiction (OJ) employees as well as Communications Workers ofAmerica (CWA) Administrative Managers and Locals 1181 and 1182.
Lease Adjustment. The January Plan will reduce the Department’s lease need for Fiscal 2010 by$217,000.
Finance Division Briefing Paper Police Department
Page 20
Detective Bureau
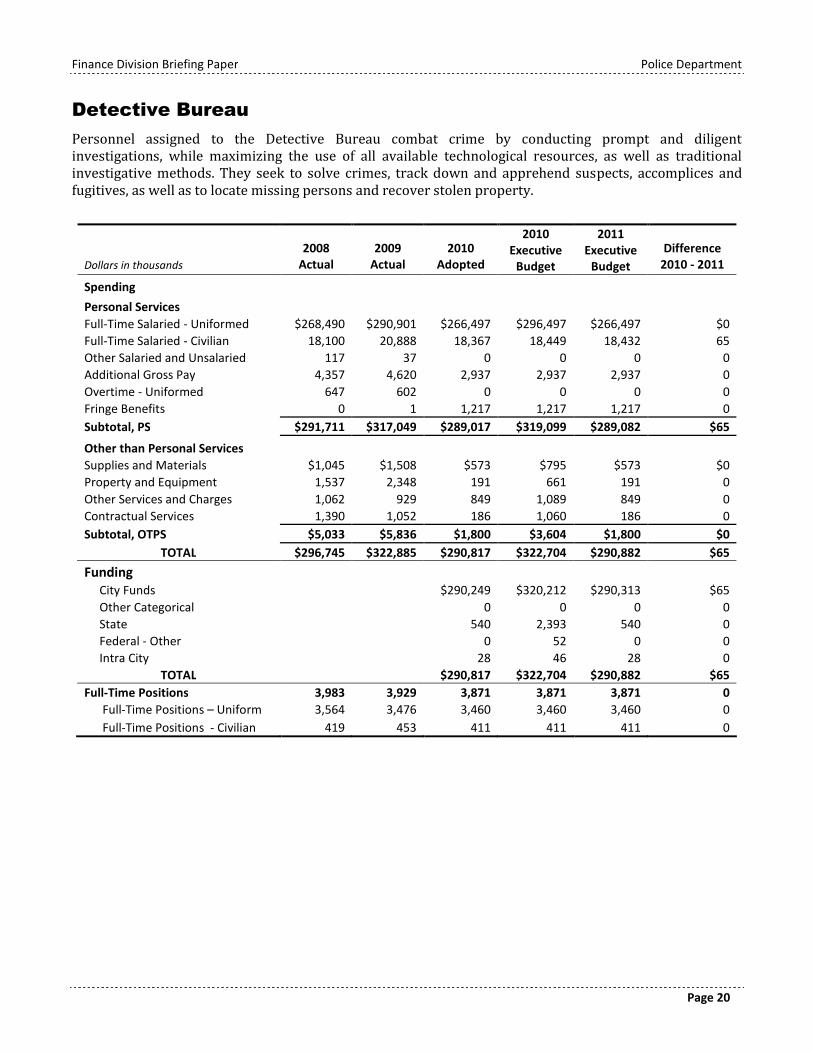
Personnel assigned to the Detective Bureau combat crime by conducting prompt and diligentinvestigations, while maximizing the use of all available technological resources, as well as traditionalinvestigative methods. They seek to solve crimes, track down and apprehend suspects, accomplices andfugitives, as well as to locate missing persons and recover stolen property.
Dollars in thousands
2008Actual
2009Actual
2010Adopted
2010Executive
Budget
2011Executive
Budget
Difference2010 - 2011
Spending
Personal Services
Full-Time Salaried - Uniformed $268,490 $290,901 $266,497 $296,497 $266,497 $0
Full-Time Salaried - Civilian 18,100 20,888 18,367 18,449 18,432 65
Other Salaried and Unsalaried 117 37 0 0 0 0
Additional Gross Pay 4,357 4,620 2,937 2,937 2,937 0
Overtime - Uniformed 647 602 0 0 0 0
Fringe Benefits 0 1 1,217 1,217 1,217 0
Subtotal, PS $291,711 $317,049 $289,017 $319,099 $289,082 $65
Other than Personal Services
Supplies and Materials $1,045 $1,508 $573 $795 $573 $0
Property and Equipment 1,537 2,348 191 661 191 0
Other Services and Charges 1,062 929 849 1,089 849 0
Contractual Services 1,390 1,052 186 1,060 186 0
Subtotal, OTPS $5,033 $5,836 $1,800 $3,604 $1,800 $0
TOTAL $296,745 $322,885 $290,817 $322,704 $290,882 $65
FundingCity Funds $290,249 $320,212 $290,313 $65
Other Categorical 0 0 0 0
State 540 2,393 540 0
Federal - Other 0 52 0 0
Intra City 28 46 28 0
TOTAL $290,817 $322,704 $290,882 $65
Full-Time Positions 3,983 3,929 3,871 3,871 3,871 0
Full-Time Positions – Uniform 3,564 3,476 3,460 3,460 3,460 0
Full-Time Positions - Civilian 419 453 411 411 411 0
Finance Division Briefing Paper Police Department
Page 21
School Safety
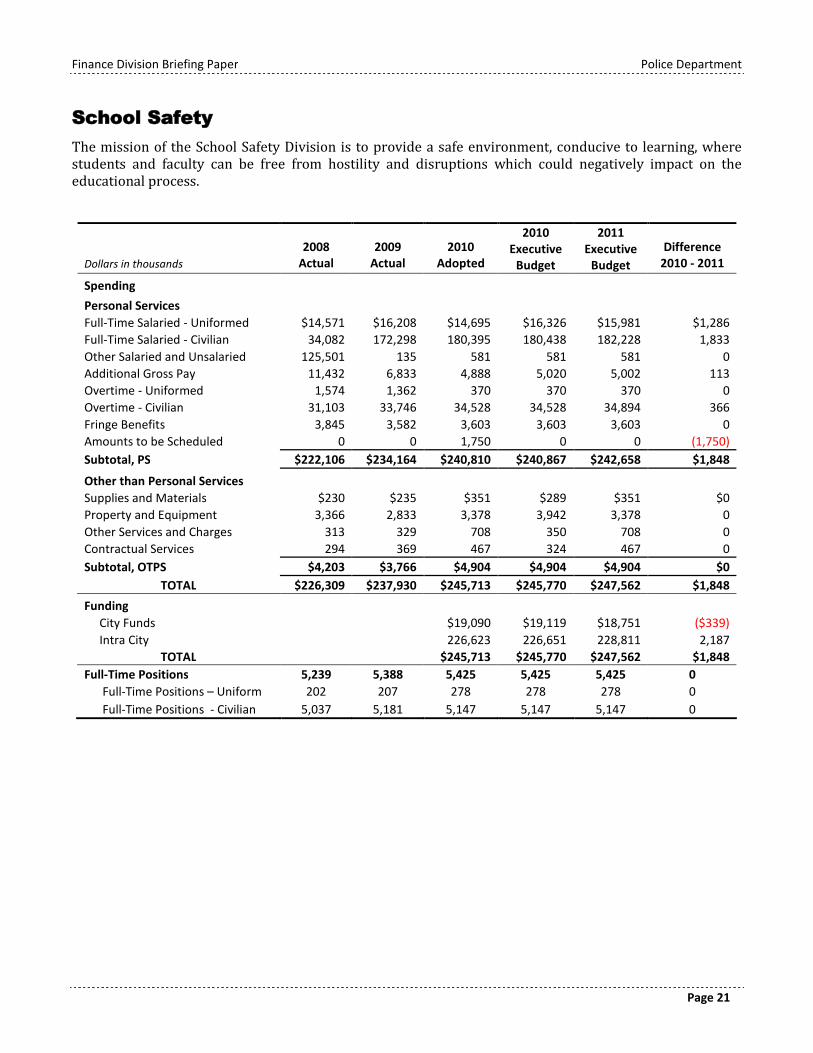
The mission of the School Safety Division is to provide a safe environment, conducive to learning, wherestudents and faculty can be free from hostility and disruptions which could negatively impact on theeducational process.
Dollars in thousands
2008Actual
2009Actual
2010Adopted
2010Executive
Budget
2011Executive
Budget
Difference2010 - 2011
Spending
Personal Services
Full-Time Salaried - Uniformed $14,571 $16,208 $14,695 $16,326 $15,981 $1,286
Full-Time Salaried - Civilian 34,082 172,298 180,395 180,438 182,228 1,833
Other Salaried and Unsalaried 125,501 135 581 581 581 0
Additional Gross Pay 11,432 6,833 4,888 5,020 5,002 113
Overtime - Uniformed 1,574 1,362 370 370 370 0
Overtime - Civilian 31,103 33,746 34,528 34,528 34,894 366
Fringe Benefits 3,845 3,582 3,603 3,603 3,603 0
Amounts to be Scheduled 0 0 1,750 0 0 (1,750)
Subtotal, PS $222,106 $234,164 $240,810 $240,867 $242,658 $1,848
Other than Personal Services
Supplies and Materials $230 $235 $351 $289 $351 $0
Property and Equipment 3,366 2,833 3,378 3,942 3,378 0
Other Services and Charges 313 329 708 350 708 0
Contractual Services 294 369 467 324 467 0
Subtotal, OTPS $4,203 $3,766 $4,904 $4,904 $4,904 $0
TOTAL $226,309 $237,930 $245,713 $245,770 $247,562 $1,848
Funding
City Funds $19,090 $19,119 $18,751 ($339)
Intra City 226,623 226,651 228,811 2,187
TOTAL $245,713 $245,770 $247,562 $1,848
Full-Time Positions 5,239 5,388 5,425 5,425 5,425 0
Full-Time Positions – Uniform 202 207 278 278 278 0
Full-Time Positions - Civilian 5,037 5,181 5,147 5,147 5,147 0
Finance Division Briefing Paper Police Department
Page 22
Transit
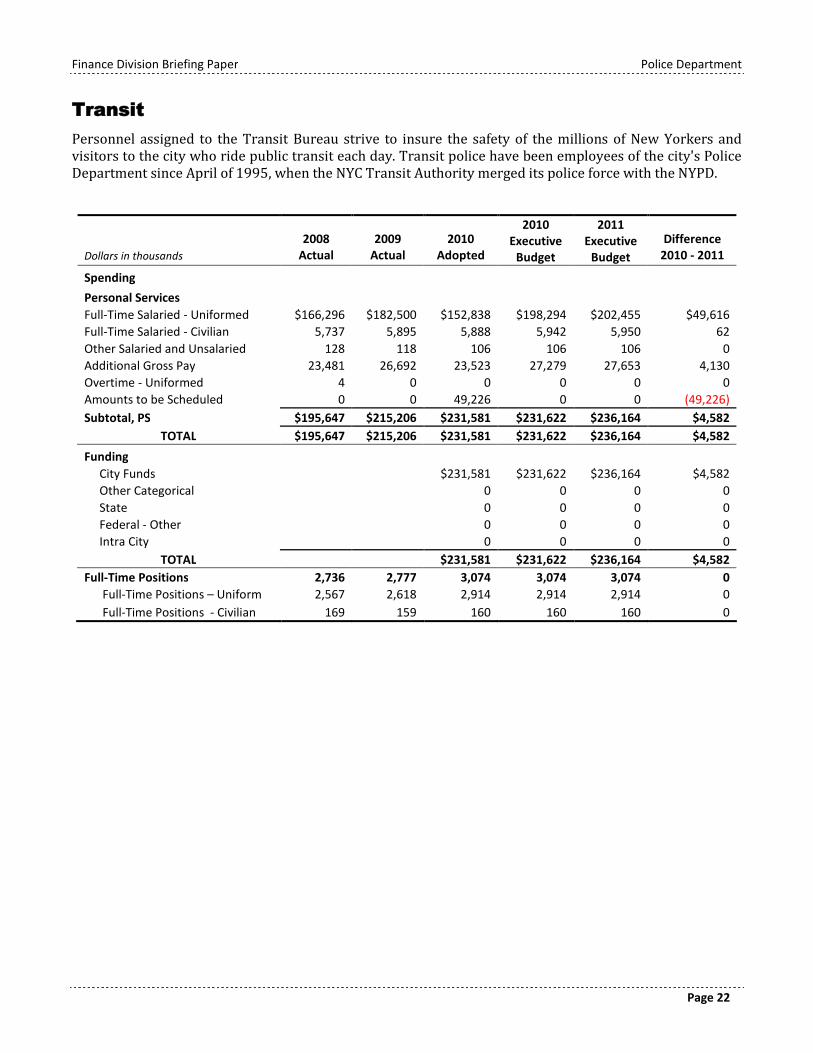
Personnel assigned to the Transit Bureau strive to insure the safety of the millions of New Yorkers andvisitors to the city who ride public transit each day. Transit police have been employees of the city's PoliceDepartment since April of 1995, when the NYC Transit Authority merged its police force with the NYPD.
Dollars in thousands
2008Actual
2009Actual
2010Adopted
2010Executive
Budget
2011Executive
Budget
Difference2010 - 2011
Spending
Personal Services
Full-Time Salaried - Uniformed $166,296 $182,500 $152,838 $198,294 $202,455 $49,616
Full-Time Salaried - Civilian 5,737 5,895 5,888 5,942 5,950 62
Other Salaried and Unsalaried 128 118 106 106 106 0
Additional Gross Pay 23,481 26,692 23,523 27,279 27,653 4,130
Overtime - Uniformed 4 0 0 0 0 0
Amounts to be Scheduled 0 0 49,226 0 0 (49,226)
Subtotal, PS $195,647 $215,206 $231,581 $231,622 $236,164 $4,582
TOTAL $195,647 $215,206 $231,581 $231,622 $236,164 $4,582
Funding
City Funds $231,581 $231,622 $236,164 $4,582
Other Categorical 0 0 0 0
State 0 0 0 0
Federal - Other 0 0 0 0
Intra City 0 0 0 0
TOTAL $231,581 $231,622 $236,164 $4,582
Full-Time Positions 2,736 2,777 3,074 3,074 3,074 0
Full-Time Positions – Uniform 2,567 2,618 2,914 2,914 2,914 0
Full-Time Positions - Civilian 169 159 160 160 160 0
Finance Division Briefing Paper Police Department
Page 23
Organized Crime Control Bureau
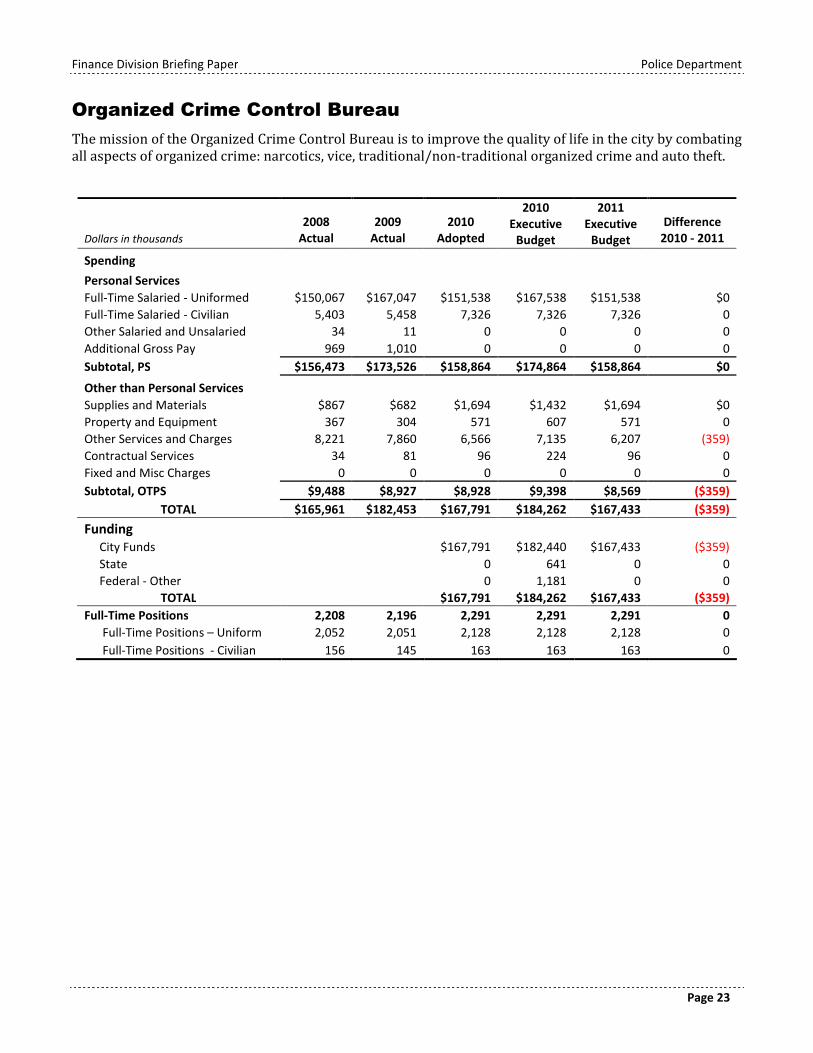
The mission of the Organized Crime Control Bureau is to improve the quality of life in the city by combatingall aspects of organized crime: narcotics, vice, traditional/non-traditional organized crime and auto theft.
Dollars in thousands
2008Actual
2009Actual
2010Adopted
2010Executive
Budget
2011Executive
Budget
Difference2010 - 2011
Spending
Personal Services
Full-Time Salaried - Uniformed $150,067 $167,047 $151,538 $167,538 $151,538 $0
Full-Time Salaried - Civilian 5,403 5,458 7,326 7,326 7,326 0
Other Salaried and Unsalaried 34 11 0 0 0 0
Additional Gross Pay 969 1,010 0 0 0 0
Subtotal, PS $156,473 $173,526 $158,864 $174,864 $158,864 $0
Other than Personal Services
Supplies and Materials $867 $682 $1,694 $1,432 $1,694 $0
Property and Equipment 367 304 571 607 571 0
Other Services and Charges 8,221 7,860 6,566 7,135 6,207 (359)
Contractual Services 34 81 96 224 96 0
Fixed and Misc Charges 0 0 0 0 0 0
Subtotal, OTPS $9,488 $8,927 $8,928 $9,398 $8,569 ($359)
TOTAL $165,961 $182,453 $167,791 $184,262 $167,433 ($359)
FundingCity Funds $167,791 $182,440 $167,433 ($359)
State 0 641 0 0
Federal - Other 0 1,181 0 0
TOTAL $167,791 $184,262 $167,433 ($359)
Full-Time Positions 2,208 2,196 2,291 2,291 2,291 0
Full-Time Positions – Uniform 2,052 2,051 2,128 2,128 2,128 0
Full-Time Positions - Civilian 156 145 163 163 163 0
Finance Division Briefing Paper Police Department
Page 24
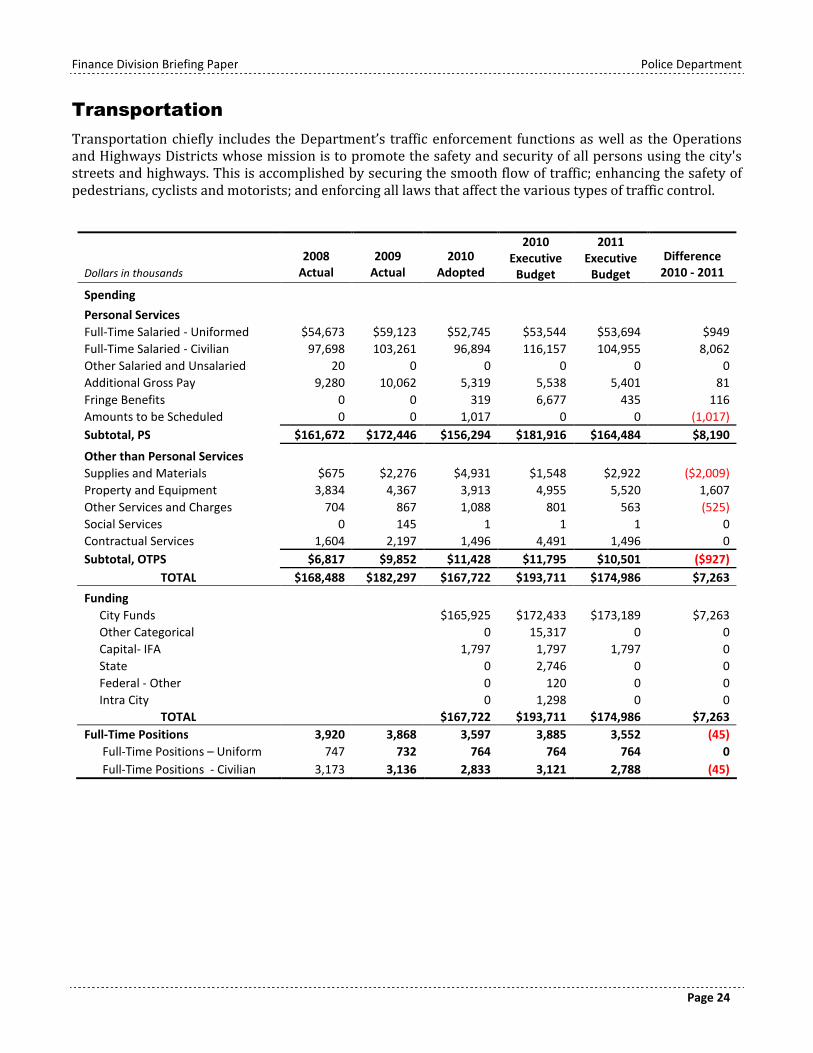
Transportation
Transportation chiefly includes the Department’s traffic enforcement functions as well as the Operationsand Highways Districts whose mission is to promote the safety and security of all persons using the city'sstreets and highways. This is accomplished by securing the smooth flow of traffic; enhancing the safety ofpedestrians, cyclists and motorists; and enforcing all laws that affect the various types of traffic control.
Dollars in thousands
2008Actual
2009Actual
2010Adopted
2010Executive
Budget
2011Executive
Budget
Difference2010 - 2011
Spending
Personal Services
Full-Time Salaried - Uniformed $54,673 $59,123 $52,745 $53,544 $53,694 $949
Full-Time Salaried - Civilian 97,698 103,261 96,894 116,157 104,955 8,062
Other Salaried and Unsalaried 20 0 0 0 0 0
Additional Gross Pay 9,280 10,062 5,319 5,538 5,401 81
Fringe Benefits 0 0 319 6,677 435 116
Amounts to be Scheduled 0 0 1,017 0 0 (1,017)
Subtotal, PS $161,672 $172,446 $156,294 $181,916 $164,484 $8,190
Other than Personal Services
Supplies and Materials $675 $2,276 $4,931 $1,548 $2,922 ($2,009)
Property and Equipment 3,834 4,367 3,913 4,955 5,520 1,607
Other Services and Charges 704 867 1,088 801 563 (525)
Social Services 0 145 1 1 1 0
Contractual Services 1,604 2,197 1,496 4,491 1,496 0
Subtotal, OTPS $6,817 $9,852 $11,428 $11,795 $10,501 ($927)
TOTAL $168,488 $182,297 $167,722 $193,711 $174,986 $7,263
Funding
City Funds $165,925 $172,433 $173,189 $7,263
Other Categorical 0 15,317 0 0
Capital- IFA 1,797 1,797 1,797 0
State 0 2,746 0 0
Federal - Other 0 120 0 0
Intra City 0 1,298 0 0
TOTAL $167,722 $193,711 $174,986 $7,263
Full-Time Positions 3,920 3,868 3,597 3,885 3,552 (45)
Full-Time Positions – Uniform 747 732 764 764 764 0
Full-Time Positions - Civilian 3,173 3,136 2,833 3,121 2,788 (45)
Finance Division Briefing Paper Police Department
Page 25
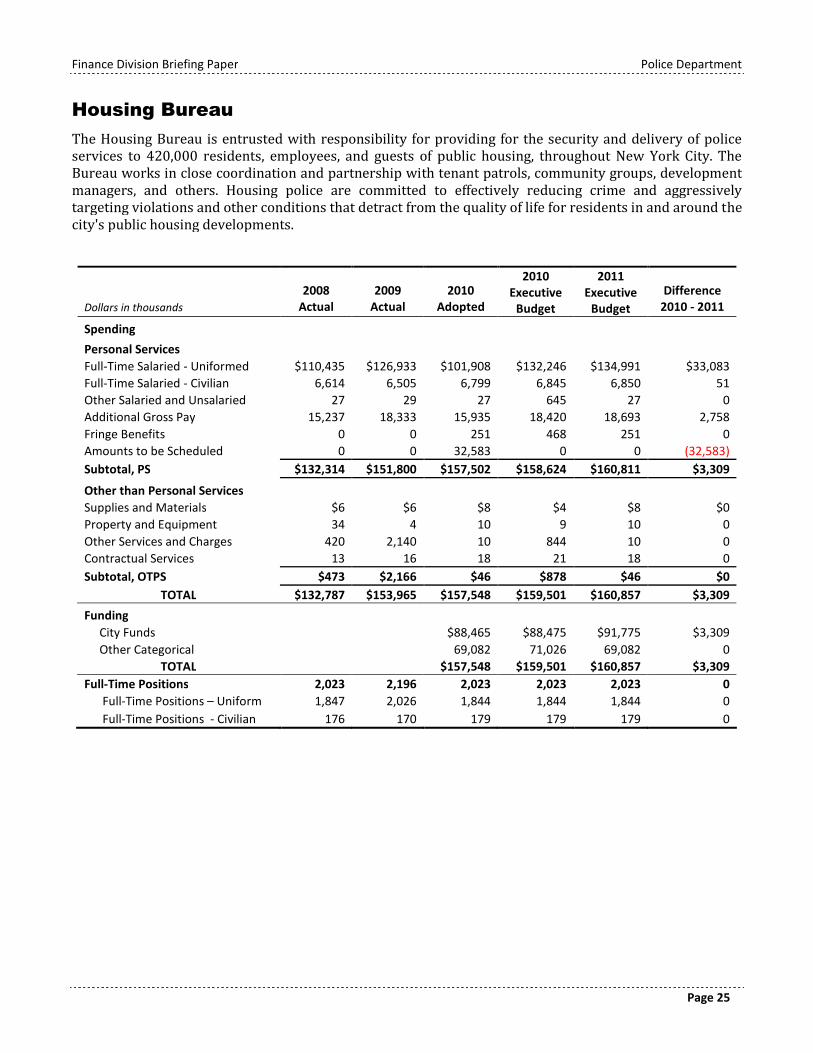
Housing Bureau
The Housing Bureau is entrusted with responsibility for providing for the security and delivery of policeservices to 420,000 residents, employees, and guests of public housing, throughout New York City. TheBureau works in close coordination and partnership with tenant patrols, community groups, developmentmanagers, and others. Housing police are committed to effectively reducing crime and aggressivelytargeting violations and other conditions that detract from the quality of life for residents in and around thecity's public housing developments.
Dollars in thousands
2008Actual
2009Actual
2010Adopted
2010Executive
Budget
2011Executive
Budget
Difference2010 - 2011
Spending
Personal Services
Full-Time Salaried - Uniformed $110,435 $126,933 $101,908 $132,246 $134,991 $33,083
Full-Time Salaried - Civilian 6,614 6,505 6,799 6,845 6,850 51
Other Salaried and Unsalaried 27 29 27 645 27 0
Additional Gross Pay 15,237 18,333 15,935 18,420 18,693 2,758
Fringe Benefits 0 0 251 468 251 0
Amounts to be Scheduled 0 0 32,583 0 0 (32,583)
Subtotal, PS $132,314 $151,800 $157,502 $158,624 $160,811 $3,309
Other than Personal Services
Supplies and Materials $6 $6 $8 $4 $8 $0
Property and Equipment 34 4 10 9 10 0
Other Services and Charges 420 2,140 10 844 10 0
Contractual Services 13 16 18 21 18 0
Subtotal, OTPS $473 $2,166 $46 $878 $46 $0
TOTAL $132,787 $153,965 $157,548 $159,501 $160,857 $3,309
Funding
City Funds $88,465 $88,475 $91,775 $3,309
Other Categorical 69,082 71,026 69,082 0
TOTAL $157,548 $159,501 $160,857 $3,309
Full-Time Positions 2,023 2,196 2,023 2,023 2,023 0
Full-Time Positions – Uniform 1,847 2,026 1,844 1,844 1,844 0
Full-Time Positions - Civilian 176 170 179 179 179 0
Finance Division Briefing Paper Police Department
Page 26
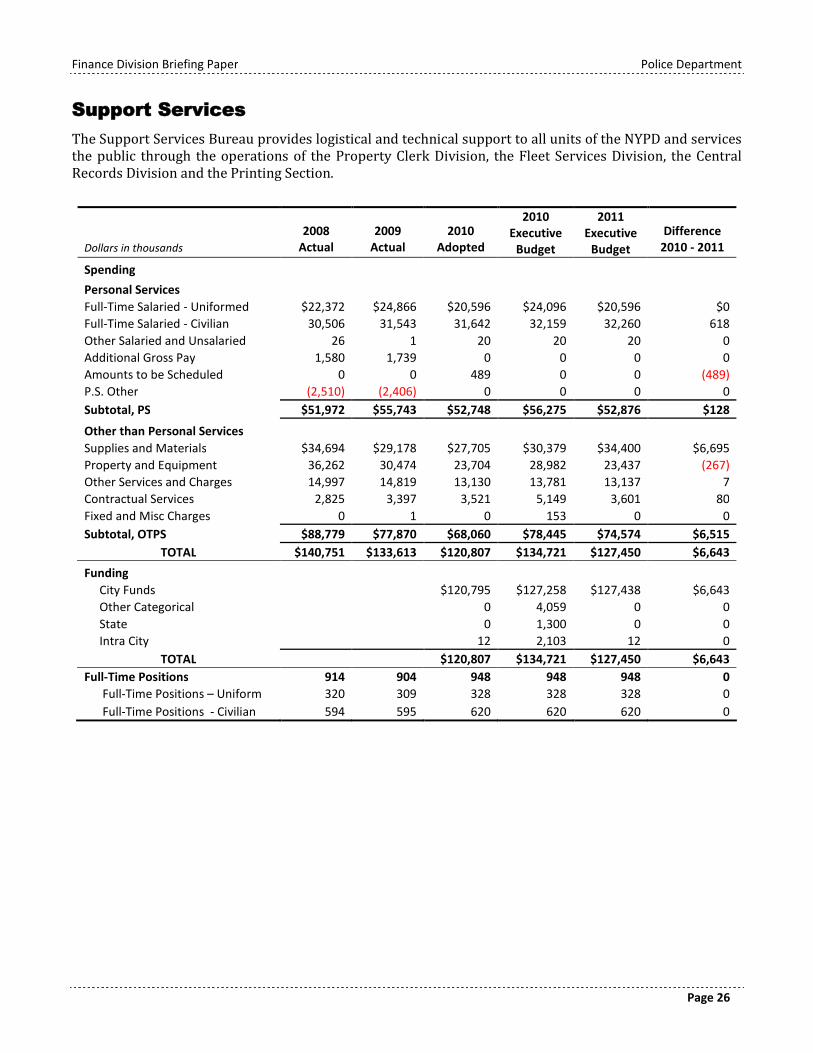
Support Services
The Support Services Bureau provides logistical and technical support to all units of the NYPD and servicesthe public through the operations of the Property Clerk Division, the Fleet Services Division, the CentralRecords Division and the Printing Section.
Dollars in thousands
2008Actual
2009Actual
2010Adopted
2010Executive
Budget
2011Executive
Budget
Difference2010 - 2011
Spending
Personal Services
Full-Time Salaried - Uniformed $22,372 $24,866 $20,596 $24,096 $20,596 $0
Full-Time Salaried - Civilian 30,506 31,543 31,642 32,159 32,260 618
Other Salaried and Unsalaried 26 1 20 20 20 0
Additional Gross Pay 1,580 1,739 0 0 0 0
Amounts to be Scheduled 0 0 489 0 0 (489)
P.S. Other (2,510) (2,406) 0 0 0 0
Subtotal, PS $51,972 $55,743 $52,748 $56,275 $52,876 $128
Other than Personal Services
Supplies and Materials $34,694 $29,178 $27,705 $30,379 $34,400 $6,695
Property and Equipment 36,262 30,474 23,704 28,982 23,437 (267)
Other Services and Charges 14,997 14,819 13,130 13,781 13,137 7
Contractual Services 2,825 3,397 3,521 5,149 3,601 80
Fixed and Misc Charges 0 1 0 153 0 0
Subtotal, OTPS $88,779 $77,870 $68,060 $78,445 $74,574 $6,515
TOTAL $140,751 $133,613 $120,807 $134,721 $127,450 $6,643
Funding
City Funds $120,795 $127,258 $127,438 $6,643
Other Categorical 0 4,059 0 0
State 0 1,300 0 0
Intra City 12 2,103 12 0
TOTAL $120,807 $134,721 $127,450 $6,643
Full-Time Positions 914 904 948 948 948 0
Full-Time Positions – Uniform 320 309 328 328 328 0
Full-Time Positions - Civilian 594 595 620 620 620 0
Finance Division Briefing Paper Police Department
Page 27
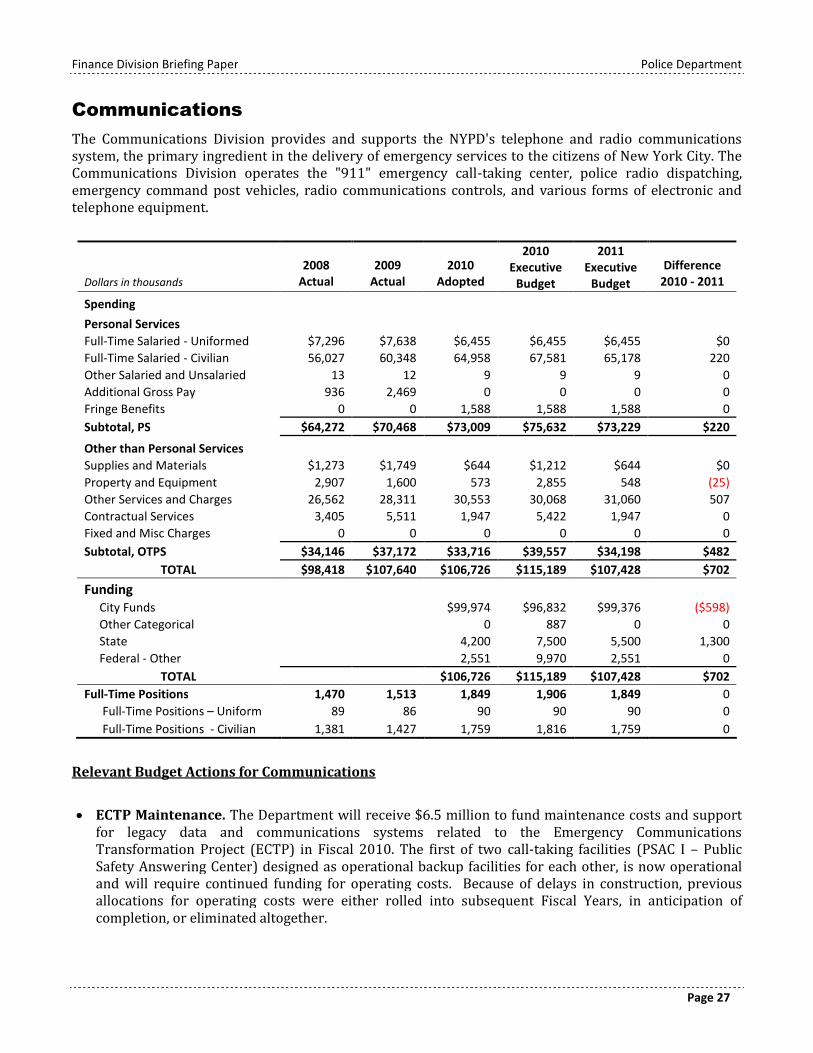
Communications
The Communications Division provides and supports the NYPD's telephone and radio communicationssystem, the primary ingredient in the delivery of emergency services to the citizens of New York City. TheCommunications Division operates the "911" emergency call-taking center, police radio dispatching,emergency command post vehicles, radio communications controls, and various forms of electronic andtelephone equipment.
Dollars in thousands
2008Actual
2009Actual
2010Adopted
2010Executive
Budget
2011Executive
Budget
Difference2010 - 2011
Spending
Personal Services
Full-Time Salaried - Uniformed $7,296 $7,638 $6,455 $6,455 $6,455 $0
Full-Time Salaried - Civilian 56,027 60,348 64,958 67,581 65,178 220
Other Salaried and Unsalaried 13 12 9 9 9 0
Additional Gross Pay 936 2,469 0 0 0 0
Fringe Benefits 0 0 1,588 1,588 1,588 0
Subtotal, PS $64,272 $70,468 $73,009 $75,632 $73,229 $220
Other than Personal Services
Supplies and Materials $1,273 $1,749 $644 $1,212 $644 $0
Property and Equipment 2,907 1,600 573 2,855 548 (25)
Other Services and Charges 26,562 28,311 30,553 30,068 31,060 507
Contractual Services 3,405 5,511 1,947 5,422 1,947 0
Fixed and Misc Charges 0 0 0 0 0 0
Subtotal, OTPS $34,146 $37,172 $33,716 $39,557 $34,198 $482
TOTAL $98,418 $107,640 $106,726 $115,189 $107,428 $702
FundingCity Funds $99,974 $96,832 $99,376 ($598)
Other Categorical 0 887 0 0
State 4,200 7,500 5,500 1,300
Federal - Other 2,551 9,970 2,551 0
TOTAL $106,726 $115,189 $107,428 $702
Full-Time Positions 1,470 1,513 1,849 1,906 1,849 0
Full-Time Positions – Uniform 89 86 90 90 90 0
Full-Time Positions - Civilian 1,381 1,427 1,759 1,816 1,759 0
Relevant Budget Actions for Communications
ECTP Maintenance. The Department will receive $6.5 million to fund maintenance costs and supportfor legacy data and communications systems related to the Emergency CommunicationsTransformation Project (ECTP) in Fiscal 2010. The first of two call-taking facilities (PSAC I – PublicSafety Answering Center) designed as operational backup facilities for each other, is now operationaland will require continued funding for operating costs. Because of delays in construction, previousallocations for operating costs were either rolled into subsequent Fiscal Years, in anticipation ofcompletion, or eliminated altogether.
Finance Division Briefing Paper Police Department
Page 28
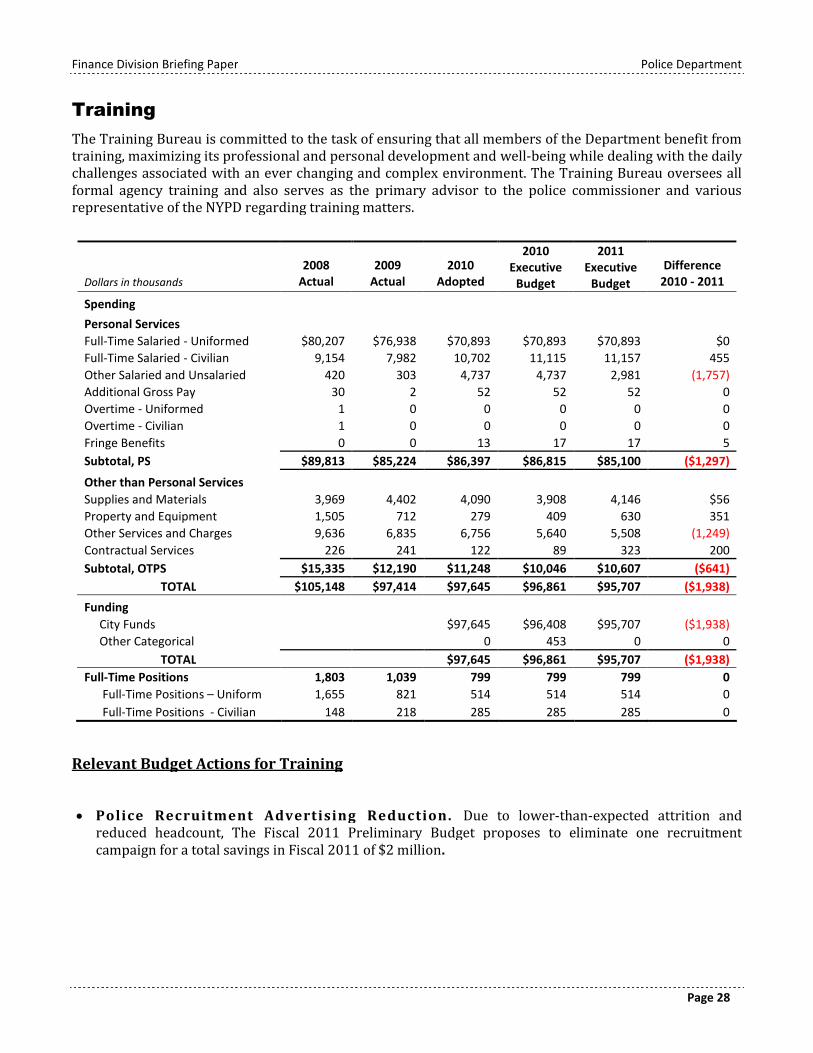
Training
The Training Bureau is committed to the task of ensuring that all members of the Department benefit fromtraining, maximizing its professional and personal development and well-being while dealing with the dailychallenges associated with an ever changing and complex environment. The Training Bureau oversees allformal agency training and also serves as the primary advisor to the police commissioner and variousrepresentative of the NYPD regarding training matters.
Dollars in thousands
2008Actual
2009Actual
2010Adopted
2010Executive
Budget
2011Executive
Budget
Difference2010 - 2011
Spending
Personal Services
Full-Time Salaried - Uniformed $80,207 $76,938 $70,893 $70,893 $70,893 $0
Full-Time Salaried - Civilian 9,154 7,982 10,702 11,115 11,157 455
Other Salaried and Unsalaried 420 303 4,737 4,737 2,981 (1,757)
Additional Gross Pay 30 2 52 52 52 0
Overtime - Uniformed 1 0 0 0 0 0
Overtime - Civilian 1 0 0 0 0 0
Fringe Benefits 0 0 13 17 17 5
Subtotal, PS $89,813 $85,224 $86,397 $86,815 $85,100 ($1,297)
Other than Personal Services
Supplies and Materials 3,969 4,402 4,090 3,908 4,146 $56
Property and Equipment 1,505 712 279 409 630 351
Other Services and Charges 9,636 6,835 6,756 5,640 5,508 (1,249)
Contractual Services 226 241 122 89 323 200
Subtotal, OTPS $15,335 $12,190 $11,248 $10,046 $10,607 ($641)
TOTAL $105,148 $97,414 $97,645 $96,861 $95,707 ($1,938)
Funding
City Funds $97,645 $96,408 $95,707 ($1,938)
Other Categorical 0 453 0 0
TOTAL $97,645 $96,861 $95,707 ($1,938)
Full-Time Positions 1,803 1,039 799 799 799 0
Full-Time Positions – Uniform 1,655 821 514 514 514 0
Full-Time Positions - Civilian 148 218 285 285 285 0
Relevant Budget Actions for Training
Police Recruitment Advertising Reduction. Due to lower-than-expected attrition andreduced headcount, The Fiscal 2011 Preliminary Budget proposes to eliminate one recruitmentcampaign for a total savings in Fiscal 2011 of $2 million.
Finance Division Briefing Paper Police Department
Page 29
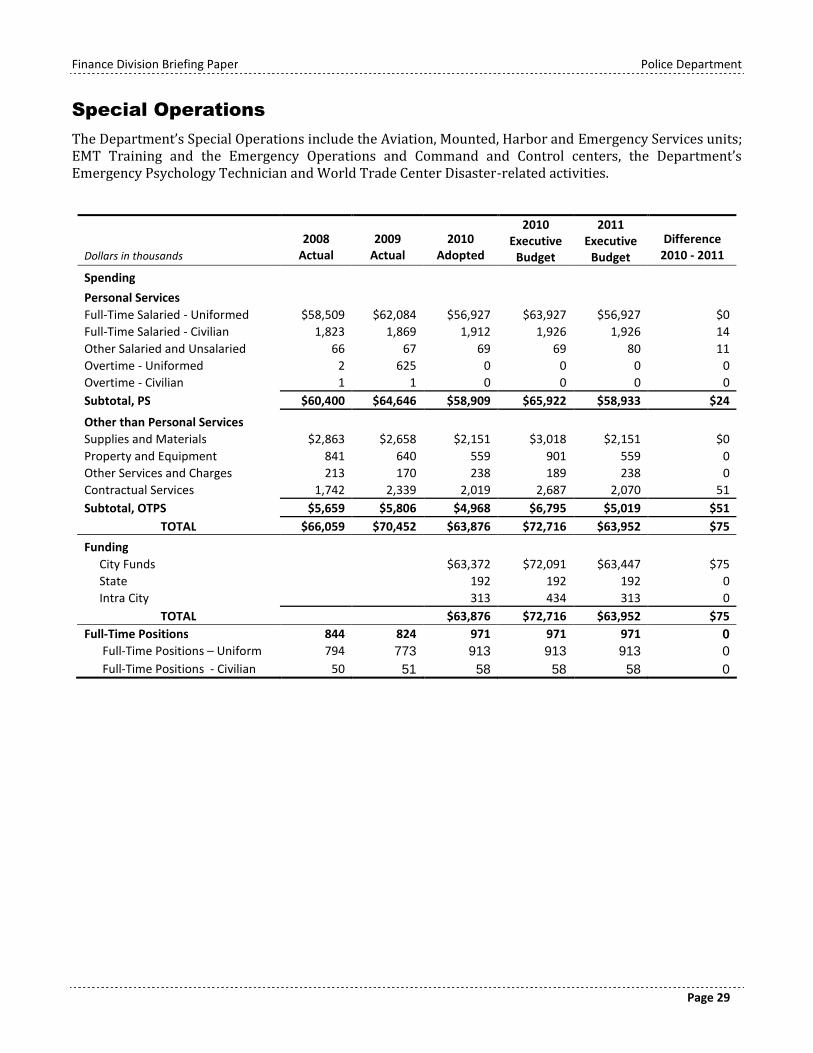
Special Operations
The Department’s Special Operations include the Aviation, Mounted, Harbor and Emergency Services units;EMT Training and the Emergency Operations and Command and Control centers, the Department’sEmergency Psychology Technician and World Trade Center Disaster-related activities.
Dollars in thousands
2008Actual
2009Actual
2010Adopted
2010Executive
Budget
2011Executive
Budget
Difference2010 - 2011
Spending
Personal Services
Full-Time Salaried - Uniformed $58,509 $62,084 $56,927 $63,927 $56,927 $0
Full-Time Salaried - Civilian 1,823 1,869 1,912 1,926 1,926 14
Other Salaried and Unsalaried 66 67 69 69 80 11
Overtime - Uniformed 2 625 0 0 0 0
Overtime - Civilian 1 1 0 0 0 0
Subtotal, PS $60,400 $64,646 $58,909 $65,922 $58,933 $24
Other than Personal Services
Supplies and Materials $2,863 $2,658 $2,151 $3,018 $2,151 $0
Property and Equipment 841 640 559 901 559 0
Other Services and Charges 213 170 238 189 238 0
Contractual Services 1,742 2,339 2,019 2,687 2,070 51
Subtotal, OTPS $5,659 $5,806 $4,968 $6,795 $5,019 $51
TOTAL $66,059 $70,452 $63,876 $72,716 $63,952 $75
Funding
City Funds $63,372 $72,091 $63,447 $75
State 192 192 192 0
Intra City 313 434 313 0
TOTAL $63,876 $72,716 $63,952 $75
Full-Time Positions 844 824 971 971 971 0Full-Time Positions – Uniform 794 773 913 913 913 0
Full-Time Positions - Civilian 50 51 58 58 58 0
Finance Division Briefing Paper Police Department
Page 30
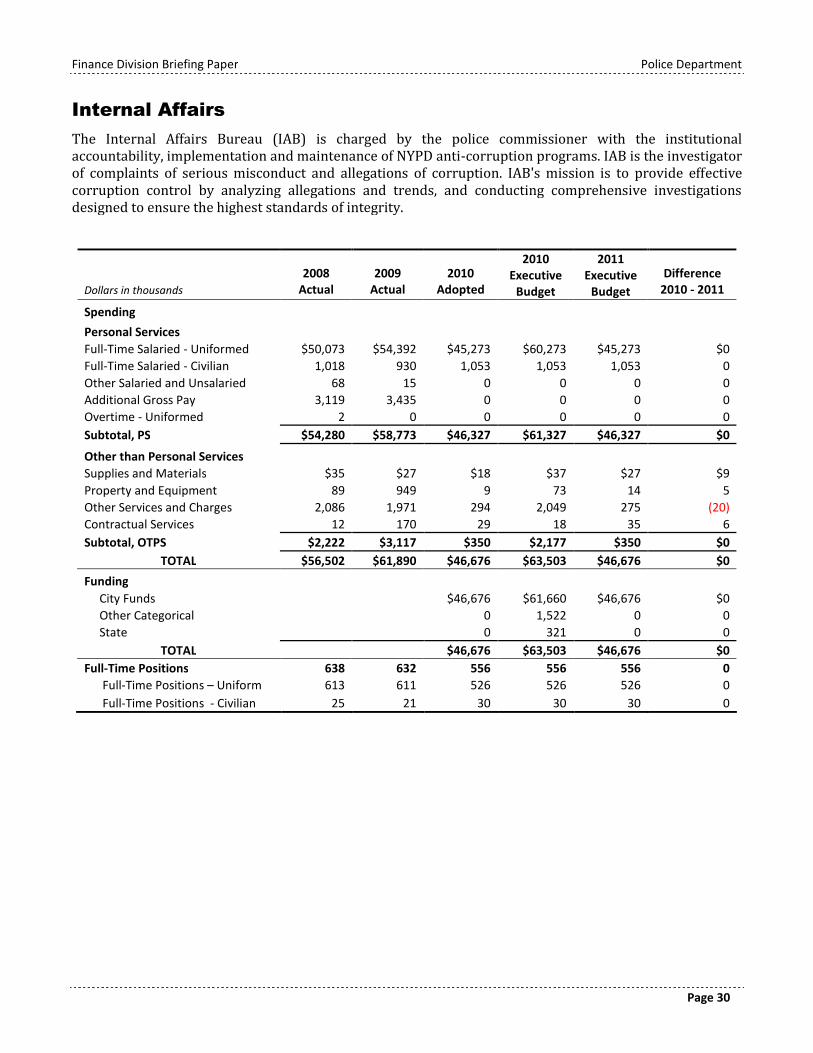
Internal Affairs
The Internal Affairs Bureau (IAB) is charged by the police commissioner with the institutionalaccountability, implementation and maintenance of NYPD anti-corruption programs. IAB is the investigatorof complaints of serious misconduct and allegations of corruption. IAB's mission is to provide effectivecorruption control by analyzing allegations and trends, and conducting comprehensive investigationsdesigned to ensure the highest standards of integrity.
Dollars in thousands
2008Actual
2009Actual
2010Adopted
2010Executive
Budget
2011Executive
Budget
Difference2010 - 2011
Spending
Personal Services
Full-Time Salaried - Uniformed $50,073 $54,392 $45,273 $60,273 $45,273 $0
Full-Time Salaried - Civilian 1,018 930 1,053 1,053 1,053 0
Other Salaried and Unsalaried 68 15 0 0 0 0
Additional Gross Pay 3,119 3,435 0 0 0 0
Overtime - Uniformed 2 0 0 0 0 0
Subtotal, PS $54,280 $58,773 $46,327 $61,327 $46,327 $0
Other than Personal Services
Supplies and Materials $35 $27 $18 $37 $27 $9
Property and Equipment 89 949 9 73 14 5
Other Services and Charges 2,086 1,971 294 2,049 275 (20)
Contractual Services 12 170 29 18 35 6
Subtotal, OTPS $2,222 $3,117 $350 $2,177 $350 $0
TOTAL $56,502 $61,890 $46,676 $63,503 $46,676 $0
Funding
City Funds $46,676 $61,660 $46,676 $0
Other Categorical 0 1,522 0 0
State 0 321 0 0
TOTAL $46,676 $63,503 $46,676 $0
Full-Time Positions 638 632 556 556 556 0
Full-Time Positions – Uniform 613 611 526 526 526 0
Full-Time Positions - Civilian 25 21 30 30 30 0
Finance Division Briefing Paper Police Department
Page 31
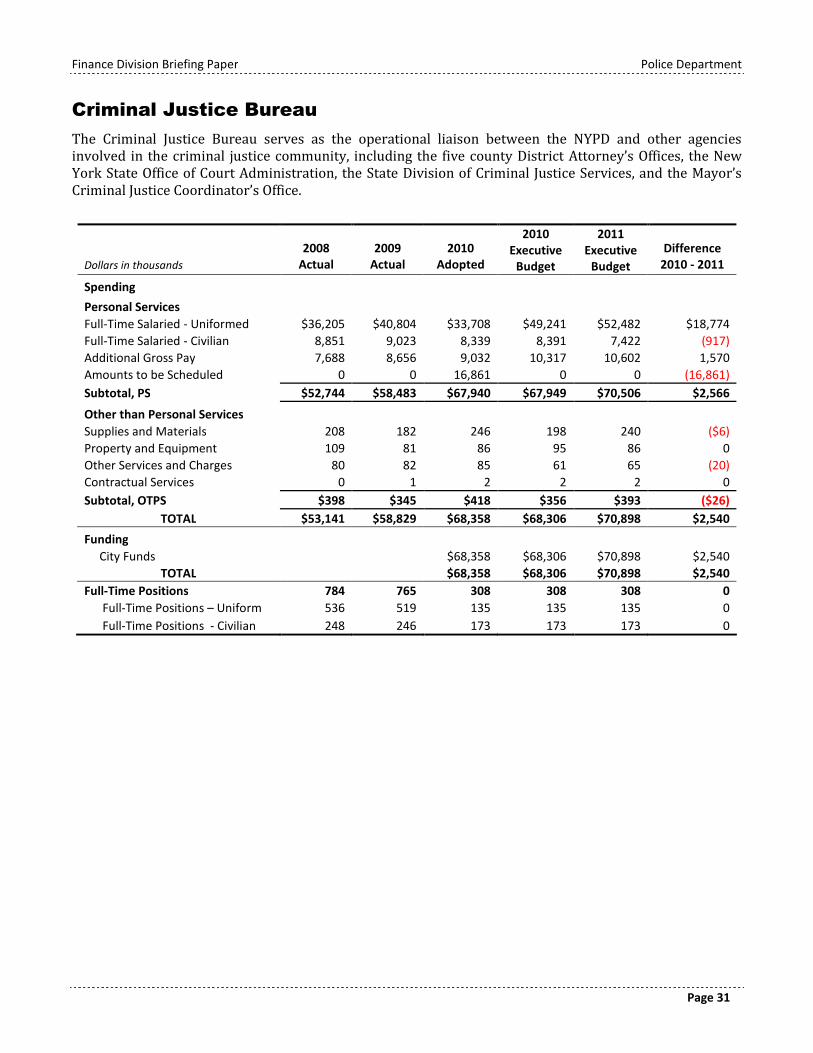
Criminal Justice Bureau
The Criminal Justice Bureau serves as the operational liaison between the NYPD and other agenciesinvolved in the criminal justice community, including the five county District Attorney’s Offices, the NewYork State Office of Court Administration, the State Division of Criminal Justice Services, and the Mayor’sCriminal Justice Coordinator’s Office.
Dollars in thousands
2008Actual
2009Actual
2010Adopted
2010Executive
Budget
2011Executive
Budget
Difference2010 - 2011
Spending
Personal Services
Full-Time Salaried - Uniformed $36,205 $40,804 $33,708 $49,241 $52,482 $18,774
Full-Time Salaried - Civilian 8,851 9,023 8,339 8,391 7,422 (917)
Additional Gross Pay 7,688 8,656 9,032 10,317 10,602 1,570
Amounts to be Scheduled 0 0 16,861 0 0 (16,861)
Subtotal, PS $52,744 $58,483 $67,940 $67,949 $70,506 $2,566
Other than Personal Services
Supplies and Materials 208 182 246 198 240 ($6)
Property and Equipment 109 81 86 95 86 0
Other Services and Charges 80 82 85 61 65 (20)
Contractual Services 0 1 2 2 2 0
Subtotal, OTPS $398 $345 $418 $356 $393 ($26)
TOTAL $53,141 $58,829 $68,358 $68,306 $70,898 $2,540
Funding
City Funds $68,358 $68,306 $70,898 $2,540
TOTAL $68,358 $68,306 $70,898 $2,540
Full-Time Positions 784 765 308 308 308 0
Full-Time Positions – Uniform 536 519 135 135 135 0
Full-Time Positions - Civilian 248 246 173 173 173 0
Finance Division Briefing Paper Police Department
Page 32
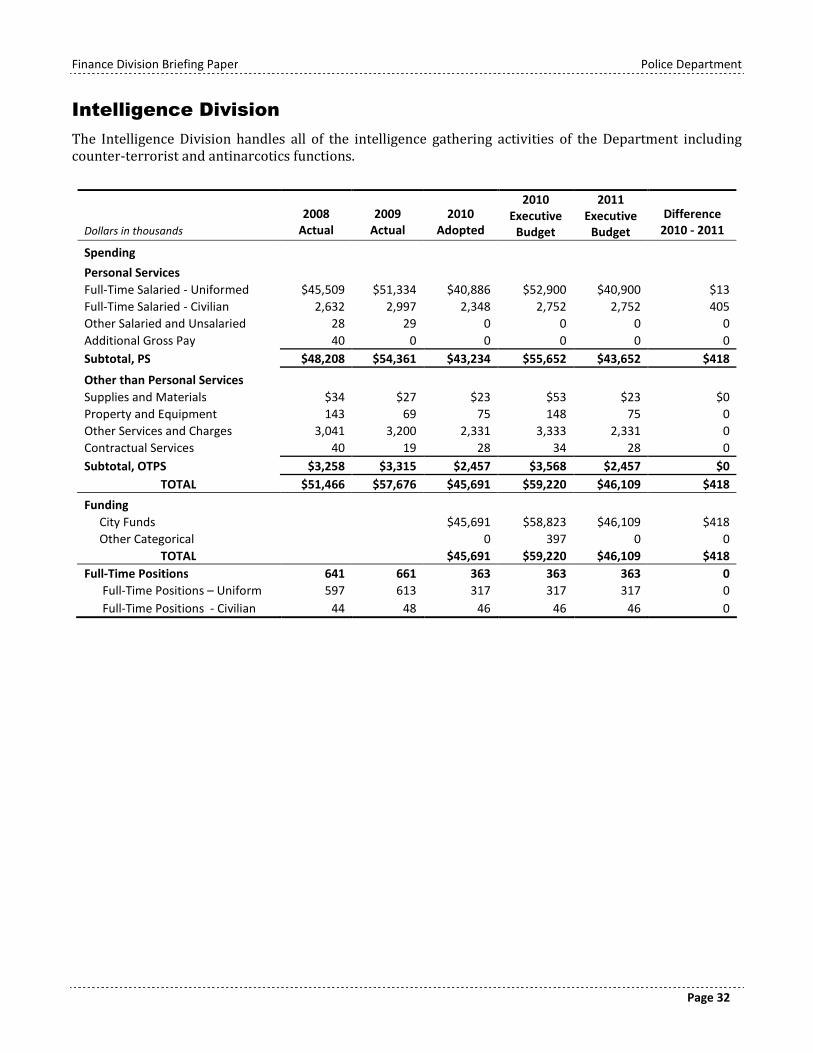
Intelligence Division
The Intelligence Division handles all of the intelligence gathering activities of the Department includingcounter-terrorist and antinarcotics functions.
Dollars in thousands
2008Actual
2009Actual
2010Adopted
2010Executive
Budget
2011Executive
Budget
Difference2010 - 2011
Spending
Personal Services
Full-Time Salaried - Uniformed $45,509 $51,334 $40,886 $52,900 $40,900 $13
Full-Time Salaried - Civilian 2,632 2,997 2,348 2,752 2,752 405
Other Salaried and Unsalaried 28 29 0 0 0 0
Additional Gross Pay 40 0 0 0 0 0
Subtotal, PS $48,208 $54,361 $43,234 $55,652 $43,652 $418
Other than Personal Services
Supplies and Materials $34 $27 $23 $53 $23 $0
Property and Equipment 143 69 75 148 75 0
Other Services and Charges 3,041 3,200 2,331 3,333 2,331 0
Contractual Services 40 19 28 34 28 0
Subtotal, OTPS $3,258 $3,315 $2,457 $3,568 $2,457 $0
TOTAL $51,466 $57,676 $45,691 $59,220 $46,109 $418
Funding
City Funds $45,691 $58,823 $46,109 $418
Other Categorical 0 397 0 0
TOTAL $45,691 $59,220 $46,109 $418
Full-Time Positions 641 661 363 363 363 0
Full-Time Positions – Uniform 597 613 317 317 317 0
Full-Time Positions - Civilian 44 48 46 46 46 0
Finance Division Briefing Paper Police Department
Page 33
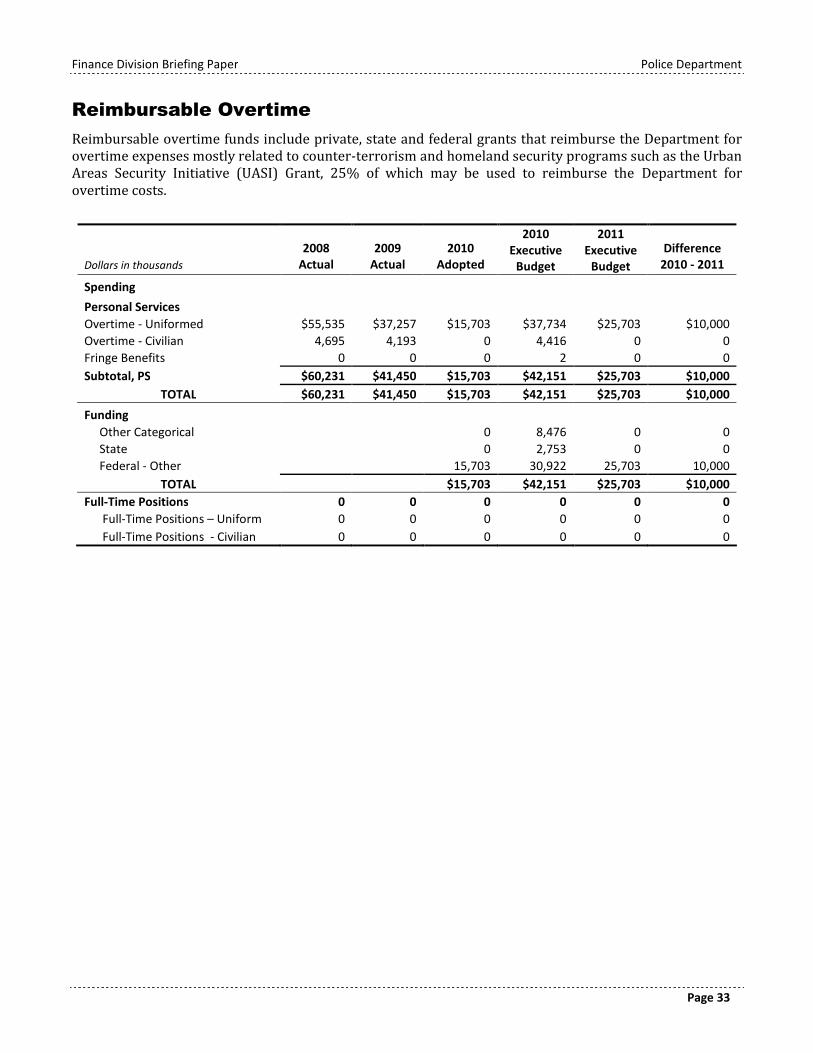
Reimbursable Overtime
Reimbursable overtime funds include private, state and federal grants that reimburse the Department forovertime expenses mostly related to counter-terrorism and homeland security programs such as the UrbanAreas Security Initiative (UASI) Grant, 25% of which may be used to reimburse the Department forovertime costs.
Dollars in thousands
2008Actual
2009Actual
2010Adopted
2010Executive
Budget
2011Executive
Budget
Difference2010 - 2011
Spending
Personal Services
Overtime - Uniformed $55,535 $37,257 $15,703 $37,734 $25,703 $10,000
Overtime - Civilian 4,695 4,193 0 4,416 0 0
Fringe Benefits 0 0 0 2 0 0
Subtotal, PS $60,231 $41,450 $15,703 $42,151 $25,703 $10,000
TOTAL $60,231 $41,450 $15,703 $42,151 $25,703 $10,000
Funding
Other Categorical 0 8,476 0 0
State 0 2,753 0 0
Federal - Other 15,703 30,922 25,703 10,000
TOTAL $15,703 $42,151 $25,703 $10,000
Full-Time Positions 0 0 0 0 0 0
Full-Time Positions – Uniform 0 0 0 0 0 0
Full-Time Positions - Civilian 0 0 0 0 0 0
Finance Division Briefing Paper Police Department
Page 34
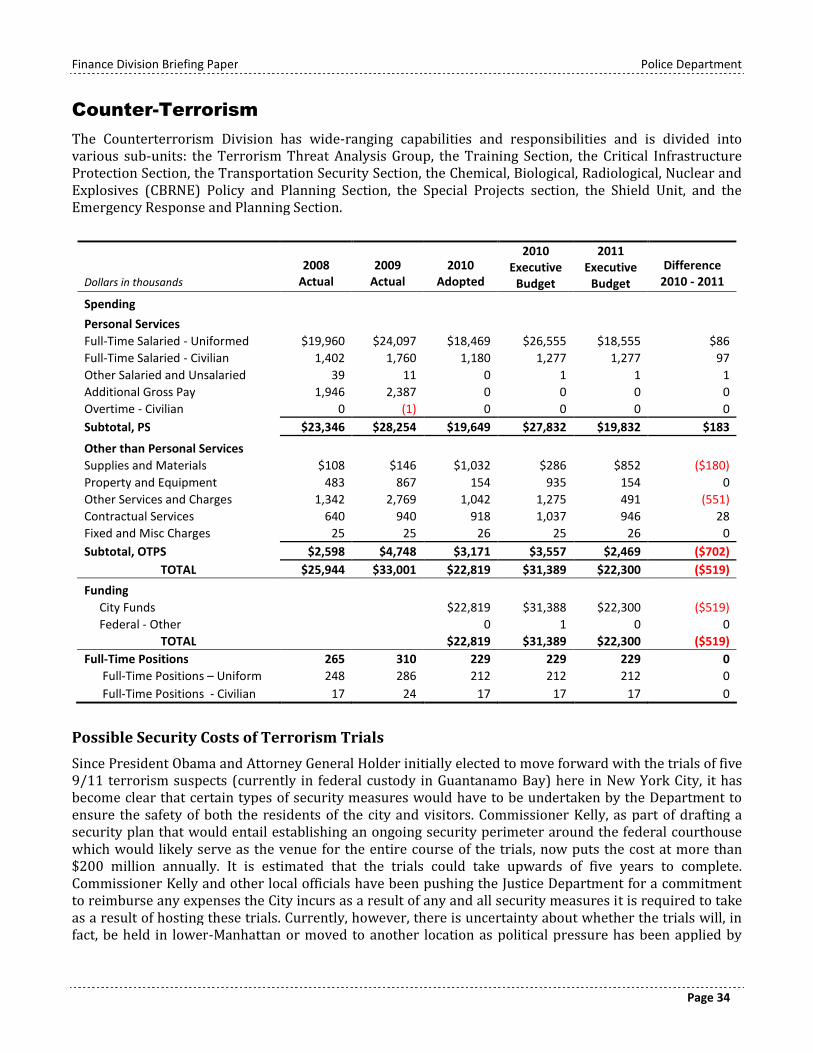
Counter-Terrorism
The Counterterrorism Division has wide-ranging capabilities and responsibilities and is divided intovarious sub-units: the Terrorism Threat Analysis Group, the Training Section, the Critical InfrastructureProtection Section, the Transportation Security Section, the Chemical, Biological, Radiological, Nuclear andExplosives (CBRNE) Policy and Planning Section, the Special Projects section, the Shield Unit, and theEmergency Response and Planning Section.
Dollars in thousands
2008Actual
2009Actual
2010Adopted
2010Executive
Budget
2011Executive
Budget
Difference2010 - 2011
Spending
Personal Services
Full-Time Salaried - Uniformed $19,960 $24,097 $18,469 $26,555 $18,555 $86
Full-Time Salaried - Civilian 1,402 1,760 1,180 1,277 1,277 97
Other Salaried and Unsalaried 39 11 0 1 1 1
Additional Gross Pay 1,946 2,387 0 0 0 0
Overtime - Civilian 0 (1) 0 0 0 0
Subtotal, PS $23,346 $28,254 $19,649 $27,832 $19,832 $183
Other than Personal Services
Supplies and Materials $108 $146 $1,032 $286 $852 ($180)
Property and Equipment 483 867 154 935 154 0
Other Services and Charges 1,342 2,769 1,042 1,275 491 (551)
Contractual Services 640 940 918 1,037 946 28
Fixed and Misc Charges 25 25 26 25 26 0
Subtotal, OTPS $2,598 $4,748 $3,171 $3,557 $2,469 ($702)
TOTAL $25,944 $33,001 $22,819 $31,389 $22,300 ($519)
Funding
City Funds $22,819 $31,388 $22,300 ($519)
Federal - Other 0 1 0 0
TOTAL $22,819 $31,389 $22,300 ($519)
Full-Time Positions 265 310 229 229 229 0
Full-Time Positions – Uniform 248 286 212 212 212 0
Full-Time Positions - Civilian 17 24 17 17 17 0
Possible Security Costs of Terrorism Trials
Since President Obama and Attorney General Holder initially elected to move forward with the trials of five9/11 terrorism suspects (currently in federal custody in Guantanamo Bay) here in New York City, it hasbecome clear that certain types of security measures would have to be undertaken by the Department toensure the safety of both the residents of the city and visitors. Commissioner Kelly, as part of drafting asecurity plan that would entail establishing an ongoing security perimeter around the federal courthousewhich would likely serve as the venue for the entire course of the trials, now puts the cost at more than$200 million annually. It is estimated that the trials could take upwards of five years to complete.Commissioner Kelly and other local officials have been pushing the Justice Department for a commitmentto reimburse any expenses the City incurs as a result of any and all security measures it is required to takeas a result of hosting these trials. Currently, however, there is uncertainty about whether the trials will, infact, be held in lower-Manhattan or moved to another location as political pressure has been applied by

Finance Division Briefing Paper Police Department
Page 35
some local officials as well as Community Board 1, to move the trials elsewhere. Possible threats ofterrorism as well as the daunting logistics related to necessary security measures have combined to cause areassessment of the wisdom and logistical practicality of holding the trials in lower-Manhattan.
Finance Division Briefing Paper Police Department
Page 36
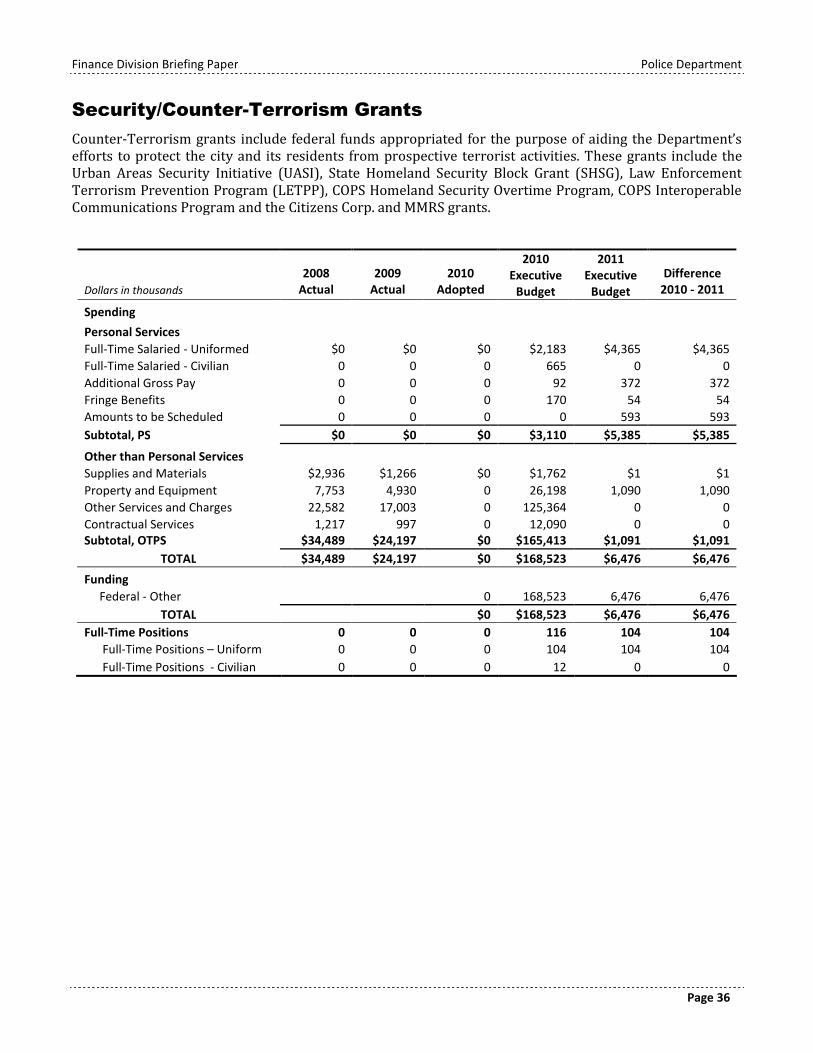
Security/Counter-Terrorism Grants
Counter-Terrorism grants include federal funds appropriated for the purpose of aiding the Department’sefforts to protect the city and its residents from prospective terrorist activities. These grants include theUrban Areas Security Initiative (UASI), State Homeland Security Block Grant (SHSG), Law EnforcementTerrorism Prevention Program (LETPP), COPS Homeland Security Overtime Program, COPS InteroperableCommunications Program and the Citizens Corp. and MMRS grants.
Dollars in thousands
2008Actual
2009Actual
2010Adopted
2010Executive
Budget
2011Executive
Budget
Difference2010 - 2011
Spending
Personal Services
Full-Time Salaried - Uniformed $0 $0 $0 $2,183 $4,365 $4,365
Full-Time Salaried - Civilian 0 0 0 665 0 0
Additional Gross Pay 0 0 0 92 372 372
Fringe Benefits 0 0 0 170 54 54
Amounts to be Scheduled 0 0 0 0 593 593
Subtotal, PS $0 $0 $0 $3,110 $5,385 $5,385
Other than Personal Services
Supplies and Materials $2,936 $1,266 $0 $1,762 $1 $1
Property and Equipment 7,753 4,930 0 26,198 1,090 1,090
Other Services and Charges 22,582 17,003 0 125,364 0 0
Contractual Services 1,217 997 0 12,090 0 0Subtotal, OTPS $34,489 $24,197 $0 $165,413 $1,091 $1,091
TOTAL $34,489 $24,197 $0 $168,523 $6,476 $6,476
Funding
Federal - Other 0 168,523 6,476 6,476
TOTAL $0 $168,523 $6,476 $6,476
Full-Time Positions 0 0 0 116 104 104
Full-Time Positions – Uniform 0 0 0 104 104 104
Full-Time Positions - Civilian 0 0 0 12 0 0
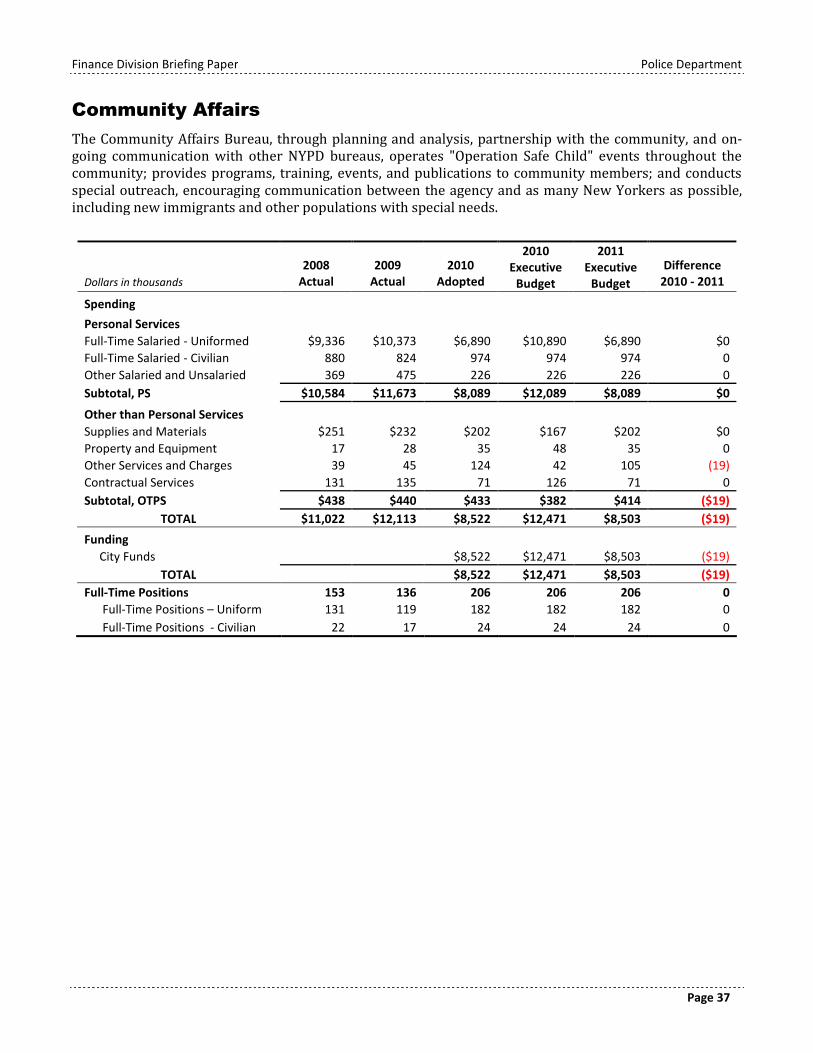
Finance Division Briefing Paper Police Department
Page 37
Community Affairs
The Community Affairs Bureau, through planning and analysis, partnership with the community, and on-going communication with other NYPD bureaus, operates "Operation Safe Child" events throughout thecommunity; provides programs, training, events, and publications to community members; and conductsspecial outreach, encouraging communication between the agency and as many New Yorkers as possible,including new immigrants and other populations with special needs.
Dollars in thousands
2008Actual
2009Actual
2010Adopted
2010Executive
Budget
2011Executive
Budget
Difference2010 - 2011
Spending
Personal Services
Full-Time Salaried - Uniformed $9,336 $10,373 $6,890 $10,890 $6,890 $0
Full-Time Salaried - Civilian 880 824 974 974 974 0
Other Salaried and Unsalaried 369 475 226 226 226 0
Subtotal, PS $10,584 $11,673 $8,089 $12,089 $8,089 $0
Other than Personal Services
Supplies and Materials $251 $232 $202 $167 $202 $0
Property and Equipment 17 28 35 48 35 0
Other Services and Charges 39 45 124 42 105 (19)
Contractual Services 131 135 71 126 71 0
Subtotal, OTPS $438 $440 $433 $382 $414 ($19)
TOTAL $11,022 $12,113 $8,522 $12,471 $8,503 ($19)
Funding
City Funds $8,522 $12,471 $8,503 ($19)
TOTAL $8,522 $12,471 $8,503 ($19)
Full-Time Positions 153 136 206 206 206 0
Full-Time Positions – Uniform 131 119 182 182 182 0
Full-Time Positions - Civilian 22 17 24 24 24 0
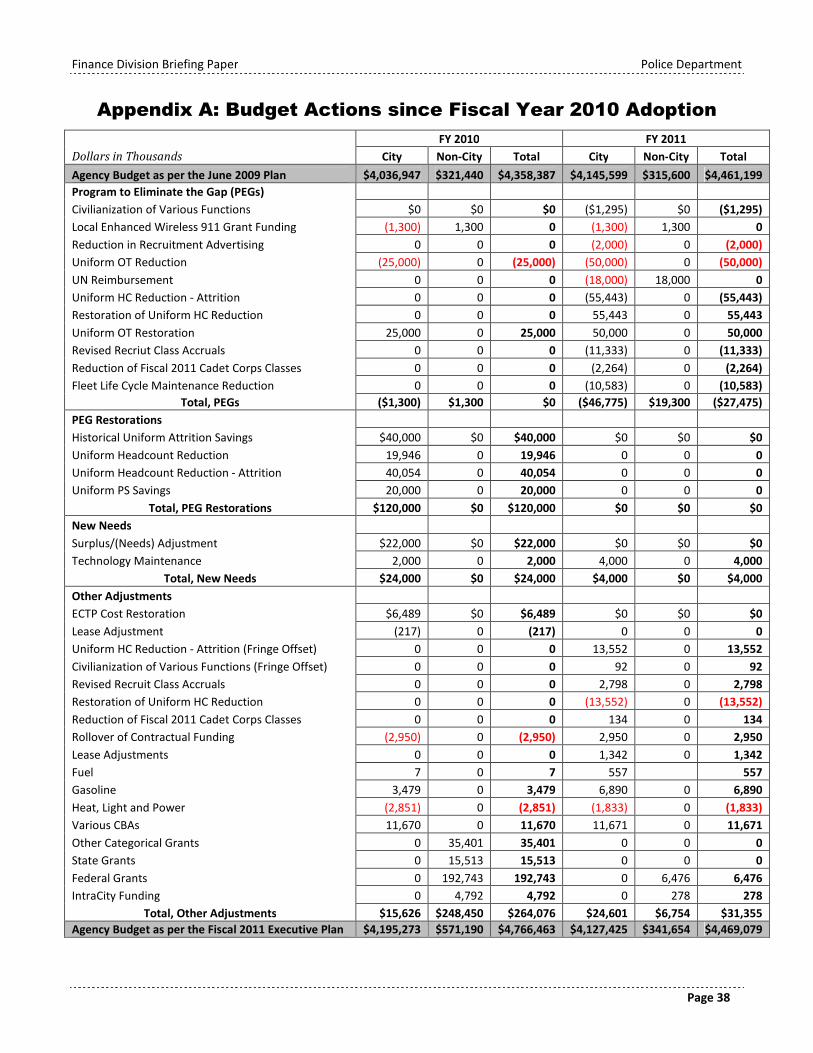
Finance Division Briefing Paper Police Department
Page 38
Appendix A: Budget Actions since Fiscal Year 2010 Adoption
FY 2010 FY 2011
Dollars in Thousands City Non-City Total City Non-City Total
Agency Budget as per the June 2009 Plan $4,036,947 $321,440 $4,358,387 $4,145,599 $315,600 $4,461,199
Program to Eliminate the Gap (PEGs)
Civilianization of Various Functions $0 $0 $0 ($1,295) $0 ($1,295)
Local Enhanced Wireless 911 Grant Funding (1,300) 1,300 0 (1,300) 1,300 0
Reduction in Recruitment Advertising 0 0 0 (2,000) 0 (2,000)
Uniform OT Reduction (25,000) 0 (25,000) (50,000) 0 (50,000)
UN Reimbursement 0 0 0 (18,000) 18,000 0
Uniform HC Reduction - Attrition 0 0 0 (55,443) 0 (55,443)
Restoration of Uniform HC Reduction 0 0 0 55,443 0 55,443
Uniform OT Restoration 25,000 0 25,000 50,000 0 50,000
Revised Recriut Class Accruals 0 0 0 (11,333) 0 (11,333)
Reduction of Fiscal 2011 Cadet Corps Classes 0 0 0 (2,264) 0 (2,264)
Fleet Life Cycle Maintenance Reduction 0 0 0 (10,583) 0 (10,583)
Total, PEGs ($1,300) $1,300 $0 ($46,775) $19,300 ($27,475)
PEG Restorations
Historical Uniform Attrition Savings $40,000 $0 $40,000 $0 $0 $0
Uniform Headcount Reduction 19,946 0 19,946 0 0 0
Uniform Headcount Reduction - Attrition 40,054 0 40,054 0 0 0
Uniform PS Savings 20,000 0 20,000 0 0 0
Total, PEG Restorations $120,000 $0 $120,000 $0 $0 $0
New Needs
Surplus/(Needs) Adjustment $22,000 $0 $22,000 $0 $0 $0
Technology Maintenance 2,000 0 2,000 4,000 0 4,000
Total, New Needs $24,000 $0 $24,000 $4,000 $0 $4,000
Other Adjustments
ECTP Cost Restoration $6,489 $0 $6,489 $0 $0 $0
Lease Adjustment (217) 0 (217) 0 0 0
Uniform HC Reduction - Attrition (Fringe Offset) 0 0 0 13,552 0 13,552
Civilianization of Various Functions (Fringe Offset) 0 0 0 92 0 92
Revised Recruit Class Accruals 0 0 0 2,798 0 2,798
Restoration of Uniform HC Reduction 0 0 0 (13,552) 0 (13,552)
Reduction of Fiscal 2011 Cadet Corps Classes 0 0 0 134 0 134
Rollover of Contractual Funding (2,950) 0 (2,950) 2,950 0 2,950
Lease Adjustments 0 0 0 1,342 0 1,342
Fuel 7 0 7 557 557
Gasoline 3,479 0 3,479 6,890 0 6,890
Heat, Light and Power (2,851) 0 (2,851) (1,833) 0 (1,833)
Various CBAs 11,670 0 11,670 11,671 0 11,671
Other Categorical Grants 0 35,401 35,401 0 0 0
State Grants 0 15,513 15,513 0 0 0
Federal Grants 0 192,743 192,743 0 6,476 6,476
IntraCity Funding 0 4,792 4,792 0 278 278
Total, Other Adjustments $15,626 $248,450 $264,076 $24,601 $6,754 $31,355
Agency Budget as per the Fiscal 2011 Executive Plan $4,195,273 $571,190 $4,766,463 $4,127,425 $341,654 $4,469,079
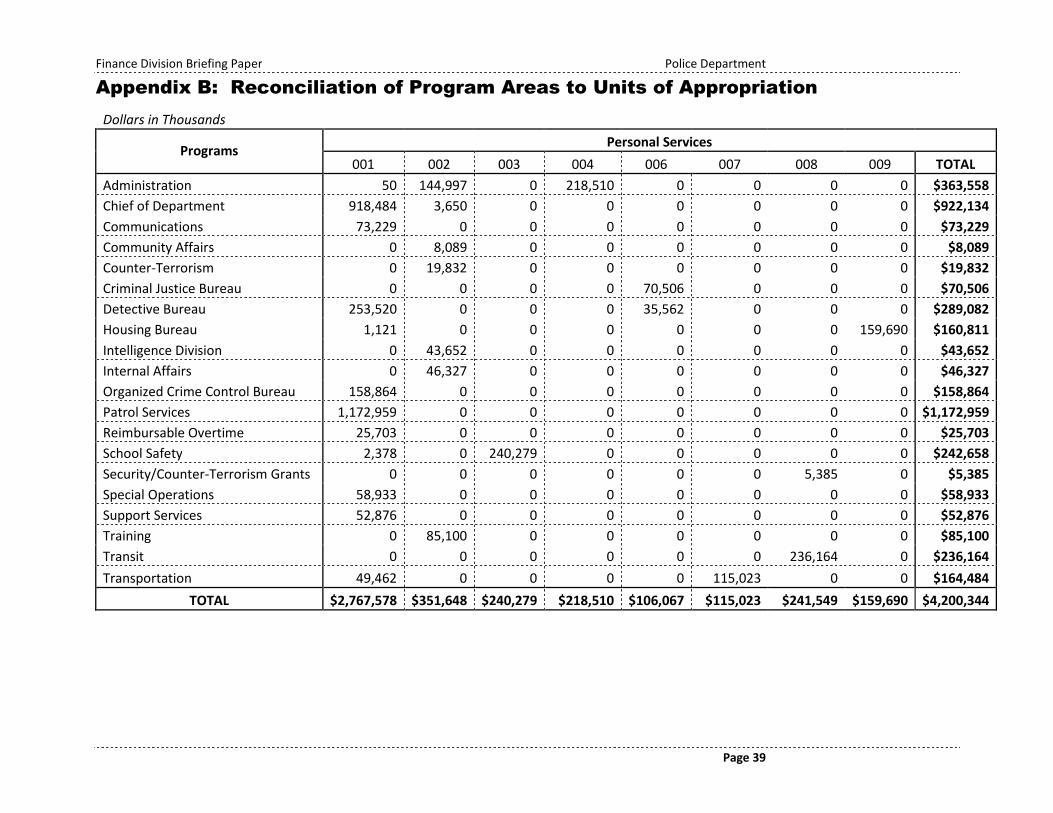
Finance Division Briefing Paper Police Department
Page 39
Appendix B: Reconciliation of Program Areas to Units of Appropriation
Dollars in Thousands
Personal ServicesPrograms
001 002 003 004 006 007 008 009 TOTAL
Administration 50 144,997 0 218,510 0 0 0 0 $363,558
Chief of Department 918,484 3,650 0 0 0 0 0 0 $922,134
Communications 73,229 0 0 0 0 0 0 0 $73,229
Community Affairs 0 8,089 0 0 0 0 0 0 $8,089
Counter-Terrorism 0 19,832 0 0 0 0 0 0 $19,832
Criminal Justice Bureau 0 0 0 0 70,506 0 0 0 $70,506
Detective Bureau 253,520 0 0 0 35,562 0 0 0 $289,082
Housing Bureau 1,121 0 0 0 0 0 0 159,690 $160,811
Intelligence Division 0 43,652 0 0 0 0 0 0 $43,652
Internal Affairs 0 46,327 0 0 0 0 0 0 $46,327
Organized Crime Control Bureau 158,864 0 0 0 0 0 0 0 $158,864
Patrol Services 1,172,959 0 0 0 0 0 0 0 $1,172,959
Reimbursable Overtime 25,703 0 0 0 0 0 0 0 $25,703
School Safety 2,378 0 240,279 0 0 0 0 0 $242,658
Security/Counter-Terrorism Grants 0 0 0 0 0 0 5,385 0 $5,385
Special Operations 58,933 0 0 0 0 0 0 0 $58,933
Support Services 52,876 0 0 0 0 0 0 0 $52,876
Training 0 85,100 0 0 0 0 0 0 $85,100
Transit 0 0 0 0 0 0 236,164 0 $236,164
Transportation 49,462 0 0 0 0 115,023 0 0 $164,484
TOTAL $2,767,578 $351,648 $240,279 $218,510 $106,067 $115,023 $241,549 $159,690 $4,200,344
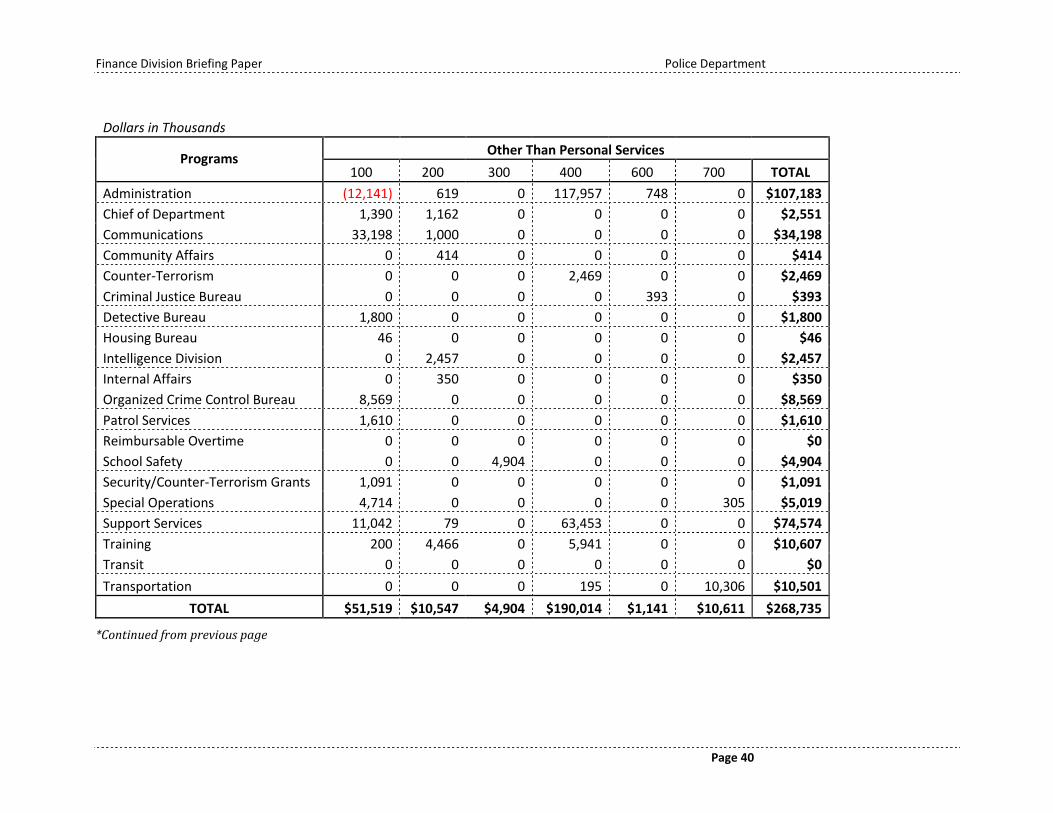
Finance Division Briefing Paper Police Department
Page 40
Dollars in Thousands
Other Than Personal ServicesPrograms
100 200 300 400 600 700 TOTAL
Administration (12,141) 619 0 117,957 748 0 $107,183
Chief of Department 1,390 1,162 0 0 0 0 $2,551
Communications 33,198 1,000 0 0 0 0 $34,198
Community Affairs 0 414 0 0 0 0 $414
Counter-Terrorism 0 0 0 2,469 0 0 $2,469
Criminal Justice Bureau 0 0 0 0 393 0 $393
Detective Bureau 1,800 0 0 0 0 0 $1,800
Housing Bureau 46 0 0 0 0 0 $46
Intelligence Division 0 2,457 0 0 0 0 $2,457
Internal Affairs 0 350 0 0 0 0 $350
Organized Crime Control Bureau 8,569 0 0 0 0 0 $8,569
Patrol Services 1,610 0 0 0 0 0 $1,610
Reimbursable Overtime 0 0 0 0 0 0 $0
School Safety 0 0 4,904 0 0 0 $4,904
Security/Counter-Terrorism Grants 1,091 0 0 0 0 0 $1,091
Special Operations 4,714 0 0 0 0 305 $5,019
Support Services 11,042 79 0 63,453 0 0 $74,574
Training 200 4,466 0 5,941 0 0 $10,607
Transit 0 0 0 0 0 0 $0
Transportation 0 0 0 195 0 10,306 $10,501
TOTAL $51,519 $10,547 $4,904 $190,014 $1,141 $10,611 $268,735
*Continued from previous page


![2017 Use of Force Report v12.2 [FINAL] - New York2017 Use of Force Report New York Police Department Police Commissioner’s Message This is the New York City Police Department’s](https://img.pdfslide.net/doc/110x75/5f10c0987e708231d44aa57b/2017-use-of-force-report-v122-final-new-york-2017-use-of-force-report-new-york.jpg)