Embed Size (px)
Citation preview
1
Policy Factors Influencing FDI Inflows
June, 2016
Hyun-Hoon Lee
Kangwon National University, Korea

2
FDI can take the form of investment in new assets (greenfield investment) or acquisition of existing assets (mergers and acquisitions; M&A).
Because of their distinctive characteristics, the two FDI modes may have different welfare effects in host countries.
Wang and Wong (2009) find that greenfield FDI promotes economic growth while M&As promote growth only when the host country has an adequate level of human capital.
Harms and Méon (2011) also finds that while greenfield investment substantially enhances growth, M&As have no effect, at best.
But Ashraf, et al. (2015) find that greenfield FDI has no statistically significant effect on total factor productivity (TFP), while M&As have a positive effect on TFP in in the sample of both developed and developing host countries of FDI.
1. Introduction

3
The question is then to understand how different institutional and policy factors have differential effects on FDI so that policy makers can properly design a policy framework to attract “right” kind of FDI.
There have been many studies linking institutional/governance variables with “aggregate” FDI (eg., Schneider and Frey, 1985; Edwards, 1992; Daude and Stein, 2007; Busse and Hefeker, 2007; and Hayakawa et al, 2013).
However, only few studies have examined how different policies of host countries influence FDI inflows to these countries.
For example, using the World Bank’s Ease of Doing Business (EoDB) ranking, Jayasuriya (2011) shows that there is a positive relationship between EoDB ranking and FDI inflows, but when the sample is restricted to developing countries, the relationship becomes insignificant. In contrast, Corcoran and Gillanders (2015) show that the overall Doing Business is highly significant in attracting FDI.
1. Introduction
4
EoDB is not a direct measure of a country’s FDI policies as it measures a country’s business regulatory environments that may influence both domestic investment and FDI inflows.
Utilizing PricewaterhouseCoopers (PwC)’s country reports on FDI policies, Wei (2000) constructs two measures of government policies towards FDI in 49 countries: FDI restrictions index and FDI incentives index.
Wei (2000) shows empirically that FDI inflows are negatively related to
FDI restrictions index and positively related to FDI incentives.
1. Introduction
5
1. Introduction
Two points noteworthy.
Most studies focus on aggregate FDI despite the fact that its two entry modes may have different welfare effects in the host countries.
Most studies focus mostly on institutional variables such as political stability and corruption and less on business environments or FDI policy variables of host countries which might have a more direct impact on FDI decisions of multinationals.
6
1. Introduction
Main Objectives
This paper empirically evaluates how different institutional and policy factors influence FDI flows in the modes of greenfield vs. M&A to developing countries.
In particular, this report assesses (1) host-country specific factors such as institutional/governance indicators, business environments, and FDI regulatory restrictions as well as (2) bilateral pair-specific factors such as regional trade agreements (RTA) and bilateral investment treaties (BIT).
7
1. Introduction
Data and empirical specification
This paper utilizes bilateral greenfield and M&A investments from 25 OECD countries to 96 developing countries and 46 high-income countries for the period 2003-2014.
This paper applies Poisson Pseudo-Maximum Likelihood (PPML) estimation.
Semi-structural gravity model to examine within-country variation effects of governance and policies on FDI.
Full-structural gravity model to examine within country-pair variation effects of RTA and BIT.
8
1. Introduction
Main findings
Among the host country-specific factors, the quality of local governance is the most important factor for both greenfield and M&A investments to developing countries, whereas FDI restrictive policies of developing countries are not significant factors in restricting FDI inflows to these countries.
An improvement in host country’s environment for doing business may have a positive effect on greenfield investment only when the host country’s governance quality is very low.
Among the pair-specific policy factors, regional trade agreements have a significantly positive impact on greenfield investment flows to developing countries, while bilateral investment treaties do not exert any positive effect either on greenfield investment or M&A investment.
9
Contents of this paper
1. Introduction
2. Descriptive Statistics
3. Empirical Specifications
4. Empirical Results
5. Summary and Concluding Remarks
1. Introduction

10
2. Descriptive Statistics
Bilateral greenfield and M&A investments Bilateral greenfield FDI data was acquired from fDi Intelligence
(Financial Times Ltd.) and the M&A data from the Thomson-Reuters SDC Platinum Database.
The counts and dollar values of greenfield and M&A investments are available from these two sources. However, in the case of M&A investment, the values of the transactions are often not reported for confidentiality reasons. A complete set of counts and dollar values is reported in the case of greenfield investment, (but when the investing company does not release the dollar value, the data provider estimates the value by an algorithm).
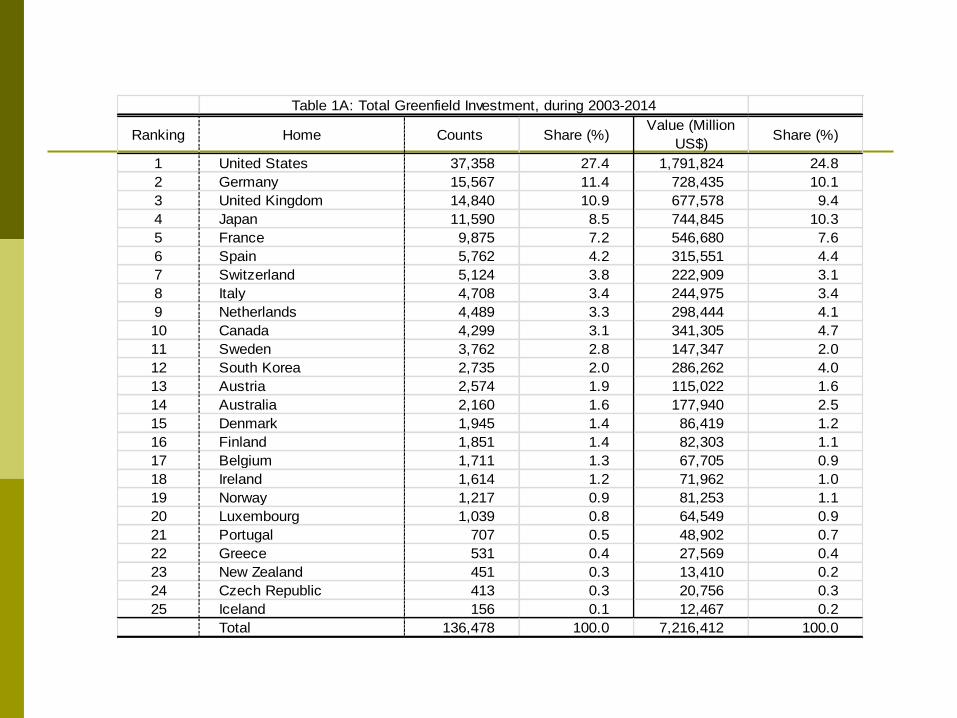
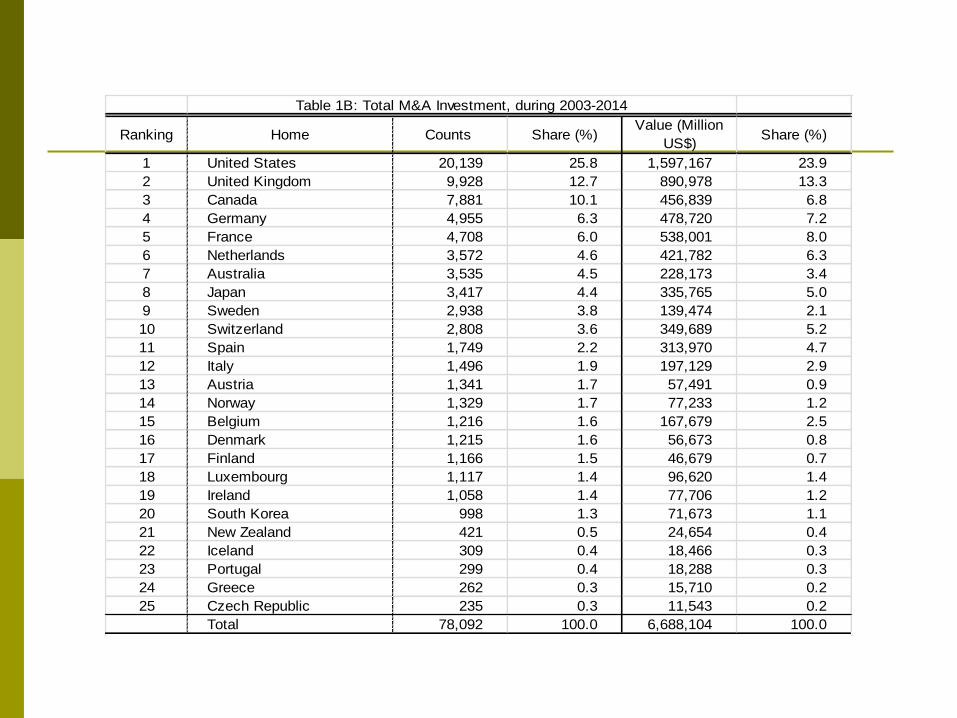
Therefore, we primarily use data on the counts of bilateral greenfield and M&A investments conducted by 25 OECD member countries and also use the dollar values of greenfield investment as a complement.

The trend of greenfield investment and M&A investments conducted by 25 OECD countries during the period 2003-2014.
Ranking Home Counts Share (%)Value (Million
US$)Share (%)
1 United States 37,358 27.4 1,791,824 24.8
2 Germany 15,567 11.4 728,435 10.1
3 United Kingdom 14,840 10.9 677,578 9.4
4 Japan 11,590 8.5 744,845 10.3
5 France 9,875 7.2 546,680 7.6
6 Spain 5,762 4.2 315,551 4.4
7 Switzerland 5,124 3.8 222,909 3.1
8 Italy 4,708 3.4 244,975 3.4
9 Netherlands 4,489 3.3 298,444 4.1
10 Canada 4,299 3.1 341,305 4.7
11 Sweden 3,762 2.8 147,347 2.0
12 South Korea 2,735 2.0 286,262 4.0
13 Austria 2,574 1.9 115,022 1.6
14 Australia 2,160 1.6 177,940 2.5
15 Denmark 1,945 1.4 86,419 1.2
16 Finland 1,851 1.4 82,303 1.1
17 Belgium 1,711 1.3 67,705 0.9
18 Ireland 1,614 1.2 71,962 1.0
19 Norway 1,217 0.9 81,253 1.1
20 Luxembourg 1,039 0.8 64,549 0.9
21 Portugal 707 0.5 48,902 0.7
22 Greece 531 0.4 27,569 0.4
23 New Zealand 451 0.3 13,410 0.2
24 Czech Republic 413 0.3 20,756 0.3
25 Iceland 156 0.1 12,467 0.2
Total 136,478 100.0 7,216,412 100.0
Table 1A: Total Greenfield Investment, during 2003-2014
Ranking Home Counts Share (%)Value (Million
US$)Share (%)
1 United States 20,139 25.8 1,597,167 23.9
2 United Kingdom 9,928 12.7 890,978 13.3
3 Canada 7,881 10.1 456,839 6.8
4 Germany 4,955 6.3 478,720 7.2
5 France 4,708 6.0 538,001 8.0
6 Netherlands 3,572 4.6 421,782 6.3
7 Australia 3,535 4.5 228,173 3.4
8 Japan 3,417 4.4 335,765 5.0
9 Sweden 2,938 3.8 139,474 2.1
10 Switzerland 2,808 3.6 349,689 5.2
11 Spain 1,749 2.2 313,970 4.7
12 Italy 1,496 1.9 197,129 2.9
13 Austria 1,341 1.7 57,491 0.9
14 Norway 1,329 1.7 77,233 1.2
15 Belgium 1,216 1.6 167,679 2.5
16 Denmark 1,215 1.6 56,673 0.8
17 Finland 1,166 1.5 46,679 0.7
18 Luxembourg 1,117 1.4 96,620 1.4
19 Ireland 1,058 1.4 77,706 1.2
20 South Korea 998 1.3 71,673 1.1
21 New Zealand 421 0.5 24,654 0.4
22 Iceland 309 0.4 18,466 0.3
23 Portugal 299 0.4 18,288 0.3
24 Greece 262 0.3 15,710 0.2
25 Czech Republic 235 0.3 11,543 0.2
Total 78,092 100.0 6,688,104 100.0
Table 1B: Total M&A Investment, during 2003-2014
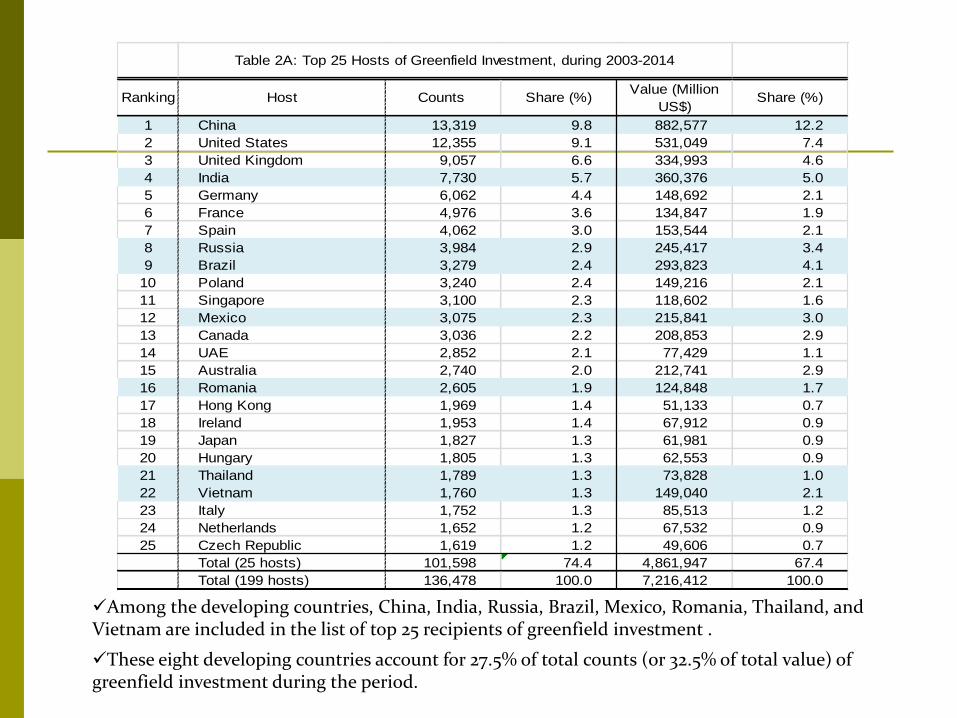
Among the developing countries, China, India, Russia, Brazil, Mexico, Romania, Thailand, and Vietnam are included in the list of top 25 recipients of greenfield investment .
These eight developing countries account for 27.5% of total counts (or 32.5% of total value) of greenfield investment during the period.
Ranking Host Counts Share (%)Value (Million
US$)Share (%)
1 China 13,319 9.8 882,577 12.2
2 United States 12,355 9.1 531,049 7.4
3 United Kingdom 9,057 6.6 334,993 4.6
4 India 7,730 5.7 360,376 5.0
5 Germany 6,062 4.4 148,692 2.1
6 France 4,976 3.6 134,847 1.9
7 Spain 4,062 3.0 153,544 2.1
8 Russia 3,984 2.9 245,417 3.4
9 Brazil 3,279 2.4 293,823 4.1
10 Poland 3,240 2.4 149,216 2.1
11 Singapore 3,100 2.3 118,602 1.6
12 Mexico 3,075 2.3 215,841 3.0
13 Canada 3,036 2.2 208,853 2.9
14 UAE 2,852 2.1 77,429 1.1
15 Australia 2,740 2.0 212,741 2.9
16 Romania 2,605 1.9 124,848 1.7
17 Hong Kong 1,969 1.4 51,133 0.7
18 Ireland 1,953 1.4 67,912 0.9
19 Japan 1,827 1.3 61,981 0.9
20 Hungary 1,805 1.3 62,553 0.9
21 Thailand 1,789 1.3 73,828 1.0
22 Vietnam 1,760 1.3 149,040 2.1
23 Italy 1,752 1.3 85,513 1.2
24 Netherlands 1,652 1.2 67,532 0.9
25 Czech Republic 1,619 1.2 49,606 0.7
Total (25 hosts) 101,598 74.4 4,861,947 67.4
Total (199 hosts) 136,478 100.0 7,216,412 100.0
Table 2A: Top 25 Hosts of Greenfield Investment, during 2003-2014
Ranking Host Counts Share (%)Value (Million
US$)Share (%)
1 United States 9,520 12.0 1,250,069 18.5
2 United Kingdom 6,805 8.6 878,100 13.0
3 Germany 5,628 7.1 420,250 6.2
4 Canada 4,391 5.5 315,777 4.7
5 France 3,437 4.3 296,343 4.4
6 Australia 2,891 3.6 197,961 2.9
7 China 2,877 3.6 99,294 1.5
8 Spain 2,228 2.8 223,712 3.3
9 India 2,149 2.7 109,440 1.6
10 Netherlands 2,115 2.7 290,915 4.3
11 Sweden 2,082 2.6 135,978 2.0
12 Italy 2,067 2.6 208,358 3.1
13 Brazil 1,697 2.1 143,912 2.1
14 Switzerland 1,504 1.9 180,944 2.7
15 Russia 1,445 1.8 87,219 1.3
16 United States 1,398 1.8 264,491 3.9
17 Norway 1,384 1.7 83,160 1.2
18 Belgium 1,317 1.7 135,498 2.0
19 Denmark 1,287 1.6 55,713 0.8
20 Mexico 1,232 1.6 84,252 1.2
21 Poland 1,000 1.3 52,144 0.8
22 Finland 980 1.2 45,440 0.7
23 Hong Kong 922 1.2 48,496 0.7
24 New Zealand 866 1.1 24,182 0.4
25 Japan 865 1.1 72,826 1.1
Total (25 hosts) 62,087 78.2 5,704,475 84.2
Total (175 hosts) 79,422 100.0 6,771,536 100.0
Table 2B: Top 25 Hosts of M&A Investment, during 2003-2014
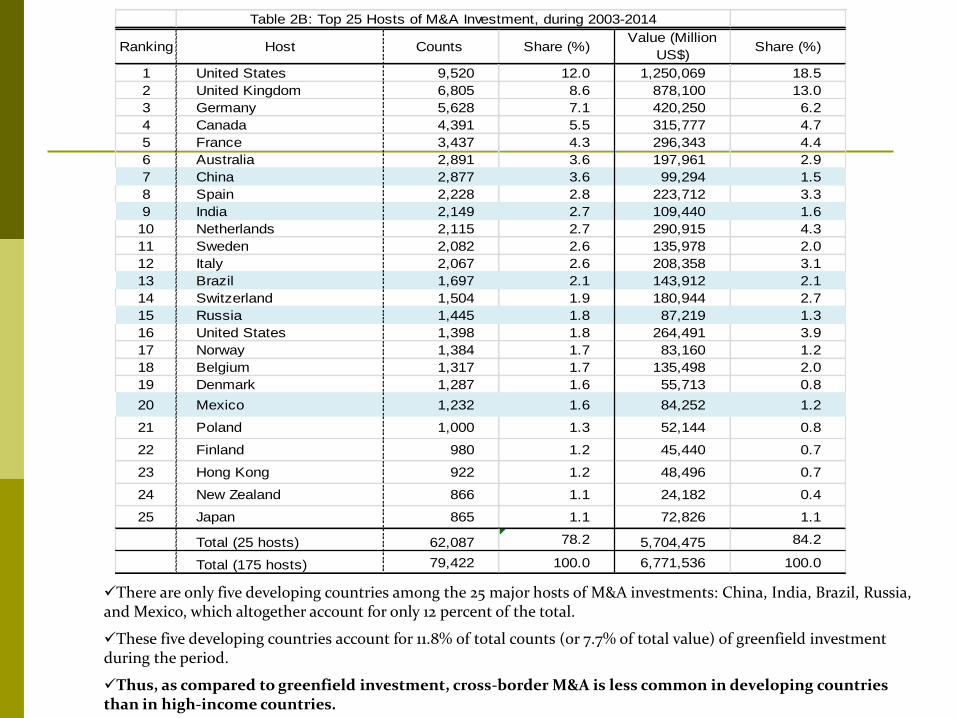
There are only five developing countries among the 25 major hosts of M&A investments: China, India, Brazil, Russia, and Mexico, which altogether account for only 12 percent of the total.
These five developing countries account for 11.8% of total counts (or 7.7% of total value) of greenfield investment during the period.
Thus, as compared to greenfield investment, cross-border M&A is less common in developing countries than in high-income countries.
Ranking Home Host Counts Value (Million
US$)
1 United States China 4,247 257,032
2 United States United Kingdom 4,051 120,847
3 United States India 3,096 109,971
4 United Kingdom United States 2,341 71,759
5 Japan China 2,312 142,244
6 United States Germany 1,778 43,232
7 United States Canada 1,765 110,455
8 Germany United States 1,761 70,473
9 Japan United States 1,506 78,366
10 United States France 1,411 32,569
11 Germany China 1,359 123,266
12 Canada United States 1,309 51,902
13 United States Mexico 1,281 85,487
14 United States Singapore 1,096 40,530
15 United States Australia 1,038 52,729
16 United States Brazil 1,034 78,365
17 France United States 1,021 43,985
18 United Kingdom China 995 56,020
19 United Kingdom India 924 53,396
20 United States Ireland 880 36,174
21 United States Japan 873 32,621
22 United States UAE 858 20,871
23 Germany United Kingdom 848 38,233
24 France China 832 52,866
25 Japan Thailand 824 30,127
39,440 1,833,519Total
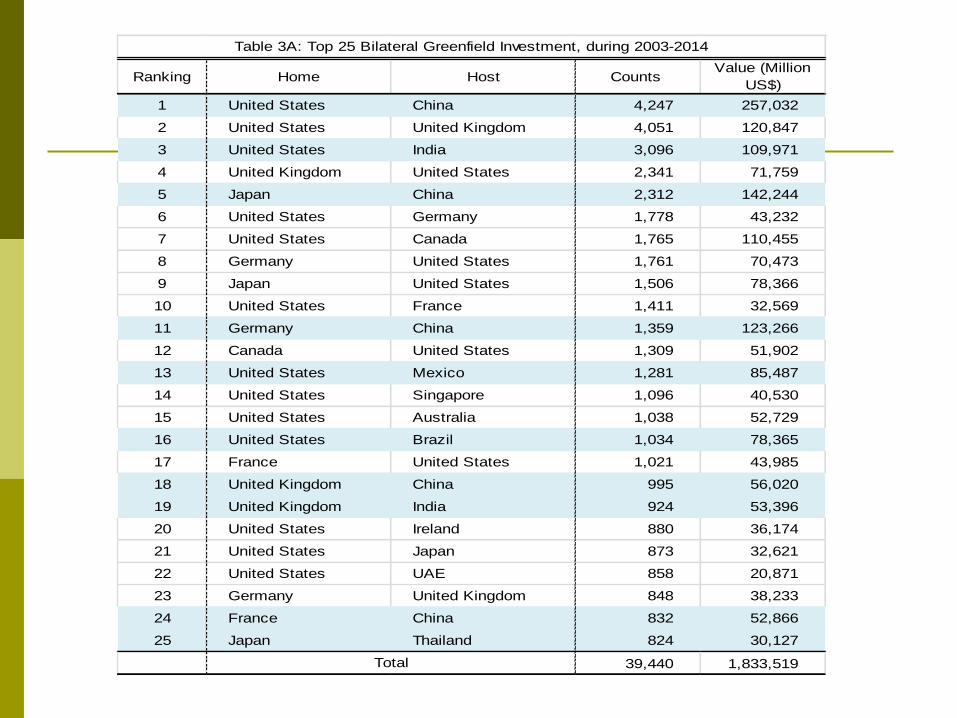
Table 3A: Top 25 Bilateral Greenfield Investment, during 2003-2014
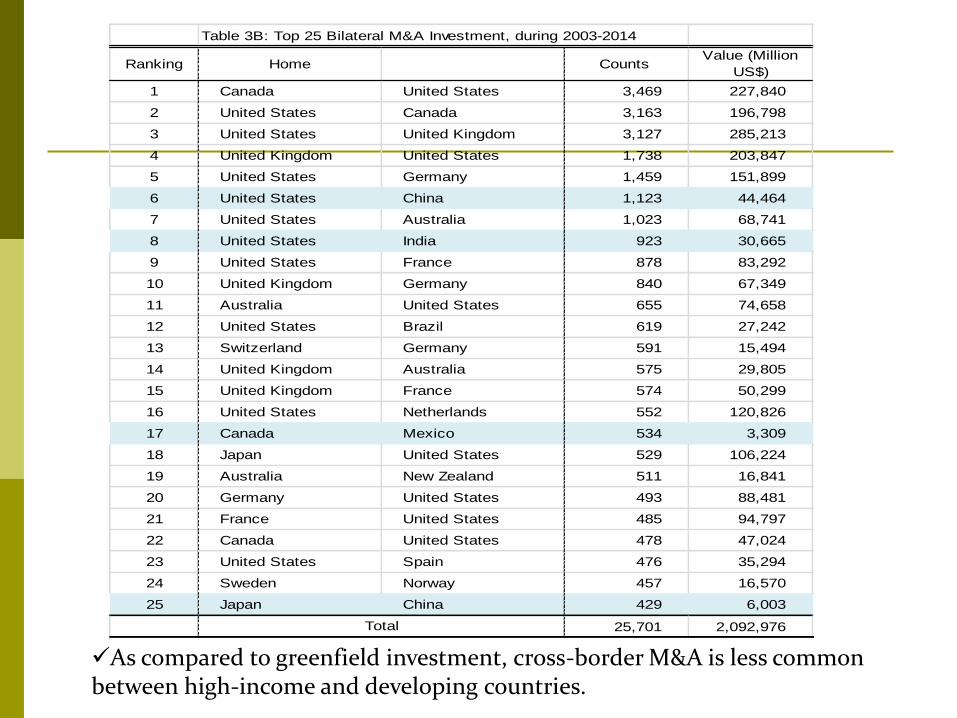
Table 3B: Top 25 Bilateral M&A Investment, during 2003-2014
Ranking Home Counts Value (Million
US$)
1 Canada United States 3,469 227,840
2 United States Canada 3,163 196,798
3 United States United Kingdom 3,127 285,213
4 United Kingdom United States 1,738 203,847
5 United States Germany 1,459 151,899
6 United States China 1,123 44,464
7 United States Australia 1,023 68,741
8 United States India 923 30,665
9 United States France 878 83,292
10 United Kingdom Germany 840 67,349
11 Australia United States 655 74,658
12 United States Brazil 619 27,242
13 Switzerland Germany 591 15,494
14 United Kingdom Australia 575 29,805
15 United Kingdom France 574 50,299
16 United States Netherlands 552 120,826
17 Canada Mexico 534 3,309
18 Japan United States 529 106,224
19 Australia New Zealand 511 16,841
20 Germany United States 493 88,481
21 France United States 485 94,797
22 Canada United States 478 47,024
23 United States Spain 476 35,294
24 Sweden Norway 457 16,570
25 Japan China 429 6,003
25,701 2,092,976Total
As compared to greenfield investment, cross-border M&A is less common between high-income and developing countries.
18
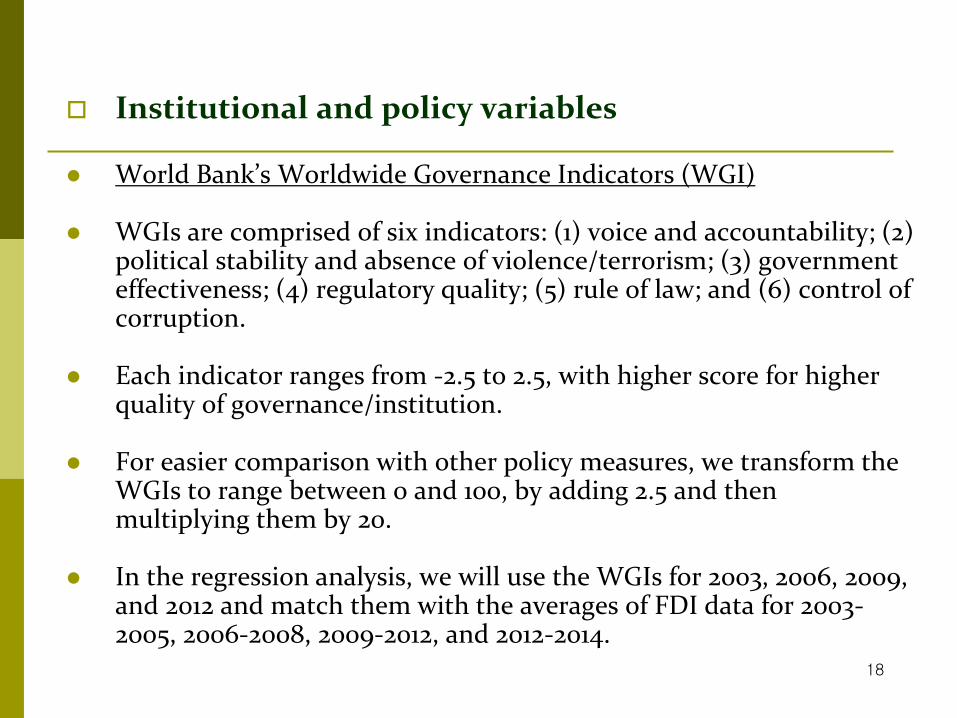
Institutional and policy variables World Bank’s Worldwide Governance Indicators (WGI)
WGIs are comprised of six indicators: (1) voice and accountability; (2)
political stability and absence of violence/terrorism; (3) government effectiveness; (4) regulatory quality; (5) rule of law; and (6) control of corruption.
Each indicator ranges from -2.5 to 2.5, with higher score for higher quality of governance/institution.
For easier comparison with other policy measures, we transform the WGIs to range between 0 and 100, by adding 2.5 and then multiplying them by 20.
In the regression analysis, we will use the WGIs for 2003, 2006, 2009, and 2012 and match them with the averages of FDI data for 2003-2005, 2006-2008, 2009-2012, and 2012-2014.
19
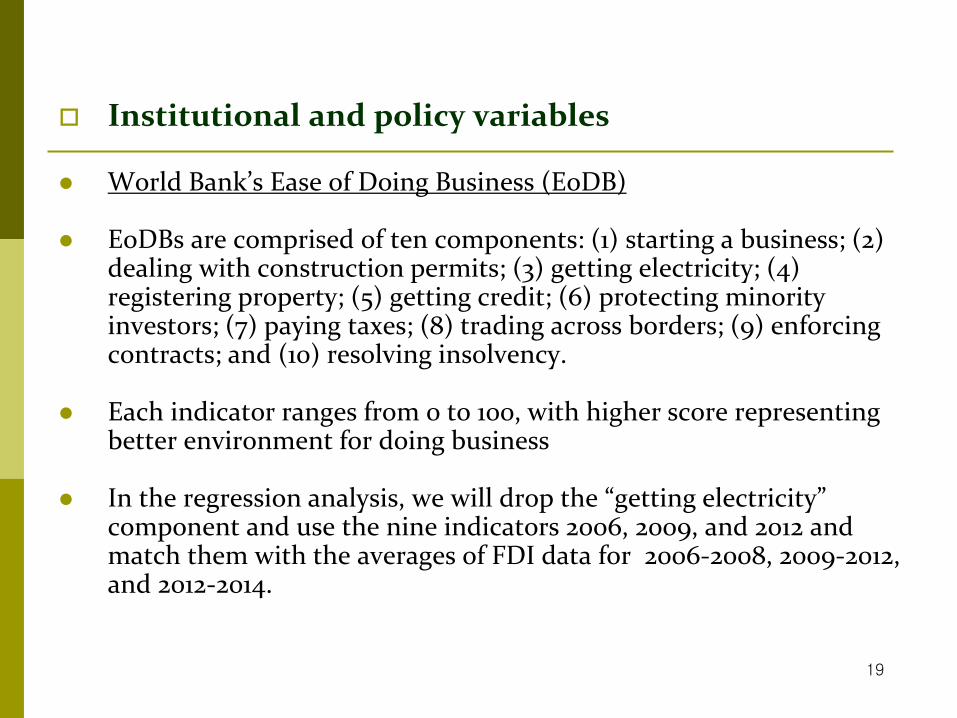
Institutional and policy variables World Bank’s Ease of Doing Business (EoDB)
EoDBs are comprised of ten components: (1) starting a business; (2)
dealing with construction permits; (3) getting electricity; (4) registering property; (5) getting credit; (6) protecting minority investors; (7) paying taxes; (8) trading across borders; (9) enforcing contracts; and (10) resolving insolvency.
Each indicator ranges from 0 to 100, with higher score representing better environment for doing business
In the regression analysis, we will drop the “getting electricity” component and use the nine indicators 2006, 2009, and 2012 and match them with the averages of FDI data for 2006-2008, 2009-2012, and 2012-2014.
20
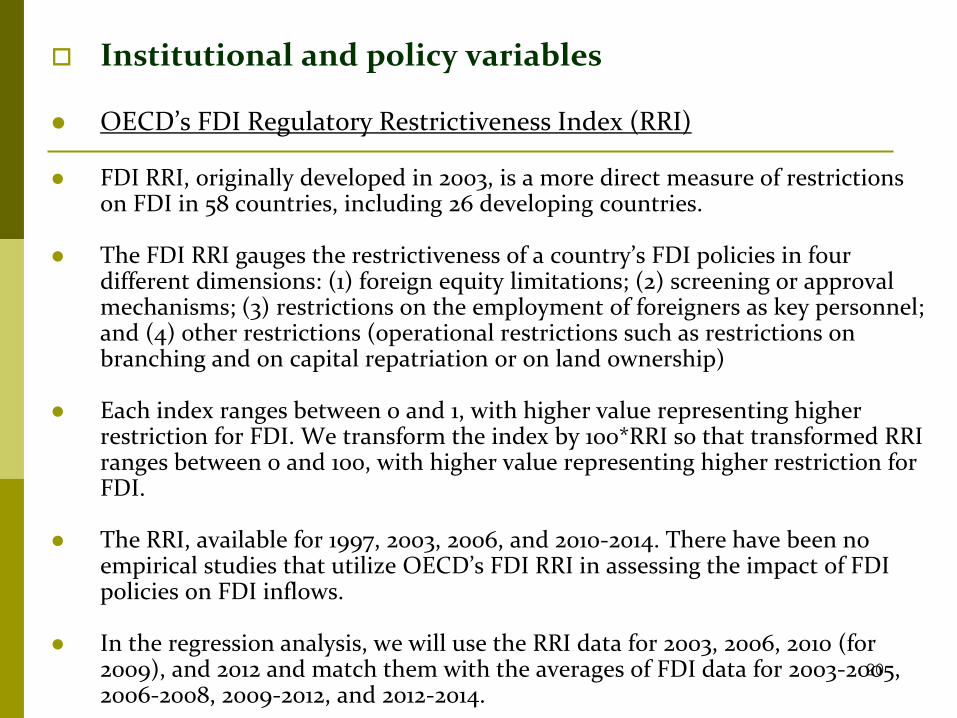
Institutional and policy variables OECD’s FDI Regulatory Restrictiveness Index (RRI)
FDI RRI, originally developed in 2003, is a more direct measure of restrictions
on FDI in 58 countries, including 26 developing countries.
The FDI RRI gauges the restrictiveness of a country’s FDI policies in four different dimensions: (1) foreign equity limitations; (2) screening or approval mechanisms; (3) restrictions on the employment of foreigners as key personnel; and (4) other restrictions (operational restrictions such as restrictions on branching and on capital repatriation or on land ownership)
Each index ranges between 0 and 1, with higher value representing higher restriction for FDI. We transform the index by 100*RRI so that transformed RRI ranges between 0 and 100, with higher value representing higher restriction for FDI.
The RRI, available for 1997, 2003, 2006, and 2010-2014. There have been no empirical studies that utilize OECD’s FDI RRI in assessing the impact of FDI policies on FDI inflows.
In the regression analysis, we will use the RRI data for 2003, 2006, 2010 (for 2009), and 2012 and match them with the averages of FDI data for 2003-2005, 2006-2008, 2009-2012, and 2012-2014.
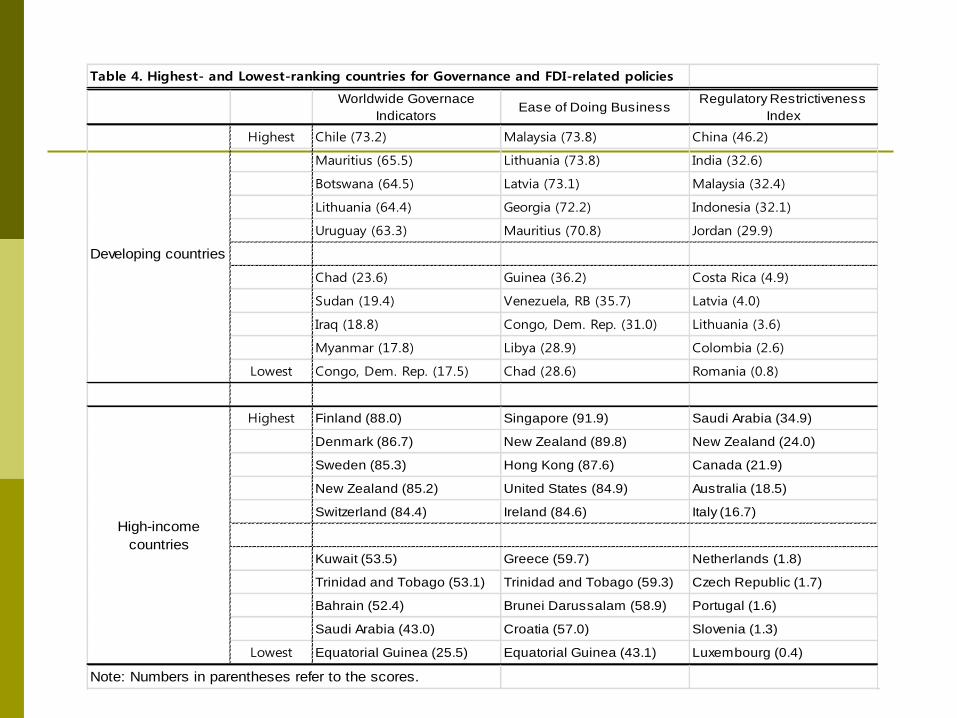
Table 4. Highest- and Lowest-ranking countries for Governance and FDI-related policies
Worldwide Governace
IndicatorsEase of Doing Business
Regulatory Restrictiveness
Index
Highest Chile (73.2) Malaysia (73.8) China (46.2)
Mauritius (65.5) Lithuania (73.8) India (32.6)
Botswana (64.5) Latvia (73.1) Malaysia (32.4)
Lithuania (64.4) Georgia (72.2) Indonesia (32.1)
Uruguay (63.3) Mauritius (70.8) Jordan (29.9)
Chad (23.6) Guinea (36.2) Costa Rica (4.9)
Sudan (19.4) Venezuela, RB (35.7) Latvia (4.0)
Iraq (18.8) Congo, Dem. Rep. (31.0) Lithuania (3.6)
Myanmar (17.8) Libya (28.9) Colombia (2.6)
Lowest Congo, Dem. Rep. (17.5) Chad (28.6) Romania (0.8)
Highest Finland (88.0) Singapore (91.9) Saudi Arabia (34.9)
Denmark (86.7) New Zealand (89.8) New Zealand (24.0)
Sweden (85.3) Hong Kong (87.6) Canada (21.9)
New Zealand (85.2) United States (84.9) Australia (18.5)
Switzerland (84.4) Ireland (84.6) Italy (16.7)
Kuwait (53.5) Greece (59.7) Netherlands (1.8)
Trinidad and Tobago (53.1) Trinidad and Tobago (59.3) Czech Republic (1.7)
Bahrain (52.4) Brunei Darussalam (58.9) Portugal (1.6)
Saudi Arabia (43.0) Croatia (57.0) Slovenia (1.3)
Lowest Equatorial Guinea (25.5) Equatorial Guinea (43.1) Luxembourg (0.4)
Note: Numbers in parentheses refer to the scores.
Developing countries
High-income
countries
22
Institutional and policy variables Regional Trade Agreement (RTA)
There have been many theoretical and empirical studies that investigate the
effects of RTAs on FDI.
Most theoretical studies have shown that RTA increases investments not only from intra-block firms but also from outside firms (eg. Motta and Norman, 1996; Ekholm et al., 2007; and Ito, 2013).
None of the previous empirical studies examine how differently an RTA affects greenfield investment vs. M&A investment.
In a theoretical analysis, Kim (2009) examines the impacts of RTA on the FDI entry mode of multinational firm focusing on greenfield investment vs. cross-border M&A. Based on an oligopoly market structure, he shows that formation of an FTA between home and host countries eliminates the tariff-jumping advantage of greenfield investment, thereby discouraging greenfield investment.
According to the date of entry into force, we compile an RTA dummy variable for 2003, 2006, 2009 and 2012.

23
Institutional and policy variables Bilateral Investment Treaty (BIT)
BIT is an international agreement establishing legally binding terms and
conditions for FDI.
BITs are expected to promote FDI inflows between signatories.
In developing countries, in particular, BITs may compensate for less developed local institutions and can be expected to promote FDI inflows.
Many studies, however, have produced ambiguous results on the effectiveness of BITs in promoting FDI inflows.
None of the previous studies has investigated how BITs influence greenfield investment and M&As differentially.
Because there is no theoretical model that predicts differential effects of BITs on greenfield vs. M&A investments, we do not make any a priori hypothesis and take this as an empirical question.
Our bilateral investment treaty data are taken from the website of the United Nations Conference on Trade and Development (UNCTAD).

3. Empirical Specification
The gravity model
Theoretical gravity models for FDI have been developed by Bergstrand and Egger (2007), Head and Ries (2008), and Kleinert and Toubal (2010).
Most theoretical formulations of the gravity equation specify Yijt, flows of transactions from origin i to destination j, as the product of country and bilateral-specific terms:
Mjt = η POLICYjt + γ1 ln POPjt + γ2 ln PCGDPjt + γ3 ln POPjt + γ4 GROWTHjt + γ4
INFLATIONjt
Dijt = β1 ln RTAijt + β2 ln BITijt + θ PAIRij + udrt
3. Empirical Specification
Three econometric issues
(1) Many pairs of countries do not exert FDI flows and hence enter with zeros.
Taking logs of the dependent variable would drop zero observation and
result in biased estimates given that zero flows may indicate that fixed costs exceed expected variable profits (Razin et al., 2004; and Davis and Kristjánsdóttir, 2010).
Santos Silva and Tenreyro (2006) argue that estimating a log-linearized gravity equation by ordinary least squares (OLS) results in bias and that OLS would be inconsistent in the presence of heteroskedasticity, which is highly likely in practice.
As an alternative, Santos Silva and Tenreyro (2006) suggest that the gravity model be estimated in its multiplicative form and use a Poisson pseudo- maximum likelihood (PPML) estimator that is usually used for count data.
𝑌𝑖 = exp 𝑥𝑖𝛽 + 𝜀𝑖 (2)
3. Empirical Specification
Three econometric issues
(2) “Structural” gravity models consistent with theory require that estimation of a gravity equation take into account not only bilateral distance and transaction costs but also “multilateral resistance” (Anderson and van Wincoop, 2003).
This issue has been addressed in the empirical literature by including source-year
and host-year fixed effects in the panel data estimations.
However, including a full set of time varying source and host country fixed effects is not feasible for our purpose because with host-year fixed effects, host country-specific policy variables would not be measured.
Therefore, for the estimation of time-varying governance/policy variables, we will only include source-year fixed effects for source countries’ outward multilateral resistance.
Arguably, FDI decisions are made by multinationals of source countries and hence host countries’ inward multilateral resistance (i.e., host-year fixed effects) does not matter much.
But for the estimation of RTA and BIT, we will utilize full “structural” gravity model by including source-year and host-year fixed effects in the panel data estimations.
3. Empirical Specification
Three econometric issues
(3) Possible endogeneity of policy variables. FDI inflows may cause the policy makers of host countries to make their
FDI environment more favorable to foreign investment.
We design three tactics to account for this concern.
First, as an effort to reduce random volatility of FDI flows and to obtain fewer cases of zero values, we reduce the time dimension to four periods by taking the mean of the dependent variable for years 2003-2005, 2006-2008, 2009-2011, and 2012-2014.
And then we match the dependent variable with the policy variables and other explanatory variables for the beginning year of each sub-period (i.e. 2003, 2006, 2009, and 2012), thus allowing for both contemporaneous and lagged effects (1-2 years) of policy factors on FDI inflows to accrue.
3. Empirical Specification
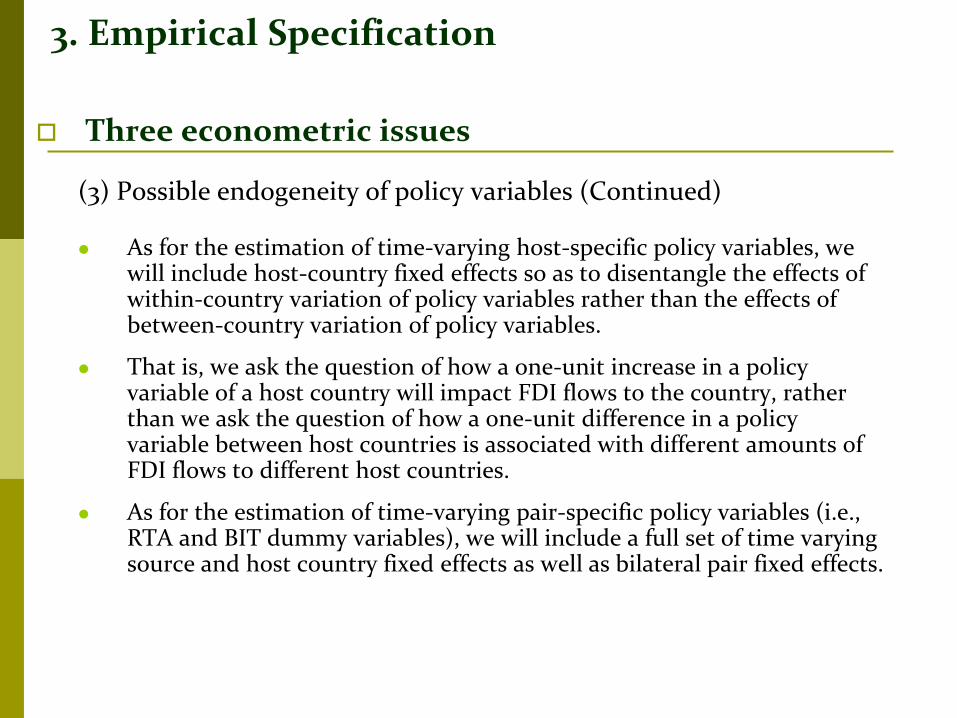
Three econometric issues
(3) Possible endogeneity of policy variables (Continued) As for the estimation of time-varying host-specific policy variables, we
will include host-country fixed effects so as to disentangle the effects of within-country variation of policy variables rather than the effects of between-country variation of policy variables.
That is, we ask the question of how a one-unit increase in a policy variable of a host country will impact FDI flows to the country, rather than we ask the question of how a one-unit difference in a policy variable between host countries is associated with different amounts of FDI flows to different host countries.
As for the estimation of time-varying pair-specific policy variables (i.e., RTA and BIT dummy variables), we will include a full set of time varying source and host country fixed effects as well as bilateral pair fixed effects.
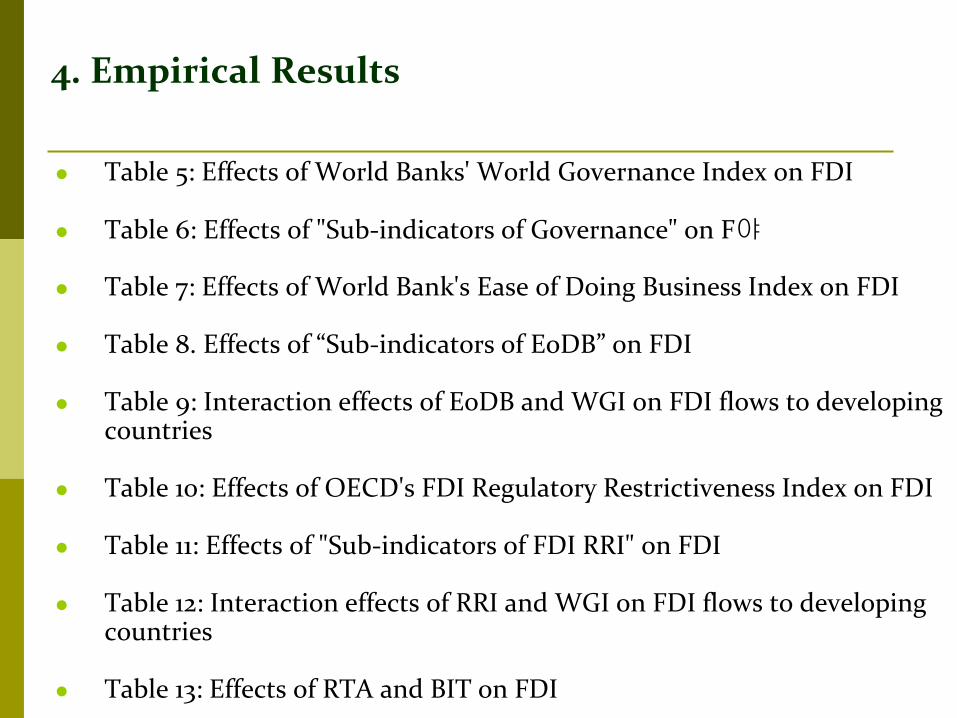
4. Empirical Results
Table 5: Effects of World Banks' World Governance Index on FDI
Table 6: Effects of "Sub-indicators of Governance" on F야
Table 7: Effects of World Bank's Ease of Doing Business Index on FDI
Table 8. Effects of “Sub-indicators of EoDB” on FDI
Table 9: Interaction effects of EoDB and WGI on FDI flows to developing
countries
Table 10: Effects of OECD's FDI Regulatory Restrictiveness Index on FDI
Table 11: Effects of "Sub-indicators of FDI RRI" on FDI
Table 12: Interaction effects of RRI and WGI on FDI flows to developing countries
Table 13: Effects of RTA and BIT on FDI
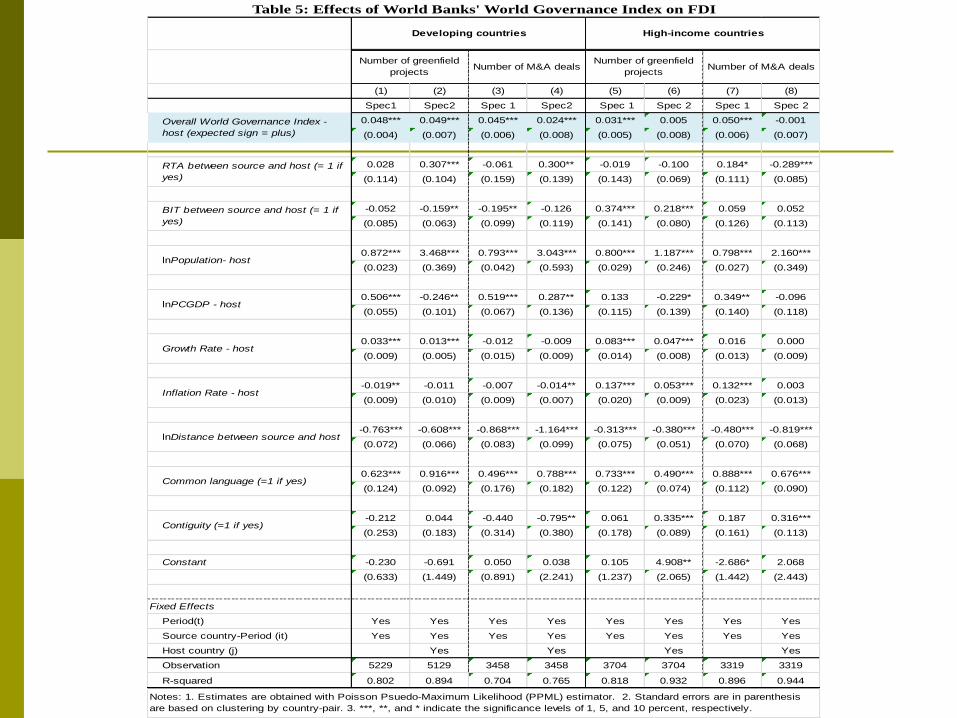
Table 5: Effects of World Banks' World Governance Index on FDI
(1) (2) (3) (4) (5) (6) (7) (8)
Spec1 Spec2 Spec 1 Spec2 Spec 1 Spec 2 Spec 1 Spec 2
0.048*** 0.049*** 0.045*** 0.024*** 0.031*** 0.005 0.050*** -0.001
(0.004) (0.007) (0.006) (0.008) (0.005) (0.008) (0.006) (0.007)
0.028 0.307*** -0.061 0.300** -0.019 -0.100 0.184* -0.289***
(0.114) (0.104) (0.159) (0.139) (0.143) (0.069) (0.111) (0.085)
-0.052 -0.159** -0.195** -0.126 0.374*** 0.218*** 0.059 0.052
(0.085) (0.063) (0.099) (0.119) (0.141) (0.080) (0.126) (0.113)
0.872*** 3.468*** 0.793*** 3.043*** 0.800*** 1.187*** 0.798*** 2.160***
(0.023) (0.369) (0.042) (0.593) (0.029) (0.246) (0.027) (0.349)
0.506*** -0.246** 0.519*** 0.287** 0.133 -0.229* 0.349** -0.096
(0.055) (0.101) (0.067) (0.136) (0.115) (0.139) (0.140) (0.118)
0.033*** 0.013*** -0.012 -0.009 0.083*** 0.047*** 0.016 0.000
(0.009) (0.005) (0.015) (0.009) (0.014) (0.008) (0.013) (0.009)
-0.019** -0.011 -0.007 -0.014** 0.137*** 0.053*** 0.132*** 0.003
(0.009) (0.010) (0.009) (0.007) (0.020) (0.009) (0.023) (0.013)
-0.763*** -0.608*** -0.868*** -1.164*** -0.313*** -0.380*** -0.480*** -0.819***
(0.072) (0.066) (0.083) (0.099) (0.075) (0.051) (0.070) (0.068)
0.623*** 0.916*** 0.496*** 0.788*** 0.733*** 0.490*** 0.888*** 0.676***
(0.124) (0.092) (0.176) (0.182) (0.122) (0.074) (0.112) (0.090)
-0.212 0.044 -0.440 -0.795** 0.061 0.335*** 0.187 0.316***
(0.253) (0.183) (0.314) (0.380) (0.178) (0.089) (0.161) (0.113)
Constant -0.230 -0.691 0.050 0.038 0.105 4.908** -2.686* 2.068
(0.633) (1.449) (0.891) (2.241) (1.237) (2.065) (1.442) (2.443)
Fixed Effects
Period(t) Yes Yes Yes Yes Yes Yes Yes Yes
Source country-Period (it) Yes Yes Yes Yes Yes Yes Yes Yes
Host country (j) Yes Yes Yes Yes
Observation 5229 5129 3458 3458 3704 3704 3319 3319
R-squared 0.802 0.894 0.704 0.765 0.818 0.932 0.896 0.944
Overall World Governance Index -
host (expected sign = plus)
Number of greenfield
projects
Number of greenfield
projectsNumber of M&A deals Number of M&A deals
RTA between source and host (= 1 if
yes)
BIT between source and host (= 1 if
yes)
lnPCGDP - host
lnPopulation- host
Growth Rate - host
Inflation Rate - host
lnDistance between source and host
Common language (=1 if yes)
Notes: 1. Estimates are obtained with Poisson Psuedo-Maximum Likelihood (PPML) estimator. 2. Standard errors are in parenthesis
are based on clustering by country-pair. 3. ***, **, and * indicate the significance levels of 1, 5, and 10 percent, respectively.
Contiguity (=1 if yes)
Developing countries High-income countries
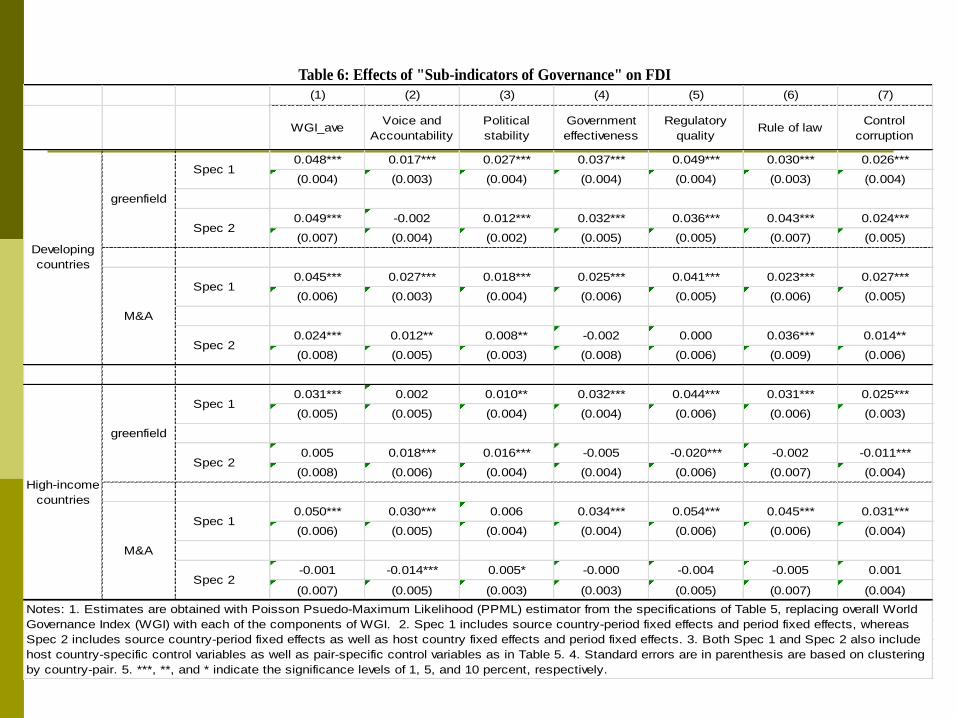
Table 6: Effects of "Sub-indicators of Governance" on FDI
(1) (2) (3) (4) (5) (6) (7)
WGI_aveVoice and
Accountability
Political
stability
Government
effectiveness
Regulatory
qualityRule of law
Control
corruption
0.048*** 0.017*** 0.027*** 0.037*** 0.049*** 0.030*** 0.026***
(0.004) (0.003) (0.004) (0.004) (0.004) (0.003) (0.004)
0.049*** -0.002 0.012*** 0.032*** 0.036*** 0.043*** 0.024***
(0.007) (0.004) (0.002) (0.005) (0.005) (0.007) (0.005)
0.045*** 0.027*** 0.018*** 0.025*** 0.041*** 0.023*** 0.027***
(0.006) (0.003) (0.004) (0.006) (0.005) (0.006) (0.005)
0.024*** 0.012** 0.008** -0.002 0.000 0.036*** 0.014**
(0.008) (0.005) (0.003) (0.008) (0.006) (0.009) (0.006)
0.031*** 0.002 0.010** 0.032*** 0.044*** 0.031*** 0.025***
(0.005) (0.005) (0.004) (0.004) (0.006) (0.006) (0.003)
0.005 0.018*** 0.016*** -0.005 -0.020*** -0.002 -0.011***
(0.008) (0.006) (0.004) (0.004) (0.006) (0.007) (0.004)
0.050*** 0.030*** 0.006 0.034*** 0.054*** 0.045*** 0.031***
(0.006) (0.005) (0.004) (0.004) (0.006) (0.006) (0.004)
-0.001 -0.014*** 0.005* -0.000 -0.004 -0.005 0.001
(0.007) (0.005) (0.003) (0.003) (0.005) (0.007) (0.004)
Notes: 1. Estimates are obtained with Poisson Psuedo-Maximum Likelihood (PPML) estimator from the specifications of Table 5, replacing overall World
Governance Index (WGI) with each of the components of WGI. 2. Spec 1 includes source country-period fixed effects and period fixed effects, whereas
Spec 2 includes source country-period fixed effects as well as host country fixed effects and period fixed effects. 3. Both Spec 1 and Spec 2 also include
host country-specific control variables as well as pair-specific control variables as in Table 5. 4. Standard errors are in parenthesis are based on clustering
by country-pair. 5. ***, **, and * indicate the significance levels of 1, 5, and 10 percent, respectively.
greenfield
Spec 1
Spec 2
M&A
Spec 1
Spec 2
High-income
countries
Developing
countries
greenfield
Spec 1
Spec 2
M&A
Spec 1
Spec 2
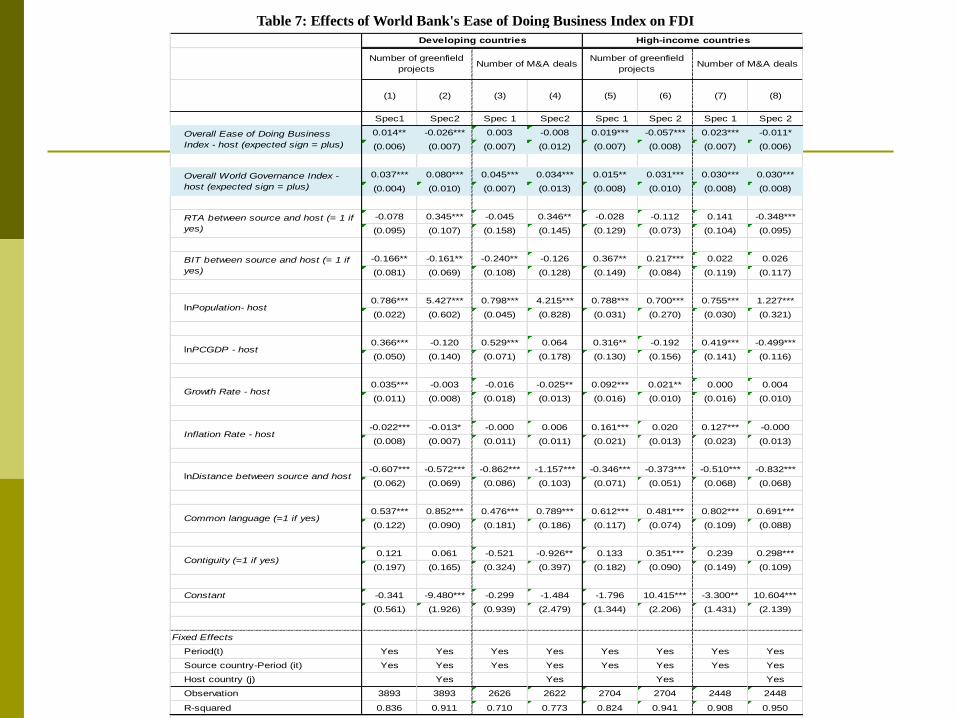
Table 7: Effects of World Bank's Ease of Doing Business Index on FDI
(1) (2) (3) (4) (5) (6) (7) (8)
Spec1 Spec2 Spec 1 Spec2 Spec 1 Spec 2 Spec 1 Spec 2
0.014** -0.026*** 0.003 -0.008 0.019*** -0.057*** 0.023*** -0.011*
(0.006) (0.007) (0.007) (0.012) (0.007) (0.008) (0.007) (0.006)
0.037*** 0.080*** 0.045*** 0.034*** 0.015** 0.031*** 0.030*** 0.030***
(0.004) (0.010) (0.007) (0.013) (0.008) (0.010) (0.008) (0.008)
-0.078 0.345*** -0.045 0.346** -0.028 -0.112 0.141 -0.348***
(0.095) (0.107) (0.158) (0.145) (0.129) (0.073) (0.104) (0.095)
-0.166** -0.161** -0.240** -0.126 0.367** 0.217*** 0.022 0.026
(0.081) (0.069) (0.108) (0.128) (0.149) (0.084) (0.119) (0.117)
0.786*** 5.427*** 0.798*** 4.215*** 0.788*** 0.700*** 0.755*** 1.227***
(0.022) (0.602) (0.045) (0.828) (0.031) (0.270) (0.030) (0.321)
0.366*** -0.120 0.529*** 0.064 0.316** -0.192 0.419*** -0.499***
(0.050) (0.140) (0.071) (0.178) (0.130) (0.156) (0.141) (0.116)
0.035*** -0.003 -0.016 -0.025** 0.092*** 0.021** 0.000 0.004
(0.011) (0.008) (0.018) (0.013) (0.016) (0.010) (0.016) (0.010)
-0.022*** -0.013* -0.000 0.006 0.161*** 0.020 0.127*** -0.000
(0.008) (0.007) (0.011) (0.011) (0.021) (0.013) (0.023) (0.013)
-0.607*** -0.572*** -0.862*** -1.157*** -0.346*** -0.373*** -0.510*** -0.832***
(0.062) (0.069) (0.086) (0.103) (0.071) (0.051) (0.068) (0.068)
0.537*** 0.852*** 0.476*** 0.789*** 0.612*** 0.481*** 0.802*** 0.691***
(0.122) (0.090) (0.181) (0.186) (0.117) (0.074) (0.109) (0.088)
0.121 0.061 -0.521 -0.926** 0.133 0.351*** 0.239 0.298***
(0.197) (0.165) (0.324) (0.397) (0.182) (0.090) (0.149) (0.109)
Constant -0.341 -9.480*** -0.299 -1.484 -1.796 10.415*** -3.300** 10.604***
(0.561) (1.926) (0.939) (2.479) (1.344) (2.206) (1.431) (2.139)
Fixed Effects
Period(t) Yes Yes Yes Yes Yes Yes Yes Yes
Source country-Period (it) Yes Yes Yes Yes Yes Yes Yes Yes
Host country (j) Yes Yes Yes Yes
Observation 3893 3893 2626 2622 2704 2704 2448 2448
R-squared 0.836 0.911 0.710 0.773 0.824 0.941 0.908 0.950
Contiguity (=1 if yes)
Notes: 1. Estimates are obtained with Poisson Psuedo-Maximum Likelihood (PPML) estimator. 2. Standard errors are in parenthesis
are based on clustering by country-pair. 3. ***, **, and * indicate the significance levels of 1, 5, and 10 percent, respectively.
lnDistance between source and host
Common language (=1 if yes)
Growth Rate - host
Inflation Rate - host
lnPopulation- host
lnPCGDP - host
RTA between source and host (= 1 if
yes)
BIT between source and host (= 1 if
yes)
Overall Ease of Doing Business
Index - host (expected sign = plus)
Overall World Governance Index -
host (expected sign = plus)
Number of greenfield
projectsNumber of M&A deals
Number of greenfield
projectsNumber of M&A deals
Developing countries High-income countries
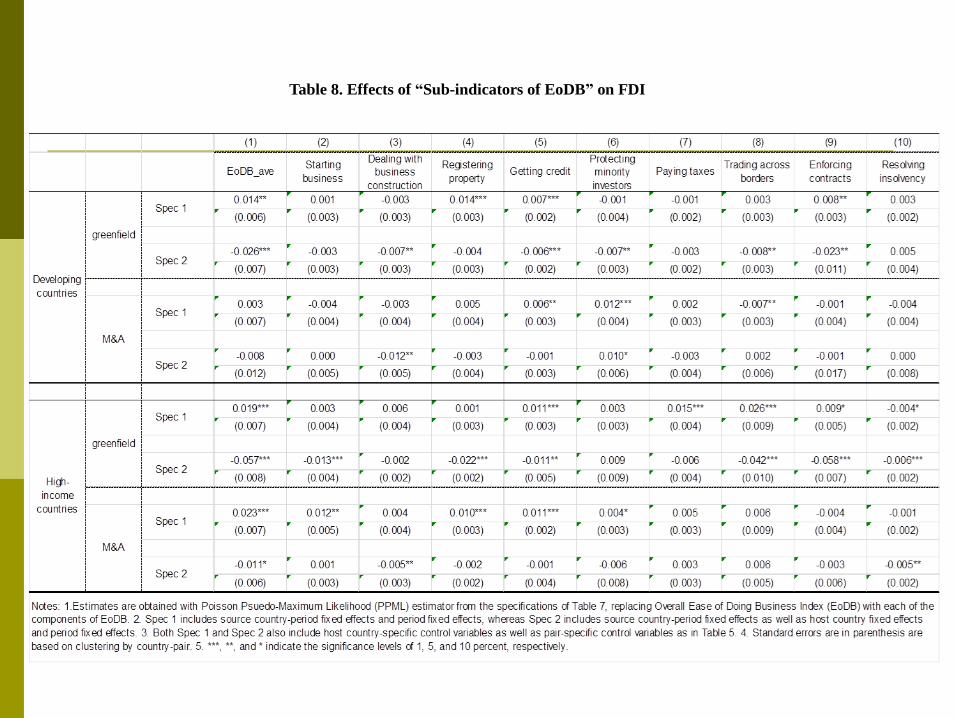
Table 8. Effects of “Sub-indicators of EoDB” on FDI
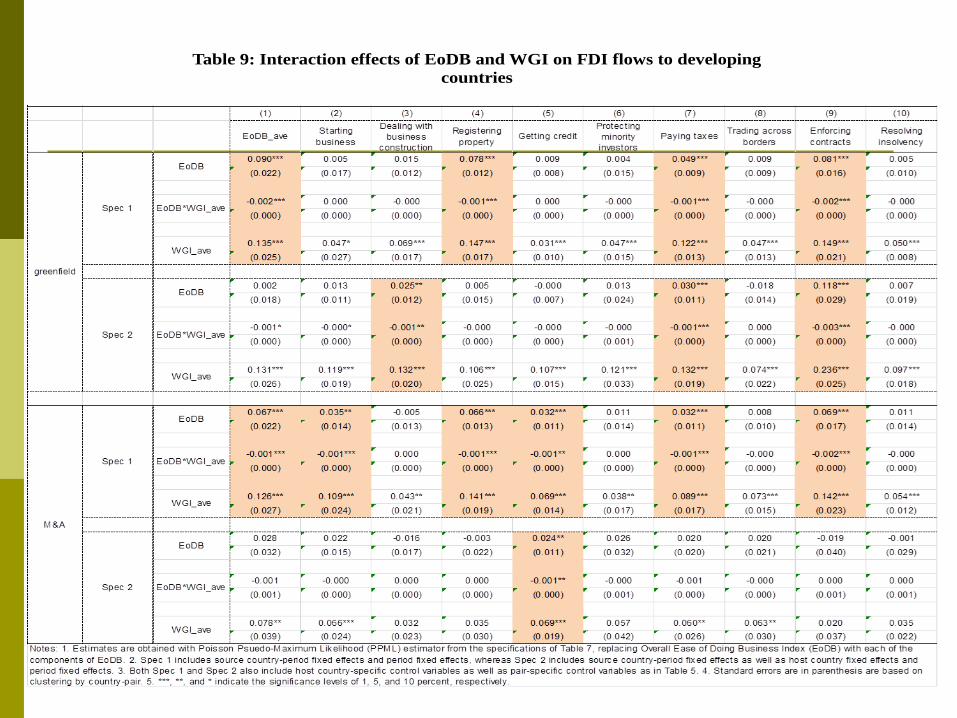
Table 9: Interaction effects of EoDB and WGI on FDI flows to developing
countries
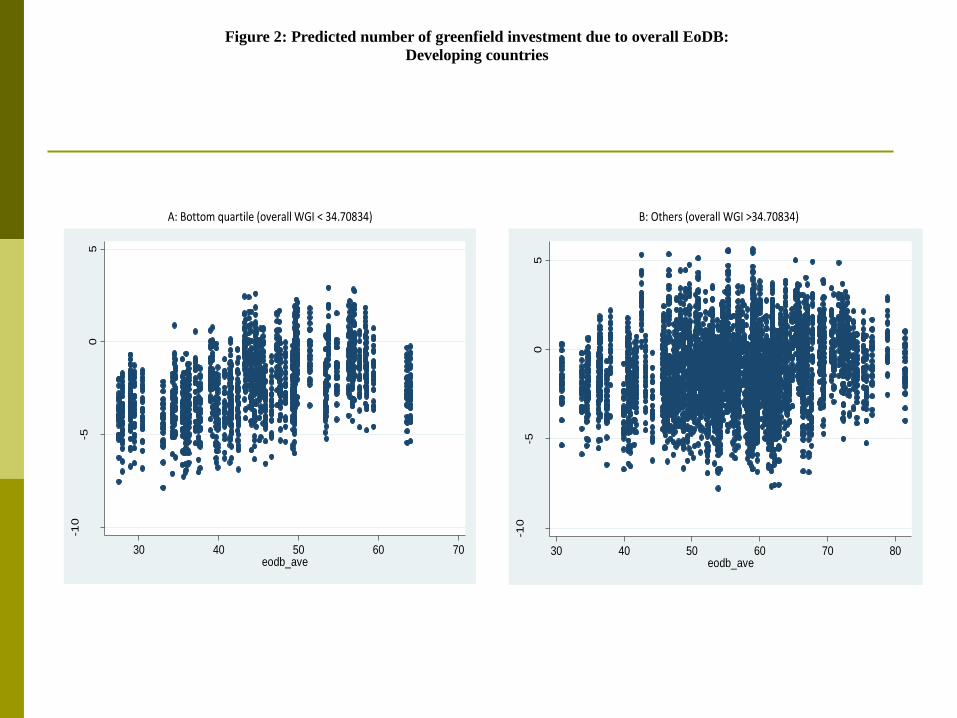
Figure 2: Predicted number of greenfield investment due to overall EoDB:
Developing countries
A: Bottom quartile (overall WGI < 34.70834)
-10
-50
5
Pre
dic
ted m
ea
n g
f_n
30 40 50 60 70eodb_ave
B: Others (overall WGI >34.70834)
-10
-50
5
Pre
dic
ted m
ea
n g
f_n
30 40 50 60 70 80eodb_ave
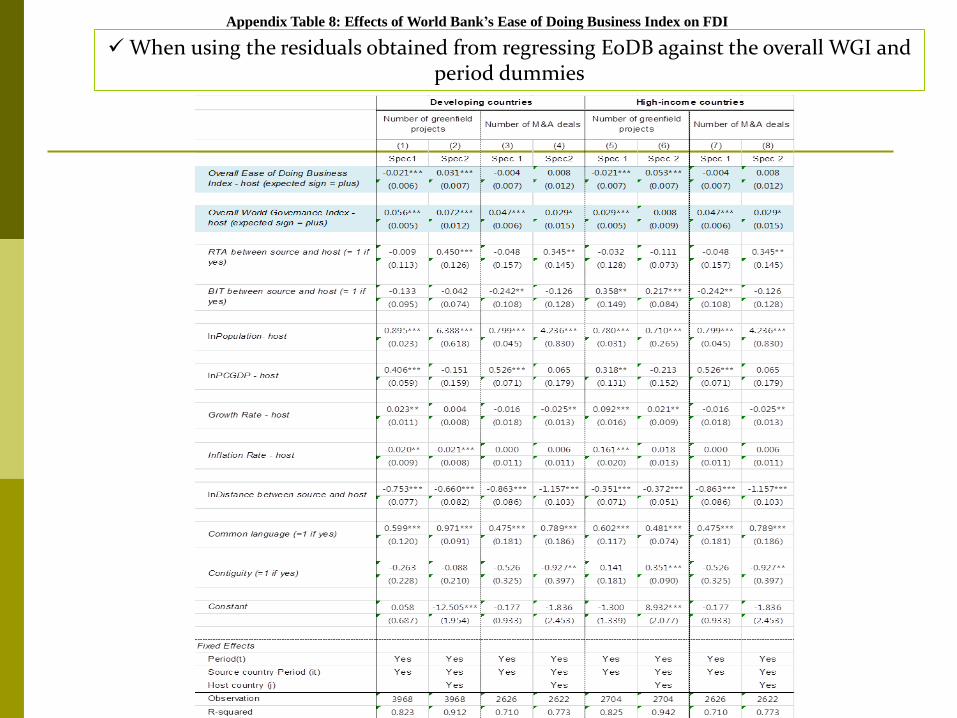
Appendix Table 8: Effects of World Bank’s Ease of Doing Business Index on FDI
When using the residuals obtained from regressing EoDB against the overall WGI and period dummies
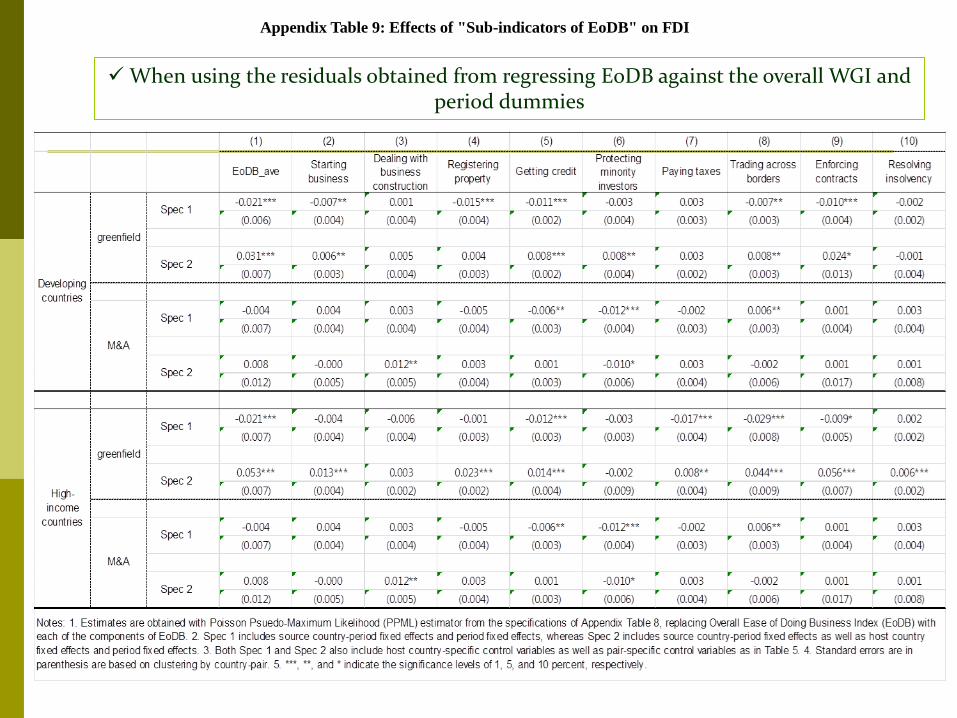
Appendix Table 9: Effects of "Sub-indicators of EoDB" on FDI
When using the residuals obtained from regressing EoDB against the overall WGI and period dummies
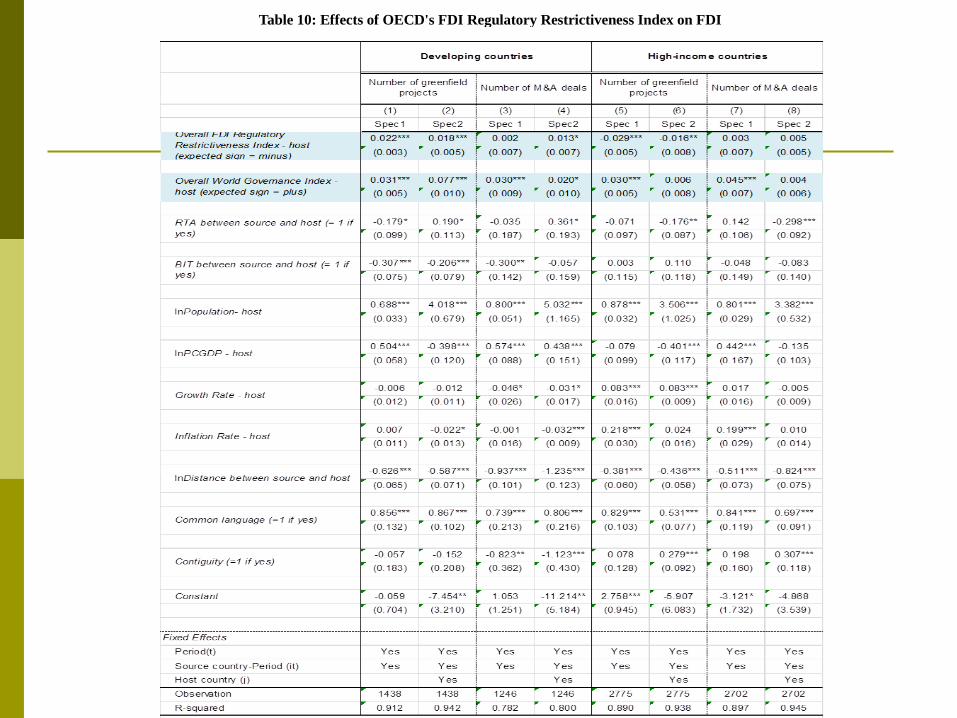
Table 10: Effects of OECD's FDI Regulatory Restrictiveness Index on FDI
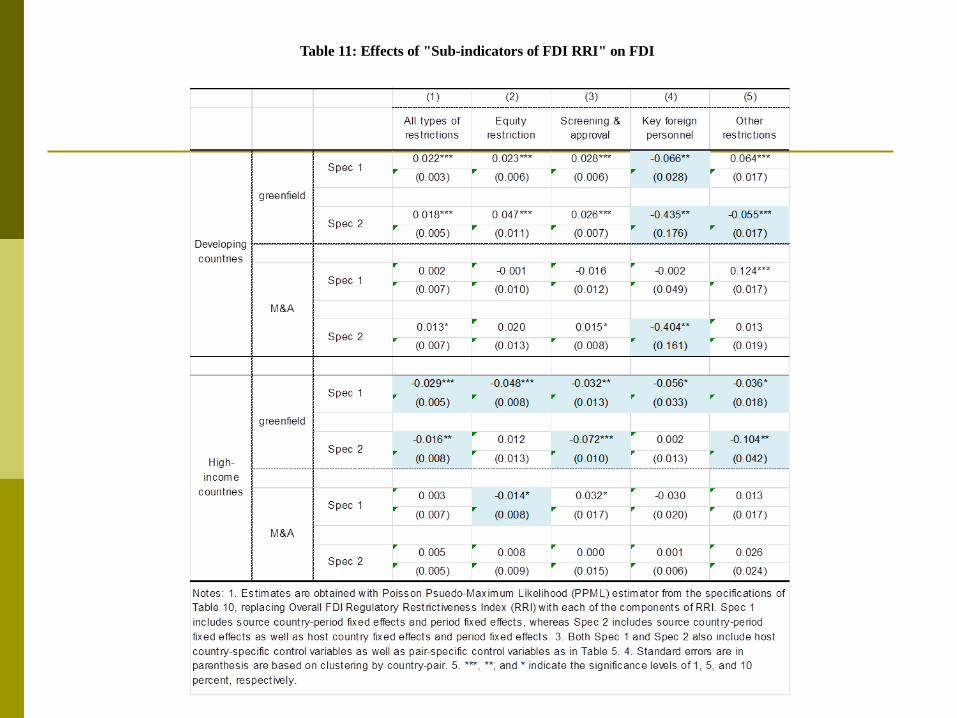
Table 11: Effects of "Sub-indicators of FDI RRI" on FDI
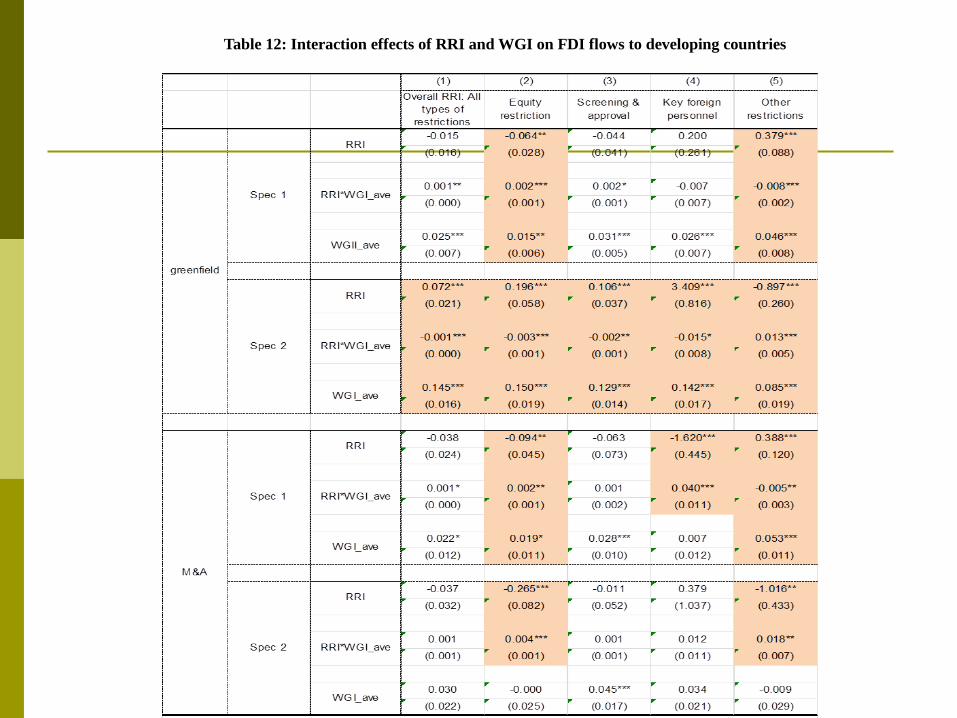
Table 12: Interaction effects of RRI and WGI on FDI flows to developing countries
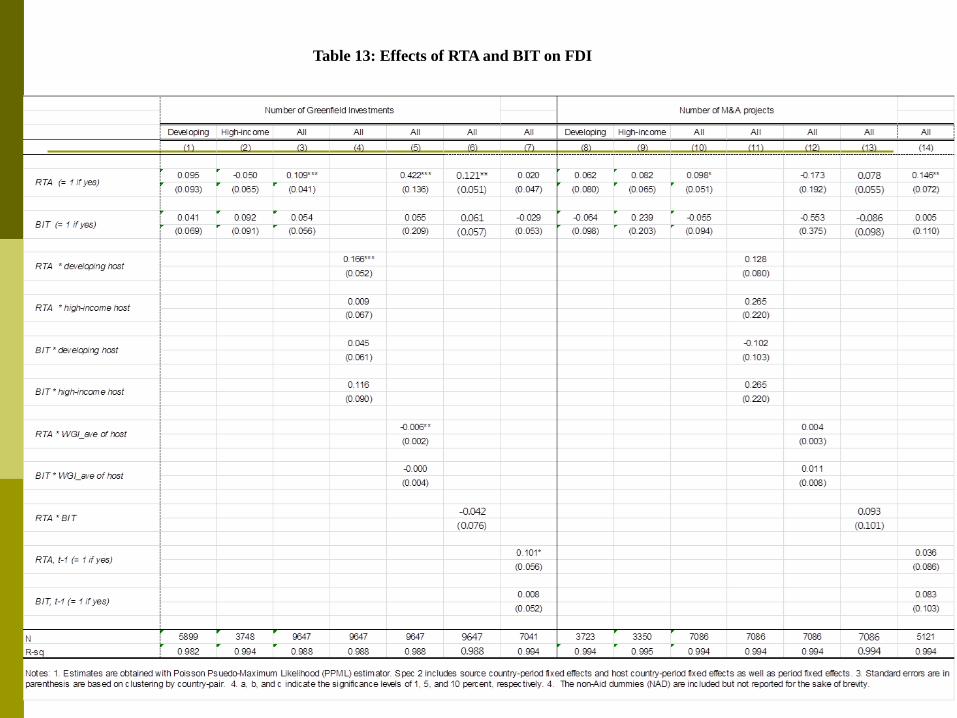
Table 13: Effects of RTA and BIT on FDI
42
5. Summary and Concluding Remarks
Main findings
Among the host country-specific governance/policy factors, the quality of local governance is the most important factor for both greenfield and M&A investments to developing countries, whereas FDI restrictive policies of developing countries are not significant factors in restricting FDI inflows to these countries.
Specifically, governance quality of host countries has a significant effect on both greenfield and M&A investment flows to both developing and high-income countries.
The effect of governance quality of host countries on both modes is greater in developing host countries than in high-income host countries.
When host countries are developing countries, the effect of governance quality is greater for greenfield investment than M&A investment.
43
5. Summary and Concluding Remarks
Main findings (Cont.)
An improvement in host country’s environment for doing business
may have a positive effect on greenfield investment only when the host country’s governance quality is very low.
Among the various factors of local business environments, dealing with business construction”, “paying taxes”, and “enforcing contracts” may have a positive effect on greenfield investments only when the host country’s governance quality is very low. For M&A investment, this relation is evident with ease of “getting credit”.
Among the pair-specific policy factors, regional trade agreements have a significantly positive impact on greenfield investment flows to developing countries, while bilateral investment treaties do not exert any positive effect either on greenfield investment or M&A investment.
44
5. Summary and Concluding Remarks
Main findings (Cont.)
Among various governance factors, “regulatory quality”, “rule of law”, “government effectiveness”, “control of corruption”, and “political stability” of host developing countries appear to be particularly important for MNEs’ decision on greenfield investment to developing countries.
“Voice and accountability”, “political stability”, “rule of law”, and control of corruption” are also important governance factors for M&A investment in developing countries.
Among the various factors of local business environments, dealing with business construction”, “paying taxes”, and “enforcing contracts” may have a positive effect on greenfield investments only when the host country’s governance quality is very low.
For M&A investment, this relation is evident with ease of “getting credit”.
45
Policy suggestions for ADB
OECD’s FDI RRI does not deal with FDI promotion policies and covers only 22 developing countries.
ADB may take an initiative in developing an index measuring FDI policies, similarly to Wei (2000).
Utilizing PricewaterhouseCoopers (PwC)’s country reports on FDI policies, Wei (2000) constructs two measures of government policies towards FDI in 49 countries: FDI restrictions index and FDI incentives index.
“FDI restrictions” index was created based on the presence of restrictions in four sub areas such as (1) controls on foreign exchange transactions, (2) exclusion of foreign firms from certain strategic sectors, (3) exclusion of foreign firms from other sectors, and (4) restrictions on the share of foreign ownership.
“FDI incentives” index was created based on the presence or absence of FDI promoting policies in the following four areas: (1) special incentives for foreigners to invest in certain industries or certain geographic areas; (2) tax concessions specific to foreign firms; (3) cash grants, subsidized loans, reduced rent for land use, or other nontax concessions, when these are specific to foreign firms; and (4) special promotion for exports (including the existence of export processing zones, special economic zones, and the like).
5. Concluding observations