Embed Size (px)
Citation preview
Journal of Economic Perspectives—Volume 28, Number 2—Spring 2014—Pages 51–74
TT he all-encompassing goal of political campaigns is to maximize the prob-he all-encompassing goal of political campaigns is to maximize the prob-ability of victory. To that end, every facet of a campaign is evaluated by ability of victory. To that end, every facet of a campaign is evaluated by how many votes an activity will generate and at what cost. To perform this how many votes an activity will generate and at what cost. To perform this
cost–benefi t analysis, campaigns need accurate predictions about the preferences cost–benefi t analysis, campaigns need accurate predictions about the preferences of voters, their expected behaviors, and their responses to campaign outreach. For of voters, their expected behaviors, and their responses to campaign outreach. For instance, efforts to increase voter turnout are counterproductive if the campaign instance, efforts to increase voter turnout are counterproductive if the campaign mobilizes people who support the opponent. Over the past six years, campaigns mobilizes people who support the opponent. Over the past six years, campaigns have become increasingly reliant on analyzing large and detailed datasets to create have become increasingly reliant on analyzing large and detailed datasets to create the necessary predictions. While the adoption of these new analytic methods has the necessary predictions. While the adoption of these new analytic methods has not radically transformed how campaigns operate, the improved effi ciency gives not radically transformed how campaigns operate, the improved effi ciency gives data-savvy campaigns a competitive advantage. This has led the political parties to data-savvy campaigns a competitive advantage. This has led the political parties to engage in an arms race to leverage ever-growing volumes of data to create votes. engage in an arms race to leverage ever-growing volumes of data to create votes. This paper describes the utility and evolution of data in political campaigns.This paper describes the utility and evolution of data in political campaigns.
The techniques used as recently as a decade or two ago by political campaigns The techniques used as recently as a decade or two ago by political campaigns to predict the tendencies of citizens appear extremely rudimentary by current to predict the tendencies of citizens appear extremely rudimentary by current standards. At that time, citizens’ likely support was gauged primarily by their party standards. At that time, citizens’ likely support was gauged primarily by their party affi liations and the “performance” of the precincts in which they lived (that is, what affi liations and the “performance” of the precincts in which they lived (that is, what
Political Campaigns and Big Data†
■ ■ David W. Nickerson is Associate Professor of Political Science, University of Notre Dame, South Bend, Indiana. He served as the “Director of Experiments” in the Analytics Department in the 2012 re-election campaign of President Barack Obama. Todd Rogers is Assistant Professor of Public Policy, Harvard Kennedy School of Government, Cambridge, Massachusetts. He co-founded the Analyst Institute, which uses fi eld experiments and behav-ioral science insights to develop best practices in progressive political communications. Their email addresses are [email protected] and [email protected].† To access the Appendix and disclosure statements, visit http://dx.doi.org/10.1257/jep.28.2.51 doi=10.1257/jep.28.2.51
David W. Nickerson and Todd Rogers
52 Journal of Economic Perspectives
percentage of the precinct had voted for a given party in the recent past). Whether percentage of the precinct had voted for a given party in the recent past). Whether a person was predicted to turn out and vote was often based on the past four general a person was predicted to turn out and vote was often based on the past four general elections; for example, it was not uncommon to hear phrases like “2 of 4 voter” or elections; for example, it was not uncommon to hear phrases like “2 of 4 voter” or “3 of 4 voter” used in campaign targeting plans. Past donors would be recontacted “3 of 4 voter” used in campaign targeting plans. Past donors would be recontacted and asked for a fl at amount of money (or perhaps asked for their highest previous and asked for a fl at amount of money (or perhaps asked for their highest previous contribution if that information was available) and prior volunteer captains would contribution if that information was available) and prior volunteer captains would be recontacted, but intermittent volunteers were unlikely to appear on any lists. be recontacted, but intermittent volunteers were unlikely to appear on any lists. Back then, a “numbers-driven campaign” implied that candidates and their advisors Back then, a “numbers-driven campaign” implied that candidates and their advisors paid close attention to poll numbers and adjusted policies in response to surveys. paid close attention to poll numbers and adjusted policies in response to surveys. A memorable example of this dynamic is the story of President Clinton’s advisor A memorable example of this dynamic is the story of President Clinton’s advisor Dick Morris fi elding a poll to choose Jackson Hole, Wyoming, as the vacation spot Dick Morris fi elding a poll to choose Jackson Hole, Wyoming, as the vacation spot for the president (Kuhn 2004). Presidential campaigns targeted states based on for the president (Kuhn 2004). Presidential campaigns targeted states based on historical notions of which states could see the vote swing either way, combined with historical notions of which states could see the vote swing either way, combined with the realities of the campaign budget.the realities of the campaign budget.
In retrospect, the reliance of political campaigns on such rough—although In retrospect, the reliance of political campaigns on such rough—although often useful—heuristics is puzzling. Campaigns a decade ago already possessed often useful—heuristics is puzzling. Campaigns a decade ago already possessed considerable information on citizens’ preferences based on what they had considerable information on citizens’ preferences based on what they had collected directly from volunteers, donors, and their own polling. Voter registra-collected directly from volunteers, donors, and their own polling. Voter registra-tion rolls were available at the state level from Secretaries of State. Detailed census tion rolls were available at the state level from Secretaries of State. Detailed census information was available. Why did campaigns take so long to realize the value information was available. Why did campaigns take so long to realize the value of information resources they already possessed?of information resources they already possessed?
Part of the answer is technological: adequate storage and computing power Part of the answer is technological: adequate storage and computing power required large investments and were beyond the infrastructure of nearly all required large investments and were beyond the infrastructure of nearly all campaigns and state parties. Even if an entrepreneurial campaign made that invest-campaigns and state parties. Even if an entrepreneurial campaign made that invest-ment, much of the available data would not have been as reliable as it is today. ment, much of the available data would not have been as reliable as it is today. States were not required to keep electronic copies of which citizens voted in each States were not required to keep electronic copies of which citizens voted in each past election until 2002 with the passage of the Help America Vote Act of 2002 past election until 2002 with the passage of the Help America Vote Act of 2002 (42 U.S.C. § 15483), so using the data on voting in federal elections would have (42 U.S.C. § 15483), so using the data on voting in federal elections would have been onerous in many regions.been onerous in many regions.
But perhaps the biggest impediment to wider adoption of data-driven But perhaps the biggest impediment to wider adoption of data-driven campaigning was simply that statistical thinking—and the human capital that campaigning was simply that statistical thinking—and the human capital that produces it—had not yet taken root in the world of political consulting. Campaign produces it—had not yet taken root in the world of political consulting. Campaign consultants generate most of their business through social networks and are judged consultants generate most of their business through social networks and are judged by win/loss records. Political candidates are typically trained in nonquantitative by win/loss records. Political candidates are typically trained in nonquantitative fi elds like law, education, and medicine and are more focused on fundraising and fi elds like law, education, and medicine and are more focused on fundraising and voter outreach than the nitty-gritty of managing a campaign. There were certainly voter outreach than the nitty-gritty of managing a campaign. There were certainly consultants specializing in campaign data analytics, and the development of “predic-consultants specializing in campaign data analytics, and the development of “predic-tive scores” for voters existed as a niche business, but most campaign decisions did tive scores” for voters existed as a niche business, but most campaign decisions did not rely on these approaches. There were too few people with the skills required to not rely on these approaches. There were too few people with the skills required to make a noticeable impact on how campaigns operated and too few decisionmakers make a noticeable impact on how campaigns operated and too few decisionmakers equipped to appreciate the effect that a fuller use of information could have. At that equipped to appreciate the effect that a fuller use of information could have. At that time, mail vendors were on the cutting edge of using consumer data for modeling time, mail vendors were on the cutting edge of using consumer data for modeling purposes and at least a decade ahead of the political campaign learning curve purposes and at least a decade ahead of the political campaign learning curve (Malchow 2003).(Malchow 2003).
David W. Nickerson and Todd Rogers 53
These impediments to data-driven campaigning have changed in recent years. These impediments to data-driven campaigning have changed in recent years. The costs of purchasing, storing, managing, and analyzing data have decreased The costs of purchasing, storing, managing, and analyzing data have decreased exponentially. The supply of quantitatively oriented political operatives and exponentially. The supply of quantitatively oriented political operatives and campaign data analysts has increased as predictive analytics has gained footholds in campaign data analysts has increased as predictive analytics has gained footholds in other sectors of the economy like banking, consulting, marketing, and e-commerce. other sectors of the economy like banking, consulting, marketing, and e-commerce. To reduce the need for individual campaigns to spend scarce funds purchasing To reduce the need for individual campaigns to spend scarce funds purchasing citizen information from commercial vendors, the national parties have decided to citizen information from commercial vendors, the national parties have decided to construct, maintain, and regularly augment their own voter databases (McAuliffe construct, maintain, and regularly augment their own voter databases (McAuliffe with Ketten 2008, pp. 280–87).with Ketten 2008, pp. 280–87).
These conditions have provided fertile ground for analytically minded These conditions have provided fertile ground for analytically minded consultants to apply statistical tools to campaign activities and campaign data. consultants to apply statistical tools to campaign activities and campaign data. Contemporary political campaigns amass enormous databases on individual Contemporary political campaigns amass enormous databases on individual citizens and hire data analysts to create models predicting citizens’ behaviors, citizens and hire data analysts to create models predicting citizens’ behaviors, dispositions, and responses to campaign contact. This data-driven campaigning dispositions, and responses to campaign contact. This data-driven campaigning gives candidates and their advisers powerful tools for plotting electoral strategy. gives candidates and their advisers powerful tools for plotting electoral strategy. A political campaign has limited fi nancial resources. It can use this data-driven A political campaign has limited fi nancial resources. It can use this data-driven approach to shape decisions about who the campaign should target, with a sense approach to shape decisions about who the campaign should target, with a sense of how much such contact will affect voter preferences, behaviors like fundraising, of how much such contact will affect voter preferences, behaviors like fundraising, or turnout at the polls. This technology allows campaigns to target their outreach or turnout at the polls. This technology allows campaigns to target their outreach tactically at particular individuals and then also to aggregate these predictive esti-tactically at particular individuals and then also to aggregate these predictive esti-mates up to the jurisdiction level to inform large-scale strategic decisions.mates up to the jurisdiction level to inform large-scale strategic decisions.
Given that campaigns view their analytic techniques as secret weapons to be Given that campaigns view their analytic techniques as secret weapons to be kept out of the hands of opponents, the public discourse on campaign data has been kept out of the hands of opponents, the public discourse on campaign data has been largely speculative and somewhat hypothetical, ranging from hyping the perfor-largely speculative and somewhat hypothetical, ranging from hyping the perfor-mance of the tools (Scherer 2012) to alarmist concerns about the personal privacy mance of the tools (Scherer 2012) to alarmist concerns about the personal privacy of voters (Duhigg 2012). This paper describes the state of contemporary campaign of voters (Duhigg 2012). This paper describes the state of contemporary campaign data analytics. We begin by explaining why campaigns need data and the “predictive data analytics. We begin by explaining why campaigns need data and the “predictive scores” that they seek to calculate. We then describe where that data comes from scores” that they seek to calculate. We then describe where that data comes from and the techniques used to analyze political data. We conclude by noting several and the techniques used to analyze political data. We conclude by noting several challenges facing campaigns as data analytics become more widely used and increas-challenges facing campaigns as data analytics become more widely used and increas-ingly accurate. The analytics revolution has not radically transformed campaigns ingly accurate. The analytics revolution has not radically transformed campaigns in the manner that television did in the 1960s, but in a close political contest, in the manner that television did in the 1960s, but in a close political contest, data-driven campaigning can have enough effect to make the difference between data-driven campaigning can have enough effect to make the difference between winning and losing.winning and losing.
Why Do Campaigns Need Data?
Contemporary campaigns use data in a number of creative ways, but the Contemporary campaigns use data in a number of creative ways, but the primary purpose of political data has been—and will be for the foreseeable future—primary purpose of political data has been—and will be for the foreseeable future—providing a list of citizens to contact. Campaigns need accurate contact information providing a list of citizens to contact. Campaigns need accurate contact information on citizens, volunteers, and donors. Campaigns would like to record which citizens on citizens, volunteers, and donors. Campaigns would like to record which citizens engage in specifi c campaign-supporting actions like donating money, volunteering, engage in specifi c campaign-supporting actions like donating money, volunteering, attending rallies, signing petitions, or expressing support for candidates or issues in attending rallies, signing petitions, or expressing support for candidates or issues in
54 Journal of Economic Perspectives
tracking polls. Indeed, the Federal Election Commission requires campaigns and tracking polls. Indeed, the Federal Election Commission requires campaigns and coordinated committees to disclose the identity of all individuals who contribute coordinated committees to disclose the identity of all individuals who contribute more than $200 during the calendar year. These disclosure requirements mean that more than $200 during the calendar year. These disclosure requirements mean that campaigns have a legal requirement, as well as fi nancial incentive, to maintain good campaigns have a legal requirement, as well as fi nancial incentive, to maintain good lists of donors.lists of donors.
Campaigns also use data to construct predictive models to make targeting Campaigns also use data to construct predictive models to make targeting campaign communications more effi cient and to support broader campaign strate-campaign communications more effi cient and to support broader campaign strate-gies. These predictive models result in three categories of “predictive scores” for gies. These predictive models result in three categories of “predictive scores” for each citizen in the voter database: behavior scores, support scores, and responsive-each citizen in the voter database: behavior scores, support scores, and responsive-ness scores.ness scores.
Behavior scores use past behavior and demographic information to calculate use past behavior and demographic information to calculate explicit probabilities that citizens will engage in particular forms of political activity. explicit probabilities that citizens will engage in particular forms of political activity. The primary outcomes campaigns are concerned with include voter turnout and The primary outcomes campaigns are concerned with include voter turnout and donations, but other outcomes such as volunteering and rally attendance are also donations, but other outcomes such as volunteering and rally attendance are also of interest.of interest.
Support scores predict the political preferences of citizens. In the ideal world of predict the political preferences of citizens. In the ideal world of campaign advisers, campaigns would contact all citizens and ask them about their campaign advisers, campaigns would contact all citizens and ask them about their candidate and issue preferences. However, in the real world of budget constraints, candidate and issue preferences. However, in the real world of budget constraints, campaigns contact a subset of citizens and use their responses as data to develop campaigns contact a subset of citizens and use their responses as data to develop models that predict the preferences of the rest of the citizens who are registered models that predict the preferences of the rest of the citizens who are registered to vote. These support scores typically range from 0 to 100 and generally are inter-to vote. These support scores typically range from 0 to 100 and generally are inter-preted to mean “if you sample 100 citizens with a score of preted to mean “if you sample 100 citizens with a score of X, , X percent would prefer percent would prefer the candidate/issue.” A support score of “0” means that no one in a sample of the candidate/issue.” A support score of “0” means that no one in a sample of 100 citizens would support the candidate/issue, “100” means that everyone in the 100 citizens would support the candidate/issue, “100” means that everyone in the sample would support the candidate/issue, and “50” means that half of the sample sample would support the candidate/issue, and “50” means that half of the sample would support the candidate/issue. Support scores only predict the preferences at would support the candidate/issue. Support scores only predict the preferences at the aggregate level, not the individual level. That is, people assigned support scores the aggregate level, not the individual level. That is, people assigned support scores of 50 are not necessarily undecided or ambivalent about the candidate/issue and, of 50 are not necessarily undecided or ambivalent about the candidate/issue and, in fact, may have strong preferences. But when citizens have support scores of 50, it in fact, may have strong preferences. But when citizens have support scores of 50, it means that it is diffi cult to predict their political preferences.means that it is diffi cult to predict their political preferences.
Responsiveness scores predict how citizens will respond to campaign outreach. predict how citizens will respond to campaign outreach. While there are theoretical rationales as to who might be most responsive to blan-While there are theoretical rationales as to who might be most responsive to blan-dishments to vote (Arceneaux and Nickerson 2009) and attempts at persuasion dishments to vote (Arceneaux and Nickerson 2009) and attempts at persuasion (Hillygus and Shields 2008), in general predicting which types of individuals will (Hillygus and Shields 2008), in general predicting which types of individuals will be most and least responsive to particular direct communications in a given elec-be most and least responsive to particular direct communications in a given elec-toral context is diffi cult. Campaigns can use fully randomized fi eld experiments to toral context is diffi cult. Campaigns can use fully randomized fi eld experiments to measure the average response to a campaign tactic (Gerber and Green 2000; Green measure the average response to a campaign tactic (Gerber and Green 2000; Green and Gerber 2008; Nickerson and Rogers 2010; Arceneaux and Nickerson 2010; and Gerber 2008; Nickerson and Rogers 2010; Arceneaux and Nickerson 2010; Nickerson 2005; Nickerson, Friedrichs, and King 2006; Bryan, Walton, Rogers, and Nickerson 2005; Nickerson, Friedrichs, and King 2006; Bryan, Walton, Rogers, and Dweck 2011; Gerber and Rogers 2009; Bailey, Hopkins, and Rogers 2013; Rogers Dweck 2011; Gerber and Rogers 2009; Bailey, Hopkins, and Rogers 2013; Rogers and Nickerson 2013). The results of these experiments can then be analyzed to and Nickerson 2013). The results of these experiments can then be analyzed to detect and model heterogeneous treatment effects (in this case, predictive scores). detect and model heterogeneous treatment effects (in this case, predictive scores). The estimated model can then be used to predict treatment responsiveness for the The estimated model can then be used to predict treatment responsiveness for the entire target population and guide future targeting decisions (Issenberg 2012a, b, c). entire target population and guide future targeting decisions (Issenberg 2012a, b, c).
Political Campaigns and Big Data 55
Some of the results of these experiments can only be used to inform decisions in Some of the results of these experiments can only be used to inform decisions in future elections: for example, the results of most voter turnout experiments neces-future elections: for example, the results of most voter turnout experiments neces-sarily come after Election Day. But other experiments can be conducted during sarily come after Election Day. But other experiments can be conducted during the election cycle to improve effi ciency in real time; for example, lessons from the election cycle to improve effi ciency in real time; for example, lessons from experiments evaluating the effi cacy of treatments aimed at increasing observable experiments evaluating the effi cacy of treatments aimed at increasing observable behaviors like donations and volunteering can be put to immediate use. Similarly, behaviors like donations and volunteering can be put to immediate use. Similarly, the persuasiveness of campaign communications can be gauged through random-the persuasiveness of campaign communications can be gauged through random-ized experiments that measure voter preferences through post-treatment polling ized experiments that measure voter preferences through post-treatment polling of the treatment and control groups. The types of citizens found to be especially of the treatment and control groups. The types of citizens found to be especially responsive to the campaign treatment in these pilot experiments—as refl ected in responsive to the campaign treatment in these pilot experiments—as refl ected in the responsiveness score—can be targeted during a larger rollout of the campaign the responsiveness score—can be targeted during a larger rollout of the campaign treatment. Conversely, citizens who are unresponsive, or are predicted to respond treatment. Conversely, citizens who are unresponsive, or are predicted to respond negatively, can be avoided by the campaign.negatively, can be avoided by the campaign.
Campaigns are primarily concerned with the practical question of how Campaigns are primarily concerned with the practical question of how accurately predictive scores forecast the behaviors, preferences, and responses of accurately predictive scores forecast the behaviors, preferences, and responses of individual citizens, not with testing an academic theory. As a result, the variables individual citizens, not with testing an academic theory. As a result, the variables included in the construction of these scores often have thin theoretical justifi ca-included in the construction of these scores often have thin theoretical justifi ca-tions. That said, a variable in a dataset that is found to predict an outcome of interest tions. That said, a variable in a dataset that is found to predict an outcome of interest but has no theoretical rationale for the relationship is more likely to prove to be but has no theoretical rationale for the relationship is more likely to prove to be spurious when validated against an “out-of-sample” dataset. For instance, the analyst spurious when validated against an “out-of-sample” dataset. For instance, the analyst may discover that people between the ages of 37 and 43 are more likely to support may discover that people between the ages of 37 and 43 are more likely to support Republicans than older and younger age groups. However, there is no particular Republicans than older and younger age groups. However, there is no particular reason to suspect that this six-year cohort is especially conservative, suggesting reason to suspect that this six-year cohort is especially conservative, suggesting that the fi nding could be a sample-specifi c fl uke that would not generalize to the that the fi nding could be a sample-specifi c fl uke that would not generalize to the overall population. Successful predictive scores need not be based on theories or overall population. Successful predictive scores need not be based on theories or imply causal relationships, but campaign data analysts must still think critically imply causal relationships, but campaign data analysts must still think critically and creatively about what variables sensibly relate to their outcomes of interest to and creatively about what variables sensibly relate to their outcomes of interest to generate predictive scores with the external validity required by campaigns.generate predictive scores with the external validity required by campaigns.
Where Does Campaign Data Come From?
Procuring and maintaining large databases of citizens with up-to-date informa-Procuring and maintaining large databases of citizens with up-to-date informa-tion from multiple sources may seem straightforward, but it is a nontrivial logistical tion from multiple sources may seem straightforward, but it is a nontrivial logistical hurdle and requires substantial fi nancial commitment. After all, people frequently hurdle and requires substantial fi nancial commitment. After all, people frequently change residences and contact information (Nickerson 2006a). Campaigns also change residences and contact information (Nickerson 2006a). Campaigns also need to track their own behavior to limit awkward interactions with citizens who need to track their own behavior to limit awkward interactions with citizens who have been contacted multiple times previously.have been contacted multiple times previously.
In the recent past, campaigns struggled to manage and integrate the various In the recent past, campaigns struggled to manage and integrate the various sources of their data. The data collected by those working on digital communications sources of their data. The data collected by those working on digital communications rarely linked with the data collected by those working on fi eld operations—meaning rarely linked with the data collected by those working on fi eld operations—meaning canvassing, phone calls, volunteer recruitment, and so on—or fundraising. One canvassing, phone calls, volunteer recruitment, and so on—or fundraising. One of the most heralded successes of the 2012 campaign to re-elect President Obama of the most heralded successes of the 2012 campaign to re-elect President Obama was the creation of was the creation of Narwhal, a program that merged data collected from these , a program that merged data collected from these
56 Journal of Economic Perspectives
digital, fi eld, and fi nancial sources into one database (Gallagher 2012; Madrigal digital, fi eld, and fi nancial sources into one database (Gallagher 2012; Madrigal 2012). As a result, the Obama re-election campaign began with a ten terabyte 2012). As a result, the Obama re-election campaign began with a ten terabyte database (BigData-Startups 2013) that grew to be over 50 terabytes by the end of the database (BigData-Startups 2013) that grew to be over 50 terabytes by the end of the election (Burt 2013).election (Burt 2013).
The foundation of voter databases is the publicly available offi cial voter fi les The foundation of voter databases is the publicly available offi cial voter fi les maintained by Secretaries of State, which ensure that only eligible citizens actually maintained by Secretaries of State, which ensure that only eligible citizens actually cast ballots and that no citizen votes more than once.cast ballots and that no citizen votes more than once.11 The offi cial voter fi le contains The offi cial voter fi le contains a wide range of information. In addition to personal information such as date of a wide range of information. In addition to personal information such as date of birth and gender,birth and gender,22 which are often valuable in developing predictive scores, voter which are often valuable in developing predictive scores, voter fi les also contain contact information such as address and phone. More directly fi les also contain contact information such as address and phone. More directly relevant to campaigns, certain details about past electoral participation are also relevant to campaigns, certain details about past electoral participation are also recorded on offi cial voter fi les. recorded on offi cial voter fi les. Who citizens vote for is secret, but citizens vote for is secret, but whether citizens citizens vote is refl ected in offi cial voter fi les—as is the method used to vote: for example, vote is refl ected in offi cial voter fi les—as is the method used to vote: for example, in person on Election Day or by use of absentee or another form of early voting. in person on Election Day or by use of absentee or another form of early voting. This information concerning past vote history unsurprisingly tends to be the most This information concerning past vote history unsurprisingly tends to be the most important data in the development of voter turnout behavior scores. The act of important data in the development of voter turnout behavior scores. The act of voting, of course, reveals higher propensity to vote.voting, of course, reveals higher propensity to vote.
The geographic location of citizens’ residences can also provide valuable The geographic location of citizens’ residences can also provide valuable information, because campaigns can merge relevant Census and precinct data information, because campaigns can merge relevant Census and precinct data with the information on citizens in the voter database. Census data—such as with the information on citizens in the voter database. Census data—such as average household income, average level of education, average number of chil-average household income, average level of education, average number of chil-dren per household, and ethnic distribution—is useful for the development of a dren per household, and ethnic distribution—is useful for the development of a host of predictive scores. Campaign data analysts also append the aggregated vote host of predictive scores. Campaign data analysts also append the aggregated vote totals cast for each offi ce and issue in past elections in each citizen’s precinct to totals cast for each offi ce and issue in past elections in each citizen’s precinct to individual voter records in the voter database. Even being mindful of ecological individual voter records in the voter database. Even being mindful of ecological fallacy—that is, inferring someone’s individual characteristics based on their fallacy—that is, inferring someone’s individual characteristics based on their membership in a larger group or cluster—this aggregate-level information in fact membership in a larger group or cluster—this aggregate-level information in fact tends to increase predictive score accuracy.tends to increase predictive score accuracy.
Campaign data analysts also can append two types of data from consumer Campaign data analysts also can append two types of data from consumer databases. First, and most essentially, they seek updated phone numbers. Phone databases. First, and most essentially, they seek updated phone numbers. Phone calls are a critical feature of campaigns. While a volunteer knocking on doors will calls are a critical feature of campaigns. While a volunteer knocking on doors will make successful contact with two to four people/hour, a volunteer making phone make successful contact with two to four people/hour, a volunteer making phone calls can reach 10–15 people/hour (Nickerson 2006b, 2007a). Using an automated calls can reach 10–15 people/hour (Nickerson 2006b, 2007a). Using an automated dialer, the total can be even higher. While most offi cial voter fi les contain phone dialer, the total can be even higher. While most offi cial voter fi les contain phone numbers, they are often out of date and coverage is incomplete. Election offi cials numbers, they are often out of date and coverage is incomplete. Election offi cials only request a phone number from voters registering for the fi rst time, and so if only request a phone number from voters registering for the fi rst time, and so if someone continues voting in the same jurisdiction over time, it’s not uncommon to someone continues voting in the same jurisdiction over time, it’s not uncommon to fi nd phone numbers that are 20 years out of date. Because current phone numbers fi nd phone numbers that are 20 years out of date. Because current phone numbers
1 The exception to this rule is North Dakota, which does not have a voter registration system. Eligible voters simply show up and prove their eligibility by showing a valid ID, utility bill, or having a neighbor vouch for their residency.2 In states that were subject to the Voting Rights Act, the self-identifi ed race of the registrants is included on offi cial voter fi les, though this may change in light of the Supreme Court’s June 25, 2013, ruling in Shelby County v. Holder 570 US ___ (2013).
David W. Nickerson and Todd Rogers 57
are so important, campaigns fi nd it worthwhile to purchase more accurate contact are so important, campaigns fi nd it worthwhile to purchase more accurate contact information available from consumer data fi rms.information available from consumer data fi rms.
Campaigns can also purchase a wide range of additional information from Campaigns can also purchase a wide range of additional information from consumer data vendors relatively inexpensively, such as estimated years of educa-consumer data vendors relatively inexpensively, such as estimated years of educa-tion, home ownership status, and mortgage information. In contrast, information tion, home ownership status, and mortgage information. In contrast, information on magazine subscriptions, car purchases, and other consumer tastes are relatively on magazine subscriptions, car purchases, and other consumer tastes are relatively expensive to purchase from vendors, and also tend to be available for very few indi-expensive to purchase from vendors, and also tend to be available for very few indi-viduals. Given this limited coverage, this data tends not to be useful in constructing viduals. Given this limited coverage, this data tends not to be useful in constructing predictive scores for the entire population—and so campaigns generally avoid or predictive scores for the entire population—and so campaigns generally avoid or limit purchases of this kind of consumer data. The vast majority of these variables limit purchases of this kind of consumer data. The vast majority of these variables literally do nothing to increase the predictive power of models of mass behavior literally do nothing to increase the predictive power of models of mass behavior once prior behavior is accounted for (for example, any power of income or educa-once prior behavior is accounted for (for example, any power of income or educa-tion measures to predict voter turnout are subsumed by controlling for prior tion measures to predict voter turnout are subsumed by controlling for prior voter turnout).voter turnout).
While campaigns do purchase some information, the vast majority of the While campaigns do purchase some information, the vast majority of the useful information campaigns collect about individuals is provided by the individ-useful information campaigns collect about individuals is provided by the individ-uals themselves. For example, those who have donated and volunteered in the past uals themselves. For example, those who have donated and volunteered in the past are high-value prospects for fundraising and volunteer-recruitment in the future. are high-value prospects for fundraising and volunteer-recruitment in the future. Moreover, the attributes of these individuals can be used to develop behavior scores Moreover, the attributes of these individuals can be used to develop behavior scores to identify others who may be likely to donate or volunteer. Similarly, information to identify others who may be likely to donate or volunteer. Similarly, information about individuals who answered the phone or door in the past can be used to about individuals who answered the phone or door in the past can be used to develop behavior scores for others who may be likely to be contactable moving develop behavior scores for others who may be likely to be contactable moving forward. Data collected from online activities can be of particular value as well forward. Data collected from online activities can be of particular value as well because such activities require a relatively low threshold for citizens to take action. because such activities require a relatively low threshold for citizens to take action. For the small set of citizens who provide an email address to the campaign to receive For the small set of citizens who provide an email address to the campaign to receive campaign emails,campaign emails,33 all of their activity concerning those emails—for example, sign all of their activity concerning those emails—for example, sign up, opening emails, clicking links in emails, taking actions like signing petitions—up, opening emails, clicking links in emails, taking actions like signing petitions—can be tracked and used to predict levels of support for the candidate or focal issue, can be tracked and used to predict levels of support for the candidate or focal issue, likelihood of taking action, and in many cases the policy areas of greatest interest likelihood of taking action, and in many cases the policy areas of greatest interest (for example, imagine a voter who opens emails about taxes twice as often as any (for example, imagine a voter who opens emails about taxes twice as often as any other topic). Thus, a state party or political organization can compile valuable other topic). Thus, a state party or political organization can compile valuable information for developing predictive scores just by maintaining accurate records information for developing predictive scores just by maintaining accurate records of its interactions with citizens over time.of its interactions with citizens over time.
In short, many of the claims about the information that campaigns purchase In short, many of the claims about the information that campaigns purchase about individuals is overblown; little of the information that is most useful about individuals is overblown; little of the information that is most useful to campaigns is purchased. Offi cial voter fi les are public records, census and to campaigns is purchased. Offi cial voter fi les are public records, census and precinct-level information are also freely available, and individual citizens them-precinct-level information are also freely available, and individual citizens them-selves volunteer a wealth of data that can be used to develop scores that predict selves volunteer a wealth of data that can be used to develop scores that predict all citizens’ behaviors and preferences. In fact, predictive scores can often allow all citizens’ behaviors and preferences. In fact, predictive scores can often allow campaigns to estimate some citizen preferences and behaviors more accurately campaigns to estimate some citizen preferences and behaviors more accurately
3 In 2012, the Obama campaign had email addresses for 20 million supporters (Haberman 2013) compared with 13 million for the Obama campaign in 2008 and the three million addresses collected by the 2004 Kerry campaign (Vargas 2008).
58 Journal of Economic Perspectives
than direct reports from citizens themselves (Rogers and Aida 2013; Ansolabehere than direct reports from citizens themselves (Rogers and Aida 2013; Ansolabehere and Hersh 2012). People may not be actively misrepresenting their intentions, but and Hersh 2012). People may not be actively misrepresenting their intentions, but the desire to project a positive image of the self may lead voters to overestimate the the desire to project a positive image of the self may lead voters to overestimate the degree to which they will participate in a given election. Again, the most important degree to which they will participate in a given election. Again, the most important piece of information campaigns purchase tends to be phone numbers—and this is piece of information campaigns purchase tends to be phone numbers—and this is purchased with the intent of performing the old-fashioned task of calling citizens purchased with the intent of performing the old-fashioned task of calling citizens directly. Because the most useful information tends to be collected directly from directly. Because the most useful information tends to be collected directly from citizens, one of the most valuable data acquisition activities in which campaigns citizens, one of the most valuable data acquisition activities in which campaigns engage is exchanging their information with that of other allied political organiza-engage is exchanging their information with that of other allied political organiza-tions (when legal) to increase the breadth and scope of data that will be useful for tions (when legal) to increase the breadth and scope of data that will be useful for the development of predictive scores.the development of predictive scores.
An interesting result of the type of data that campaigns acquire directly from An interesting result of the type of data that campaigns acquire directly from citizens is that campaigns are able to predict with greater accuracy which citizens will citizens is that campaigns are able to predict with greater accuracy which citizens will support their candidates and issues better than which citizens will their candidates and issues better than which citizens will oppose their candi- their candi-dates or issues. Information regarding citizens who donate, volunteer, and subscribe dates or issues. Information regarding citizens who donate, volunteer, and subscribe to email lists is available to campaigns and can be used to predict which other citizens to email lists is available to campaigns and can be used to predict which other citizens will be similar. In contrast, citizens who do not perform such behaviors at all, or who will be similar. In contrast, citizens who do not perform such behaviors at all, or who perform similar behaviors for opposing campaigns, cannot be directly observed, so perform similar behaviors for opposing campaigns, cannot be directly observed, so discriminating among the citizens who do not actively support a campaign is a much discriminating among the citizens who do not actively support a campaign is a much more challenging task. As a result the distribution of support scores typically have more challenging task. As a result the distribution of support scores typically have two to three times more voters with the highest scores (99 and 100) than the lowest two to three times more voters with the highest scores (99 and 100) than the lowest (0 and 1). This imbalance does not imply that the opposition enjoys less passionate (0 and 1). This imbalance does not imply that the opposition enjoys less passionate support or that the data analysts failed in their predictive task; it is a natural result support or that the data analysts failed in their predictive task; it is a natural result of being able to observe the activity of only one campaign’s supporters in an elec-of being able to observe the activity of only one campaign’s supporters in an elec-toral competition. Similarly, because the foundations of voter databases are offi cial toral competition. Similarly, because the foundations of voter databases are offi cial voter fi les from states, campaigns tend to have much more information on citizens voter fi les from states, campaigns tend to have much more information on citizens who have voted and are registered than citizens who have never voted and are not who have voted and are registered than citizens who have never voted and are not registered. Predictive models can still be constructed to predict fruitful geographies registered. Predictive models can still be constructed to predict fruitful geographies or people to target for registration drives, but the data available are much sparser or people to target for registration drives, but the data available are much sparser and the models necessarily more coarse. This likely exacerbates the inequality in and the models necessarily more coarse. This likely exacerbates the inequality in campaign communication and outreach between those who are already politically campaign communication and outreach between those who are already politically engaged and those who are not, and between voters and nonvoters (Rogers and engaged and those who are not, and between voters and nonvoters (Rogers and Aida 2013).Aida 2013).
How Do Campaigns Analyze Data to Develop Predictive Scores?
The predictive scores campaigns construct can be roughly divided into two The predictive scores campaigns construct can be roughly divided into two types. The fi rst predicts the behavior or attitudes of voters (that is, behavior scores or types. The fi rst predicts the behavior or attitudes of voters (that is, behavior scores or support scores). These models do not make any causal claim about why these indi-support scores). These models do not make any causal claim about why these indi-viduals vote or donate or support the candidate; they merely predict the focal trait. viduals vote or donate or support the candidate; they merely predict the focal trait. As such, causation is not a major concern, and the goal of the analyst is primarily to As such, causation is not a major concern, and the goal of the analyst is primarily to avoid overfi tting the data. The second type of score predicts how voters will respond avoid overfi tting the data. The second type of score predicts how voters will respond to campaign outreach (that is, responsiveness scores). These responsiveness scores to campaign outreach (that is, responsiveness scores). These responsiveness scores
Political Campaigns and Big Data 59
typically come from exploring heterogeneous reactions to campaign treatments in typically come from exploring heterogeneous reactions to campaign treatments in randomized fi eld experiments. The causal effect of the campaign outreach is estab-randomized fi eld experiments. The causal effect of the campaign outreach is estab-lished by the experiment and these estimated effects are used as parameters for lished by the experiment and these estimated effects are used as parameters for strategic decisionmaking. However, the moderators predicting strongly positive or strategic decisionmaking. However, the moderators predicting strongly positive or weakly positive (or even negative) responsiveness to the treatment are not causal. In weakly positive (or even negative) responsiveness to the treatment are not causal. In other words, the data may have been generated by an experiment, but the enterprise other words, the data may have been generated by an experiment, but the enterprise of modeling responsiveness to the treatment remains a matter of fi nding observed of modeling responsiveness to the treatment remains a matter of fi nding observed differences across types of subjects that predict large or small treatment effects. For differences across types of subjects that predict large or small treatment effects. For instance, a campaign data analyst may discover that women are more responsive instance, a campaign data analyst may discover that women are more responsive to a treatment than men, but since gender was not randomly manipulated by the to a treatment than men, but since gender was not randomly manipulated by the campaign it is impossible to know that gender campaign it is impossible to know that gender caused the differential response to the differential response to treatment. The campaign data analyst only knows that gender is treatment. The campaign data analyst only knows that gender is correlated with treat-with treat-ment responsiveness. Thus, even the search for moderators of the treatment effect ment responsiveness. Thus, even the search for moderators of the treatment effect in an experiment is essentially observational in nature.in an experiment is essentially observational in nature.
Most of the analytic techniques employed by campaign data analysts are taught Most of the analytic techniques employed by campaign data analysts are taught in standard undergraduate econometrics or statistics classes. Currently, the vast in standard undergraduate econometrics or statistics classes. Currently, the vast majority of the predictive scores used by campaigns are created by a campaign majority of the predictive scores used by campaigns are created by a campaign data analyst (or a team of them) using simple regression techniques: ordinary data analyst (or a team of them) using simple regression techniques: ordinary least squares for continuous outcomes; logistic regression for binary outcomes; least squares for continuous outcomes; logistic regression for binary outcomes; and, rarely, tobit for truncated data like dollars donated or hours volunteered. The and, rarely, tobit for truncated data like dollars donated or hours volunteered. The skills necessary for developing such models are widespread, and the models can skills necessary for developing such models are widespread, and the models can easily be customized to specifi c political environments. For instance, party registra-easily be customized to specifi c political environments. For instance, party registra-tion is not predictive of candidate preference for older citizens in many Southern tion is not predictive of candidate preference for older citizens in many Southern states—because the South was historically solidly Democratic and remained so at states—because the South was historically solidly Democratic and remained so at the state level well after the civil rights movement transformed the national political the state level well after the civil rights movement transformed the national political environment—but campaign data analysts attuned to contextual facts like this can environment—but campaign data analysts attuned to contextual facts like this can accommodate them in regression analyses.accommodate them in regression analyses.
There are two major downsides to using regression techniques for constructing There are two major downsides to using regression techniques for constructing campaign models. First, the utility of techniques that uncover correlations is highly campaign models. First, the utility of techniques that uncover correlations is highly dependent on the talent of the particular campaign data analyst employing them. dependent on the talent of the particular campaign data analyst employing them. A capable campaign data analyst who is familiar with the properties of the vari-A capable campaign data analyst who is familiar with the properties of the vari-ables available in voter databases can generate highly accurate predictive scores ables available in voter databases can generate highly accurate predictive scores for citizens. However, a slightly less-capable campaign data analyst might generate for citizens. However, a slightly less-capable campaign data analyst might generate predictive scores that are only slightly better than the unsophisticated methods predictive scores that are only slightly better than the unsophisticated methods employed by earlier campaigns. As an example, consider the task of predicting a employed by earlier campaigns. As an example, consider the task of predicting a person’s likelihood of voting in an election. Controlling for the whole set of turnout person’s likelihood of voting in an election. Controlling for the whole set of turnout history available (often more than 50 elections) will typically predict around history available (often more than 50 elections) will typically predict around one-third more variance in individual turnout than the old “of 4” rule of thumb one-third more variance in individual turnout than the old “of 4” rule of thumb (that is, did the person vote in 0, 1, 2, 3, or 4 of the past elections). However, these (that is, did the person vote in 0, 1, 2, 3, or 4 of the past elections). However, these variables all tap into a common latent propensity to vote and exhibit considerable variables all tap into a common latent propensity to vote and exhibit considerable collinearity. As a result, the coeffi cient for several of these variables will be nega-collinearity. As a result, the coeffi cient for several of these variables will be nega-tive and statistically signifi cant. There is no theoretical rationale for why turnout tive and statistically signifi cant. There is no theoretical rationale for why turnout in one election would decrease turnout in a future election, so observing negative in one election would decrease turnout in a future election, so observing negative coeffi cients would suggest that the analyst has overfi tted the data and should pare coeffi cients would suggest that the analyst has overfi tted the data and should pare
60 Journal of Economic Perspectives
back the number of variables used or model the propensity for turnout differently. back the number of variables used or model the propensity for turnout differently. Experienced analysts also construct relevant variables (for example, past turnout Experienced analysts also construct relevant variables (for example, past turnout among people in the household) and insert theoretically informed interactions (for among people in the household) and insert theoretically informed interactions (for example, ethnicity of the voter by ethnicity of the candidate) to improve model fi t. example, ethnicity of the voter by ethnicity of the candidate) to improve model fi t. The marginal gains from these new variables are rarely as large as the initial gains The marginal gains from these new variables are rarely as large as the initial gains from using a wide range of past turnout decisions, but that is to be expected—the from using a wide range of past turnout decisions, but that is to be expected—the gains from good predictive models are incremental. Since the people running gains from good predictive models are incremental. Since the people running campaigns rarely have experience or expertise in data analytics, the competence of campaigns rarely have experience or expertise in data analytics, the competence of the campaign data analysts they employ cannot be taken for granted.the campaign data analysts they employ cannot be taken for granted.
The second drawback to using regression techniques in campaign models is The second drawback to using regression techniques in campaign models is that unique regression models typically need to be constructed for different regions, that unique regression models typically need to be constructed for different regions, issues, and candidates, so the “modeling by hand” approach to analysis offers few issues, and candidates, so the “modeling by hand” approach to analysis offers few economies of scale. While individual campaign data analysts likely become more economies of scale. While individual campaign data analysts likely become more effi cient with each successive model they develop, constructing models for multiple effi cient with each successive model they develop, constructing models for multiple races around the country requires either a small army of campaign data analysts, or races around the country requires either a small army of campaign data analysts, or else settling for very general national models that are not adapted for local contexts. else settling for very general national models that are not adapted for local contexts.
Thus, campaign data analysts have been seeking more systematic methods for Thus, campaign data analysts have been seeking more systematic methods for selecting a preferred regression. The commercial marketing industry often uses a selecting a preferred regression. The commercial marketing industry often uses a form of “machine learning” (for example, form of “machine learning” (for example, k-means clustering or -means clustering or k-nearest neighbor -nearest neighbor classifi ers; see Gan, Ma, and Wu 2007) to divide consumers into categorical types like classifi ers; see Gan, Ma, and Wu 2007) to divide consumers into categorical types like “blue collar, grilling, SUV owner.” However, these statistical methods to group similar “blue collar, grilling, SUV owner.” However, these statistical methods to group similar individuals or households are less useful for campaign data analysts because strategic individuals or households are less useful for campaign data analysts because strategic cost–benefi t decisions in campaign planning are based on individual-specifi c cost–benefi t decisions in campaign planning are based on individual-specifi c probabilities for particular outcomes, and knowing that a set of citizens are similar probabilities for particular outcomes, and knowing that a set of citizens are similar in many dimensions does not assist with targeting if those dimensions are not highly in many dimensions does not assist with targeting if those dimensions are not highly correlated with behaviors like voting, ideology, and propensity to donate. For this correlated with behaviors like voting, ideology, and propensity to donate. For this reason, reason, supervised learning algorithms are typically more appropriate for the task of algorithms are typically more appropriate for the task of modeling political data.modeling political data.
Supervised machine learning includes methods such as classifi cation and Supervised machine learning includes methods such as classifi cation and regression trees (Breiman, Friedman, Stone, and Olshen 1984).regression trees (Breiman, Friedman, Stone, and Olshen 1984). In a regression In a regression tree approach, the algorithm grows a “forest” by drawing a series of samples from tree approach, the algorithm grows a “forest” by drawing a series of samples from existing data; it divides the sample based on where the parameters best discriminate existing data; it divides the sample based on where the parameters best discriminate on the outcome of interest; it then looks at how regressions based on those divisions on the outcome of interest; it then looks at how regressions based on those divisions would predict the rest of the sample and iterates to a preferred fi t. The researcher would predict the rest of the sample and iterates to a preferred fi t. The researcher chooses the number of “trees”—that is, how many times the data will be divided. In chooses the number of “trees”—that is, how many times the data will be divided. In the particularly popular “random forests” algorithm for implementing a regression the particularly popular “random forests” algorithm for implementing a regression tree (Breiman 2001), the algorithm uses only a randomly drawn subset of variables tree (Breiman 2001), the algorithm uses only a randomly drawn subset of variables in each tree to decide on the fi t rather than the entire set of available variables. in each tree to decide on the fi t rather than the entire set of available variables. The payoff for this approach is that it generates estimates of what parameters are The payoff for this approach is that it generates estimates of what parameters are most important: that is, what parameters add the most predictive power when the most important: that is, what parameters add the most predictive power when the group of other parameters is unchanged. Aside from its analytical advantages, group of other parameters is unchanged. Aside from its analytical advantages, “random trees” is a popular decision tree ensemble algorithm because it has very “random trees” is a popular decision tree ensemble algorithm because it has very few tuning parameters and is available as an few tuning parameters and is available as an R-package, so that analysts with little -package, so that analysts with little formal education in statistics can develop the models. Bayesian Additive Regression formal education in statistics can develop the models. Bayesian Additive Regression
David W. Nickerson and Todd Rogers 61
Trees have similar advantages (Chipman, George, and McCollough 2010; Green Trees have similar advantages (Chipman, George, and McCollough 2010; Green and Kern 2012).and Kern 2012).
Supervised machine learning presents three major advantages for campaign Supervised machine learning presents three major advantages for campaign data analytics. First, these classes of estimators are typically nonlinear, so commonly data analytics. First, these classes of estimators are typically nonlinear, so commonly known nonlinear relationships—such as the curvilinear relationship between age known nonlinear relationships—such as the curvilinear relationship between age and turnout (older cohorts vote at higher rates than younger cohorts but this and turnout (older cohorts vote at higher rates than younger cohorts but this relationship peaks among group 60–70 years old and then reverses)—are easily relationship peaks among group 60–70 years old and then reverses)—are easily accommodated by the algorithms. Second, the approach involves less discretion accommodated by the algorithms. Second, the approach involves less discretion for the individual campaign data analyst, so the quality of the predictive scores for the individual campaign data analyst, so the quality of the predictive scores generated is not as heavily dependent on the capabilities and integrity of analysts. generated is not as heavily dependent on the capabilities and integrity of analysts. People constructing the models still need to input the most diagnostic variables People constructing the models still need to input the most diagnostic variables and set up rigorous out-of-sample tests to validate the models, but the algorithms and set up rigorous out-of-sample tests to validate the models, but the algorithms are written in advance and run identically for every citizen in the voter database. are written in advance and run identically for every citizen in the voter database. Finally, these data-mining algorithms are relatively scalable. Some techniques may Finally, these data-mining algorithms are relatively scalable. Some techniques may be computationally intensive and the variables included may need to be custom-be computationally intensive and the variables included may need to be custom-ized, but generally the marginal cost of constructing additional models is lower ized, but generally the marginal cost of constructing additional models is lower using these algorithms than having a campaign data analyst construct new models using these algorithms than having a campaign data analyst construct new models from similar databases by building a series of regressions from the ground up.from similar databases by building a series of regressions from the ground up.
The major downside of these regression tree algorithms from the campaign’s The major downside of these regression tree algorithms from the campaign’s perspective is that their use is relatively new and not widespread, and it will take perspective is that their use is relatively new and not widespread, and it will take experience to see how to trim the regression trees and customize the tuning param-experience to see how to trim the regression trees and customize the tuning param-eters in a way that satisfi es political requirements. Campaign data analysts must also eters in a way that satisfi es political requirements. Campaign data analysts must also take great care to not overfi t their models to their data (Dietterich 1995), in which take great care to not overfi t their models to their data (Dietterich 1995), in which case the results become less likely to apply outside the model. Typically, there will case the results become less likely to apply outside the model. Typically, there will not be suffi cient data from any single jurisdiction to create a unique model, so the not be suffi cient data from any single jurisdiction to create a unique model, so the data from several jurisdictions will need to be pooled to produce useful predic-data from several jurisdictions will need to be pooled to produce useful predic-tive scores. Most algorithms can be adapted to accommodate jurisdiction-specifi c tive scores. Most algorithms can be adapted to accommodate jurisdiction-specifi c political requirements, but only a small fraction of campaign data analysts today political requirements, but only a small fraction of campaign data analysts today have the necessary skill set. In sum, as campaign data analytics becomes more have the necessary skill set. In sum, as campaign data analytics becomes more common, sophisticated, and mature, it will likely move away from judgment-based common, sophisticated, and mature, it will likely move away from judgment-based regressions to regressions based on customized machine learning algorithms like regressions to regressions based on customized machine learning algorithms like regression trees.regression trees.
How Are Predictive Scores Used?
Campaigns use predictive scores to increase the effi ciency of efforts to commu-Campaigns use predictive scores to increase the effi ciency of efforts to commu-nicate with citizens. For example, professional fundraising phone banks typically nicate with citizens. For example, professional fundraising phone banks typically charge $4 per completed call (often defi ned as reaching someone and getting charge $4 per completed call (often defi ned as reaching someone and getting through the entire script), regardless of how much is donated in the end. Suppose a through the entire script), regardless of how much is donated in the end. Suppose a campaign does not use predictive scores and fi nds that upon completion of the call campaign does not use predictive scores and fi nds that upon completion of the call 60 percent give nothing, 20 percent give $10, 10 percent give $20, and 10 percent 60 percent give nothing, 20 percent give $10, 10 percent give $20, and 10 percent give $60. This works out to an average of $10 per completed call. Now assume the give $60. This works out to an average of $10 per completed call. Now assume the campaign sampled a diverse pool of citizens for a wave of initial calls. It can then look campaign sampled a diverse pool of citizens for a wave of initial calls. It can then look
62 Journal of Economic Perspectives
through the voter database that includes all citizens it solicited for donations and all through the voter database that includes all citizens it solicited for donations and all the donations it actually generated, along with other variables in the database such the donations it actually generated, along with other variables in the database such as past donation behavior, past volunteer activity, candidate support score, predicted as past donation behavior, past volunteer activity, candidate support score, predicted household wealth, and Census-based neighborhood characteristics (Tam Cho and household wealth, and Census-based neighborhood characteristics (Tam Cho and Gimpel 2007). It can then develop a fundraising behavior score that predicts the Gimpel 2007). It can then develop a fundraising behavior score that predicts the expected return for a call to a particular citizen. These scores are probabilistic, and expected return for a call to a particular citizen. These scores are probabilistic, and of course it would be impossible to only call citizens who would donate $60, but of course it would be impossible to only call citizens who would donate $60, but large gains can quickly be realized. For instance, if a fundraising score eliminated large gains can quickly be realized. For instance, if a fundraising score eliminated half of the calls to citizens who would donate nothing, so that the resulting distribu-half of the calls to citizens who would donate nothing, so that the resulting distribu-tion would be 30 percent donate $0, 35 percent donate $10, 17.5 percent donate tion would be 30 percent donate $0, 35 percent donate $10, 17.5 percent donate $20, and 17.5 percent donate $60, then the expected revenue from each call would $20, and 17.5 percent donate $60, then the expected revenue from each call would increase from $10 to $17.50. Fundraising scores that increase the proportion of big increase from $10 to $17.50. Fundraising scores that increase the proportion of big donor prospects relative to small donor prospects would further improve on these donor prospects relative to small donor prospects would further improve on these effi ciency gains.effi ciency gains.
The same logic can be applied to target expenditures for voter mobilization and The same logic can be applied to target expenditures for voter mobilization and persuasive communications. Targeting persuasive communications to citizens who are persuasive communications. Targeting persuasive communications to citizens who are extremely unlikely to vote is ineffi cient. Even if the persuasive communication were extremely unlikely to vote is ineffi cient. Even if the persuasive communication were effective at convincing these citizens to support the campaign’s candidate or issue, effective at convincing these citizens to support the campaign’s candidate or issue, the usual assumption among practitioners is that changing citizens’ candidate or issue the usual assumption among practitioners is that changing citizens’ candidate or issue preferences does not meaningfully change their likelihood of voting. A similar logic preferences does not meaningfully change their likelihood of voting. A similar logic could be applied to citizens who are already extremely likely to support a campaign’s could be applied to citizens who are already extremely likely to support a campaign’s candidate or issue. If the support score predicts that a citizen is 98 percent likely candidate or issue. If the support score predicts that a citizen is 98 percent likely to support a campaign’s candidate or issue, and assuming the opposing campaign’s to support a campaign’s candidate or issue, and assuming the opposing campaign’s activities will not meaningfully undermine this citizen’s support likelihood, one might activities will not meaningfully undermine this citizen’s support likelihood, one might decide that persuasive communications would be better targeted to citizens who have decide that persuasive communications would be better targeted to citizens who have a moderate or low likelihood of supporting the campaign’s candidate or issue, along a moderate or low likelihood of supporting the campaign’s candidate or issue, along with a high likelihood of voting. Relying on turnout scores and support scores to with a high likelihood of voting. Relying on turnout scores and support scores to target persuasion efforts in this manner represents an increase in effi ciency, just as target persuasion efforts in this manner represents an increase in effi ciency, just as fundraising scores improve the cost effectiveness of fundraising calls.fundraising scores improve the cost effectiveness of fundraising calls.
The value of using predictive scores for targeting has become widely recog-The value of using predictive scores for targeting has become widely recog-nized by campaigns during the past fi ve years. Sophisticated use of these predictive nized by campaigns during the past fi ve years. Sophisticated use of these predictive scores allows campaigns to simultaneously broaden the populations targeted while scores allows campaigns to simultaneously broaden the populations targeted while pruning away groups they believe will be cost ineffective.pruning away groups they believe will be cost ineffective.
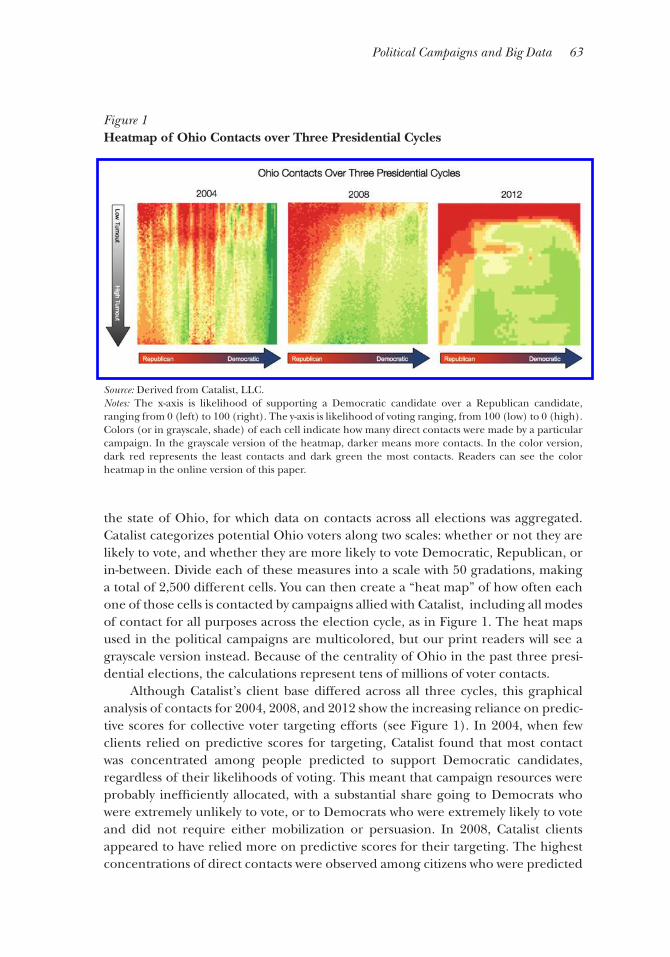
Catalist, LLC, is a political data vendor that compiles and maintains nation-Catalist, LLC, is a political data vendor that compiles and maintains nation-wide registration, demographic, and other political data for progressive, civic, wide registration, demographic, and other political data for progressive, civic, and nonprofi t organizations such as labor unions, political candidates, and other and nonprofi t organizations such as labor unions, political candidates, and other advocacy groups. They build predictive scores using this data to help their clients advocacy groups. They build predictive scores using this data to help their clients analyze the electorate and target their activities more effi ciently. The fi rm provided analyze the electorate and target their activities more effi ciently. The fi rm provided an aggregated data visualization for showing how its targeting of populations for its an aggregated data visualization for showing how its targeting of populations for its clients evolved over the last three presidential elections in Ohio (Ansolabehere and clients evolved over the last three presidential elections in Ohio (Ansolabehere and Hersh 2010). The discussion that follows references analyses of data aggregations Hersh 2010). The discussion that follows references analyses of data aggregations that include the activities of independent groups as well as the activities of the Kerry that include the activities of independent groups as well as the activities of the Kerry campaign in 2004, the Obama campaign in 2008, and Ohio candidates in 2012 campaign in 2004, the Obama campaign in 2008, and Ohio candidates in 2012 other than Obama. In each election, Catalist had several hundred clients across other than Obama. In each election, Catalist had several hundred clients across
Political Campaigns and Big Data 63
the state of Ohio, for which data on contacts across all elections was aggregated. the state of Ohio, for which data on contacts across all elections was aggregated. Catalist categorizes potential Ohio voters along two scales: whether or not they are Catalist categorizes potential Ohio voters along two scales: whether or not they are likely to vote, and whether they are more likely to vote Democratic, Republican, or likely to vote, and whether they are more likely to vote Democratic, Republican, or in-between. Divide each of these measures into a scale with 50 gradations, making in-between. Divide each of these measures into a scale with 50 gradations, making a total of 2,500 different cells. You can then create a “heat map” of how often each a total of 2,500 different cells. You can then create a “heat map” of how often each one of those cells is contacted by campaigns allied with Catalist, including all modes one of those cells is contacted by campaigns allied with Catalist, including all modes of contact for all purposes across the election cycle, as in Figure 1. The heat maps of contact for all purposes across the election cycle, as in Figure 1. The heat maps used in the political campaigns are multicolored, but our print readers will see a used in the political campaigns are multicolored, but our print readers will see a grayscale version instead. Because of the centrality of Ohio in the past three presi-grayscale version instead. Because of the centrality of Ohio in the past three presi-dential elections, the calculations represent tens of millions of voter contacts.dential elections, the calculations represent tens of millions of voter contacts.
Although Catalist’s client base differed across all three cycles, this graphical Although Catalist’s client base differed across all three cycles, this graphical analysis of contacts for 2004, 2008, and 2012 show the increasing reliance on predic-analysis of contacts for 2004, 2008, and 2012 show the increasing reliance on predic-tive scores for collective voter targeting efforts (see Figure 1). In 2004, when few tive scores for collective voter targeting efforts (see Figure 1). In 2004, when few clients relied on predictive scores for targeting, Catalist found that most contact clients relied on predictive scores for targeting, Catalist found that most contact was concentrated among people predicted to support Democratic candidates, was concentrated among people predicted to support Democratic candidates, regardless of their likelihoods of voting. This meant that campaign resources were regardless of their likelihoods of voting. This meant that campaign resources were probably ineffi ciently allocated, with a substantial share going to Democrats who probably ineffi ciently allocated, with a substantial share going to Democrats who were extremely unlikely to vote, or to Democrats who were extremely likely to vote were extremely unlikely to vote, or to Democrats who were extremely likely to vote and did not require either mobilization or persuasion. In 2008, Catalist clients and did not require either mobilization or persuasion. In 2008, Catalist clients appeared to have relied more on predictive scores for their targeting. The highest appeared to have relied more on predictive scores for their targeting. The highest concentrations of direct contacts were observed among citizens who were predicted concentrations of direct contacts were observed among citizens who were predicted
Figure 1Heatmap of Ohio Contacts over Three Presidential Cycles
Source: Derived from Catalist, LLC.Notes: The x-axis is likelihood of supporting a Democratic candidate over a Republican candidate, ranging from 0 (left) to 100 (right). The y-axis is likelihood of voting ranging, from 100 (low) to 0 (high). Colors (or in grayscale, shade) of each cell indicate how many direct contacts were made by a particular campaign. In the grayscale version of the heatmap, darker means more contacts. In the color version, dark red represents the least contacts and dark green the most contacts. Readers can see the color heatmap in the online version of this paper.
64 Journal of Economic Perspectives
to support Democratic candidates but who had low likelihoods of voting—that is, to support Democratic candidates but who had low likelihoods of voting—that is, those who might be reasonable targets for voter mobilization. They also targeted those who might be reasonable targets for voter mobilization. They also targeted high-turnout citizens with middling partisanship scores, who might be reasonable high-turnout citizens with middling partisanship scores, who might be reasonable targets for “persuasion.” The reasonableness of targeting in these ways depends on targets for “persuasion.” The reasonableness of targeting in these ways depends on the likelihood that voters can be moved to turn out, or be persuaded. As mentioned the likelihood that voters can be moved to turn out, or be persuaded. As mentioned above, a current practice is to develop “responsiveness scores” based on pilot experi-above, a current practice is to develop “responsiveness scores” based on pilot experi-ments to optimize targeting—particularly for persuasion outreach. As a result, the ments to optimize targeting—particularly for persuasion outreach. As a result, the targeting in 2008 appears much closer to optimal than was observed in 2004. The targeting in 2008 appears much closer to optimal than was observed in 2004. The heat map of contacts for 2012 looks much the same as that of 2008 except with heat map of contacts for 2012 looks much the same as that of 2008 except with smoother transitions and more consistency across the landscape, suggesting even smoother transitions and more consistency across the landscape, suggesting even wider adoption of predictive scores for targeting. One noticeable difference between wider adoption of predictive scores for targeting. One noticeable difference between the 2012 heat map and those of previous cycles is that Catalist clients appear to have the 2012 heat map and those of previous cycles is that Catalist clients appear to have avoided communicating with citizens with the lowest turnout probabilities. Catalist’s avoided communicating with citizens with the lowest turnout probabilities. Catalist’s clients may have chosen this strategy for a range of reasons, but regardless of their clients may have chosen this strategy for a range of reasons, but regardless of their strategic reasons, apparently Catalist’s Ohio clients in 2012 used predictive scores to strategic reasons, apparently Catalist’s Ohio clients in 2012 used predictive scores to manifest their strategic plans in ways that they had not in previous cycles.manifest their strategic plans in ways that they had not in previous cycles.
What Are Predictive Scores Worth?
Campaign organizations have adopted predictive scores, which suggests that Campaign organizations have adopted predictive scores, which suggests that they are electorally useful. They use these scores to target nearly every aspect of they are electorally useful. They use these scores to target nearly every aspect of campaign outreach: door-to-door canvassing; direct mail; phone calls; email; televi-campaign outreach: door-to-door canvassing; direct mail; phone calls; email; televi-sion ad placement; social media outreach (like Facebook and Twitter); and even sion ad placement; social media outreach (like Facebook and Twitter); and even web page display. Determining exactly how much using these scores affects elec-web page display. Determining exactly how much using these scores affects elec-toral outcomes is diffi cult because the counterfactual is unclear. Is the appropriate toral outcomes is diffi cult because the counterfactual is unclear. Is the appropriate comparison for assessing the value of campaign analytics to contrast the current uses comparison for assessing the value of campaign analytics to contrast the current uses of predictive scores for targeting with a complete absence of targeting? Or would it of predictive scores for targeting with a complete absence of targeting? Or would it be to compare current uses to the basic heuristics that were used for targeting in the be to compare current uses to the basic heuristics that were used for targeting in the relatively recent past? Whatever the specifi c choice, it is possible to derive bounds as relatively recent past? Whatever the specifi c choice, it is possible to derive bounds as to how much campaign analytics could matter to campaigns.to how much campaign analytics could matter to campaigns.
Persuasive communications is a good place to begin because targeting is so Persuasive communications is a good place to begin because targeting is so diffuse. There are so many possible targets, including potentially all citizens, and diffuse. There are so many possible targets, including potentially all citizens, and so many strategies, from shoring up support to causing opposition supporters to so many strategies, from shoring up support to causing opposition supporters to defect. Thus, persuasive campaign outreach can be directed almost anywhere along defect. Thus, persuasive campaign outreach can be directed almost anywhere along the support score spectrum from hard-core supporters to hard-core opponents. the support score spectrum from hard-core supporters to hard-core opponents. Many campaigns use responsiveness scores as part of targeting their persuasive Many campaigns use responsiveness scores as part of targeting their persuasive communications (Issenberg 2012a, b, c). Suppose a campaign’s persuasive com-communications (Issenberg 2012a, b, c). Suppose a campaign’s persuasive com-munications has an average treatment effect of 2 percentage points—a number munications has an average treatment effect of 2 percentage points—a number on the high end of persuasion effects observed in high-expense campaigns: that on the high end of persuasion effects observed in high-expense campaigns: that is, if half of citizens who vote already planned to vote for the candidate, 52 percent is, if half of citizens who vote already planned to vote for the candidate, 52 percent would support the candidate after the persuasive communication. If a campaign would support the candidate after the persuasive communication. If a campaign indiscriminately attempted to persuade 8.5 million citizens—about the size of the indiscriminately attempted to persuade 8.5 million citizens—about the size of the Florida electorate—it would generate 170,000 votes under this scenario.Florida electorate—it would generate 170,000 votes under this scenario.
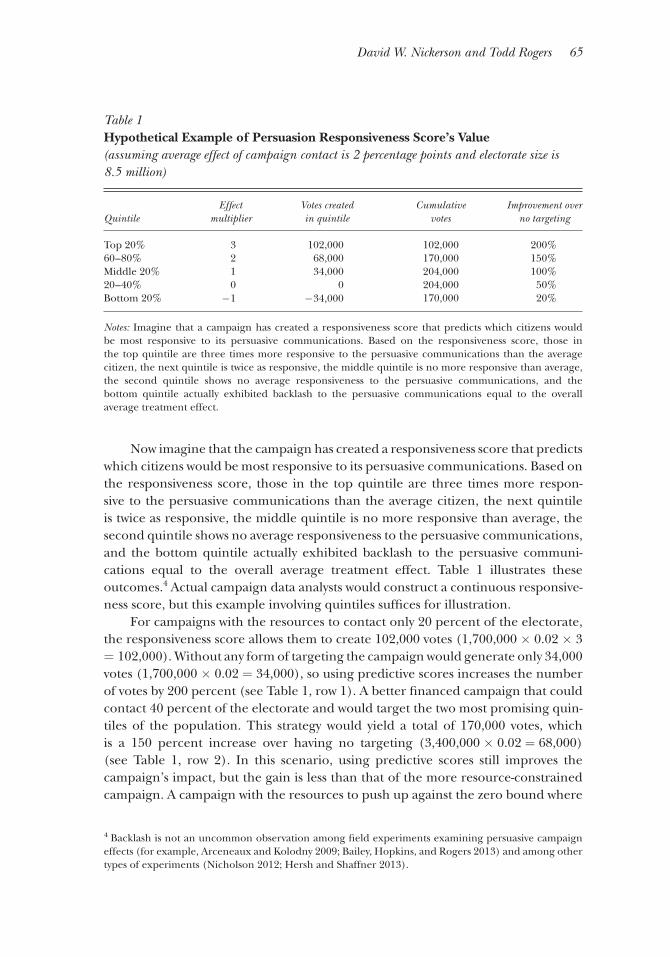
David W. Nickerson and Todd Rogers 65
Now imagine that the campaign has created a responsiveness score that predicts Now imagine that the campaign has created a responsiveness score that predicts which citizens would be most responsive to its persuasive communications. Based on which citizens would be most responsive to its persuasive communications. Based on the responsiveness score, those in the top quintile are three times more respon-the responsiveness score, those in the top quintile are three times more respon-sive to the persuasive communications than the average citizen, the next quintile sive to the persuasive communications than the average citizen, the next quintile is twice as responsive, the middle quintile is no more responsive than average, the is twice as responsive, the middle quintile is no more responsive than average, the second quintile shows no average responsiveness to the persuasive communications, second quintile shows no average responsiveness to the persuasive communications, and the bottom quintile actually exhibited backlash to the persuasive communi-and the bottom quintile actually exhibited backlash to the persuasive communi-cations equal to the overall average treatment effect. Table 1 illustrates these cations equal to the overall average treatment effect. Table 1 illustrates these outcomes.outcomes.44 Actual campaign data analysts would construct a continuous responsive- Actual campaign data analysts would construct a continuous responsive-ness score, but this example involving quintiles suffi ces for illustration.ness score, but this example involving quintiles suffi ces for illustration.
For campaigns with the resources to contact only 20 percent of the electorate, For campaigns with the resources to contact only 20 percent of the electorate, the responsiveness score allows them to create 102,000 votes (1,700,000 the responsiveness score allows them to create 102,000 votes (1,700,000 ×× 0.02 0.02 ×× 3 3 == 102,000). Without any form of targeting the campaign would generate only 34,000 102,000). Without any form of targeting the campaign would generate only 34,000 votes (1,700,000 votes (1,700,000 ×× 0.02 0.02 == 34,000), so using predictive scores increases the number 34,000), so using predictive scores increases the number of votes by 200 percent (see Table 1, row 1). A better fi nanced campaign that could of votes by 200 percent (see Table 1, row 1). A better fi nanced campaign that could contact 40 percent of the electorate and would target the two most promising quin-contact 40 percent of the electorate and would target the two most promising quin-tiles of the population. This strategy would yield a total of 170,000 votes, which tiles of the population. This strategy would yield a total of 170,000 votes, which is a 150 percent increase over having no targeting (3,400,000 is a 150 percent increase over having no targeting (3,400,000 ×× 0.02 0.02 == 68,000) 68,000) (see Table 1, row 2). In this scenario, using predictive scores still improves the (see Table 1, row 2). In this scenario, using predictive scores still improves the campaign’s impact, but the gain is less than that of the more resource-constrained campaign’s impact, but the gain is less than that of the more resource-constrained campaign. A campaign with the resources to push up against the zero bound where campaign. A campaign with the resources to push up against the zero bound where
4 Backlash is not an uncommon observation among fi eld experiments examining persuasive campaign effects (for example, Arceneaux and Kolodny 2009; Bailey, Hopkins, and Rogers 2013) and among other types of experiments (Nicholson 2012; Hersh and Shaffner 2013).
Table 1Hypothetical Example of Persuasion Responsiveness Score’s Value(assuming average effect of campaign contact is 2 percentage points and electorate size is 8.5 million)
QuintileEffect
multiplierVotes created in quintile
Cumulative votes
Improvement over no targeting
Top 20% 3 102,000 102,000 200%60 – 80% 2 68,000 170,000 150%Middle 20% 1 34,000 204,000 100%20 – 40% 0 0 204,000 50%Bottom 20% − 1 − 34,000 170,000 20%
Notes: Imagine that a campaign has created a responsiveness score that predicts which citizens would be most responsive to its persuasive communications. Based on the responsiveness score, those in the top quintile are three times more responsive to the persuasive communications than the average citizen, the next quintile is twice as responsive, the middle quintile is no more responsive than average, the second quintile shows no average responsiveness to the persuasive communications, and the bottom quintile actually exhibited backlash to the persuasive communications equal to the overall average treatment effect.
66 Journal of Economic Perspectives
additional contacts begin to cost the campaign votes would see its effi ciency improve additional contacts begin to cost the campaign votes would see its effi ciency improve by only 50 percent (see Table 1, row 4). This dynamic means that smaller campaigns by only 50 percent (see Table 1, row 4). This dynamic means that smaller campaigns will benefi t most from targeting based on predictive scores, but they are also the will benefi t most from targeting based on predictive scores, but they are also the campaigns that are least able to afford hiring campaign data analysts and voter data-campaigns that are least able to afford hiring campaign data analysts and voter data-bases. Well-fi nanced campaigns benefi t from targeting based on predictive scores, bases. Well-fi nanced campaigns benefi t from targeting based on predictive scores, but yield smaller relative gains over not using predictive scores for targeting. In but yield smaller relative gains over not using predictive scores for targeting. In this sense, given that small campaigns tend to be less reliant on data analytics, it this sense, given that small campaigns tend to be less reliant on data analytics, it appears that smaller campaigns may be underinvesting in the development and use appears that smaller campaigns may be underinvesting in the development and use of predictive scores.of predictive scores.
Again using a fairly generous multiplier regarding responsiveness scores Again using a fairly generous multiplier regarding responsiveness scores and a baseline 2 percentage point average treatment effect, we can set an upper and a baseline 2 percentage point average treatment effect, we can set an upper bound on how the use of such a score might affect campaign outcomes. If there bound on how the use of such a score might affect campaign outcomes. If there are 8.5 million citizens who will vote in a state (roughly the number of votes cast in are 8.5 million citizens who will vote in a state (roughly the number of votes cast in the 2012 presidential election in Florida), and a campaign can successfully admin-the 2012 presidential election in Florida), and a campaign can successfully admin-ister the attempted direct persuasive communications to only half the targeted ister the attempted direct persuasive communications to only half the targeted citizens because of inability to reach all citizens, then a campaign that does not citizens because of inability to reach all citizens, then a campaign that does not use responsiveness scores would generate 85,000 votes while a campaign that uses use responsiveness scores would generate 85,000 votes while a campaign that uses responsiveness scores would generate 102,000 votes through direct persuasive responsiveness scores would generate 102,000 votes through direct persuasive communications. While the difference of 17,000 votes is notable, it constitutes only communications. While the difference of 17,000 votes is notable, it constitutes only 0.2 percent of the overall vote in this jurisdiction. That said, it would have consti-0.2 percent of the overall vote in this jurisdiction. That said, it would have consti-tuted 23 percent of the 74,309 vote margin of victory for the Obama campaign in tuted 23 percent of the 74,309 vote margin of victory for the Obama campaign in Florida in 2012.Florida in 2012.
Campaigns do not want to mobilize citizens to vote who support their opponent, Campaigns do not want to mobilize citizens to vote who support their opponent, so one of the most important uses for support scores is to identify which citizens so one of the most important uses for support scores is to identify which citizens should be targeted during voter mobilization efforts. In an evenly divided elec-should be targeted during voter mobilization efforts. In an evenly divided elec-torate, indiscriminately mobilizing citizens would net zero votes—because as many torate, indiscriminately mobilizing citizens would net zero votes—because as many opponents would be mobilized as supporters. In this setting, a naïve comparison opponents would be mobilized as supporters. In this setting, a naïve comparison of data-based campaigning to absolutely no targeting is not appropriate. Instead, of data-based campaigning to absolutely no targeting is not appropriate. Instead, consider a comparison with the following relatively basic targeting strategy that is consider a comparison with the following relatively basic targeting strategy that is still employed today in electoral settings that do not have access to predictive scores. still employed today in electoral settings that do not have access to predictive scores. Imagine that a campaign attempts to identify individual citizens who support their Imagine that a campaign attempts to identify individual citizens who support their candidate or issue by directly contacting them in person or over the phone. Imagine candidate or issue by directly contacting them in person or over the phone. Imagine that this campaign can successfully reach half of the population and accurately that this campaign can successfully reach half of the population and accurately identify their candidate/issue preference. For the remaining half of the population identify their candidate/issue preference. For the remaining half of the population for whom the campaign has not identifi ed a preference, the campaign proceeds to for whom the campaign has not identifi ed a preference, the campaign proceeds to sweep through neighborhoods where more than half of the population supports sweep through neighborhoods where more than half of the population supports the campaign’s candidate, on the assumption that this approach will lead to a net the campaign’s candidate, on the assumption that this approach will lead to a net gain in votes. The only people not targeted in these sweeps are those individuals gain in votes. The only people not targeted in these sweeps are those individuals concretely identifi ed as supporters of the opponent. We can therefore express the concretely identifi ed as supporters of the opponent. We can therefore express the expected yield in votes from this targeting strategy asexpected yield in votes from this targeting strategy as
0.5β N j (%Suppor t j ) if %Suppor t j < 0.5
β N j (%Support) − 0.5β N j (%Oppose) if %Suppor t j > 0.5,
Political Campaigns and Big Data 67
where β, is the mobilization effect from the campaign, %Suppor t j is the level of support for the candidate (a number between 0 and 1) in precinct j, and N j is the number of registered voters in precinct j.
The fi rst line points out that in precincts where support for the candidate is The fi rst line points out that in precincts where support for the candidate is less than 50 percent, the only effect of this plan will be the direct contacts with less than 50 percent, the only effect of this plan will be the direct contacts with supportive voters. However, by assumption the campaign only has the ability to iden-supportive voters. However, by assumption the campaign only has the ability to iden-tify half of these people. The second line points out that in areas where support for tify half of these people. The second line points out that in areas where support for the candidate is more than 50 percent, the strategy will have two effects. The fi rst the candidate is more than 50 percent, the strategy will have two effects. The fi rst is the benefi t from mobilizing supporters in the precinct. Unfortunately, the sweep is the benefi t from mobilizing supporters in the precinct. Unfortunately, the sweep also mobilizes opponents in the proportion to which they are present (%also mobilizes opponents in the proportion to which they are present (%Oppose). ). However, the campaign managed to identify half of the people supporting the However, the campaign managed to identify half of the people supporting the opposition and can choose to avoid these individuals, so the counterproductive opposition and can choose to avoid these individuals, so the counterproductive mobilization can be cut in half.mobilization can be cut in half.
We can now contrast this targeting strategy to an imagined predicted-We can now contrast this targeting strategy to an imagined predicted-support-score strategy. It would obviously be an unfair comparison to argue that support-score strategy. It would obviously be an unfair comparison to argue that the predicted-support-score strategy worked without error, so we assume that it the predicted-support-score strategy worked without error, so we assume that it includes both false positives (misidentifying opponents as supporters) and false includes both false positives (misidentifying opponents as supporters) and false negatives (misidentifying supporters as opponents). One can think of these errors negatives (misidentifying supporters as opponents). One can think of these errors as refl ecting the political diversity of a given neighborhood. In precincts where as refl ecting the political diversity of a given neighborhood. In precincts where the vote is split 50/50, the false positive and false negative error rates are both the vote is split 50/50, the false positive and false negative error rates are both 15 percent, because these would be the precincts where it is most diffi cult to 15 percent, because these would be the precincts where it is most diffi cult to infer political beliefs. However, in this hypothetical example the error rate tapers infer political beliefs. However, in this hypothetical example the error rate tapers linearly as the precinct becomes more informative of resident beliefs, so that if a linearly as the precinct becomes more informative of resident beliefs, so that if a precinct unanimously supports one candidate or another, the error rate would precinct unanimously supports one candidate or another, the error rate would obviously be zero. The relationships below presents the formula used in this hypo-obviously be zero. The relationships below presents the formula used in this hypo-thetical model:thetical model:
β N j [%Suppor t j (0.85) − %Oppos e j (0.15)] if %Suppor t j = 0.50
β N j [ %Suppor t j ( 1 − 0.15 × %Suppor t j
_ 0.5
) − %Oppos e j × 0.15 %Oppos e j
_ 0.5
] if %Suppor t j < 0.50
β N j [ %Suppor t j ( 1 − 0.15 × ( 1 − %Suppor t j
_ 0.5
) ) − %Oppos e j × 0.15 × ( 1 − %Oppos e j _
0.5 ) ]
if %Suppor t j > 0.50.
The equations make clear one underappreciated aspect of predictive modeling; modeling can only increase the effi ciency of mobilization efforts. If the outreach from the campaign is not effective (that is, β = 0), then no votes are generated. Big data analytics may receive media attention, but its effectiveness is entirely reliant on the strength of more traditional aspects of the campaign. If a campaign
68 Journal of Economic Perspectives
does not have effective outreach to voters, then predictive analytics cannot solve that problem.
Comparing the traditional strategy of “identifi cation and sweep” to the predic-Comparing the traditional strategy of “identifi cation and sweep” to the predic-tive model, two advantages of the predictive model become clear. First, predictive tive model, two advantages of the predictive model become clear. First, predictive analytics allows the campaign to target likely supporters in otherwise unfriendly analytics allows the campaign to target likely supporters in otherwise unfriendly territory. Before accurate prediction was possible, campaigns would leave votes on territory. Before accurate prediction was possible, campaigns would leave votes on the table by ignoring supporters living in opponent strongholds. Given the expense the table by ignoring supporters living in opponent strongholds. Given the expense of actually identifying individual voter’s preferences and the relatively low yield in of actually identifying individual voter’s preferences and the relatively low yield in terms of identifying supporters, avoiding these areas was not optimal tactically, but terms of identifying supporters, avoiding these areas was not optimal tactically, but it was understandable. Second, precinct sweeps are ineffi cient because in evenly it was understandable. Second, precinct sweeps are ineffi cient because in evenly divided precincts many nonsupporters are also mobilized and thereby decrease the divided precincts many nonsupporters are also mobilized and thereby decrease the overall effectiveness of mobilization drives. Predictive scores (to the extent they are overall effectiveness of mobilization drives. Predictive scores (to the extent they are accurate) can reduce this ineffi ciency. As a result, conditional on precinct size, the accurate) can reduce this ineffi ciency. As a result, conditional on precinct size, the biggest difference between the traditional “identifi cation and sweep” tactic and biggest difference between the traditional “identifi cation and sweep” tactic and modeled scores is found in the most evenly divided precincts.modeled scores is found in the most evenly divided precincts.
Figure 2 shows the results of a thought experiment if these two tactics had been Figure 2 shows the results of a thought experiment if these two tactics had been used in Florida across all 4,354 precincts during the 2012 election. The x-axis depicts used in Florida across all 4,354 precincts during the 2012 election. The x-axis depicts the percent of votes cast in favor of President Obama in each precinct, and the the percent of votes cast in favor of President Obama in each precinct, and the left-hand y-axis shows in how many precincts President Obama received that share left-hand y-axis shows in how many precincts President Obama received that share of the vote. Thus, President Obama received between 0 and 3 percent of the vote of the vote. Thus, President Obama received between 0 and 3 percent of the vote in about 20 precincts (the left-most bar) and received between 97 and 100 percent in about 20 precincts (the left-most bar) and received between 97 and 100 percent of the vote in 140 precincts (the right-most bar). Now imagine as a hypothetical of the vote in 140 precincts (the right-most bar). Now imagine as a hypothetical example that the Obama campaign knows the distribution of its support across example that the Obama campaign knows the distribution of its support across precincts before the election and is considering two possible strategies to increase precincts before the election and is considering two possible strategies to increase its vote: the old-style “identifi cation and sweep” combination of direct contact and its vote: the old-style “identifi cation and sweep” combination of direct contact and precinct targeting, or the method using prediction scores. The solid line, measured precinct targeting, or the method using prediction scores. The solid line, measured on the right y-axis, shows the difference in the number of votes generated from on the right y-axis, shows the difference in the number of votes generated from these two approaches. The biggest difference between the two strategies takes place these two approaches. The biggest difference between the two strategies takes place in the middle of the distribution where precincts are most evenly split.in the middle of the distribution where precincts are most evenly split.55 The reason The reason for this is clear when the tails are considered. In areas where support for Obama for this is clear when the tails are considered. In areas where support for Obama was low, there were not many Obama supporters to mobilize. In the areas where was low, there were not many Obama supporters to mobilize. In the areas where support for Obama was high, there were many supporters to mobilize, but both support for Obama was high, there were many supporters to mobilize, but both targeting strategies would target these citizens and neither would mistakenly mobi-targeting strategies would target these citizens and neither would mistakenly mobi-lize those who support the opposing campaign’s candidate. It is in areas where the lize those who support the opposing campaign’s candidate. It is in areas where the precinct-level data is not predictive of which candidate the citizens support where precinct-level data is not predictive of which candidate the citizens support where predictive scores at the individual-level yield the greatest value—even given the predictive scores at the individual-level yield the greatest value—even given the inevitably higher number of false positives and false negatives in these precincts.inevitably higher number of false positives and false negatives in these precincts.
Using these assumptions, we can gain a rough sense of the impact of the Using these assumptions, we can gain a rough sense of the impact of the Obama 2012 mobilization effort in Florida using the predictive scores for Obama 2012 mobilization effort in Florida using the predictive scores for
5 If the number of registered voters were held constant across precincts, then the point of maximum difference would be at 0.5. However, the precincts where Obama received 42– 45 percent of the vote are larger than precincts with an even split, so there are more votes to be harvested just to the left of the 50/50 mark.
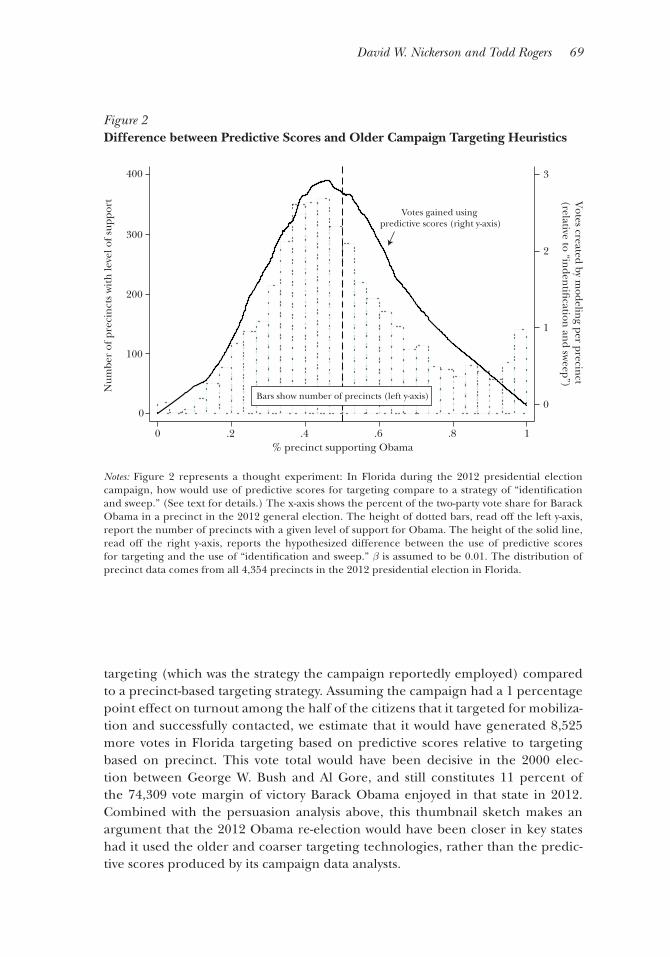
David W. Nickerson and Todd Rogers 69
targeting (which was the strategy the campaign reportedly employed) compared targeting (which was the strategy the campaign reportedly employed) compared to a precinct-based targeting strategy. Assuming the campaign had a 1 percentage to a precinct-based targeting strategy. Assuming the campaign had a 1 percentage point effect on turnout among the half of the citizens that it targeted for mobiliza-point effect on turnout among the half of the citizens that it targeted for mobiliza-tion and successfully contacted, we estimate that it would have generated 8,525 tion and successfully contacted, we estimate that it would have generated 8,525 more votes in Florida targeting based on predictive scores relative to targeting more votes in Florida targeting based on predictive scores relative to targeting based on precinct. This vote total would have been decisive in the 2000 elec-based on precinct. This vote total would have been decisive in the 2000 elec-tion between George W. Bush and Al Gore, and still constitutes 11 percent of tion between George W. Bush and Al Gore, and still constitutes 11 percent of the 74,309 vote margin of victory Barack Obama enjoyed in that state in 2012. the 74,309 vote margin of victory Barack Obama enjoyed in that state in 2012. Combined with the persuasion analysis above, this thumbnail sketch makes an Combined with the persuasion analysis above, this thumbnail sketch makes an argument that the 2012 Obama re-election would have been closer in key states argument that the 2012 Obama re-election would have been closer in key states had it used the older and coarser targeting technologies, rather than the predic-had it used the older and coarser targeting technologies, rather than the predic-tive scores produced by its campaign data analysts.tive scores produced by its campaign data analysts.
Figure 2Difference between Predictive Scores and Older Campaign Targeting Heuristics
Notes: Figure 2 represents a thought experiment: In Florida during the 2012 presidential election campaign, how would use of predictive scores for targeting compare to a strategy of “identifi cation and sweep.” (See text for details.) The x-axis shows the percent of the two-party vote share for Barack Obama in a precinct in the 2012 general election. The height of dotted bars, read off the left y-axis, report the number of precincts with a given level of support for Obama. The height of the solid line, read off the right y-axis, reports the hypothesized difference between the use of predictive scores for targeting and the use of “identifi cation and sweep.” β is assumed to be 0.01. The distribution of precinct data comes from all 4,354 precincts in the 2012 presidential election in Florida.
0
1
2
3
Votes created by m
odeling per precin
ct (relative to “in
dentifi
cation an
d sweep”)
0
100
200
300
400
Num
ber
of p
reci
nct
s w
ith
leve
l of s
uppo
rt
0 .2 .4 .6 .8 1% precinct supporting Obama
Votes gained using predictive scores (right y-axis)
Bars show number of precincts (left y-axis)
70 Journal of Economic Perspectives
Conclusion: Some Thoughts on Coordination
Sophisticated campaigns develop and use voter databases that contain a range Sophisticated campaigns develop and use voter databases that contain a range of detailed information on individual citizens. As a result, campaign data analysts of detailed information on individual citizens. As a result, campaign data analysts occupy an increasingly important role in politics. They develop predictive models occupy an increasingly important role in politics. They develop predictive models that produce individual-level scores that predict citizens’ likelihoods of performing that produce individual-level scores that predict citizens’ likelihoods of performing certain political behaviors, supporting candidates and issues, and responding to certain political behaviors, supporting candidates and issues, and responding to targeted interventions. The use of these scores has increased dramatically during targeted interventions. The use of these scores has increased dramatically during the last few election cycles. Simulations suggest that these advances could yield the last few election cycles. Simulations suggest that these advances could yield sizable and electorally meaningful gains to campaigns that harness them.sizable and electorally meaningful gains to campaigns that harness them.
Since predictive scores make campaigns more effective and effi cient by Since predictive scores make campaigns more effective and effi cient by increasing the cost effectiveness of communicating with citizens, a broad range increasing the cost effectiveness of communicating with citizens, a broad range of organizations do and will employ the technologies. To the extent that predic-of organizations do and will employ the technologies. To the extent that predic-tive scores are useful and reveal true unobserved characteristics about citizens, it tive scores are useful and reveal true unobserved characteristics about citizens, it means that multiple organizations will produce predictive scores that recommend means that multiple organizations will produce predictive scores that recommend targeting the same sets of citizens. For example, some citizens might fi nd themselves targeting the same sets of citizens. For example, some citizens might fi nd themselves contacted many times, while other citizens—like those with low turnout behavior contacted many times, while other citizens—like those with low turnout behavior scores in 2012—might be ignored by nearly every campaign. The marginal effect scores in 2012—might be ignored by nearly every campaign. The marginal effect of the fi fth or sixth contact from a campaign will be less than the marginal effect of of the fi fth or sixth contact from a campaign will be less than the marginal effect of the fi rst contact from a campaign. Thus, concentrating attention on the same set the fi rst contact from a campaign. Thus, concentrating attention on the same set of citizens due to widespread adoption of predictive scores may offset some of of citizens due to widespread adoption of predictive scores may offset some of the gains reaped from developing predictive scores in the fi rst place. In this way, the gains reaped from developing predictive scores in the fi rst place. In this way, developing and using predictive scores creates a coordination game in which allied developing and using predictive scores creates a coordination game in which allied organizations would prefer to partition the electorate and not to duplicate efforts.organizations would prefer to partition the electorate and not to duplicate efforts.
Coordination could theoretically happen between partisan organizations, like Coordination could theoretically happen between partisan organizations, like state parties, candidate campaigns, and coordinated campaigns, and across nonpar-state parties, candidate campaigns, and coordinated campaigns, and across nonpar-tisan activities, like civil rights groups, labor unions, and environmental groups. tisan activities, like civil rights groups, labor unions, and environmental groups. However, partisan and nonpartisan organizations are not allowed to coordinate However, partisan and nonpartisan organizations are not allowed to coordinate their electoral activities. Since it is nearly impossible to observe whom campaigns their electoral activities. Since it is nearly impossible to observe whom campaigns target for direct communications—that is, direct mail, knock on doors, and making target for direct communications—that is, direct mail, knock on doors, and making phone calls—this coordination game has incomplete information, which means phone calls—this coordination game has incomplete information, which means that ineffi ciencies from overlapping contacts are inevitable.that ineffi ciencies from overlapping contacts are inevitable.
Even when coordination is allowed by law, coalitions may have confl icting Even when coordination is allowed by law, coalitions may have confl icting incentives. There is enough regional variation in ideology that it is possible for local incentives. There is enough regional variation in ideology that it is possible for local candidates to appeal to citizens who oppose the national candidate. For instance, candidates to appeal to citizens who oppose the national candidate. For instance, local Republicans mobilizing citizens in liberal districts could have hurt Mitt Romney, local Republicans mobilizing citizens in liberal districts could have hurt Mitt Romney, and local Democrats mobilizing citizens in conservative districts could have hurt and local Democrats mobilizing citizens in conservative districts could have hurt Barack Obama in 2012.Barack Obama in 2012. The same dynamic plays out among nonpartisan groups The same dynamic plays out among nonpartisan groups as well. While labor union members and environmentalists agree on many policies as well. While labor union members and environmentalists agree on many policies and values, it is likely that some members do not hold that same views on both and values, it is likely that some members do not hold that same views on both labor and environmental issues. In states like West Virginia, where the local coal labor and environmental issues. In states like West Virginia, where the local coal industry is considered “dirty” by environmentalists, the groups could be working at industry is considered “dirty” by environmentalists, the groups could be working at cross-purposes, both with regards to messaging and targeting. Thus, mobilizing a cross-purposes, both with regards to messaging and targeting. Thus, mobilizing a set of citizens for a labor-related ballot initiative might result in less support for an set of citizens for a labor-related ballot initiative might result in less support for an
Political Campaigns and Big Data 71
environmentally friendly candidate. This tension is endemic to the very nature of environmentally friendly candidate. This tension is endemic to the very nature of the federal system of representation and coalition politics. The tension has always the federal system of representation and coalition politics. The tension has always been present, but now that groups can share very detailed targeting plans and been present, but now that groups can share very detailed targeting plans and support scores, the tension can and will bubble to the surface more often than in support scores, the tension can and will bubble to the surface more often than in the past.the past.
The improved capability to target individual voters offers campaigns an oppor-The improved capability to target individual voters offers campaigns an oppor-tunity to concentrate their resources where they will be most effective. This power, tunity to concentrate their resources where they will be most effective. This power, however, has not radically transformed the nature of campaign work. One could however, has not radically transformed the nature of campaign work. One could argue that the growing impact of data analytics in campaigns has amplifi ed the argue that the growing impact of data analytics in campaigns has amplifi ed the importance of traditional campaign work. Message polling (that is, polls designed importance of traditional campaign work. Message polling (that is, polls designed to gauge voter reactions to different campaign messages) no longer solely dictates to gauge voter reactions to different campaign messages) no longer solely dictates targeting, but the increased demand for information during the campaign has targeting, but the increased demand for information during the campaign has increased the amount of polling used to generate snapshots of the electorate. increased the amount of polling used to generate snapshots of the electorate. Professional phone interviews are still used for message development and tracking, Professional phone interviews are still used for message development and tracking, but they are also essential for developing predictive scores of candidate support but they are also essential for developing predictive scores of candidate support and measuring changes in voter preferences in randomized experiments. Similarly, and measuring changes in voter preferences in randomized experiments. Similarly, better targeting has made grassroots campaign tactics more effi cient and therefore better targeting has made grassroots campaign tactics more effi cient and therefore more cost competitive with mass communication forms of outreach. Volunteers more cost competitive with mass communication forms of outreach. Volunteers still need to persuade skeptical neighbors, but they are now better able to focus still need to persuade skeptical neighbors, but they are now better able to focus on persuadable neighbors and use messages more likely to resonate. This leads to on persuadable neighbors and use messages more likely to resonate. This leads to higher-quality interactions and (potentially) a more pleasant volunteer experience. higher-quality interactions and (potentially) a more pleasant volunteer experience. So while savvy campaigns will harness the power of predictive scores, the scores will So while savvy campaigns will harness the power of predictive scores, the scores will only help the campaigns that were already effective.only help the campaigns that were already effective.
References
Ansolabehere, Stephen, and Eitan Hersh. 2010. “The Quality of Voter Registration Records: A State-by-State Analysis.” Working paper, Institute for Quantitative Social Science, Harvard University.
Ansolabehere, Stephen, and Eitan Hersh. 2012. “Validation: What Big Data Reveal about Survey Misreporting and the Real Electorate.” Political Analysis 20(4): 437–59.
Arceneaux, Kevin, and Robin Kolodny. 2009. “Educating the Least Informed: Group Endorse-ments in a Grassroots Campaign.” American Journal of Political Science 53(4): 755 –70.
Arceneaux, Kevin, and David W. Nickerson. 2009. “Who is Mobilized to Vote? A Re-Analysis of 11 Randomized Field Experiments.” American Journal of Political Science 53(1): 1–16.
Arceneaux, Kevin, and David W. Nickerson.
2010. “Comparing Negative and Positive Campaign Messages: Evidence from Two Field Experiments.” American Politics Research 38(1): 54 – 83.
Bailey, Michael A., Daniel J. Hopkins, and Todd Rogers. 2013. “Unresponsive and Unpersuaded: The Unintended Consequences of Voter Persua-sion Efforts.” Available at SSRN: http://ssrn.com/abstract=2307631.
BigData-Startups. 2013. “Big Data during the Obama Campaign.” http://www.bigdata-startups.com/BigData-startup/big-data-obama-campaign/. Accessed February 18, 2014.
Breiman, Leo. 2001. “Random Forests.” Machine Learning 45(1): 5 –32.
Breiman, Leo, Jerome Friedman, Charles J. Stone, and R. A. Olshen. 1984. Classifi cation and Regression Trees. Boca Raton, FL: CRC Press.

72 Journal of Economic Perspectives
Bryan, Christopher J., Gregory M. Walton, Todd Rogers, and Carol S. Dweck. 2011. “Moti-vating Voter Turnout by Invoking the Self.” PNAS 108(31): 12653 –156.
Burt, Gabriel. 2013. “My Time at ‘Obama for America.’” Tech in Motion, August 27, 2013. http://www.techinmotionevents.com/blog/post/2013/08/27/my-time-at-obama-for-america.
Chipman, Hugh A., Edward I. George, and Robert E. McCulloch. 2010. “BART: Bayesian Addi-tive Regression Trees.” Annals of Applied Statistics 4(1): 266 – 98.
Dietterich, Tom. 1995. “Overfi tting and Under-computing in Machine Learning.” ACM Computing Surveys 27(3): 326 –27.
Duhigg, Charles. 2012. “Campaigns Mine Personal Lives to Get Out Vote.” New York Times, October 13, page A1.
Gallagher, Sean. 2012. “Built to Win: Deep inside Obama’s Campaign Tech.” Arstechnica.com, November 14, 2012. http://arstechnica.com/information-technology/2012/11/built-to-win-deep-inside-obamas-campaign-tech/.
Gan, Guojun, Chaoqun Ma, and Jianhong Wu. 2007. Data Clustering: Theory, Algorithms, and Applications. Alexandria, VA: SIAM, Society for Industrial and Applied Mathematics.
Gerber, Alan S., and Donald P. Green. 2000. “The Effects of Canvassing, Direct Mail, and Telephone Contact on Voter Turnout: A Field Experiment.” American Political Science Review 94(3): 653 – 63.
Gerber, Alan S., and Todd Rogers. 2009. “Descriptive Social Norms and Motivation to Vote: Everybody’s Voting and So Should You.” Journal of Politics 71(1): 1–14.
Green, Donald, and Alan S. Gerber. 2008. Get Out the Vote! How to Increase Voter Turnout. Washington, DC: Brookings Institution Press.
Green, Donald P., and Holger L. Kern. 2012. “Modeling Heterogeneous Treatment Effects in Survey Experiments with Bayesian Additive Regres-sion Trees.” Public Opinion Quarterly 76(3): 491–511.
Haberman, Maggie. 2013. “Obama ’12 Vets to Share Some, Not All, Data.” Politico, November 20, 2013. http://www.politico.com/story/2013/11/barack-obama-2012-campaign-data-100133.html.
Hersh, Eitan D., and Brian F. Schaffner. 2013. “Targeted Campaign Appeals and the Value of Ambiguity.” Journal of Politics 75(2): 520 –34.
Hillygus, D. Sunshine, and Todd G. Shields. 2008. The Persuadable Voter: Wedge Issues in Presiden-tial Campaigns. Princeton, NJ: Princeton University Press.
Issenberg, Sasha. 2010. “Nudge the Vote: How Behavioral Science is Remaking Politics.” New York Times Sunday Magazine, October 31, page MM28.
Issenberg, Sasha. 2012a. The Victory Lab: The Secret Science of Winning Campaigns. New York, NY: Crown Publishers.
Issenberg, Sasha. 2012b. “The Death of the Hunch.” Slate, May 22. http://www.slate.com/articles/news_and_politics/victory_lab/2012/05/obama_campaign_ads_how_the_analyst_institute_is_helping_him_hone_his_message_.html.
Issenberg, Sasha. 2012c. “How President Obama’s Campaign Used Big Data to Rally Individual Voters, Part 2.” MIT Technology Review, December 17. http://www.technologyreview.com/featuredstory/508851/how-obama-wrangled- data-to-win-his-second-term/.
Kuhn, David Paul. 2004. “Vacation Politics.” CBSNews.com, December 5, 2007. http://www.cbsnews.com/2100-250_162-607234.html.
Madrigal, Alexis C. 2012. “When the Nerds Go Marching In.” TheAtlantic.com, November 16. http://www.theatlantic.com/technology/archive/2012/11/when-the-nerds-go-marching-in/265325.
Malchow, Hal. 2003. The New Political Targeting. Washington, DC: Campaigns and Elections Magazine.
McAuliffe, Terry, with Steve Kettman. 2007. What A Party!: My Life Among Democrats: Presidents, Candidates, Donors, Activists, Alligators, and Other Wild Animals. New York, NY: St. Martin’s Press.
Nicholson, Steven P. 2012. “Polarizing Cues.” American Journal of Political Science 56(1): 52– 66.
Nickerson, David W. 2005. “Partisan Mobiliza-tion Using Volunteer Phone Banks and Door Hangers.” Annals of the American Academy of Political and Social Science 601:10–27.
Nickerson, David W. 2006a. “Hunting the Elusive Young Voter.” Journal of Political Marketing 5(3): 47– 69.
Nickerson, David W. 2006b. “Volunteer Phone Calls Can Increase Turnout: Evidence from Eight Field Experiments.” American Politics Research 34(3): 271– 92.
Nickerson, David W. 2007a. “Quality is Job One: Professional and Volunteer Mobilization Calls.” American Journal of Political Science 51(2): 269 –82.
Nickerson, David W. 2007b. “Don’t Talk to Strangers: Experimental Evidence of the Need for Targeting.” Paper presented at the Annual Meeting of the Midwest Political Science Associa-tion, Chicago, IL, April 12–15.
Nickerson, David W., Ryan F. Friedrichs, and David C. King. 2006. “Partisan Mobilization Campaigns in the Field: Results from a Statewide Turnout Experiment in Michigan.” Political Research Quarterly 59(1): 85 –97.
Nickerson, David, and Todd Rogers. 2010. “Do You Have a Voting Plan?: Implementation

David W. Nickerson and Todd Rogers 73
Intentions, Voter Turnout, and Organic Plan Making.” Psychological Science 21(2): 194 – 99.
Rogers, Todd, and Masa Aida. 2013. “Vote Self-Prediction Hardly Predicts Who Will Vote, And Is (Misleadingly) Unbiased.” American Politics Research, published online before print, September 5.
Rogers, Todd, and David W. Nickerson. 2013. “Can Inaccurate Beliefs about Incumbents Be Changed? And Can Reframing Change Votes?” HKS Faculty Research Working Paper Series, RWP13-018.
Scherer, Michael. 2012. “Inside the Secret World of Quants and Data Crunchers Who Helped Obama Win.” Time, November 19, p. 56 – 60.
Tam Cho, Wendy K., and James G. Gimpel. 2007. “Prospecting for (Campaign) Gold.” American Journal of Political Science 51(2): 255 – 68.
Vargas, Jose Antonio. 2008. “Obama Raised Half a Billion Online.” Washingtonpost.com, November 20. http://voices.washingtonpost.com/44/2008/11/20/obama_raised_half_a_billion_on.html.

74 Journal of Economic Perspectives