Embed Size (px)
Citation preview
POMMES: A TOOL FOR
QUANTITATIVE PROJECT MANAGEMENT
A THESIS SUBMITTED TO
THE GRADUATE SCHOOL OF INFORMATICS
OF
THE MIDDLE EAST TECHNICAL UNIVERSITY
BY
CANDAŞ BOZKURT
IN PARTIAL FULFILLMENT OF THE REQUIREMENTS FOR THE DEGREE OF
MASTER OF SCIENCE
IN
THE DEPARTMENT OF INFORMATION SYSTEMS
APRIL 2005
Approval of the Graduate School of Informatics Institute
___________________________
Assoc. Prof. Dr. Nazife BAYKAL
Director
I certify that this thesis satisfies all the requirements as a thesis for the degree
of Master of Science.
_____________________
Assoc. Prof. Dr. Onur DEMİRÖRS
Head of the Department
This is to certify that we have read this thesis and that in our opinion it is fully
adequate, in scope and quality, as a thesis for the degree of Master of Science.
______________________________
Assoc. Prof. Dr. Onur DEMİRÖRS
Supervisor
Examining Committee Members
Prof. Dr. Semih BİLGEN METU _______________
Assoc. Prof. Dr. Onur DEMİRÖRS METU _______________
Dr. Ali ARİFOĞLU METU _______________
Dr. Altan KOÇYİĞİT METU _______________
Prof. Dr. Nur Evin ÖZDEMİREL METU _______________

iii
I hereby declare that all information in this document has been obtained
and presented in accordance with academic rules and ethical conduct. I
also declare that, as required by these rules and conduct, I have fully cited
and referenced all material and results that are not original to this work.
Name, Surname: Candaş Bozkurt
Signature: _____________
iv
ABSTRACT
POMMES: A TOOL FOR
QUANTITATIVE PROJECT MANAGEMENT
Bozkurt, Candaş
M.S., Department of Information Systems
Supervisor: Assoc. Prof. Dr. Onur Demirörs
April 2005, Thesis 199 pages
Metric collection process and Project Management activities cannot be
performed in an integrated fashion on most of the software projects. In
software engineering world, there are Project Management Tools that has
embedded project metrics and there are various Metric Collection Tools that
collect specific metrics for satisfying requirements of different software life
cycle phase activities (Configuration Management, Requirements
Management, Application Development tools etc.). These tools however are
not communicating with each other with any interface or any common
database. This thesis focuses on the development of a tool to define, export,
v
collect and use metrics for software project planning, tracking and oversight
processes. To satisfy these objectives, POMMES with functionalities of
Generic Metric Definition, Collection, Analysis, and Import, Update and
Export of Project Metrics from 3rd Party Project Management Tools is
developed and implemented in a software organization during this thesis work.
Keywords: Quantitative Project Management, Metric, Software Project
Monitoring and Control, Goal-Question-Metric (GQM) Methodology,
POMMES
vi
ÖZ
POMMES: NİCEL PROJE YÖNETİM ARACI
Bozkurt, Candaş
Yüksek Lisans, Bilişim Sistemleri Bölümü
Tez Danışmanı: Doç. Dr. Onur Demirörs
Nisan 2005, Tez 199 sayfa
Birçok yazılım projesinde Metrik Toplama ve Proje Yönetimi süreçleri entegre
biçimde gerçekleştirilememektedir. Günümüz yazılım endüstrisinde, proje
metriklerini ürün içinde gömülü şekilde içeren Proje Yönetim Araçları ve
belirli yaşam döngüsü faz aktiviteleri (Konfigürasyon Yönetimi, Gereksinim
Yönetimi, Ürün Geliştirme araçları vb.) gereksinimlerini karşılayacak şekilde
geliştirilmiş metrik toplama araçları vardır. Fakat bu araçlar bir haberleşme
arayüzü veya ortak bir veritabanı kullanmamakta, sonuç olarak birbirleri ile
iletişim kuramamakta ve veri alışverişi yapamamaktadırlar. Bu tez, metrik
tanımlama, ihraç etme, toplama ve toplanan metrikleri kullanarak ilgili yazılım
projesinin yönetim, planlama, izleme ve kontrolünü sağlama özelliklerine sahip

vii
bir araç geliştirmek üzerine odaklanmıştır. Hedeflenen ihtiyaçları karşılamak
için, bu tez çalışması kapsamında, Dinamik Metrik Tanımlama, Metrikleri
Toplama, Analiz Etme, ve 3. Parti Araçlardan Proje Metriklerini Alma,
Güncelleme ve Geri Yollayabilme fonksiyonalitelerine sahip POMMES Aracı
geliştirilmiş ve bir yazılım organizasyonunda uygulanmıştır.
Anahtar Kelimeler: Nicel Proje Yönetimi, Metrik, Yazılım Proje Yönetim ve
Kontrolü, Amaç-Soru-Ölçüt (GQM) Yöntemi, POMMES

viii
This thesis is dedicated to my parents,
For their sacrifices,
For their support,
For their patience,
For their confidence, and
For their love…
ix
ACKNOWLEDGEMENT
I express sincere appreciation to Assoc. Prof. Dr. Onur DEMİRÖRS for
his guidance, encouragement, patience, and insight through the research. I am
grateful to Assoc. Prof. Onur DEMİRÖRS for his inspiration and confidence
throughout the study.
I am thankful to Tekin MENTEŞ, who is closer than a brother for me,
for his genius ideas, exceptional design patterns, and continuous support and
encouragement starting from the initial phase until the delivery of my thesis.
I would like also to thank to Betül ESMER for her final touch on the
most critical phase of my thesis.
Finally, words cannot truly express my deepest gratitude to Özgül
SUGÜNEŞ, who gave her patience, love and emotional support throughout my
thesis. I am indebted to her for her endless patience during my study.
x
TABLE OF CONTENTS
PLAGIARISM................................................................................................... iii
ABSTRACT ...................................................................................................... iv
ÖZ...................................................................................................................... vi
DEDICATION ................................................................................................ viii
ACKNOWLEDGEMENT................................................................................. ix
TABLE OF CONTENTS ................................................................................ xiv
LIST OF TABLES ........................................................................................ xivii
LIST OF FIGURES......................................................................................... xiv
LIST OF ABBREVIATIONS ........................................................................ xvii
CHAPTER
1. INTRODUCTION.......................................................................................... 1
1.1 Purpose of the Metrics Collection Tool ............................................. 3
1.2 The Approach ..................................................................................... 5
1.2.1 POMMES Metrics...................................................................... 6
1.2.2 POMMES Project Attributes...................................................... 6
1.2.3 POMMES Requirements and Design Phase .............................. 7
1.2.4 POMMES Implementation......................................................... 7
1.2.5 POMMES Validation ................................................................. 8
1.3 Thesis Structure.................................................................................. 8
2. RELATED RESEARCH.............................................................................. 10
2.1 Measurement .................................................................................... 10
2.2 Metrics.............................................................................................. 14
2.3 Software Metrics .............................................................................. 17
xi
2.4 Software Project Management with Usage of Metrics: Project
Metrics and Project Monitoring & Control .................................................. 21
2.5 Goal – Question – Metric (GQM) Approach ................................... 31
2.6 Comparison of Tools ........................................................................ 32
3. SOFTWARE PROJECT METRICS ............................................................ 51
3.1 Goal – Question – Metric (GQM) .................................................... 51
3.2 Set of Software Project Measures and Metrics ................................ 52
4. POMMES TOOL ......................................................................................... 59
4.1 Product Perspective .......................................................................... 59
4.1.1 User Interfaces.......................................................................... 59
4.1.2 Communication Interfaces ....................................................... 60
4.2 POMMES Architectural Specifications ........................................... 60
4.2.1 System Representation ............................................................. 60
4.3 POMMES Functional Specifications ............................................... 64
4.3.1 Functional Workflow ............................................................... 64
5. APPLICATION OF POMMES.................................................................... 82
5.1 Application Study Design ................................................................ 82
5.1.1 Application Study Environment............................................... 82
5.1.2 Application Study Database ..................................................... 86
5.1.3 Application Study Anonymity.................................................. 86
5.2 Application of POMMES................................................................. 87
5.2.1 Determination of Software Project Measures (GQM) ............. 88
5.2.2 Selection of Measures .............................................................. 88
5.2.3 User-Defined Metrics ............................................................... 89
5.2.4 Project Attributes and Metrics.................................................. 91
5.2.5 Collection of Metrics................................................................ 93
5.2.6 Analyze Metrics ....................................................................... 95
5.2.7 Project Management Efforts..................................................... 96
5.2.8 Performance.............................................................................. 97
5.2.9 Results ...................................................................................... 99
xii
6. CONCLUSION .......................................................................................... 102
6.1 Thesis Concept ............................................................................... 102
6.2 Fulfillment of Thesis Objectives and Aims.................................... 104
6.3 Future Directions of Thesis Work .................................................. 106
7. REFERENCES........................................................................................... 108
APPENDICES
A Set of Software Project Measures........................................................... 112
B XML Parsing Algorithms used in POMMES......................................... 172
C Study Report ........................................................................................... 189
xiii
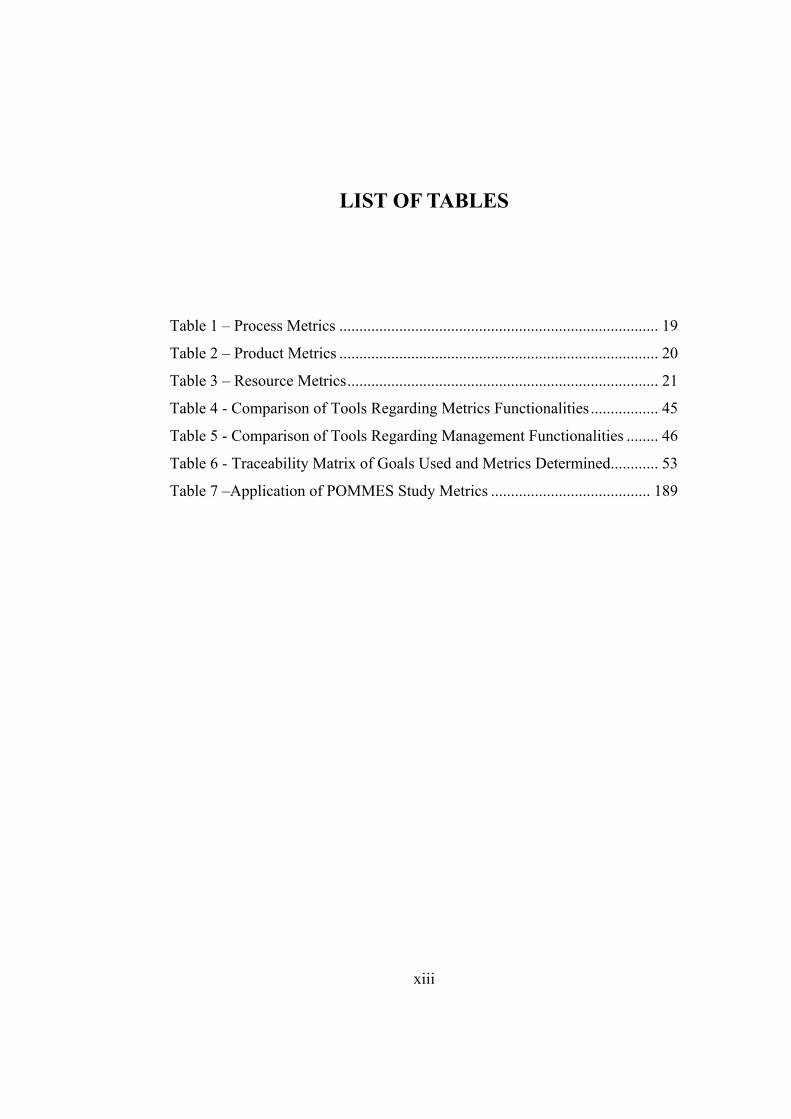
LIST OF TABLES
Table 1 – Process Metrics ................................................................................ 19
Table 2 – Product Metrics ................................................................................ 20
Table 3 – Resource Metrics.............................................................................. 21
Table 4 - Comparison of Tools Regarding Metrics Functionalities................. 45
Table 5 - Comparison of Tools Regarding Management Functionalities ........ 46
Table 6 - Traceability Matrix of Goals Used and Metrics Determined............ 53
Table 7 –Application of POMMES Study Metrics ........................................ 189
xiv
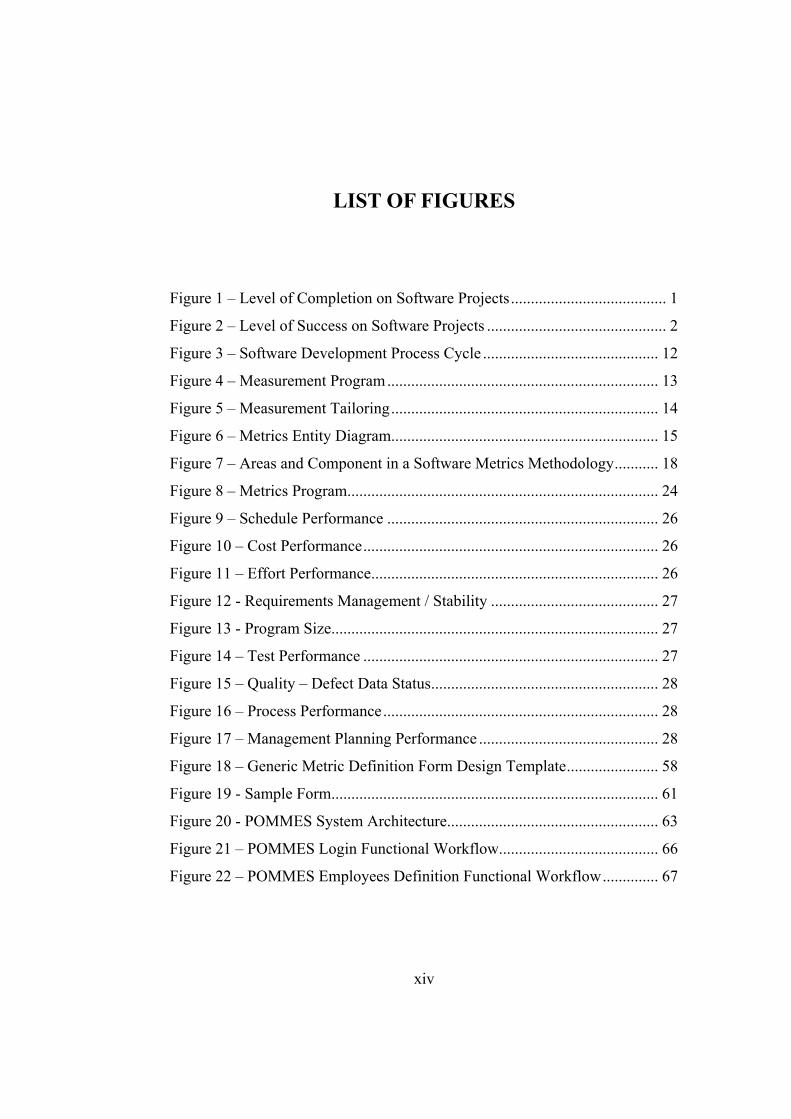
LIST OF FIGURES
Figure 1 – Level of Completion on Software Projects....................................... 1
Figure 2 – Level of Success on Software Projects ............................................. 2
Figure 3 – Software Development Process Cycle ............................................ 12
Figure 4 – Measurement Program.................................................................... 13
Figure 5 – Measurement Tailoring................................................................... 14
Figure 6 – Metrics Entity Diagram................................................................... 15
Figure 7 – Areas and Component in a Software Metrics Methodology........... 18
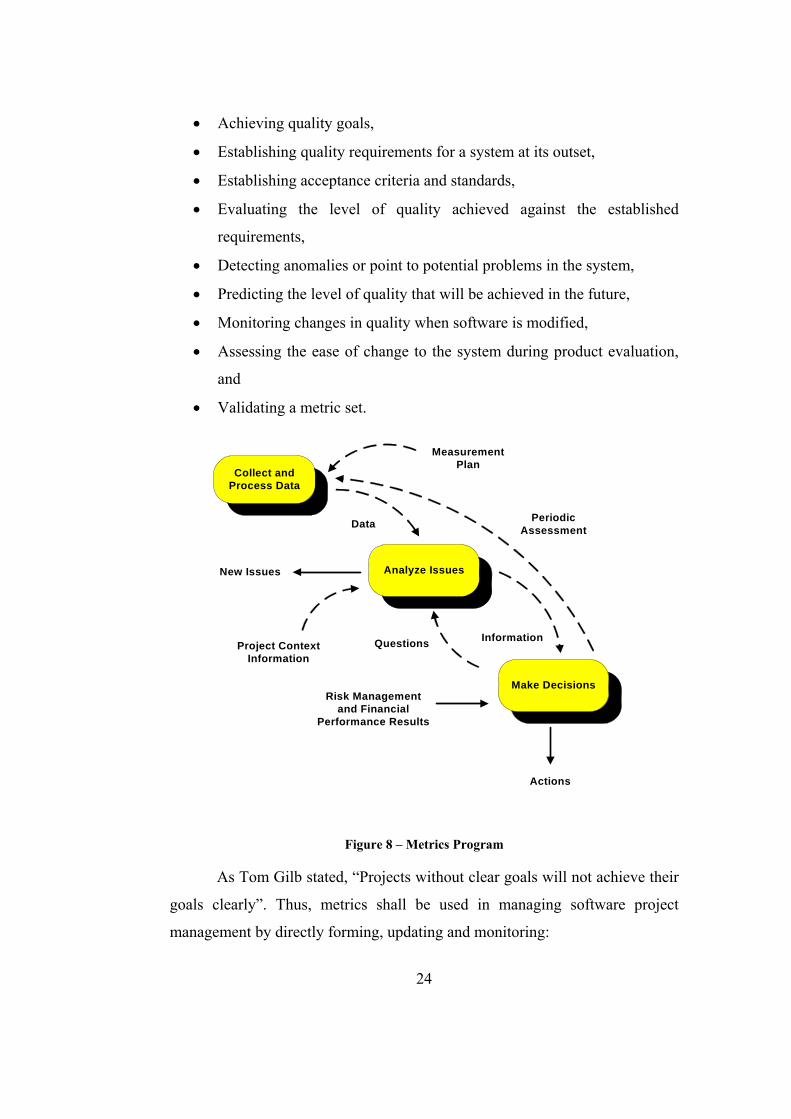
Figure 8 – Metrics Program.............................................................................. 24
Figure 9 – Schedule Performance .................................................................... 26
Figure 10 – Cost Performance.......................................................................... 26
Figure 11 – Effort Performance........................................................................ 26
Figure 12 - Requirements Management / Stability .......................................... 27
Figure 13 - Program Size.................................................................................. 27
Figure 14 – Test Performance .......................................................................... 27
Figure 15 – Quality – Defect Data Status......................................................... 28
Figure 16 – Process Performance..................................................................... 28
Figure 17 – Management Planning Performance ............................................. 28
Figure 18 – Generic Metric Definition Form Design Template....................... 58
Figure 19 - Sample Form.................................................................................. 61
Figure 20 - POMMES System Architecture..................................................... 63
Figure 21 – POMMES Login Functional Workflow........................................ 66
Figure 22 – POMMES Employees Definition Functional Workflow.............. 67
xv
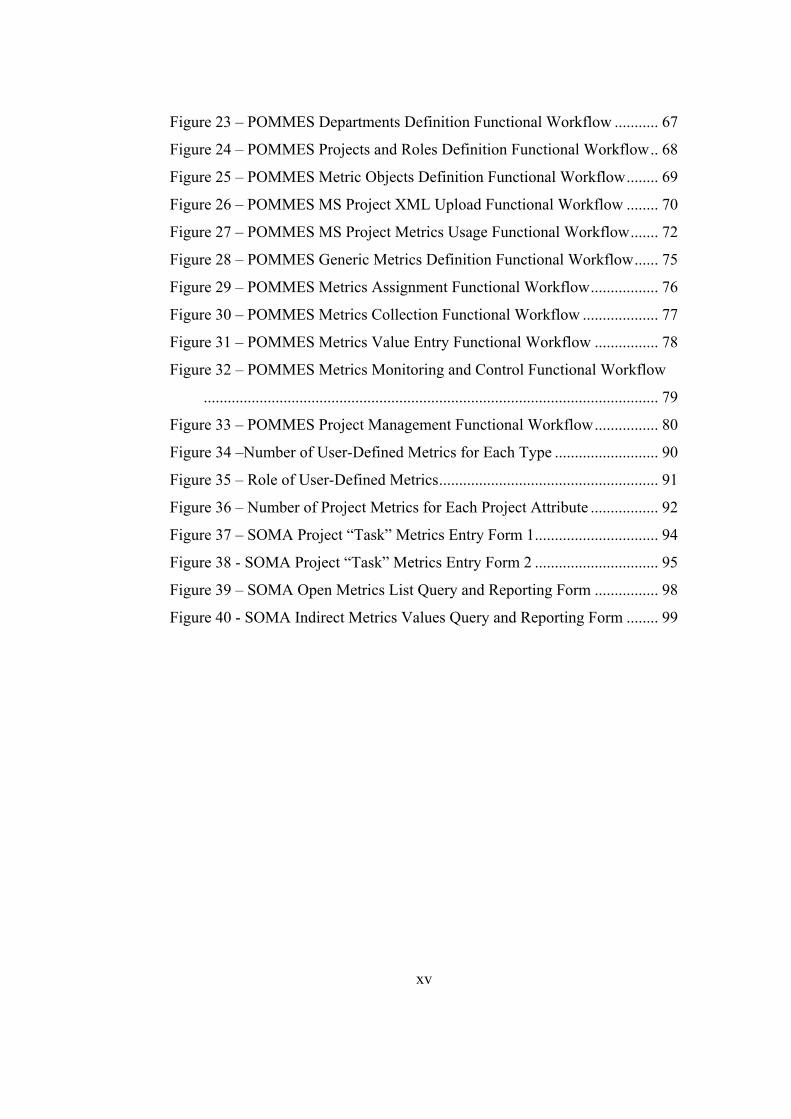
Figure 23 – POMMES Departments Definition Functional Workflow ........... 67
Figure 24 – POMMES Projects and Roles Definition Functional Workflow.. 68
Figure 25 – POMMES Metric Objects Definition Functional Workflow........ 69
Figure 26 – POMMES MS Project XML Upload Functional Workflow ........ 70
Figure 27 – POMMES MS Project Metrics Usage Functional Workflow....... 72
Figure 28 – POMMES Generic Metrics Definition Functional Workflow...... 75
Figure 29 – POMMES Metrics Assignment Functional Workflow................. 76
Figure 30 – POMMES Metrics Collection Functional Workflow ................... 77
Figure 31 – POMMES Metrics Value Entry Functional Workflow ................ 78
Figure 32 – POMMES Metrics Monitoring and Control Functional Workflow
.................................................................................................................. 79
Figure 33 – POMMES Project Management Functional Workflow................ 80
Figure 34 –Number of User-Defined Metrics for Each Type .......................... 90
Figure 35 – Role of User-Defined Metrics....................................................... 91
Figure 36 – Number of Project Metrics for Each Project Attribute ................. 92
Figure 37 – SOMA Project “Task” Metrics Entry Form 1............................... 94
Figure 38 - SOMA Project “Task” Metrics Entry Form 2 ............................... 95
Figure 39 – SOMA Open Metrics List Query and Reporting Form ................ 98
Figure 40 - SOMA Indirect Metrics Values Query and Reporting Form ........ 99
xvi
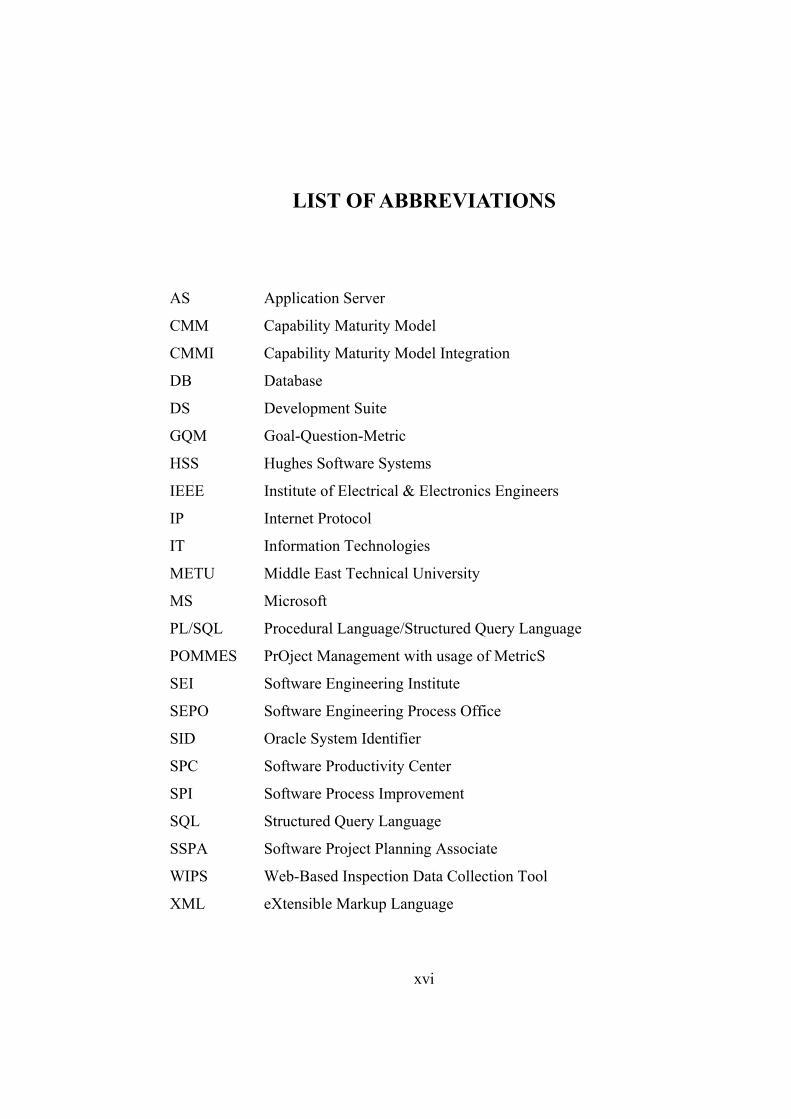
LIST OF ABBREVIATIONS
AS Application Server
CMM Capability Maturity Model
CMMI Capability Maturity Model Integration
DB Database
DS Development Suite
GQM Goal-Question-Metric
HSS Hughes Software Systems
IEEE Institute of Electrical & Electronics Engineers
IP Internet Protocol
IT Information Technologies
METU Middle East Technical University
MS Microsoft
PL/SQL Procedural Language/Structured Query Language
POMMES PrOject Management with usage of MetricS
SEI Software Engineering Institute
SEPO Software Engineering Process Office
SID Oracle System Identifier
SPC Software Productivity Center
SPI Software Process Improvement
SQL Structured Query Language
SSPA Software Project Planning Associate
WIPS Web-Based Inspection Data Collection Tool
XML eXtensible Markup Language
CHAPTER 1
INTRODUCTION
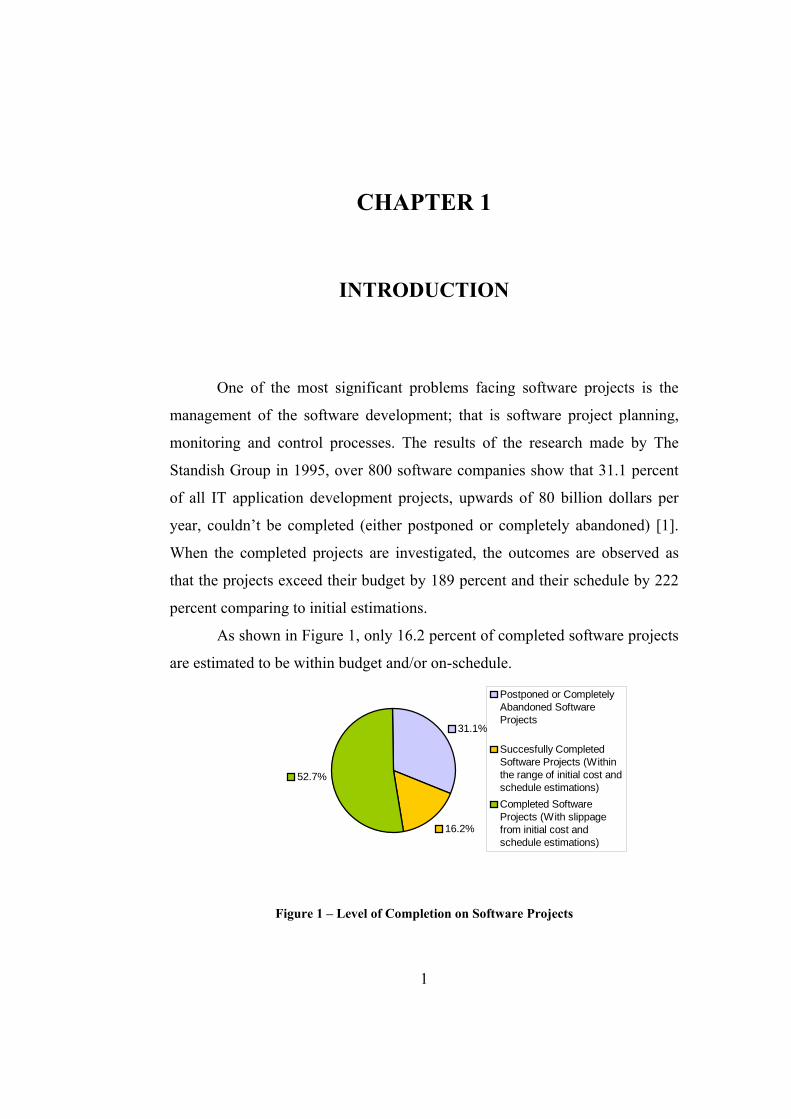
One of the most significant problems facing software projects is the
management of the software development; that is software project planning,
monitoring and control processes. The results of the research made by The
Standish Group in 1995, over 800 software companies show that 31.1 percent
of all IT application development projects, upwards of 80 billion dollars per
year, couldn’t be completed (either postponed or completely abandoned) [1].
When the completed projects are investigated, the outcomes are observed as
that the projects exceed their budget by 189 percent and their schedule by 222
percent comparing to initial estimations.
As shown in Figure 1, only 16.2 percent of completed software projects
are estimated to be within budget and/or on-schedule.
16.2%
52.7%
31.1%
Postponed or CompletelyAbandoned SoftwareProjects
Succesfully CompletedSoftware Projects (Withinthe range of initial cost andschedule estimations)Completed SoftwareProjects (With slippagefrom initial cost andschedule estimations)
Figure 1 – Level of Completion on Software Projects
1
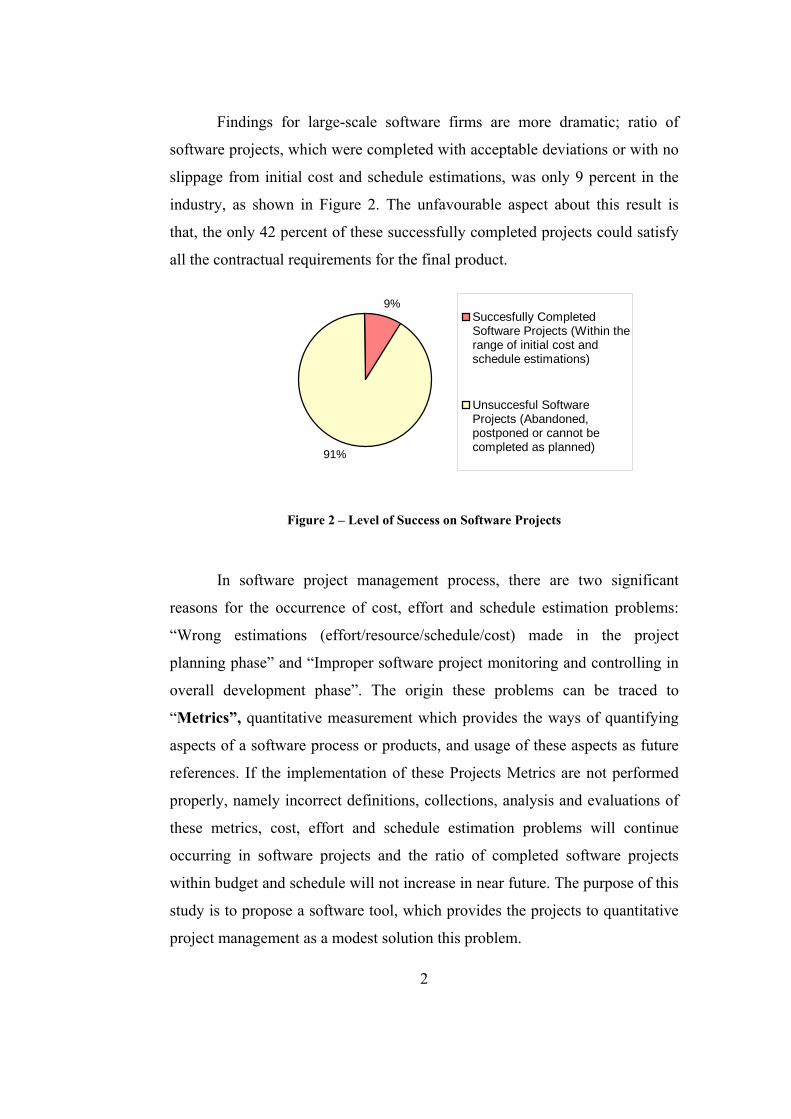
Findings for large-scale software firms are more dramatic; ratio of
software projects, which were completed with acceptable deviations or with no
slippage from initial cost and schedule estimations, was only 9 percent in the
industry, as shown in Figure 2. The unfavourable aspect about this result is
that, the only 42 percent of these successfully completed projects could satisfy
all the contractual requirements for the final product.
9%
91%
Succesfully CompletedSoftware Projects (Within therange of initial cost andschedule estimations)
Unsuccesful SoftwareProjects (Abandoned,postponed or cannot becompleted as planned)
Figure 2 – Level of Success on Software Projects
In software project management process, there are two significant
reasons for the occurrence of cost, effort and schedule estimation problems:
“Wrong estimations (effort/resource/schedule/cost) made in the project
planning phase” and “Improper software project monitoring and controlling in
overall development phase”. The origin these problems can be traced to
“Metrics”, quantitative measurement which provides the ways of quantifying
aspects of a software process or products, and usage of these aspects as future
references. If the implementation of these Projects Metrics are not performed
properly, namely incorrect definitions, collections, analysis and evaluations of
these metrics, cost, effort and schedule estimation problems will continue
occurring in software projects and the ratio of completed software projects
within budget and schedule will not increase in near future. The purpose of this
study is to propose a software tool, which provides the projects to quantitative
project management as a modest solution this problem.
2
3
In this study, a software project monitoring and control tool that
supports metrics definition, collection and analysis processes is developed.
This tool enables “Generic Metric Definition” functionality and integrates the
user-defined metrics data within Project Monitoring and Control process
(project metrics collection and analysis). With this capability, tool provides the
update of the project plans and schedules, and enables the project members to
track and oversight the project. It also supports visibility to be reflected in
actual progress and enables project manager to take corrective actions in the
critical points of the project in order to overcome the risks.
1.1 Purpose of the Metrics Collection Tool
Management of software projects involves planning, tracking and
oversight of the software accomplishments and results against the software
plans and taking corrective actions as deem necessary throughout the project
life cycle. These actions may include revising all software plans to reflect the
actual accomplishments, re-planning and re-scheduling the remaining work,
and/or taking actions to improve the performance of the project.
Metric collection will serve as a very important activity during tracking
and oversight of the project and needs to satisfy the distributed management of
the stored data thus measured attributes of the project should be entered into a
common metrics database. In this quantitative measurement process this
database needs to satisfy the main requirements of project planning, oversight
and tracking process [2]:
• Tracking estimated and actual data against the software plans
• Taking corrective, improvement and preventive actions and tracking
them to closure in case of the actual data deviate significantly from the
software plans
• Agreement of changes to software commitments by the affected groups
and individuals
4
If the metrics collection is performed in such a way that supports these
project tracking and oversight activities through formation of a historical
database for future references, then on-going project can be easily monitored
and controlled and analysis of measurements / precautions may be
implemented during transition to project next phase. In this viewpoint, when
conventional project monitoring and control tools are evaluated, it is noted
these tools mostly are not constructed to support metric collection and as a
result most of the following utilities does not exist in a single tool:
• Collecting metrics, analyzing them and evaluate to monitor and to
manage the projects
• Collecting metrics for a distributed team; customizable collection
operation specific to each project, process and team member,
• Generic metric definition specific to each project, process and team
member,
• Monitor and control the project from a single distributed application
that enables team members to be aware of the current project schedule,
and track and oversight other project attributes,
• Collecting project metrics data directly from third party project
planning tools,
• Update of the project plans via third party project planning tools with
direct usage of metrics analysis results,
• Defining which project attributes are monitored –according to the
collected metrics-,
• Monitoring the project attributes via a user-interface application
• Forming a historical project metrics database for usage in future
projects estimations that can be queried and analyzed by using an user-
interface application
The aim of this thesis is to integrate two different software tools that
are, Metric Definition/Collection/Analysis Tools and Project
5
Planning/Management Tools. Only integrated usage of these two tools would
satisfy the above-mentioned functionalities. Most important feature of
integrated tool is to eliminate the risks of using unsupported data formats by
forming a common database. As a result, there will be no more unused,
unnecessarily collected, wrongly analysed, mismatched metrics data, which
will be used in definition of the common project attributes. This is one of the
major problems, which occur in software projects.
As mentioned above, the common metrics database includes both
project metrics and user-defined metrics, thus integrated usage of these metrics
improves project management process with usage of the collected metrics in
tracking and oversight of the selected project attributes.
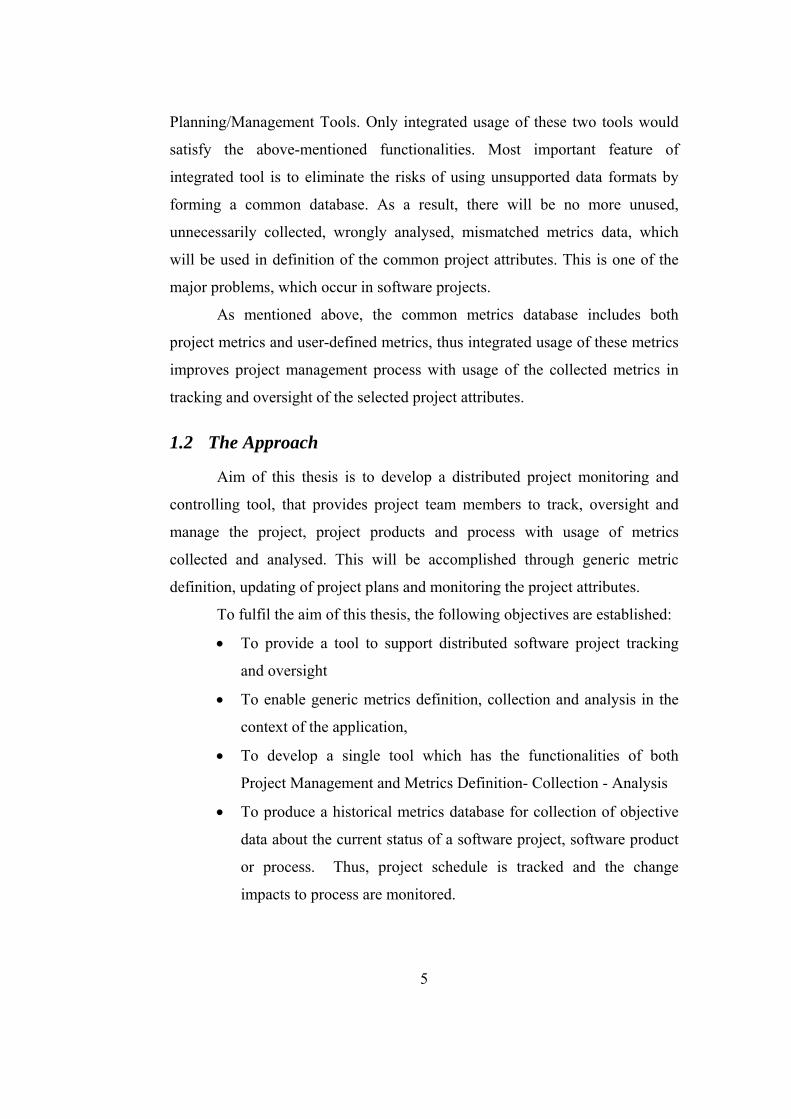
1.2 The Approach
Aim of this thesis is to develop a distributed project monitoring and
controlling tool, that provides project team members to track, oversight and
manage the project, project products and process with usage of metrics
collected and analysed. This will be accomplished through generic metric
definition, updating of project plans and monitoring the project attributes.
To fulfil the aim of this thesis, the following objectives are established:
• To provide a tool to support distributed software project tracking
and oversight
• To enable generic metrics definition, collection and analysis in the
context of the application,
• To develop a single tool which has the functionalities of both
Project Management and Metrics Definition- Collection - Analysis
• To produce a historical metrics database for collection of objective
data about the current status of a software project, software product
or process. Thus, project schedule is tracked and the change
impacts to process are monitored.
6
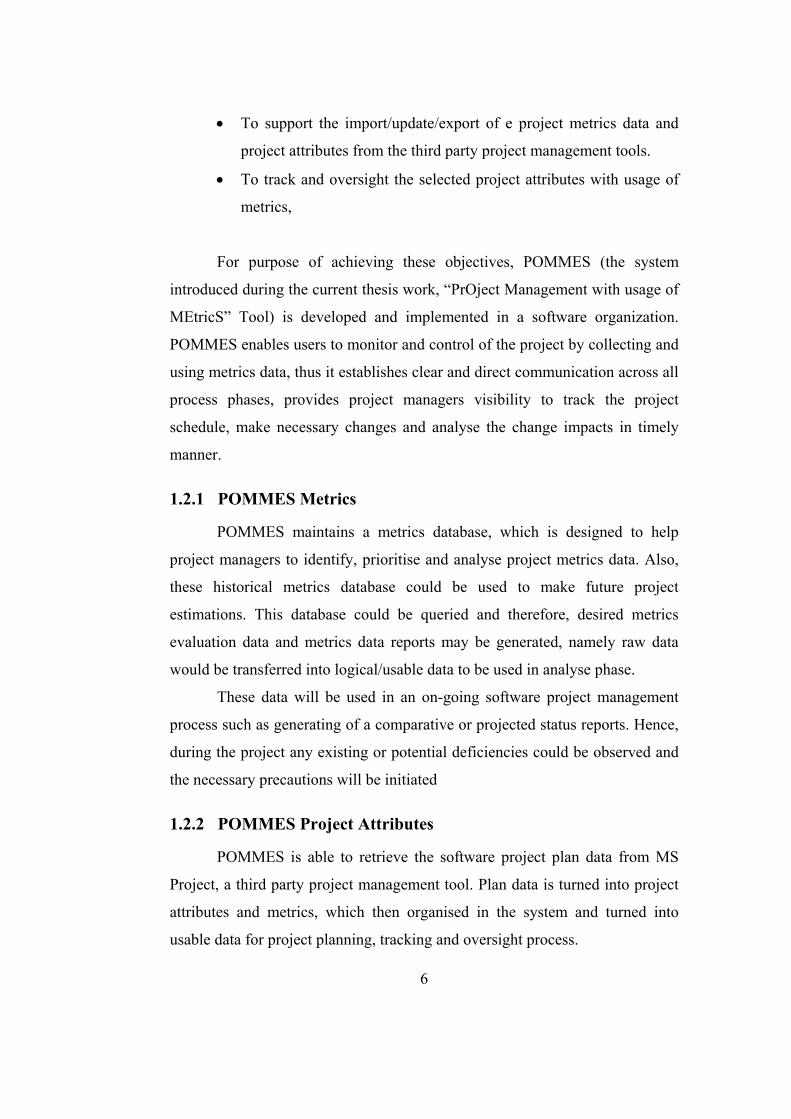
• To support the import/update/export of e project metrics data and
project attributes from the third party project management tools.
• To track and oversight the selected project attributes with usage of
metrics,
For purpose of achieving these objectives, POMMES (the system
introduced during the current thesis work, “PrOject Management with usage of
MEtricS” Tool) is developed and implemented in a software organization.
POMMES enables users to monitor and control of the project by collecting and
using metrics data, thus it establishes clear and direct communication across all
process phases, provides project managers visibility to track the project
schedule, make necessary changes and analyse the change impacts in timely
manner.
1.2.1 POMMES Metrics
POMMES maintains a metrics database, which is designed to help
project managers to identify, prioritise and analyse project metrics data. Also,
these historical metrics database could be used to make future project
estimations. This database could be queried and therefore, desired metrics
evaluation data and metrics data reports may be generated, namely raw data
would be transferred into logical/usable data to be used in analyse phase.
These data will be used in an on-going software project management
process such as generating of a comparative or projected status reports. Hence,
during the project any existing or potential deficiencies could be observed and
the necessary precautions will be initiated
1.2.2 POMMES Project Attributes
POMMES is able to retrieve the software project plan data from MS
Project, a third party project management tool. Plan data is turned into project
attributes and metrics, which then organised in the system and turned into
usable data for project planning, tracking and oversight process.
7
Thus, POMMES allows the user to visualize selected project attributes
imported from third party tools and enables project manager and team
members to be focused on identified project attributes.
User is also able to directly update the selected software project plan
metrics, retrieved from third party tool, in POMMES system. This functionality
maintains two-way data transfer, and by this way integration of POMMES with
third party project management tool (MS Project) is achieved.
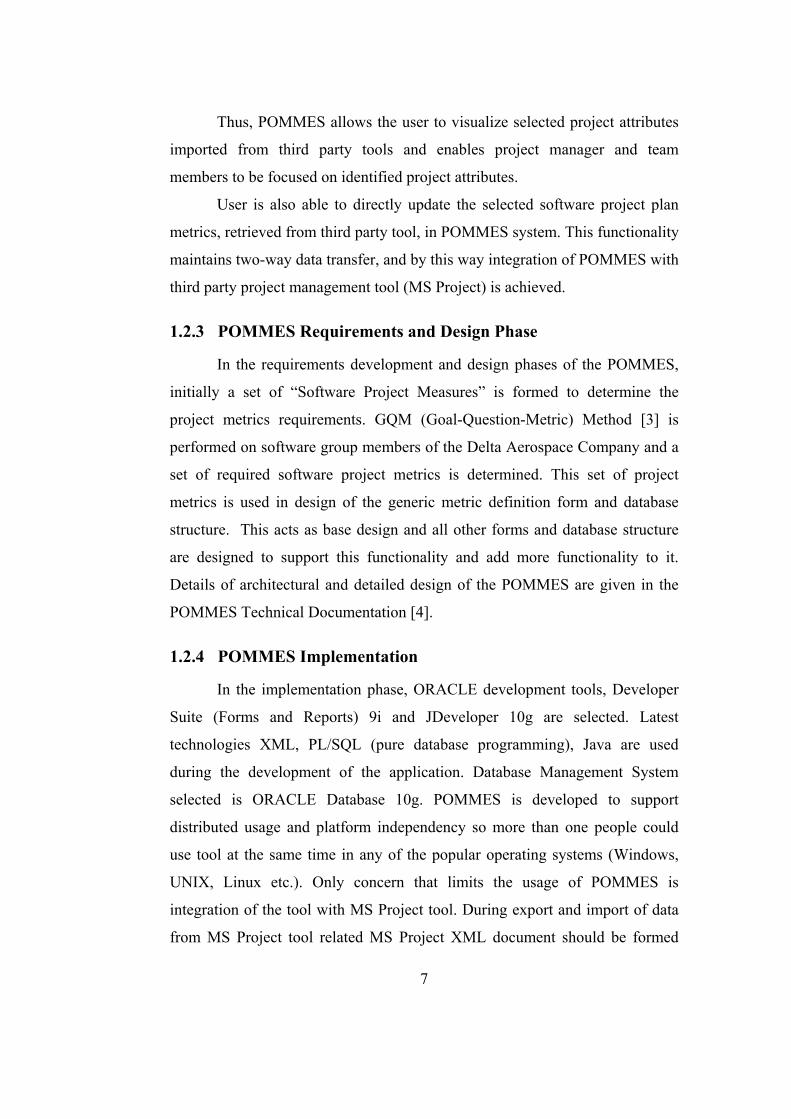
1.2.3 POMMES Requirements and Design Phase
In the requirements development and design phases of the POMMES,
initially a set of “Software Project Measures” is formed to determine the
project metrics requirements. GQM (Goal-Question-Metric) Method [3] is
performed on software group members of the Delta Aerospace Company and a
set of required software project metrics is determined. This set of project
metrics is used in design of the generic metric definition form and database
structure. This acts as base design and all other forms and database structure
are designed to support this functionality and add more functionality to it.
Details of architectural and detailed design of the POMMES are given in the
POMMES Technical Documentation [4].
1.2.4 POMMES Implementation
In the implementation phase, ORACLE development tools, Developer
Suite (Forms and Reports) 9i and JDeveloper 10g are selected. Latest
technologies XML, PL/SQL (pure database programming), Java are used
during the development of the application. Database Management System
selected is ORACLE Database 10g. POMMES is developed to support
distributed usage and platform independency so more than one people could
use tool at the same time in any of the popular operating systems (Windows,
UNIX, Linux etc.). Only concern that limits the usage of POMMES is
integration of the tool with MS Project tool. During export and import of data
from MS Project tool related MS Project XML document should be formed
8
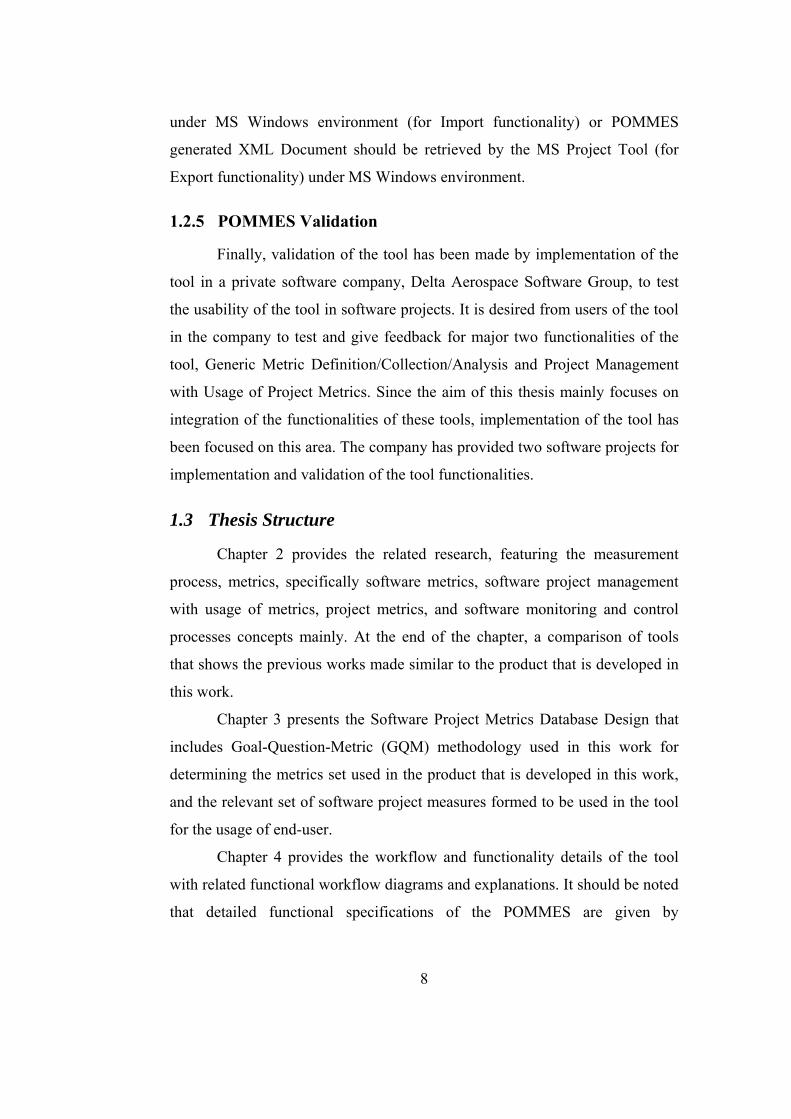
under MS Windows environment (for Import functionality) or POMMES
generated XML Document should be retrieved by the MS Project Tool (for
Export functionality) under MS Windows environment.
1.2.5 POMMES Validation
Finally, validation of the tool has been made by implementation of the
tool in a private software company, Delta Aerospace Software Group, to test
the usability of the tool in software projects. It is desired from users of the tool
in the company to test and give feedback for major two functionalities of the
tool, Generic Metric Definition/Collection/Analysis and Project Management
with Usage of Project Metrics. Since the aim of this thesis mainly focuses on
integration of the functionalities of these tools, implementation of the tool has
been focused on this area. The company has provided two software projects for
implementation and validation of the tool functionalities.
1.3 Thesis Structure
Chapter 2 provides the related research, featuring the measurement
process, metrics, specifically software metrics, software project management
with usage of metrics, project metrics, and software monitoring and control
processes concepts mainly. At the end of the chapter, a comparison of tools
that shows the previous works made similar to the product that is developed in
this work.
Chapter 3 presents the Software Project Metrics Database Design that
includes Goal-Question-Metric (GQM) methodology used in this work for
determining the metrics set used in the product that is developed in this work,
and the relevant set of software project measures formed to be used in the tool
for the usage of end-user.
Chapter 4 provides the workflow and functionality details of the tool
with related functional workflow diagrams and explanations. It should be noted
that detailed functional specifications of the POMMES are given by
9
representing the functionalities of all modules of the tool within a separate
document, “POMMES Technical Documentation” [4].
Chapter 5 represents the Study made on a private software company, to
verify the usability of the concept developed on the thesis work.
Implementation and usage of POMMES in the company, developed under this
thesis work, becomes the means for this verification process.
Chapter 6 presents the summary of the thesis concept, explains the
research and development done. Then, provides the fulfilment of thesis
objectives and aims by matching each objective and its fulfilment with the
related POMMES modules. Finally, future directions of this thesis work and
the improvement-needed parts are presented for future academic research
activities, and this chapter concludes the thesis.
10
CHAPTER 2
RELATED RESEARCH
Integration of “Generic Metric Definition and Collection” and
“Software Project Management” processes consists of many definitions,
entities, and characteristics. For better understanding of these attributes and
forming a proper solution method for the problem, identified on section 1.1,
these concepts needs to be clarified. In this manner, research areas are
determined as:
1. Measurement
2. Metrics
3. Software Metrics
4. Software Project Management with Usage of Metrics
a. Project Metrics
b. Project Monitoring & Control
5. Goal Question Metrics (GQM) Approach
The detailed information about these subjects are given in sections 2.1
to 2.5, and then the analysis of the existing Project Management, Project
Monitoring & Control and Metrics Collection/Analysis tools are presented in
section 2.6 to present former studies established in this field.
2.1 Measurement
Measurement is the process by which numbers or symbols are assigned
to attributes of entities in the real world in such a way as to describe them
11
according to clearly defined rules [5]. This definition feels the need for better
understanding of “attribute” and “entity” concepts. Again referring to [5],
entity is an object (e.g. project, software, and person) or an event (e.g. coding,
testing, planning, and requirements management) in the real world, and
attribute is a feature or property of an entity (e.g. cost of a project, effort of a
person, time of a coding phase).
Now, we know what is measurement, so it is time to clarify how
measurement is done in software world. In software projects, project managers
generally face with improper, inconsistent and incomplete measurements. The
reason is that there is not a proper software measurement process or program is
defined in projects. In the past 4-5 years, with the popularity of CMM and
nowadays CMMI, importance of measurement and metrics takes more
consideration but this is still not enough. CMMI [6] Maturity Level 4
organization is characterized as Quantitatively Managed (calling the related
definition from the CMMI – v1.1 Continuous Representation [6], “A
quantitatively managed process is a defined (capability level 3) process that is
controlled using statistical and other quantitative techniques. Quantitative
objectives for quality and process performance are established and used as
criteria in managing the process. The quality and process performance are
understood in statistical terms and are managed throughout the life of the
process”) that means to have measured and managed processes, leading firm to
control the processes and relevant feedbacks from early and on-going
processes. Most software projects fail to set measurable targets for their
software products, understand and quantify the component costs of software
projects, quantify or predict the quality of the products they produce, and check
the efficiency and effectiveness of the proposed “brand new, revolutionary (!)”
technology before choosing it for usage in the development projects [5].
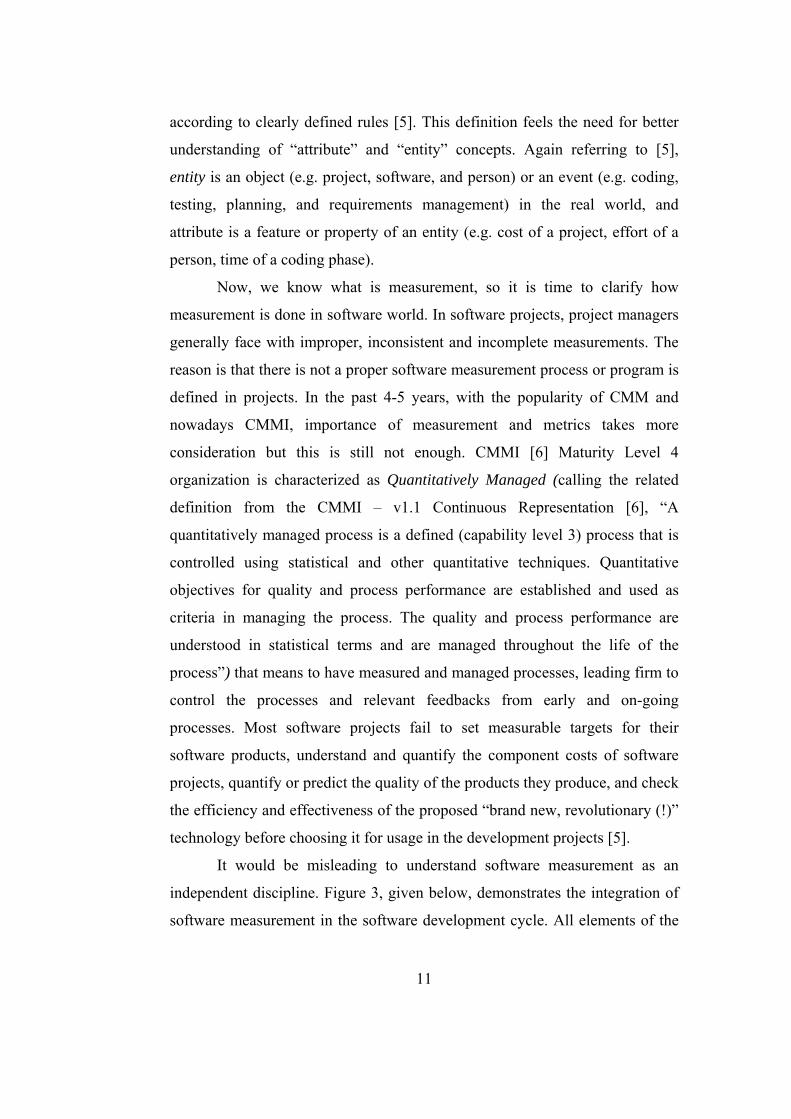
It would be misleading to understand software measurement as an
independent discipline. Figure 3, given below, demonstrates the integration of
software measurement in the software development cycle. All elements of the
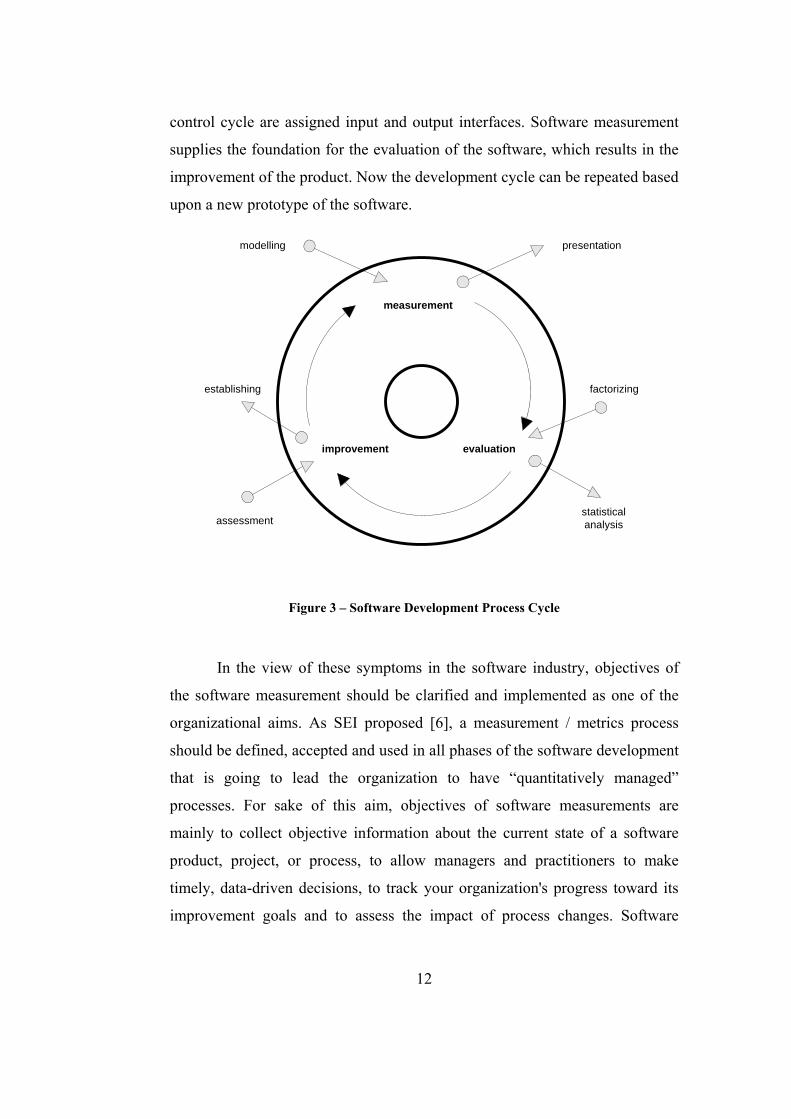
control cycle are assigned input and output interfaces. Software measurement
supplies the foundation for the evaluation of the software, which results in the
improvement of the product. Now the development cycle can be repeated based
upon a new prototype of the software.
measurement
evaluationimprovement
modelling
establishing
presentation
factorizing
assessmentstatisticalanalysis
Figure 3 – Software Development Process Cycle
In the view of these symptoms in the software industry, objectives of
the software measurement should be clarified and implemented as one of the
organizational aims. As SEI proposed [6], a measurement / metrics process
should be defined, accepted and used in all phases of the software development
that is going to lead the organization to have “quantitatively managed”
processes. For sake of this aim, objectives of software measurements are
mainly to collect objective information about the current state of a software
product, project, or process, to allow managers and practitioners to make
timely, data-driven decisions, to track your organization's progress toward its
improvement goals and to assess the impact of process changes. Software
12
measurement helps to improve the understanding of software; it provides the
necessary information for the assessment and management of a software
project [7]. So these measurement results could be used for “assessment” of
used methods, characteristics of the development methods and development
problems, “indication” of performance evaluation, reviews and milestones, and
by this way, controlling the software development and optimisation of software
production.
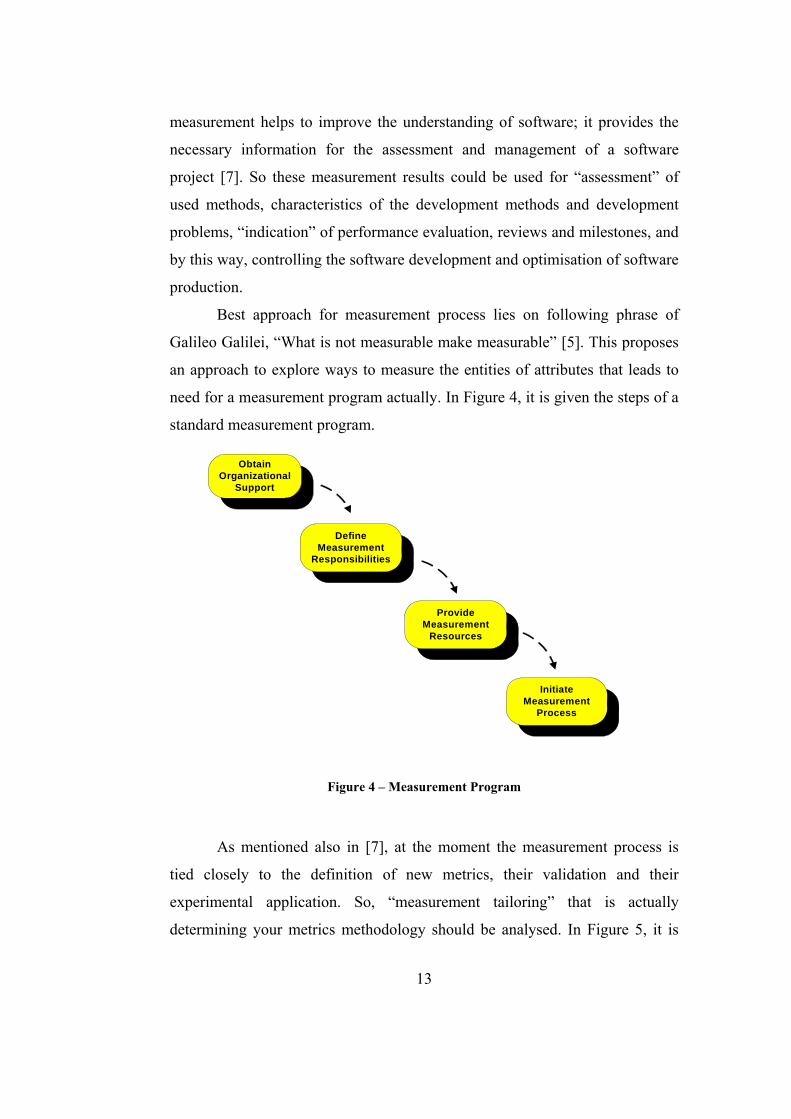
Best approach for measurement process lies on following phrase of
Galileo Galilei, “What is not measurable make measurable” [5]. This proposes
an approach to explore ways to measure the entities of attributes that leads to
need for a measurement program actually. In Figure 4, it is given the steps of a
standard measurement program.
ObtainOrganizational
Support
DefineMeasurement
Responsibilities
ProvideMeasurement
Resources
InitiateMeasurement
Process
Figure 4 – Measurement Program
As mentioned also in [7], at the moment the measurement process is
tied closely to the definition of new metrics, their validation and their
experimental application. So, “measurement tailoring” that is actually
determining your metrics methodology should be analysed. In Figure 5, it is
13
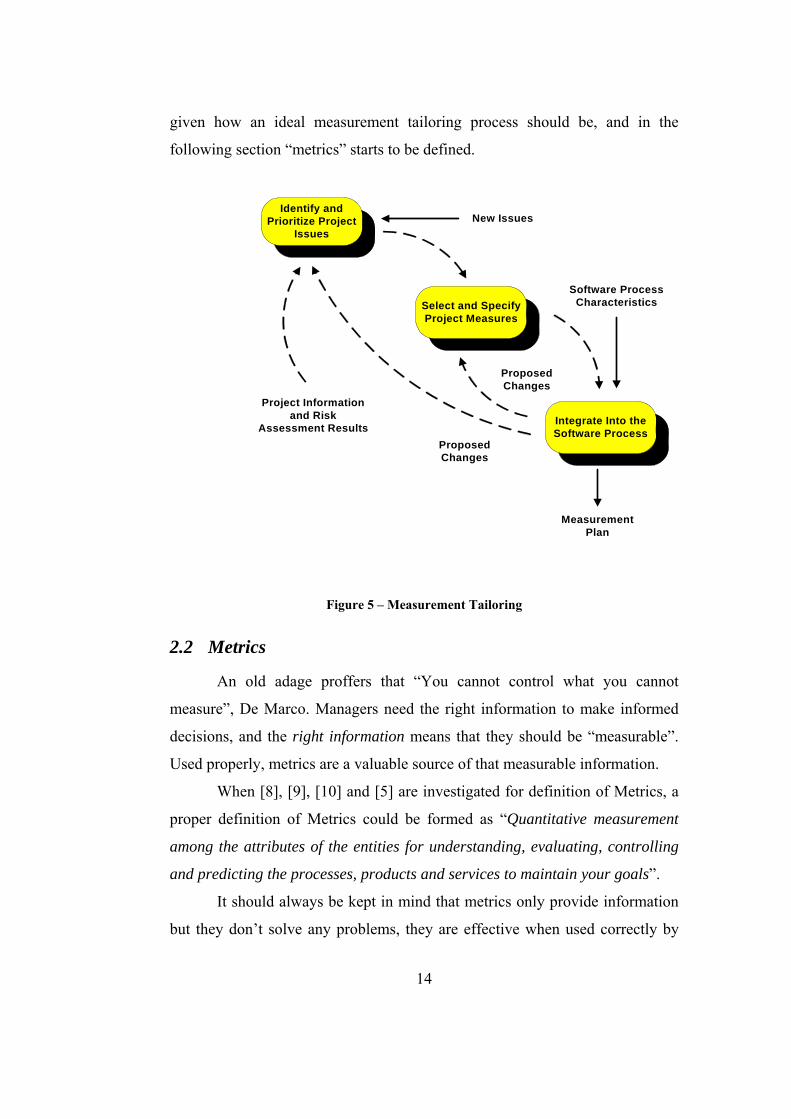
given how an ideal measurement tailoring process should be, and in the
following section “metrics” starts to be defined.
Identify andPrioritize Project
Issues
Select and SpecifyProject Measures
Integrate Into theSoftware Process
Project Informationand Risk
Assessment ResultsProposedChanges
ProposedChanges
Software ProcessCharacteristics
New Issues
MeasurementPlan
Figure 5 – Measurement Tailoring
2.2 Metrics
An old adage proffers that “You cannot control what you cannot
measure”, De Marco. Managers need the right information to make informed
decisions, and the right information means that they should be “measurable”.
Used properly, metrics are a valuable source of that measurable information.
When [8], [9], [10] and [5] are investigated for definition of Metrics, a
proper definition of Metrics could be formed as “Quantitative measurement
among the attributes of the entities for understanding, evaluating, controlling
and predicting the processes, products and services to maintain your goals”.
It should always be kept in mind that metrics only provide information
but they don’t solve any problems, they are effective when used correctly by
14
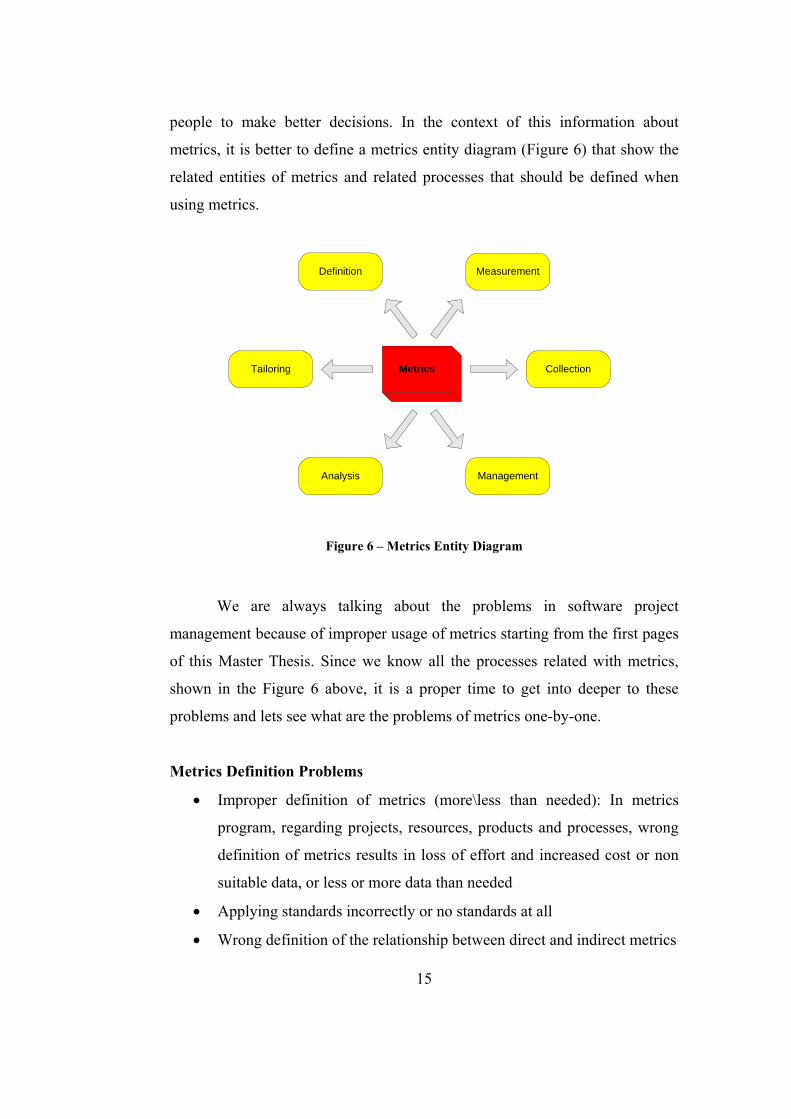
people to make better decisions. In the context of this information about
metrics, it is better to define a metrics entity diagram (Figure 6) that show the
related entities of metrics and related processes that should be defined when
using metrics.
Metrics
Definition
Tailoring
Analysis
Measurement
Collection
Management
Figure 6 – Metrics Entity Diagram
We are always talking about the problems in software project
management because of improper usage of metrics starting from the first pages
of this Master Thesis. Since we know all the processes related with metrics,
shown in the Figure 6 above, it is a proper time to get into deeper to these
problems and lets see what are the problems of metrics one-by-one.
Metrics Definition Problems
• Improper definition of metrics (more\less than needed): In metrics
program, regarding projects, resources, products and processes, wrong
definition of metrics results in loss of effort and increased cost or non
suitable data, or less or more data than needed
• Applying standards incorrectly or no standards at all
15
• Wrong definition of the relationship between direct and indirect metrics
16
Metrics Collection Problems
• Wrong collection of the metrics (improper method selection, or
wrong/missing metric value insertion - human factor)
• Personnel resistance
• Timing problem
• Absence of Metrics DB
• Absence of automated collection tool
Measurement Program Problems
• Defining inappropriate methodologies, (metrics that apply to the
company)
Metrics Analysis Problems
• Analyzing metrics for personnel and organizational performance
• Misinterpretation of project scope
• Ineffective presentation and usage of analysis results
• Worn analysis of metrics: If the metrics are incorrectly analyzed and
evaluated regarding the project, product and process scope, the
resulting outcomes cannot be used effectively in the decision phases of
the project
Metrics Program Management Problems
• Non-integrated processes
• Resource Management problems
• Misuse of collected metrics
• Wrongly set of targets
• Communication problem
Metrics Tailoring Process Problems
• Defining wrong metrics for the projects
17
• Departmental issues
• Inefficient tool usage and lack of methodologies
• Lack of experience
• Lack of Historical Metrics DB
2.3 Software Metrics
“Software Metrics” allow using a real engineering approach to software
development, providing the quantitative and objective base that software
engineering was lacking [10]. Software Metrics, as defined in [8] are “A
function whose inputs are software data and whose output is a single numerical
value that can be interpreted as the degree to which software possesses a given
attribute that affect its quality”.
In the view of this definition, according to project inputs and outputs,
software metrics needs to be measured for satisfying of project management
needs is determined as:
• Process Metric (e.g. Time, Effort, Cost): A metric used to measure
characteristics of the methods, techniques, and tools employed in
developing, implementing, and maintaining the software system -
definition from IEEE Standard [8]
• Product Metric (e.g. Size, Reliability): A metric used to measure the
characteristic of any intermediate or final product of the software
development process - definition from IEEE Standard [8]
• Resource Metric (e.g. Price, Experience)
When looked from the view of Software Quality, IEEE Standard [8]
comes with a nice purpose definition for the usage of software metrics. It
declares the purpose of software metrics as making assessments throughout the
software life cycle as to whether the quality requirements are being met. The
reason is that usage of software metrics, as expected, reduces subjectivity in the
assessment and control of software quality by providing a quantitative basis of
making decisions about software quality. This quality improvement is a cyclic
project that lives by itself, such that Measurement Based Techniques are
applied to Software Processes, Products and Services. These are used to form
and then supply Engineering and Management Information to related authority.
Completing the circle, feedback from this Engineering and Management
Information is used to improve the relevant Software Processes, Products and
Services. By this way, a proper software measurement process that is using
proper metrics increases the overall quality of the software development
processes and improves the organizational quality.
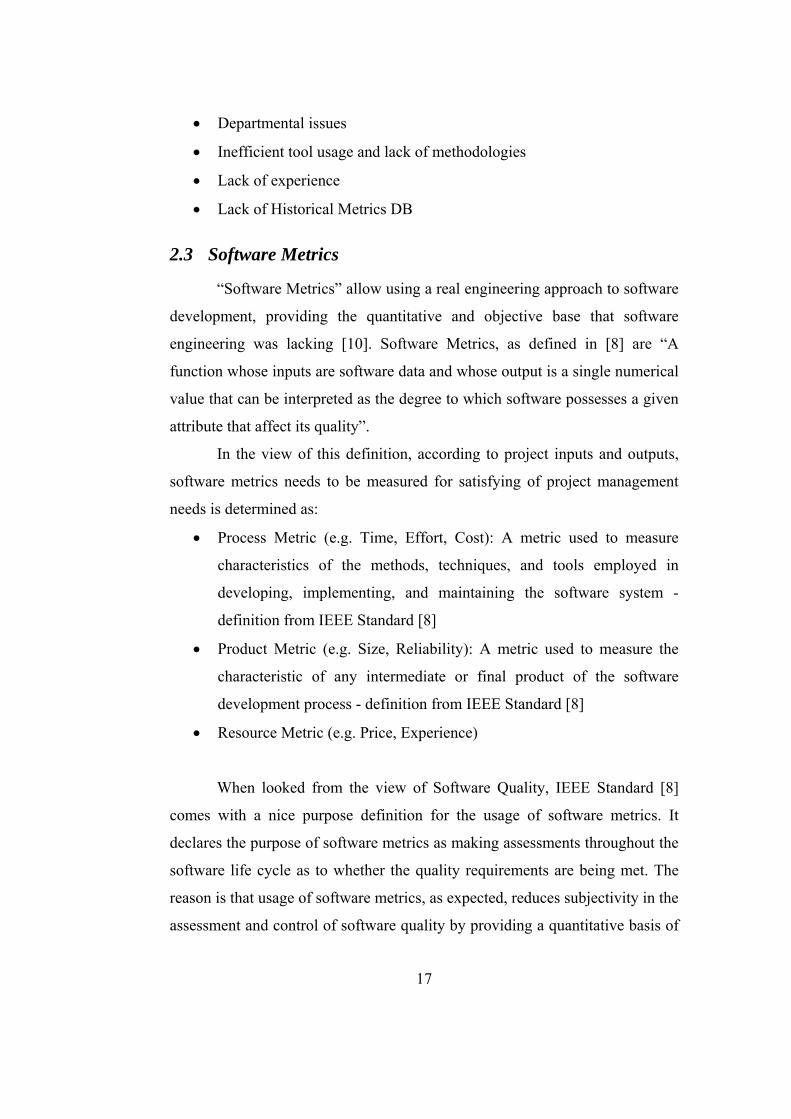
In [7], there is given a chart that shows areas and components in a
software metrics methodology. It is better to give it also here, in Figure 7, for
the sake of showing the whole picture.
Theory of measurement(statistical analysis)
VALIDATION
ESTIMATION
CALIBRATION
CORRELATION
scale scale
Softwaredevelopmentcomponent
Model ModelEvaluation(empirical)criteria
Designdocuments
Drawings
Charts
Sourcecode
Test tables...
Cost
Effort
Grade
Quality
Actuality
...
Abstraction(tool-based)
Metricsapplication
Metrics application
Abstraction(expert's report)
flowgraph
callgraph
textschemata
structuretree
codeschemata...
goal tree
factor-criteriatree
cause andeffectdiagram
GQMparadigm...
Figure 7 – Areas and Component in a Software Metrics Methodology
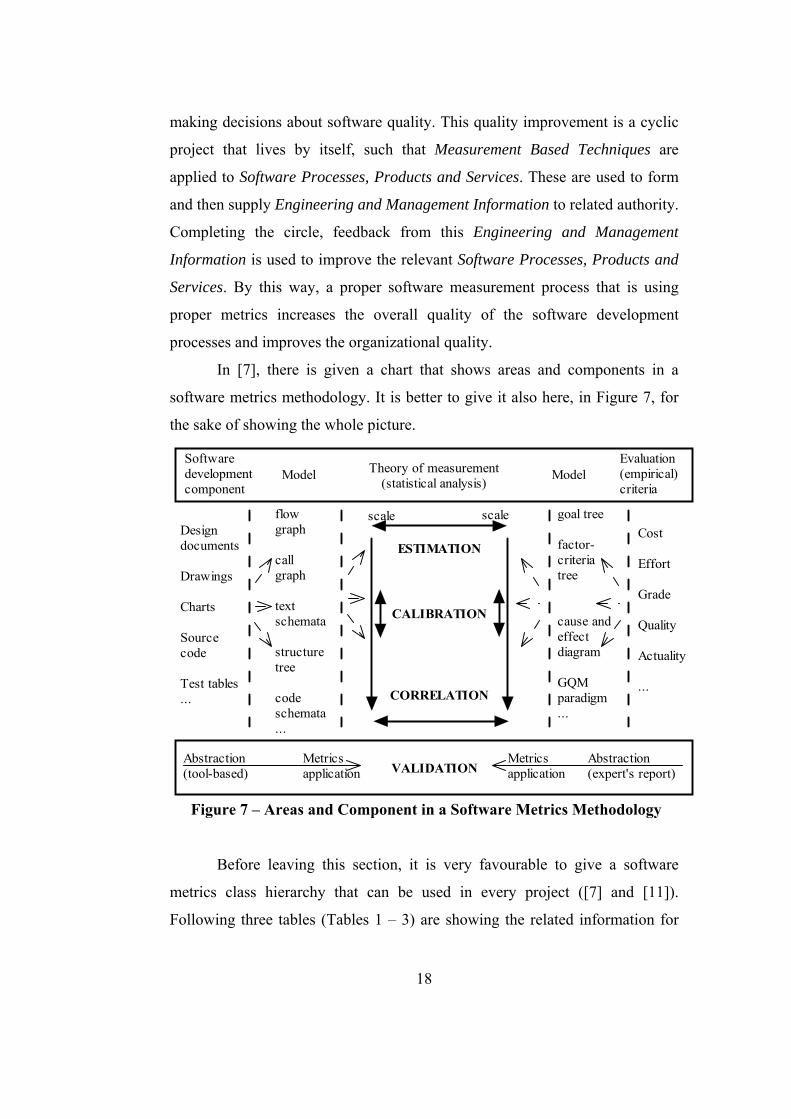
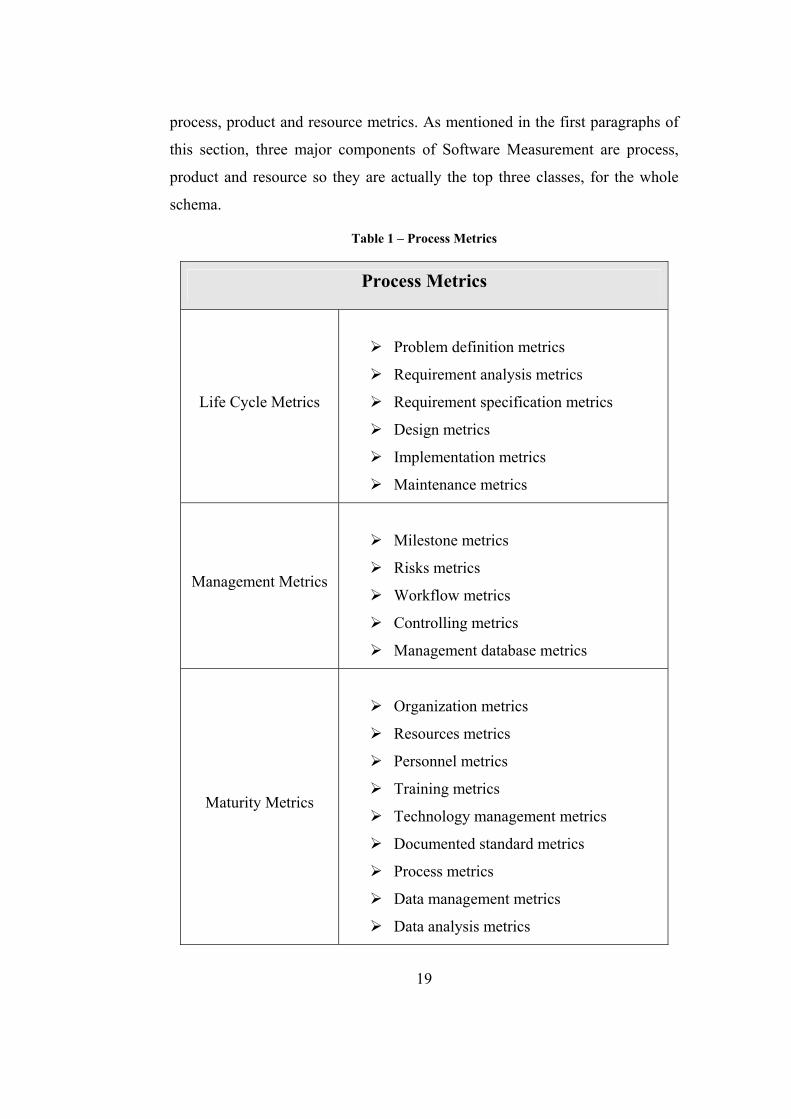
Before leaving this section, it is very favourable to give a software
metrics class hierarchy that can be used in every project ([7] and [11]).
Following three tables (Tables 1 – 3) are showing the related information for
18
19
process, product and resource metrics. As mentioned in the first paragraphs of
this section, three major components of Software Measurement are process,
product and resource so they are actually the top three classes, for the whole
schema.
Table 1 – Process Metrics
Process Metrics
Life Cycle Metrics
Problem definition metrics
Requirement analysis metrics
Requirement specification metrics
Design metrics
Implementation metrics
Maintenance metrics
Management Metrics
Milestone metrics
Risks metrics
Workflow metrics
Controlling metrics
Management database metrics
Maturity Metrics
Organization metrics
Resources metrics
Personnel metrics
Training metrics
Technology management metrics
Documented standard metrics
Process metrics
Data management metrics
Data analysis metrics
20
Table 2 – Product Metrics
Product Metrics
Architecture Metrics
Components metrics
Architecture characteristics
Architecture standards metrics
Complexity Metrics
Computational complexity metrics
Psychological complexity metrics
Quality Metrics
Functionality metrics
Reliability metrics
Usability metrics
Efficiency metrics
Maintainability metrics
Portability metrics
Size Metrics
Elements counting
Development size metrics
Size of components metrics
Structure Metrics
Component characteristics
Structure characteristics
Psychological rules metrics
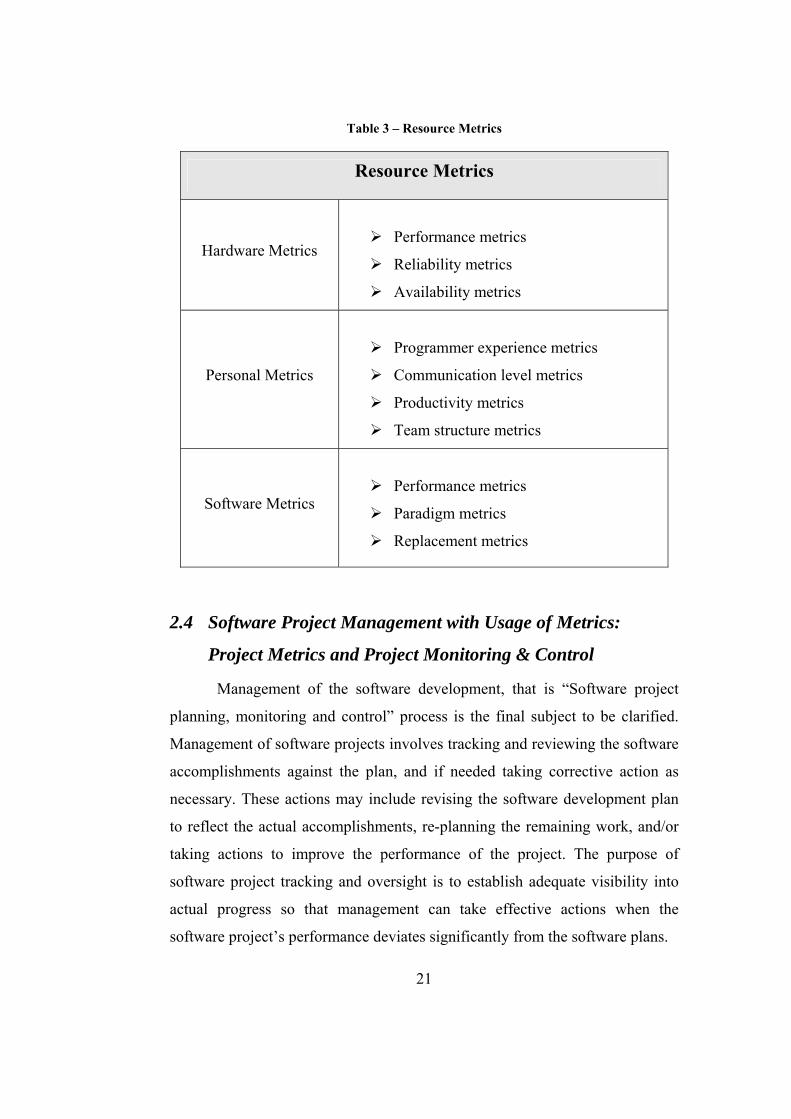
21
Table 3 – Resource Metrics
Resource Metrics
Hardware Metrics
Performance metrics
Reliability metrics
Availability metrics
Personal Metrics
Programmer experience metrics
Communication level metrics
Productivity metrics
Team structure metrics
Software Metrics
Performance metrics
Paradigm metrics
Replacement metrics
2.4 Software Project Management with Usage of Metrics:
Project Metrics and Project Monitoring & Control
Management of the software development, that is “Software project
planning, monitoring and control” process is the final subject to be clarified.
Management of software projects involves tracking and reviewing the software
accomplishments against the plan, and if needed taking corrective action as
necessary. These actions may include revising the software development plan
to reflect the actual accomplishments, re-planning the remaining work, and/or
taking actions to improve the performance of the project. The purpose of
software project tracking and oversight is to establish adequate visibility into
actual progress so that management can take effective actions when the
software project’s performance deviates significantly from the software plans.
22
• As mentioned in [12], successful software project management relies on
two key elements: the accurate planning of the project lifecycle, and
tracking and oversight of the project to steer it to its successful
completion in terms of time, cost and quality. To achieve accurate
measurements of productivity and quality requires automated metrics
collection and analysis. In order to characterize, evaluate, predict and
improve the process and product a metric baseline is essential.
This metric baseline can be formed with satisfying project tracking and
oversight process requirements mentioned in the approach “The key to effective
project tracking and oversight is defining measurable and countable entities,
and a process for gathering and counting that is repeatable” [13]. This
approach is analysed phrase-by-phrase in the following paragraphs.
“Effective project tracking and oversight”: Recalling the definition of
Software Project Tracking and Oversight from PMBOK [14], “process that is
used to ensure project objectives are met by monitoring and measuring
progress regularly to identify variances from plan so that corrective action can
be taken when necessary”. Meeting project objectives means that you maintain
your requirements; your project plan is as planned within estimated schedule
and budget. To be able to check the success on coverage of defined
requirements, these requirements should be specified as measurable entities.
“Defining measurable and countable entities”: Project tracking and
oversight process and the outcome of this process become logical and usable
when they are measurable, that is when they are defined with usage of proper
metrics. If you make everything measurable in a project, only then you can say
something on your project aims.
“Process for gathering and counting”: Performance analysis of a project
couldn’t be done without collecting data, so there will not be any available
outcomes, reports to be used for process improvement and to take necessary
corrective and preventive actions. This is also mentioned in PMBOK [14]
within Performance Reporting section by stating that Performance Reporting
23
involves collecting and disseminating performance information to provide
stakeholders with information about how resources are being used to achieve
project attributes. It is so clear from this definition that you couldn’t think
measuring, collecting, or analysis of metrics to monitor and control project
management, they are actually all-in-one interaction process.
“Repeatable process”: There is no way to think project monitoring and
controlling as a static process. It should be a generic process that supports
regular monitor and measurements to identify variances from the project
schedule and plan [14]. For every software project and phase it should be easily
applicable so that adjustments to the plan or schedule could be made with an
effort of repeating the appropriate project tracking, oversight and related
planning purposes only. This all results in gaining of a single project
management ability for the software organization: “Monitoring and
Controlling” of the project [14].
For performing a software measurement approach mentioned above, a
software metrics program should be initiated in the organization and should be
performed by all initiatives of the software teams. Similar software process
improvement program based on using metrics was performed in Bull HN
Information System [13]. Their aim is to make the software project
management based on the use of historical data for planning and current
measures for project tracking.
Figure 8 is the workflow representation of a Metrics Program that could
be applied in an organization to be applied. In the context of this Master
Thesis, it is assumed a similar metrics program is used in the related
organization effectively that will use the POMMES. This would determine the
inputs and outputs to the POMMES and a similar approach to support this
metrics program is reflected by the usage of the application.
Important of usage of a metrics program is defined in IEEE Standard
[8], and major advantages for an organization to use a defined metrics program
are listed, in the view of Software Quality, as follows:
• Achieving quality goals,
• Establishing quality requirements for a system at its outset,
• Establishing acceptance criteria and standards,
• Evaluating the level of quality achieved against the established
requirements,
• Detecting anomalies or point to potential problems in the system,
• Predicting the level of quality that will be achieved in the future,
• Monitoring changes in quality when software is modified,
• Assessing the ease of change to the system during product evaluation,
and
• Validating a metric set.
Collect andProcess Data
Analyze Issues
Make DecisionsRisk Management
and FinancialPerformance Results
Project ContextInformation
Questions
New Issues
MeasurementPlan
Information
Data PeriodicAssessment
Actions
Figure 8 – Metrics Program
As Tom Gilb stated, “Projects without clear goals will not achieve their
goals clearly”. Thus, metrics shall be used in managing software project
management by directly forming, updating and monitoring:
24
25
• Software project planning,
• Schedule,
• Task assignment,
• Resource management and
• Software development processes
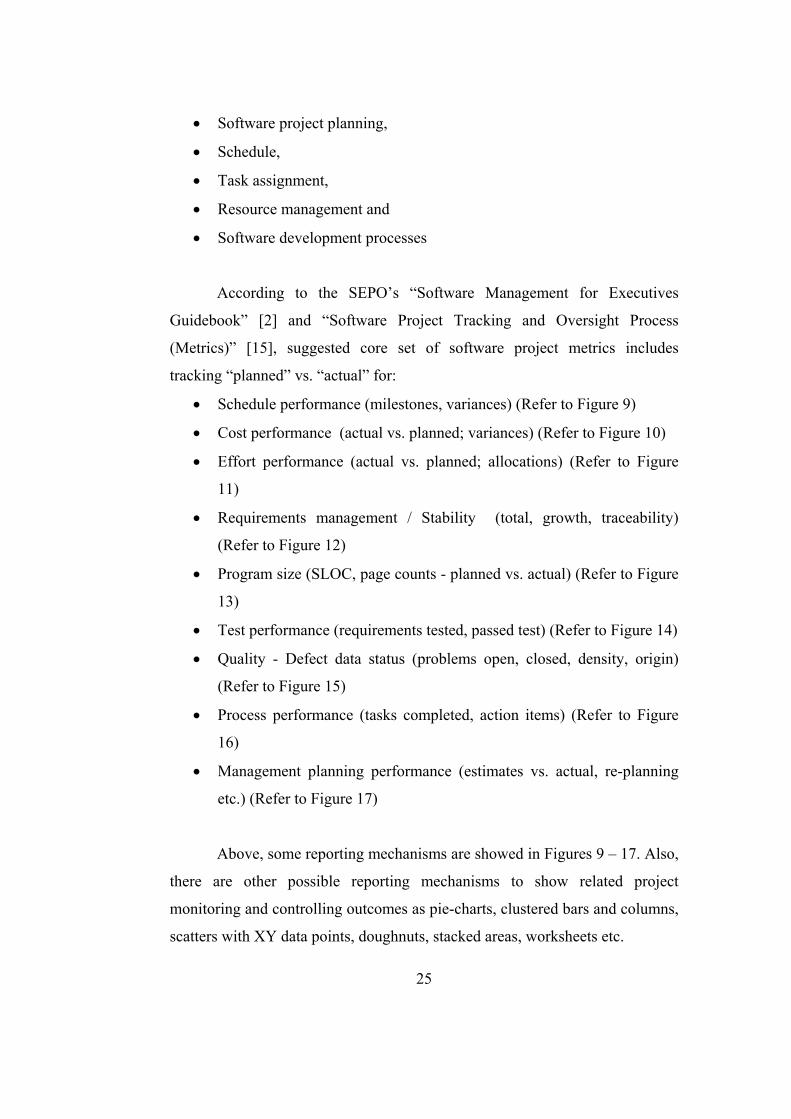
According to the SEPO’s “Software Management for Executives
Guidebook” [2] and “Software Project Tracking and Oversight Process
(Metrics)” [15], suggested core set of software project metrics includes
tracking “planned” vs. “actual” for:
• Schedule performance (milestones, variances) (Refer to Figure 9)
• Cost performance (actual vs. planned; variances) (Refer to Figure 10)
• Effort performance (actual vs. planned; allocations) (Refer to Figure
11)
• Requirements management / Stability (total, growth, traceability)
(Refer to Figure 12)
• Program size (SLOC, page counts - planned vs. actual) (Refer to Figure
13)
• Test performance (requirements tested, passed test) (Refer to Figure 14)
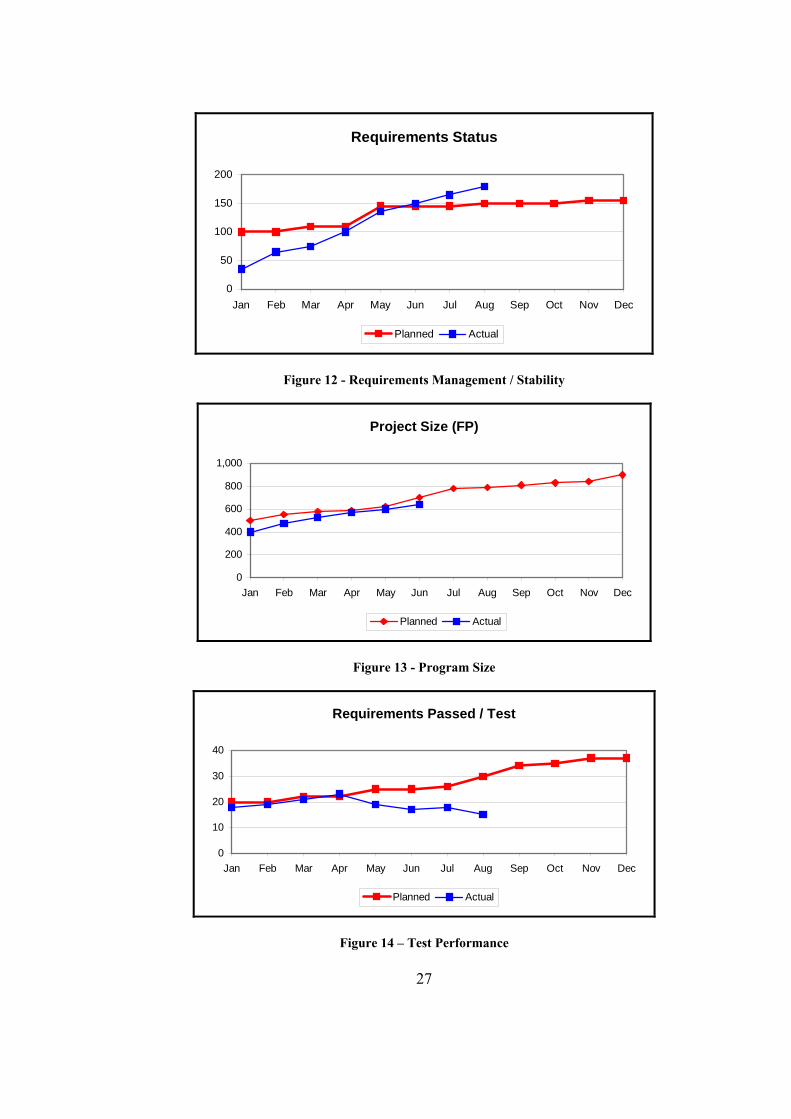
• Quality - Defect data status (problems open, closed, density, origin)
(Refer to Figure 15)
• Process performance (tasks completed, action items) (Refer to Figure
16)
• Management planning performance (estimates vs. actual, re-planning
etc.) (Refer to Figure 17)
Above, some reporting mechanisms are showed in Figures 9 – 17. Also,
there are other possible reporting mechanisms to show related project
monitoring and controlling outcomes as pie-charts, clustered bars and columns,
scatters with XY data points, doughnuts, stacked areas, worksheets etc.
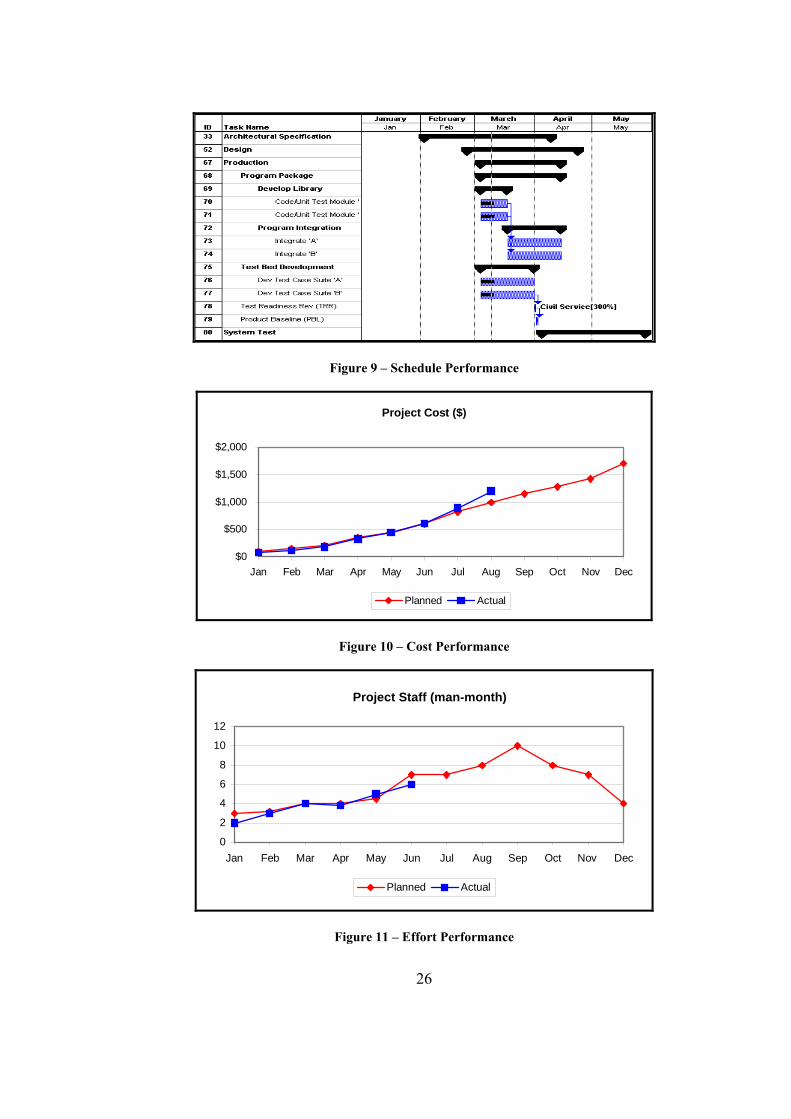
Figure 9 – Schedule Performance
Project Cost ($)
$0
$500
$1,000
$1,500
$2,000
Jan Feb Mar Apr May Jun Jul Aug Sep Oct Nov Dec
Planned Actual
Figure 10 – Cost Performance
Project Staff (man-month)
0
2
4
6
8
10
12
Jan Feb Mar Apr May Jun Jul Aug Sep Oct Nov Dec
Planned Actual
Figure 11 – Effort Performance
26
Requirements Status
0
50
100
150
200
Jan Feb Mar Apr May Jun Jul Aug Sep Oct Nov Dec
Planned Actual
Figure 12 - Requirements Management / Stability
Project Size (FP)
0
200
400
600
800
1,000
Jan Feb Mar Apr May Jun Jul Aug Sep Oct Nov Dec
Planned Actual
Figure 13 - Program Size
Requirements Passed / Test
0
10
20
30
40
Jan Feb Mar Apr May Jun Jul Aug Sep Oct Nov Dec
Planned Actual
27
Figure 14 – Test Performance
SPRs Status
020406080
100120
Jul Aug Sep Oct Nov Dec Jan Feb Mar Apr May Jun
Closed Total
Figure 15 – Quality – Defect Data Status
Action Items Status
020406080
100120
Jul Aug Sep Oct Nov Dec Jan Feb Mar Apr May Jun
Closed Open
Figure 16 – Process Performance
Project Risks Status (1-Low 5-High)
0
1
2
3
4
5
6
Jul Aug Sep Oct Nov Dec Jan Feb Mar Apr May Jun
Estimated Actual
Figure 17 – Management Planning Performance
28
29
Project Management metrics collected should be used to support four
functions of management:
• Planning,
• Organizing,
• Controlling and
• Monitoring
For monitoring the performance of a project, needed project
management metrics are addressed in IEEE Standard [8], are given as a set:
• Schedule and progress metrics
• Resources and cost metrics
• Growth and stability metrics
• Product quality metrics
• Development performance metrics
• Technical adequacy metrics
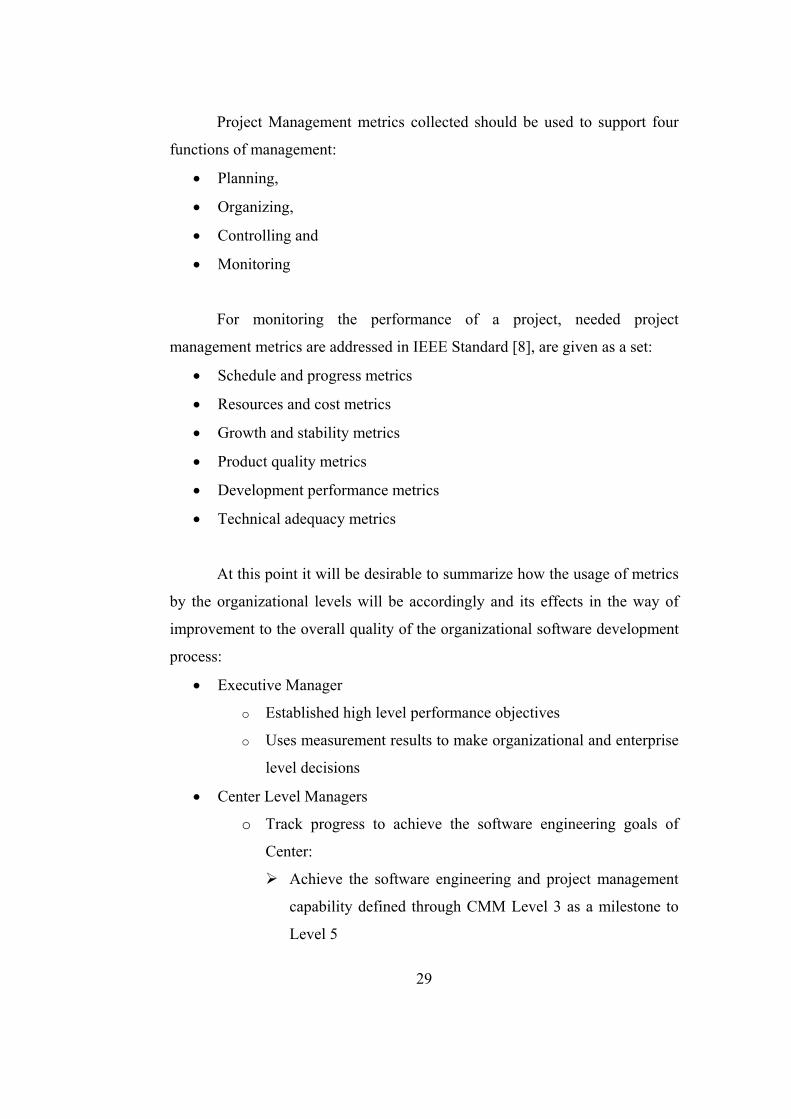
At this point it will be desirable to summarize how the usage of metrics
by the organizational levels will be accordingly and its effects in the way of
improvement to the overall quality of the organizational software development
process:
• Executive Manager
o Established high level performance objectives
o Uses measurement results to make organizational and enterprise
level decisions
• Center Level Managers
o Track progress to achieve the software engineering goals of
Center:
Achieve the software engineering and project management
capability defined through CMM Level 3 as a milestone to
Level 5
30
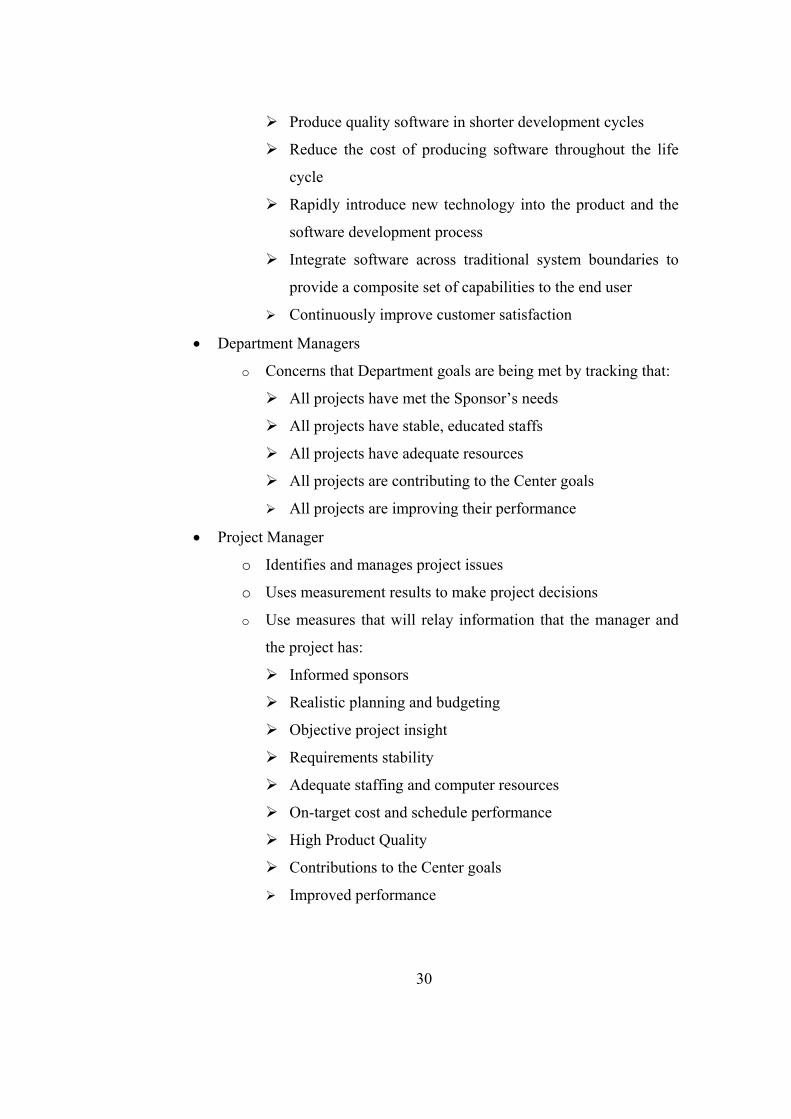
Produce quality software in shorter development cycles
Reduce the cost of producing software throughout the life
cycle
Rapidly introduce new technology into the product and the
software development process
Integrate software across traditional system boundaries to
provide a composite set of capabilities to the end user
Continuously improve customer satisfaction
• Department Managers
o Concerns that Department goals are being met by tracking that:
All projects have met the Sponsor’s needs
All projects have stable, educated staffs
All projects have adequate resources
All projects are contributing to the Center goals
All projects are improving their performance
• Project Manager
o Identifies and manages project issues
o Uses measurement results to make project decisions
o Use measures that will relay information that the manager and
the project has:
Informed sponsors
Realistic planning and budgeting
Objective project insight
Requirements stability
Adequate staffing and computer resources
On-target cost and schedule performance
High Product Quality
Contributions to the Center goals
Improved performance
31
• Measurement Analyst
o Tailors measures to address program issues
o Collects and analyses measurement data and reports results
• Development Team
o Uses measurement results in software engineering efforts
o Provides measurement data
Finally, some difficulties are going to arise when implementing this
kind of a metrics program and trying managing the software projects,
controlling and monitoring them. Below list is the possible challenging points
faced during “software project management with usage of metrics” process as
mentioned in [13], [16], and [12]:
• Lack of Management Commitment
• Measuring Too Much, Too Soon
• Measuring Too Little, Too Late
• Measuring the Wrong Things
• Imprecise Metrics Definitions
• Using Metrics Data to Evaluate Individuals
• Using Metrics to Motivate, Rather than to Understand
• Collecting Data That Is Not Used
• Lack of Communication and Training
• Misinterpreting Metrics Data
2.5 Goal – Question – Metric (GQM) Approach
Metrics Framework is a decision aid used for organizing, selecting,
communicating, and evaluating the required quality attributes for a software
system; a hierarchical breakdown of quality factors, quality sub-factors, and
metrics for a software system [8]. GQM Approach is also used for determining
the set of metrics used in this project. In this study, this approach is
implemented in a private software company to determine the set of project
32
metrics Details of GQM Approach applied in this project are given in Section 3
of this thesis work.
2.6 Comparison of Tools
Satisfying project management needs in software projects is not an easy
asset and couldn’t be easily done with usage of a single tool since there is not a
“silver bullet” single tool that supports all the software project management
efforts. There are several project planning, project monitoring, risk
management, and some metrics collection tools to be used in projects.
There is not a single tool to be shown as the solution to these entire
project areas, so a functionality definition is needed to determine the range of
research for this kind of tools. Functionality of two kinds of tools is chosen to
satisfy the need, CAME Tools and Universal Metrics Tools.
o “CAME Tools” (“Computer Assisted Software Measurement
and Evaluation Tools”) are tools for the support of the
measurement process. CAME Tools are tools for modelling and
determining the metrics of software development components
referring to the process, product and resources with
functionalities of model-based software components analysis,
metrics application, presentation of measurement results,
statistical analysis and evaluation [7].
o “Universal Metrics Tools”, is designed to support metrics work
and focus on data gathering, analysis, and reporting. It should
provide “a flexible user interface that enables data entry and
facilitates its integration with an existing automation
environment to make data gathering more accurate and
efficient”, “a wide variety of algorithms or standard models
used in data and metrics analysis and that support many types of
metrics”, and most importantly “a flexible, tabular, and
graphics-oriented report generation capability with several
33
standard reports and the capability to customize the standard
reports or develop new reports”. In this article it mentions that
for a tool to be classified a universal metrics tool, then it should
maintain these functionalities for at least three kind of metrics
type [17].
As a result, set of tools to be analysed should be included in the set of
“CAME Tools” or “Universal Metrics Tools” that are mainly used for
monitoring and controlling of a software project.
CAME tools or Universal Metric tools investigated have metrics
gathering, analysis and reporting in their natural content and POMMES should
have similar design and logic. In this viewpoint, CAME or Universal Metric
tools, which support project management, monitoring and control activities, are
examined and their functional and operational features are presented in the
following pages. Chosen tools, and related functional and operational features
of the selected for this research are as follows.
ASC Risk Radar (with Project Panel) [18],
WIPS [19],
Intermediate [9],
SSPA [20],
HSS Web Based Project Metrics Collection and Analysis Tool [21],
DEC - VAX Software Productivity Tools Package [22],
TychoMetrics [23],
SLIM – Suite (SLIM – Metrics, SLIM – DataManager, SLIM –
Control) [24],
Mercury Project Management [25],
SPC Estimate [26],
SEER-SEM (with SEER-SEM Client) [27],
eProject [28],
DSPMTool [29],
34
Visibility Project Workbench [30],
Rational ProjectConsole [31],
Cognos Metrics Manager [32],
Aimware Project Manager [33],
Primavera SureTrak Project Manager [34]
ASC Risk Radar (with Project Panel): A risk management,
monitoring and control tool that helps program and project managers at all
levels, in all industries, and in all project types, quickly categorize, prioritise,
track, report, and manage their project risk. It uses metrics to manage both
program risks as well as the risk management program. Risk Radar enables risk
communication across all projects levels and provides managers with the
visibility and risk information they need for timely and educated decision-
making. Risk Radar will help you organize and manage your project risk data,
which is vital to controlling your project’s cost, schedule, and overall success.
Because our tool is easy to install and use, your can immediately begin
identifying, analysing, prioritising, reporting, and effectively managing your
project risk. Risk Radar is a Microsoft Access database application that helps
project managers to identify, prioritise, and communicate project risks in a
flexible and easy-to-use form. Risk Radar provides standard database functions
to add, update, and delete risks, together with the following specialized
functions for managing risks: Functions to modify the Project information,
including the Project Title, Start/End dates, and category definitions, Entry of
the entire set of risk record information, Entry of a subset of risk record
information, View of the complete risk level distribution (high, medium, or
low) and the distribution of the risks level over the impact horizon, Functions
to automatically and manually prioritise the risks in relation to each other,
Detailed and summary risk reports that can be filtered by Risk Exposure, Risk
Rank, and Risk Level, View into all the risks that have been retired, and allows
the re-incorporation of the retired risks into the active risk set, Functions to
35
import risks record data from other Risk Radar application databases, Exports
all the stored mitigation steps into a MS Project compatible text file that can be
directly imported into a MS Project schedule.
The Project Control Panel is a concept and a tool that enables project
managers to quickly and clearly monitor project status. Crucial metrics data is
displayed on easy to read gauges that provide a means of predicting future
project health and facilitate timely corrective actions, if required. The Project
Control Panel helps project managers keep their projects on course, as
fundamental metrics data is regularly updated. The panel gauges display key
project management metrics data measured against customisable thresholds,
including:
• Earned value
• Productivity Quality gate or milestone completion
• Requirements change
• Configuration change
• Staff turnover
• Staff overtime hours
• Defect tracking - requirements, design, code, and test
• Risk exposure
• Risk reserve (funding) status
WIPS: A web-based (client/server architecture) inspection and data
collection tool that collects the inspection data mainly for monitoring,
controlling, and improving software inspections. Users access a database for
storing an inspection data by usage of forms, and determine and log the
inspection data (e.g. effort, defect) related information, such as classes, type,
and locations etc. knowledge to be shared with other users. Then, inspection
“participants” (as stated in the paper) analyse the inspection data to produce
knowledgeable value for usage of all development team and the top
management.
36
Intermediate: A data collection tool that serves both as an intermediate
level between third party tools for the integration of different tools’ data and
also support definition of new metrics in the context of the tool so the user is
not limited with the collected metrics from other tools. Tool gives the
flexibility to the user to be able to collect metrics from commercial
measurement tools, third-part applications or directly from databases itself,
independent of metrics collection method used by these vendor’s tools. One of
the most important feature of the tool is to provide automatic data collection;
that is metrics collection can be scheduled by the user and when the time
comes, tool automatically starts the data collection process and the relevant
metrics are collected as defined by the user. Usage of the tool results in such a
metrics pool that user can check and monitor all of the project’s metrics from a
single interface. Very unique feature, the output in these interface for
monitoring the metrics are all given in a single format by the tool so there is no
need to make extra work to maintain a single format after collecting the
metrics; toll is handling this process.
SSPA (Software Project Planning Associate): A web-based three–tier
architecture software project planning and tracking tool that is planned to be
used by project managers for initialising / refining / improving project plans,
organizing, staffing, scheduling, measuring, visualizing, controlling, tracking,
predicting, and data collecting. SSPA contains intelligent agents that track
activities to assure compliance with planning milestones. The project objects,
attributes, relationships, and properties are stored in the IBM DB2 relational
database. All rules and facts for agents are stored as object attributes in the
database, and as the software project is proceeding, project data are gathered
and stored in the plan, organization, work breakdown structure and software
product database. Related intelligent agents are dynamically fired and show the
status of the project to the project manager, team leader and the relevant
developers.
37
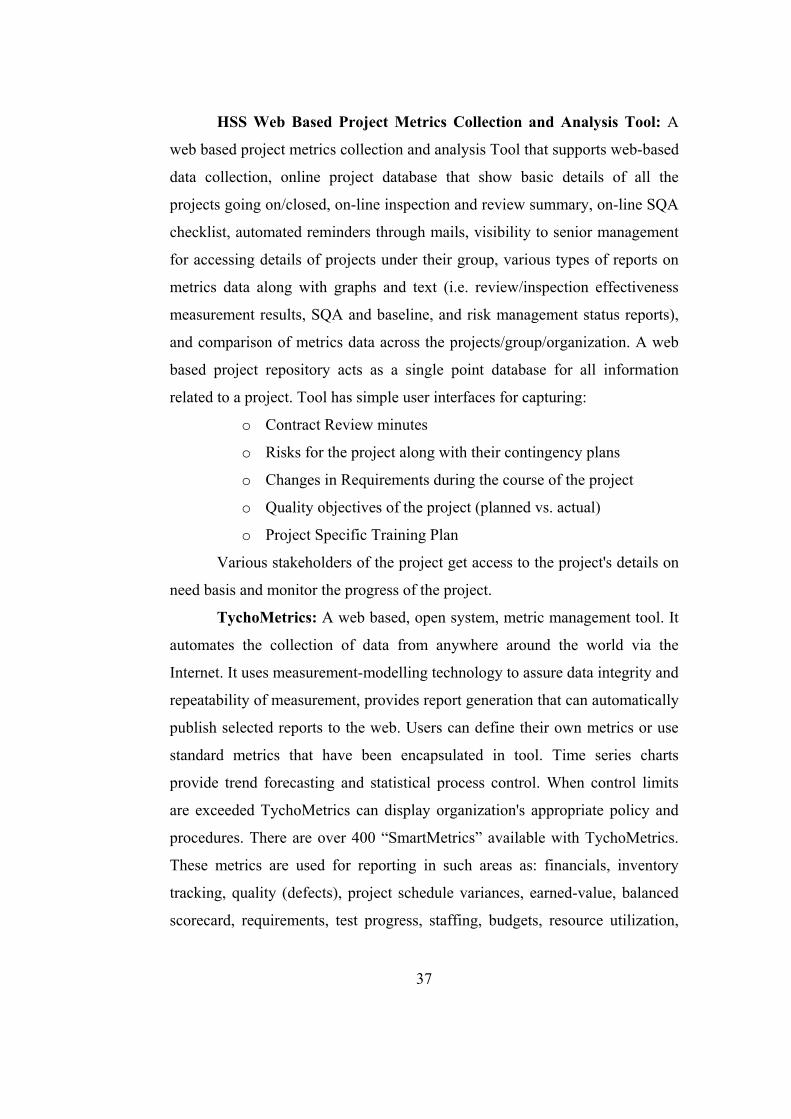
HSS Web Based Project Metrics Collection and Analysis Tool: A
web based project metrics collection and analysis Tool that supports web-based
data collection, online project database that show basic details of all the
projects going on/closed, on-line inspection and review summary, on-line SQA
checklist, automated reminders through mails, visibility to senior management
for accessing details of projects under their group, various types of reports on
metrics data along with graphs and text (i.e. review/inspection effectiveness
measurement results, SQA and baseline, and risk management status reports),
and comparison of metrics data across the projects/group/organization. A web
based project repository acts as a single point database for all information
related to a project. Tool has simple user interfaces for capturing:
o Contract Review minutes
o Risks for the project along with their contingency plans
o Changes in Requirements during the course of the project
o Quality objectives of the project (planned vs. actual)
o Project Specific Training Plan
Various stakeholders of the project get access to the project's details on
need basis and monitor the progress of the project.
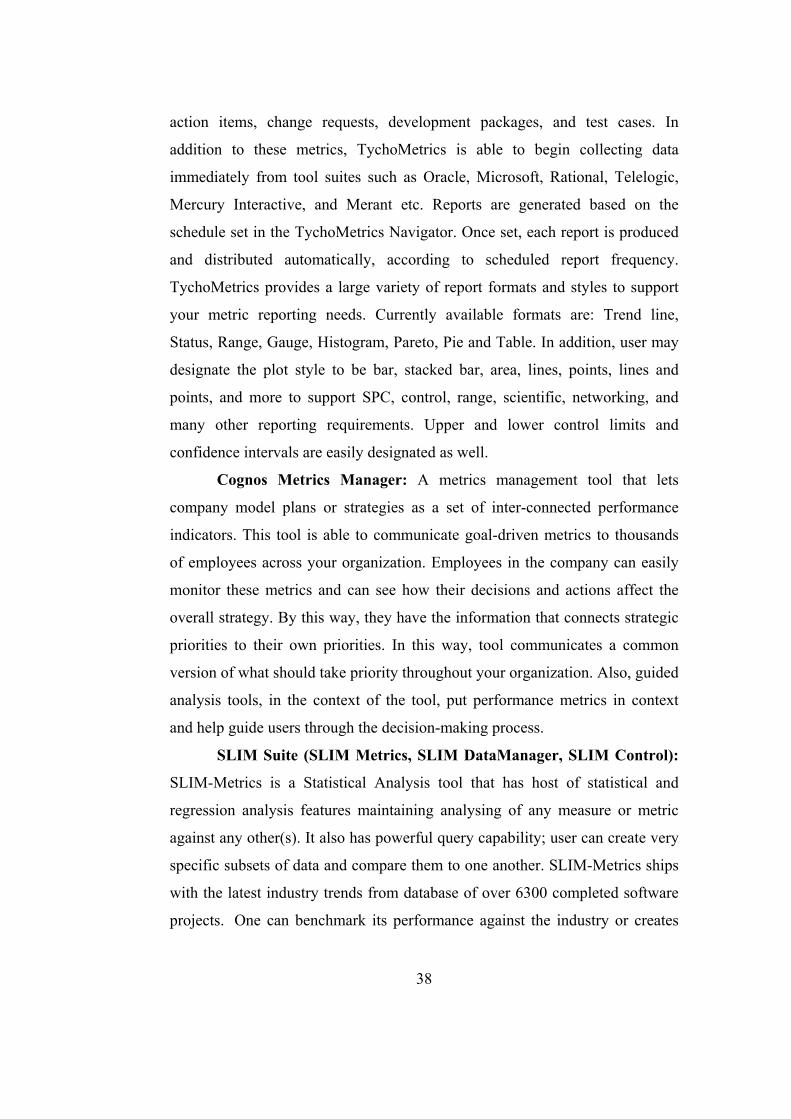
TychoMetrics: A web based, open system, metric management tool. It
automates the collection of data from anywhere around the world via the
Internet. It uses measurement-modelling technology to assure data integrity and
repeatability of measurement, provides report generation that can automatically
publish selected reports to the web. Users can define their own metrics or use
standard metrics that have been encapsulated in tool. Time series charts
provide trend forecasting and statistical process control. When control limits
are exceeded TychoMetrics can display organization's appropriate policy and
procedures. There are over 400 “SmartMetrics” available with TychoMetrics.
These metrics are used for reporting in such areas as: financials, inventory
tracking, quality (defects), project schedule variances, earned-value, balanced
scorecard, requirements, test progress, staffing, budgets, resource utilization,
38
action items, change requests, development packages, and test cases. In
addition to these metrics, TychoMetrics is able to begin collecting data
immediately from tool suites such as Oracle, Microsoft, Rational, Telelogic,
Mercury Interactive, and Merant etc. Reports are generated based on the
schedule set in the TychoMetrics Navigator. Once set, each report is produced
and distributed automatically, according to scheduled report frequency.
TychoMetrics provides a large variety of report formats and styles to support
your metric reporting needs. Currently available formats are: Trend line,
Status, Range, Gauge, Histogram, Pareto, Pie and Table. In addition, user may
designate the plot style to be bar, stacked bar, area, lines, points, lines and
points, and more to support SPC, control, range, scientific, networking, and
many other reporting requirements. Upper and lower control limits and
confidence intervals are easily designated as well.
Cognos Metrics Manager: A metrics management tool that lets
company model plans or strategies as a set of inter-connected performance
indicators. This tool is able to communicate goal-driven metrics to thousands
of employees across your organization. Employees in the company can easily
monitor these metrics and can see how their decisions and actions affect the
overall strategy. By this way, they have the information that connects strategic
priorities to their own priorities. In this way, tool communicates a common
version of what should take priority throughout your organization. Also, guided
analysis tools, in the context of the tool, put performance metrics in context
and help guide users through the decision-making process.
SLIM Suite (SLIM Metrics, SLIM DataManager, SLIM Control):
SLIM-Metrics is a Statistical Analysis tool that has host of statistical and
regression analysis features maintaining analysing of any measure or metric
against any other(s). It also has powerful query capability; user can create very
specific subsets of data and compare them to one another. SLIM-Metrics ships
with the latest industry trends from database of over 6300 completed software
projects. One can benchmark its performance against the industry or creates
39
his/her own performance trends to establish a baseline for productivity
assessments.
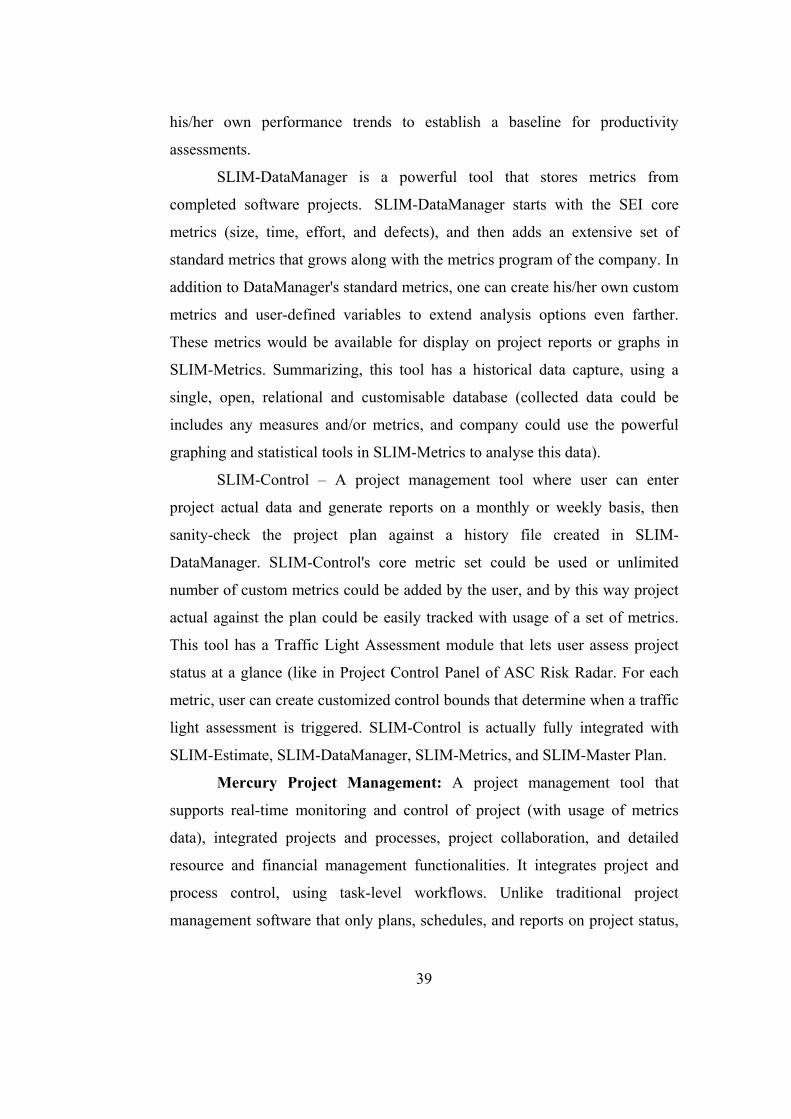
SLIM-DataManager is a powerful tool that stores metrics from
completed software projects. SLIM-DataManager starts with the SEI core
metrics (size, time, effort, and defects), and then adds an extensive set of
standard metrics that grows along with the metrics program of the company. In
addition to DataManager's standard metrics, one can create his/her own custom
metrics and user-defined variables to extend analysis options even farther.
These metrics would be available for display on project reports or graphs in
SLIM-Metrics. Summarizing, this tool has a historical data capture, using a
single, open, relational and customisable database (collected data could be
includes any measures and/or metrics, and company could use the powerful
graphing and statistical tools in SLIM-Metrics to analyse this data).
SLIM-Control – A project management tool where user can enter
project actual data and generate reports on a monthly or weekly basis, then
sanity-check the project plan against a history file created in SLIM-
DataManager. SLIM-Control's core metric set could be used or unlimited
number of custom metrics could be added by the user, and by this way project
actual against the plan could be easily tracked with usage of a set of metrics.
This tool has a Traffic Light Assessment module that lets user assess project
status at a glance (like in Project Control Panel of ASC Risk Radar. For each
metric, user can create customized control bounds that determine when a traffic
light assessment is triggered. SLIM-Control is actually fully integrated with
SLIM-Estimate, SLIM-DataManager, SLIM-Metrics, and SLIM-Master Plan.
Mercury Project Management: A project management tool that
supports real-time monitoring and control of project (with usage of metrics
data), integrated projects and processes, project collaboration, and detailed
resource and financial management functionalities. It integrates project and
process control, using task-level workflows. Unlike traditional project
management software that only plans, schedules, and reports on project status,
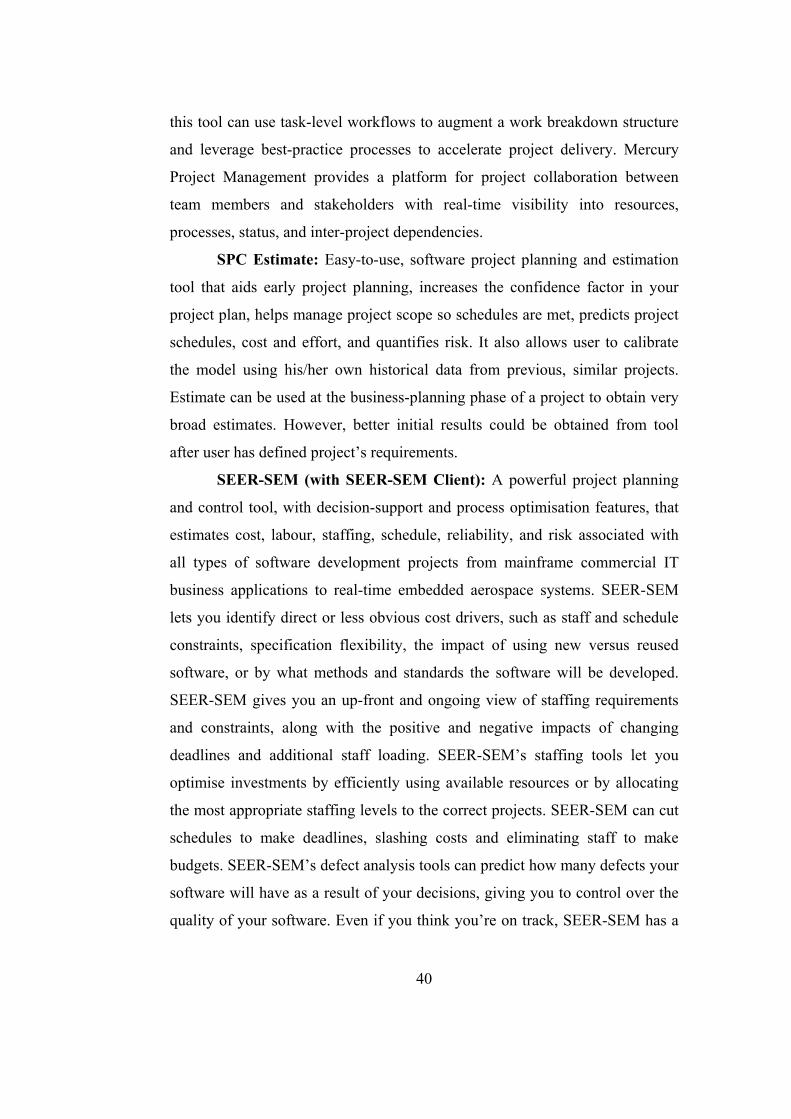
40
this tool can use task-level workflows to augment a work breakdown structure
and leverage best-practice processes to accelerate project delivery. Mercury
Project Management provides a platform for project collaboration between
team members and stakeholders with real-time visibility into resources,
processes, status, and inter-project dependencies.
SPC Estimate: Easy-to-use, software project planning and estimation
tool that aids early project planning, increases the confidence factor in your
project plan, helps manage project scope so schedules are met, predicts project
schedules, cost and effort, and quantifies risk. It also allows user to calibrate
the model using his/her own historical data from previous, similar projects.
Estimate can be used at the business-planning phase of a project to obtain very
broad estimates. However, better initial results could be obtained from tool
after user has defined project’s requirements.
SEER-SEM (with SEER-SEM Client): A powerful project planning
and control tool, with decision-support and process optimisation features, that
estimates cost, labour, staffing, schedule, reliability, and risk associated with
all types of software development projects from mainframe commercial IT
business applications to real-time embedded aerospace systems. SEER-SEM
lets you identify direct or less obvious cost drivers, such as staff and schedule
constraints, specification flexibility, the impact of using new versus reused
software, or by what methods and standards the software will be developed.
SEER-SEM gives you an up-front and ongoing view of staffing requirements
and constraints, along with the positive and negative impacts of changing
deadlines and additional staff loading. SEER-SEM’s staffing tools let you
optimise investments by efficiently using available resources or by allocating
the most appropriate staffing levels to the correct projects. SEER-SEM can cut
schedules to make deadlines, slashing costs and eliminating staff to make
budgets. SEER-SEM’s defect analysis tools can predict how many defects your
software will have as a result of your decisions, giving you to control over the
quality of your software. Even if you think you’re on track, SEER-SEM has a
41
colour-coded system that will tell you when your variables are out of the norm,
helping you to spot troublesome situations early. You can then identify and
evaluate options and alternatives so your project stays on track and on budget.
SEER-SEM Client is a software project-planning tool for Microsoft
Project, and used together with the SEER-SEM. SEER-SEM transforms
Microsoft Project into a powerful tool for planning software development
projects with the SEER-SEM Client. SEER-SEM Client enables you to start
with a realistic plan, staff more efficiently, and share planning knowledge by
fully integrating SEER-SEM with Microsoft Project.
DEC - VAX Software Productivity Tools Package: A data collection
and measurement tool to support project development efforts that actually
helps improvement of the project monitoring and controlling efforts. Data is
collected from areas of Communications, Editors and Documentation, Project
Complexity Management, and Code Maintenance tools of VAX Software
Package. Mainly productivity measurements are made, and software system
metrics, and software development process metrics are gathered. Since
collected data would be from parts of the project infrastructure that are using
these tools, common language and common libraries of VAX product is used
and this would make data collection process more quick, correct and so more
efficient. With the recycling of the data collected from software productivity
tools as metrics to the other tools used in the development phases, management
of the software projects is done more efficiently and easily and as a result the
complete VAX package product maintains improvement in the quality. As final
words, it should be mentioned that by usage of this product suite, a huge
historical metrics database is formed in the company.
eProject: A web based tool that supports creating collaborative work
spaces for project teams, departments, and work groups, customisability
according to your unique business processes, and providing project
shareholders accurate, real-time visibility to cross-project data. Mainly five
parts of the suite are very similar to the aim of the thesis: Project Management
42
(View and share project information in real-time, Task scheduling with Drag-
and-Drop-Gantt charts, Critical path, summary tasks, predecessors and
milestones, Time and expense tracking for actual versus budgeted, Project
templates for sharing best practices), Portfolio Management (Align projects
with strategic initiatives and business objectives, Hierarchical view of
workspaces, Status roll-up of data and graphs, Investment mapping,
scorecards), Resource Management (Manage individual, workgroup, program,
and enterprise wide resources, Enterprise resource pool to view team
allocation, View resource allocation across projects, Assign skills to resource
pool members), Dashboards (Consolidate critical information across projects
into a personalized dashboard view, Cross project summaries, Project health
status indicators, Tasks and issues lists), Reporting (Get summary reports of all
projects across the organization, Pre-configured reports for most reporting
needs, Customized reports for unique project information, Cross-project
reporting).
Rational ProjectConsole: A project monitoring and control tool that
is also distributed as a part of IBM Rational Suite. Rational ProjectConsole
makes it easy to monitor the status of development projects, and utilize
objective metrics to improve project predictability. Rational ProjectConsole
greatly simplifies the process of gathering metrics and reporting project status
by creating a project metrics Web site based on data collected from the user’s
development environment. This Web site, which Rational ProjectConsole
updates on demand or on schedule, gives all team members complete, up-to-
date view of your project environment. Rational ProjectConsole collects
metrics from Rational Suite development platform and also from third-party
products, and presents the results graphically in a customisable format to help
users accurately assess progress and quality.
Aimware Project Manager: A web based project management tool
that coordinates project activities in three primary areas, namely Project
Definition, Project Planning and Project Tracking and Oversight. It provides
43
project management staff, team members and senior management the power to
collaboratively record, analyse and track project data in a way that is easy to
understand. It provides project managers with the insight that will help them
define and execute the definition, planning, and tracking of critical project data,
while providing project team members with a variety of ways to manage and
complete the work that is assigned to them. Project Manager gives the entire
team the ability to electronically share the status and progress of information,
while providing senior management access to the vital data and reports that
they need to make critical business decisions based upon real-time project
information.
Primavera SureTrak Project Manager: A Project Management
Software tool that is ideal for resource planning and control on small- to
medium-sized projects, and could be considered as an applicable solution
mainly for project modelling, scheduling, resource and cost management
activities. User can review the sequence of activities and monitor the
downstream effect of changes and delays on the rest of the project; can
compare actual completion dates and costs with target dates and budget. The
SureTrak Web publishing capability delivers easy access to assignments,
deadlines, and project status, and provides all participants with a better
understanding of their relationship to the entire project. Another future of the
product is to be able to send project, screen captures, and selected activities to
team members via e-mail and also receiver can audit the information for
accuracy, approve it, and automatically merge the updates into the project
schedule of SureTrak that is a considerably important feature.
DSPMTool: A software project management tool (multi-tier
architecture and operates on a TCP/IP layer) that is actually serves as a product
suite but we mainly focus on task and team organizing and management
modules of the tool, which are developed to improve the quality of the software
products. Tool is designed basically on detailed task definitions, and by this
way maintains the planning and monitoring the progress of tasks more
44
efficiently. Then, team members are included into the project database, roles
and pre-defined tasks are assigned to them and they are included in a team.
Progress monitoring on a team and member is made on task basis. Deadlines
could be assigned to the tasks, checkpoints/milestones could be checked, and
monitoring of tasks could be made from the user interface of the tool.
Enforcement of deadlines in a project and keeping user aware of the status of
milestones are maintained through the automated warning and alarm messages
configuration modules of the tool.
Visibility Project Workbench: A project-planning tool that is working
mainly with the logic of developing project data in third party tools and
importing the related project data. Tool provides a set of interfaces to desktop
tools allowing project managers to build and maintain project information in a
graphical, drag-and-drop environment. It provides managers and accountants
familiar with Microsoft Excel, Microsoft Project and other desktop
management tools the ability to import and export project data such as tasks,
budgets, costs, resources and schedules. By linking to Microsoft Project and
other PC-based project management tools, Project Workbench brings the
power of desktop planning tools to project managers, letting them develop
project task, schedule and resource detail, along with the critical path
scheduling, alternate project visualization and report capabilities inherent in
such applications. Fully secured “check-in, check-out” protection assures that
multiple managers do not overwrite each other’s work. Budget entry and
revision is made fast and easy with tool’s interface to Microsoft Excel.
Table 4 and Table 5 are presenting the comparison of these tools
regarding metrics and management functionalities in the following pages.
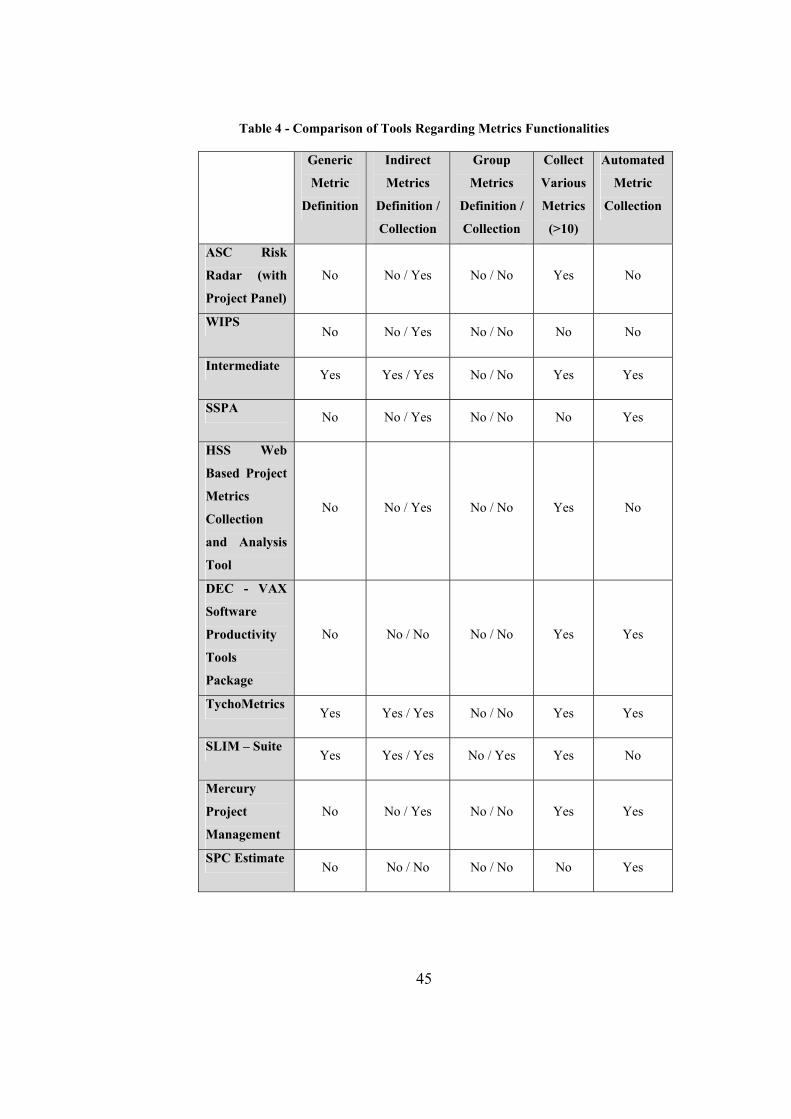
45
Table 4 - Comparison of Tools Regarding Metrics Functionalities
Generic
Metric
Definition
Indirect
Metrics
Definition /
Collection
Group
Metrics
Definition /
Collection
Collect
Various
Metrics
(>10)
Automated
Metric
Collection
ASC Risk
Radar (with
Project Panel)
No No / Yes No / No Yes No
WIPS No No / Yes No / No No No
Intermediate Yes Yes / Yes No / No Yes Yes
SSPA No No / Yes No / No No Yes
HSS Web
Based Project
Metrics
Collection
and Analysis
Tool
No No / Yes No / No Yes No
DEC - VAX
Software
Productivity
Tools
Package
No No / No No / No Yes Yes
TychoMetrics Yes Yes / Yes No / No Yes Yes
SLIM – Suite Yes Yes / Yes No / Yes Yes No
Mercury
Project
Management
No No / Yes No / No Yes Yes
SPC Estimate No No / No No / No No Yes
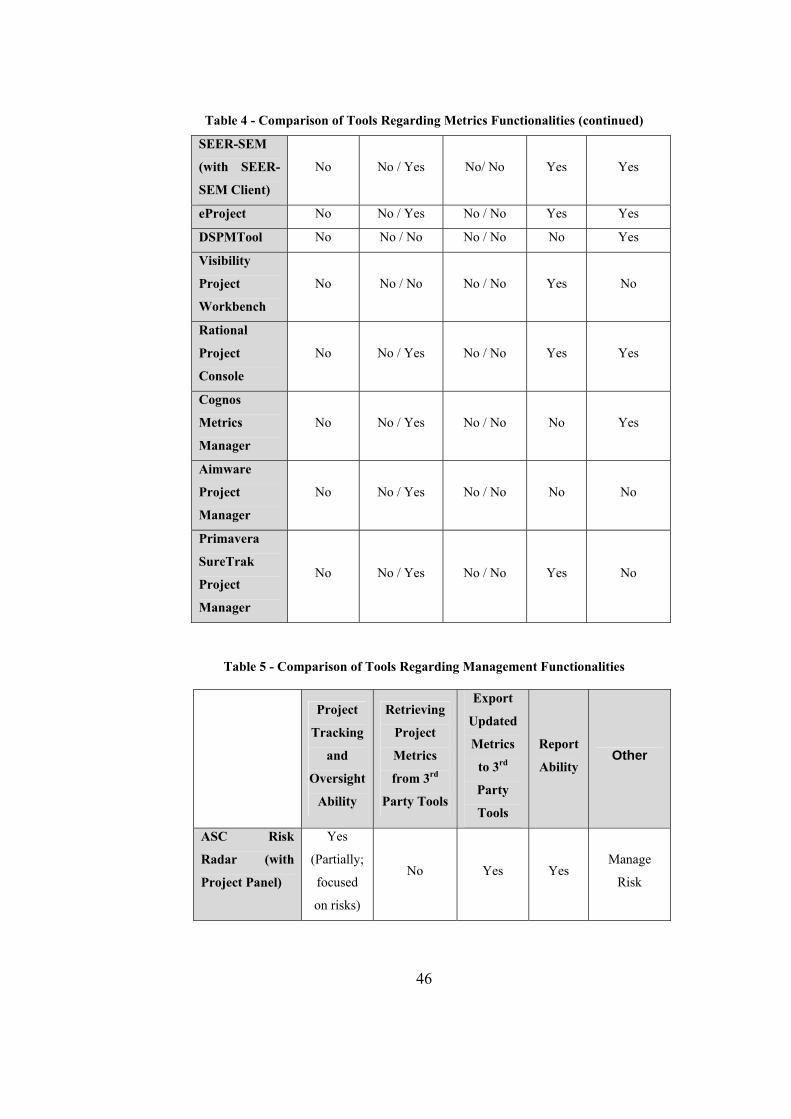
46
Table 4 - Comparison of Tools Regarding Metrics Functionalities (continued)
SEER-SEM
(with SEER-
SEM Client)
No No / Yes No/ No Yes Yes
eProject No No / Yes No / No Yes Yes
DSPMTool No No / No No / No No Yes
Visibility
Project
Workbench
No No / No No / No Yes No
Rational
Project
Console
No No / Yes No / No Yes Yes
Cognos
Metrics
Manager
No No / Yes No / No No Yes
Aimware
Project
Manager
No No / Yes No / No No No
Primavera
SureTrak
Project
Manager
No No / Yes No / No Yes No
Table 5 - Comparison of Tools Regarding Management Functionalities
Project
Tracking
and
Oversight
Ability
Retrieving
Project
Metrics
from 3rd
Party Tools
Export
Updated
Metrics
to 3rd
Party
Tools
Report
Ability Other
ASC Risk
Radar (with
Project Panel)
Yes
(Partially;
focused
on risks)
No Yes Yes Manage
Risk
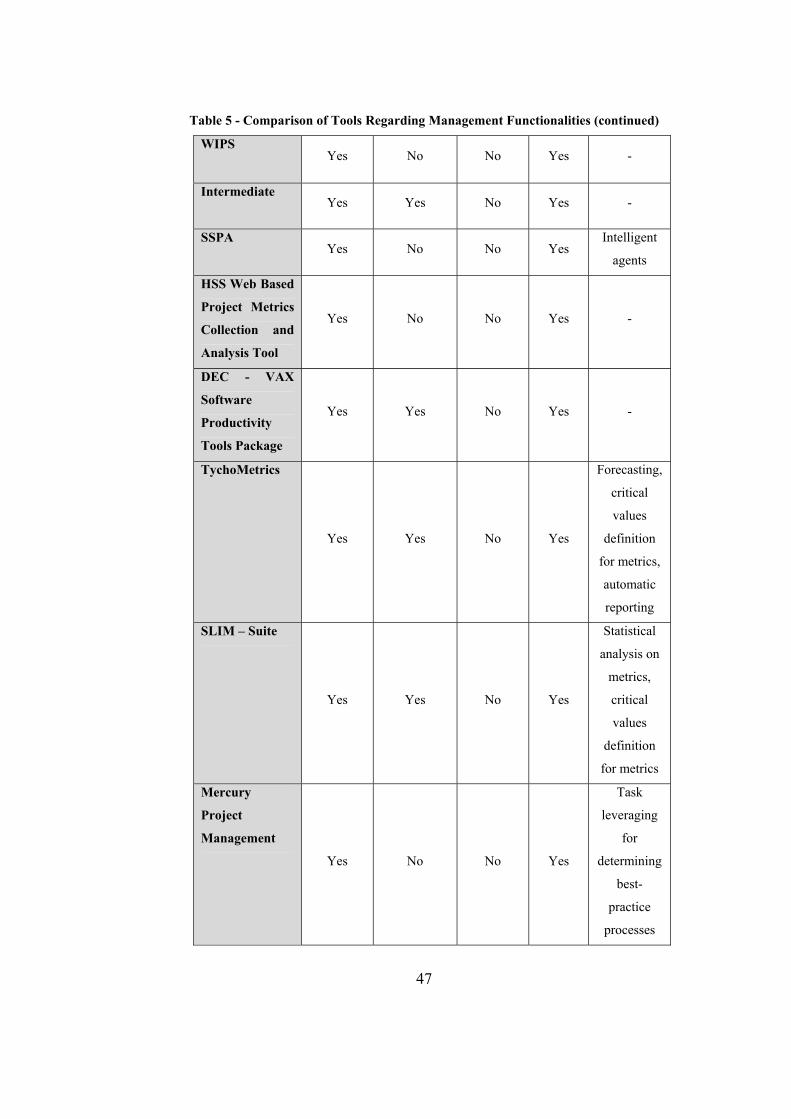
47
Table 5 - Comparison of Tools Regarding Management Functionalities (continued) WIPS
Yes No No Yes -
Intermediate Yes Yes No Yes -
SSPA Yes No No Yes
Intelligent
agents
HSS Web Based
Project Metrics
Collection and
Analysis Tool
Yes No No Yes -
DEC - VAX
Software
Productivity
Tools Package
Yes Yes No Yes -
TychoMetrics
Yes Yes No Yes
Forecasting,
critical
values
definition
for metrics,
automatic
reporting
SLIM – Suite
Yes Yes No Yes
Statistical
analysis on
metrics,
critical
values
definition
for metrics
Mercury
Project
Management
Yes No No Yes
Task
leveraging
for
determining
best-
practice
processes
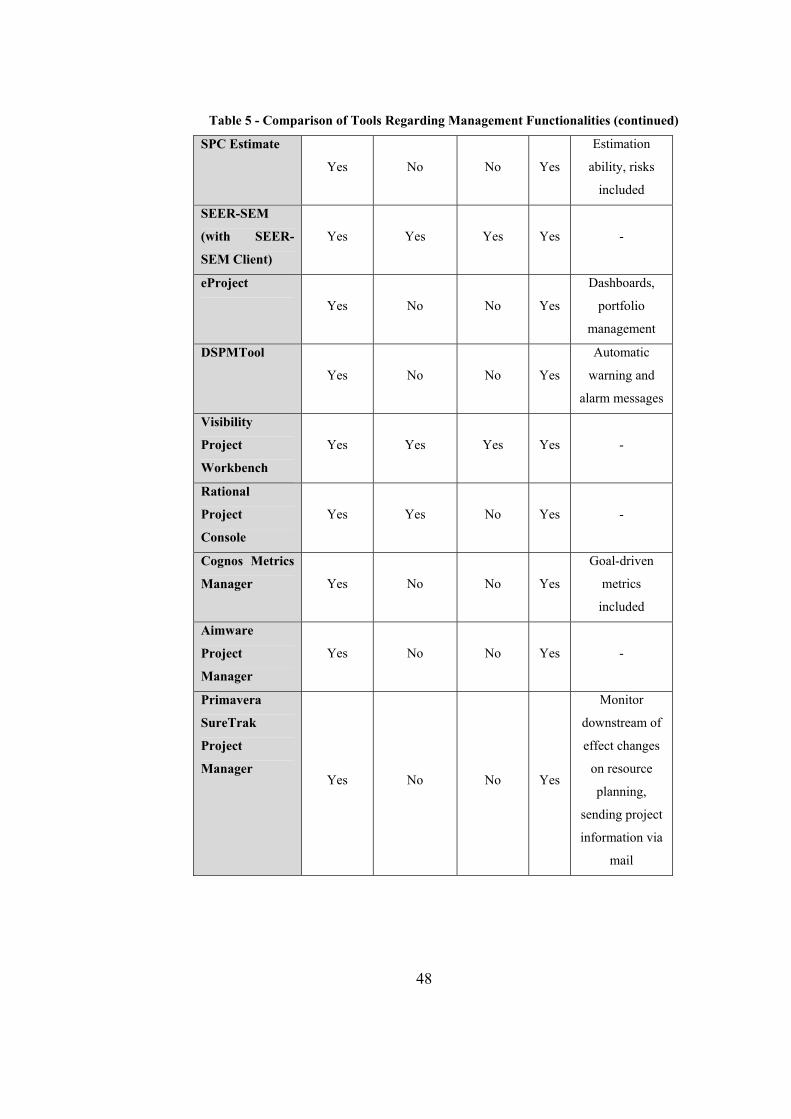
48
Table 5 - Comparison of Tools Regarding Management Functionalities (continued)
SPC Estimate
Yes No No Yes
Estimation
ability, risks
included
SEER-SEM
(with SEER-
SEM Client)
Yes Yes Yes Yes -
eProject
Yes No No Yes
Dashboards,
portfolio
management
DSPMTool
Yes No No Yes
Automatic
warning and
alarm messages
Visibility
Project
Workbench
Yes Yes Yes Yes -
Rational
Project
Console
Yes Yes No Yes -
Cognos Metrics
Manager Yes No No Yes
Goal-driven
metrics
included
Aimware
Project
Manager
Yes No No Yes -
Primavera
SureTrak
Project
Manager Yes No No Yes
Monitor
downstream of
effect changes
on resource
planning,
sending project
information via
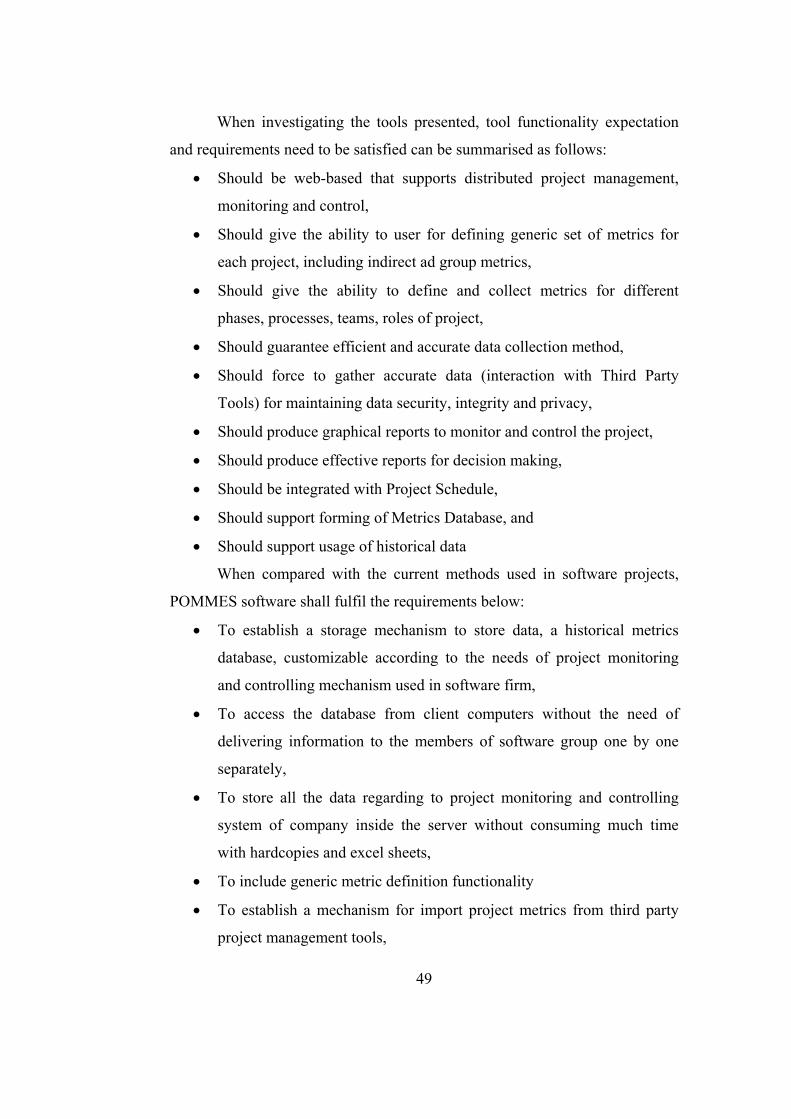
49
When investigating the tools presented, tool functionality expectation
and requirements need to be satisfied can be summarised as follows:
• Should be web-based that supports distributed project management,
monitoring and control,
• Should give the ability to user for defining generic set of metrics for
each project, including indirect ad group metrics,
• Should give the ability to define and collect metrics for different
phases, processes, teams, roles of project,
• Should guarantee efficient and accurate data collection method,
• Should force to gather accurate data (interaction with Third Party
Tools) for maintaining data security, integrity and privacy,
• Should produce graphical reports to monitor and control the project,
• Should produce effective reports for decision making,
• Should be integrated with Project Schedule,
• Should support forming of Metrics Database, and
• Should support usage of historical data
When compared with the current methods used in software projects,
POMMES software shall fulfil the requirements below:
• To establish a storage mechanism to store data, a historical metrics
database, customizable according to the needs of project monitoring
and controlling mechanism used in software firm,
• To access the database from client computers without the need of
delivering information to the members of software group one by one
separately,
• To store all the data regarding to project monitoring and controlling
system of company inside the server without consuming much time
with hardcopies and excel sheets,
• To include generic metric definition functionality
• To establish a mechanism for import project metrics from third party
project management tools,
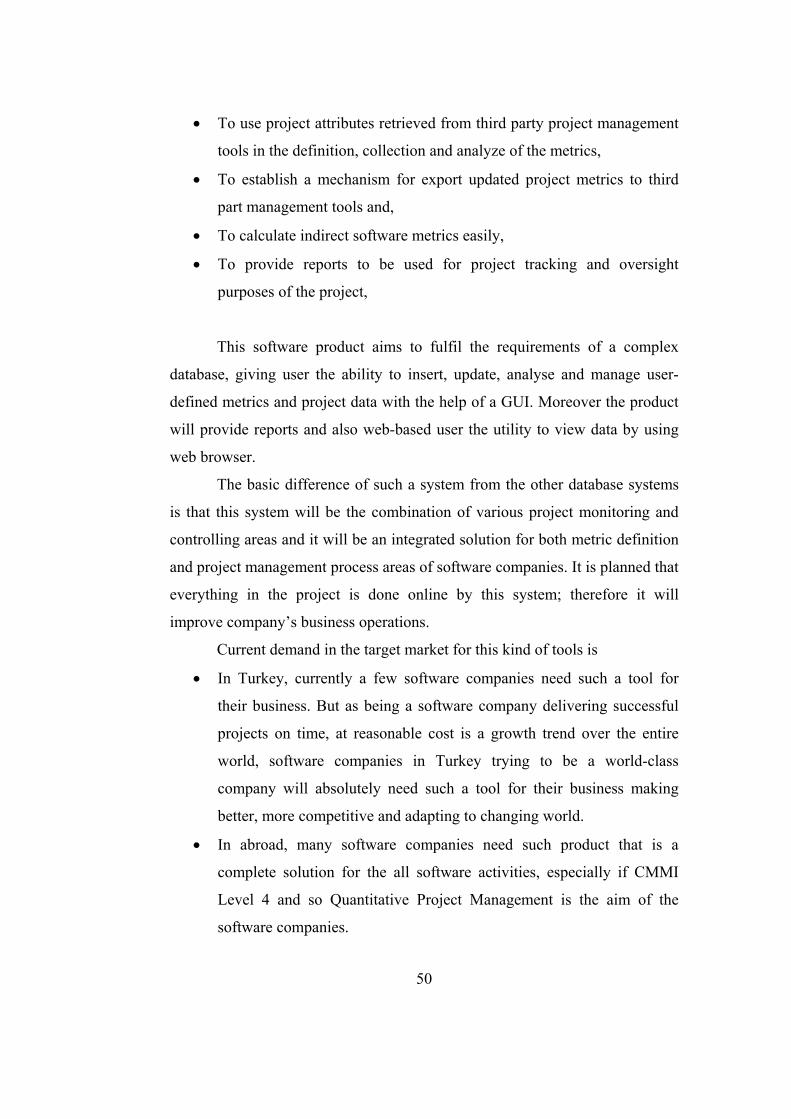
50
• To use project attributes retrieved from third party project management
tools in the definition, collection and analyze of the metrics,
• To establish a mechanism for export updated project metrics to third
part management tools and,
• To calculate indirect software metrics easily,
• To provide reports to be used for project tracking and oversight
purposes of the project,
This software product aims to fulfil the requirements of a complex
database, giving user the ability to insert, update, analyse and manage user-
defined metrics and project data with the help of a GUI. Moreover the product
will provide reports and also web-based user the utility to view data by using
web browser.
The basic difference of such a system from the other database systems
is that this system will be the combination of various project monitoring and
controlling areas and it will be an integrated solution for both metric definition
and project management process areas of software companies. It is planned that
everything in the project is done online by this system; therefore it will
improve company’s business operations.
Current demand in the target market for this kind of tools is
• In Turkey, currently a few software companies need such a tool for
their business. But as being a software company delivering successful
projects on time, at reasonable cost is a growth trend over the entire
world, software companies in Turkey trying to be a world-class
company will absolutely need such a tool for their business making
better, more competitive and adapting to changing world.
• In abroad, many software companies need such product that is a
complete solution for the all software activities, especially if CMMI
Level 4 and so Quantitative Project Management is the aim of the
software companies.
51
CHAPTER 3
SOFTWARE PROJECT METRICS
As with any engineering discipline, measurement is a key factor for
software engineering, for managing and improving the software development
process. Measurement must be defined in a top-down fashion to focus on goals
and models. A bottom-up approach would not work because there are many
observable characteristics in software (e.g., time, number of defects,
complexity, lines of code, severity of failures, effort, productivity, defect
density), but which metrics one uses and how one interprets them it is not clear
without the appropriate models and goals to define the context [3].
The Goal Question Metric (GQM) approach is based upon the
assumption that for an organization to measure in a purposeful way it must first
specify the goals for itself and its projects, then it must trace those goals to the
data that are intended to define those goals operationally, and finally provide a
framework for interpreting the data with respect to the stated goals [3]. GQM
Approach can be applied wherever a systematic approach is required to define
a measurement program; therefore GQM methodology is used in this thesis
study to determine the set of project measures to be used in development of a
project metrics measurement tool.
3.1 Goal – Question – Metric (GQM)
GQM approach, as proposed in [3], recommends the most effective
measurement methodology for an organization as firstly specifying the goals,
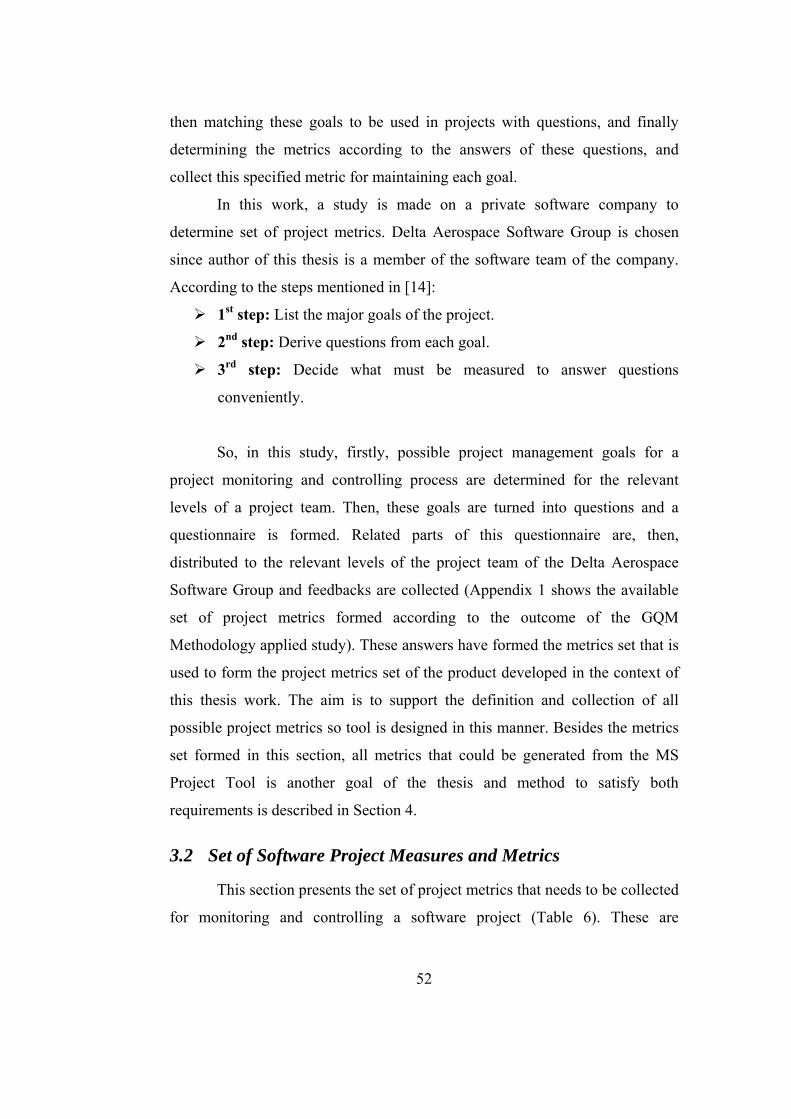
52
then matching these goals to be used in projects with questions, and finally
determining the metrics according to the answers of these questions, and
collect this specified metric for maintaining each goal.
In this work, a study is made on a private software company to
determine set of project metrics. Delta Aerospace Software Group is chosen
since author of this thesis is a member of the software team of the company.
According to the steps mentioned in [14]:
1st step: List the major goals of the project.
2nd step: Derive questions from each goal.
3rd step: Decide what must be measured to answer questions
conveniently.
So, in this study, firstly, possible project management goals for a
project monitoring and controlling process are determined for the relevant
levels of a project team. Then, these goals are turned into questions and a
questionnaire is formed. Related parts of this questionnaire are, then,
distributed to the relevant levels of the project team of the Delta Aerospace
Software Group and feedbacks are collected (Appendix 1 shows the available
set of project metrics formed according to the outcome of the GQM
Methodology applied study). These answers have formed the metrics set that is
used to form the project metrics set of the product developed in the context of
this thesis work. The aim is to support the definition and collection of all
possible project metrics so tool is designed in this manner. Besides the metrics
set formed in this section, all metrics that could be generated from the MS
Project Tool is another goal of the thesis and method to satisfy both
requirements is described in Section 4.
3.2 Set of Software Project Measures and Metrics
This section presents the set of project metrics that needs to be collected
for monitoring and controlling a software project (Table 6). These are
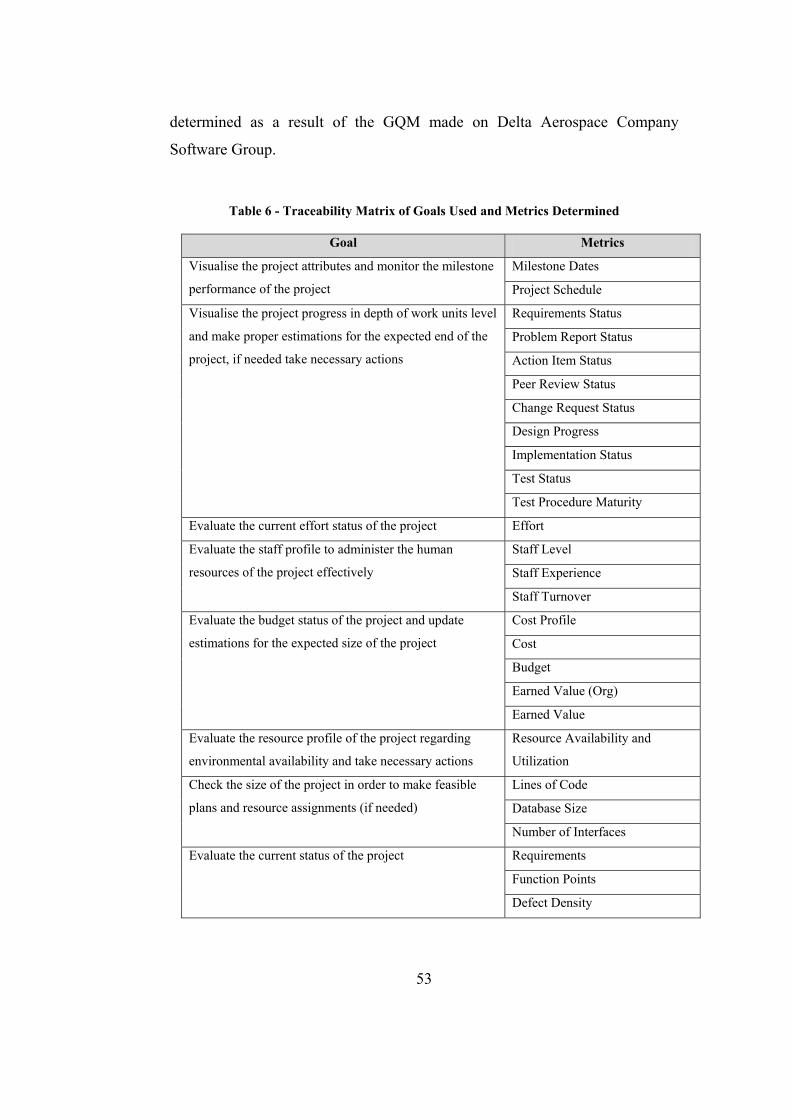
53
determined as a result of the GQM made on Delta Aerospace Company
Software Group.
Table 6 - Traceability Matrix of Goals Used and Metrics Determined
Goal Metrics
Milestone Dates Visualise the project attributes and monitor the milestone
performance of the project Project Schedule
Requirements Status
Problem Report Status
Action Item Status
Peer Review Status
Change Request Status
Design Progress
Implementation Status
Test Status
Visualise the project progress in depth of work units level
and make proper estimations for the expected end of the
project, if needed take necessary actions
Test Procedure Maturity
Evaluate the current effort status of the project Effort
Staff Level
Staff Experience
Evaluate the staff profile to administer the human
resources of the project effectively
Staff Turnover
Cost Profile
Cost
Budget
Earned Value (Org)
Evaluate the budget status of the project and update
estimations for the expected size of the project
Earned Value
Evaluate the resource profile of the project regarding
environmental availability and take necessary actions
Resource Availability and
Utilization
Lines of Code
Database Size
Check the size of the project in order to make feasible
plans and resource assignments (if needed)
Number of Interfaces
Requirements
Function Points
Evaluate the current status of the project
Defect Density
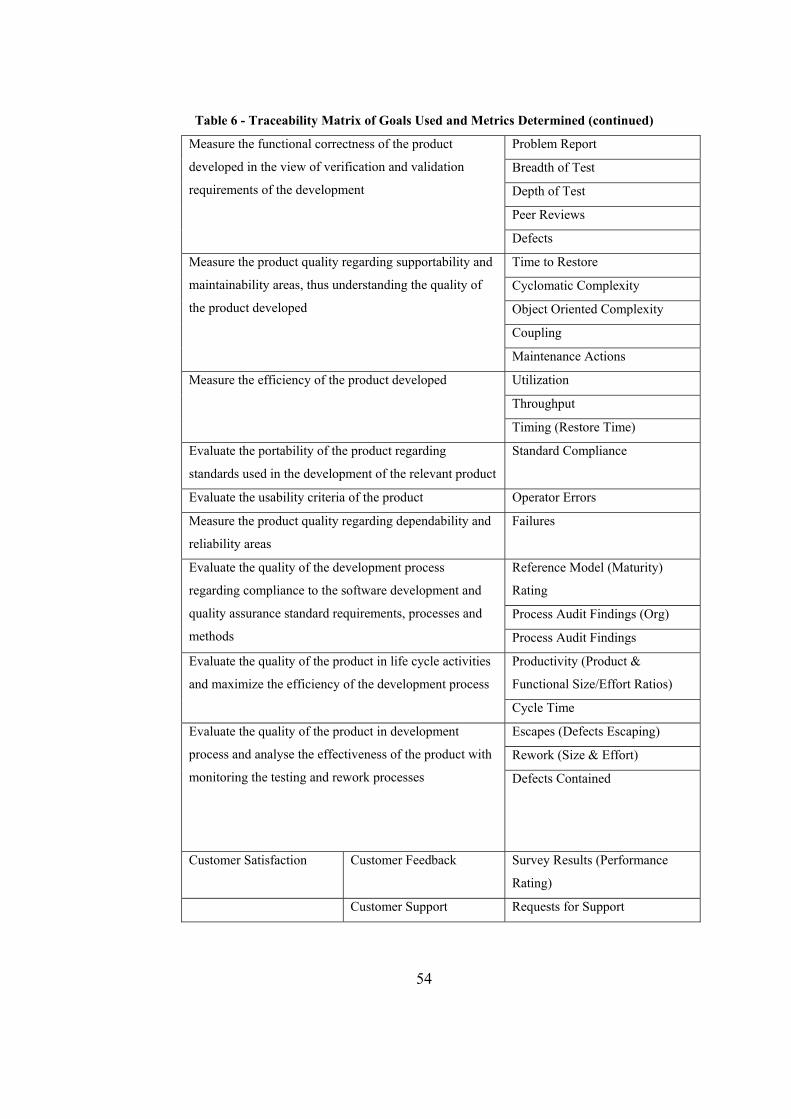
54
Table 6 - Traceability Matrix of Goals Used and Metrics Determined (continued)
Problem Report
Breadth of Test
Depth of Test
Peer Reviews
Measure the functional correctness of the product
developed in the view of verification and validation
requirements of the development
Defects
Time to Restore
Cyclomatic Complexity
Object Oriented Complexity
Coupling
Measure the product quality regarding supportability and
maintainability areas, thus understanding the quality of
the product developed
Maintenance Actions
Utilization
Throughput
Measure the efficiency of the product developed
Timing (Restore Time)
Evaluate the portability of the product regarding
standards used in the development of the relevant product
Standard Compliance
Evaluate the usability criteria of the product Operator Errors
Measure the product quality regarding dependability and
reliability areas
Failures
Reference Model (Maturity)
Rating
Process Audit Findings (Org)
Evaluate the quality of the development process
regarding compliance to the software development and
quality assurance standard requirements, processes and
methods Process Audit Findings
Productivity (Product &
Functional Size/Effort Ratios)
Evaluate the quality of the product in life cycle activities
and maximize the efficiency of the development process
Cycle Time
Escapes (Defects Escaping)
Rework (Size & Effort)
Evaluate the quality of the product in development
process and analyse the effectiveness of the product with
monitoring the testing and rework processes Defects Contained
Customer Satisfaction Customer Feedback Survey Results (Performance
Rating)
Customer Support Requests for Support
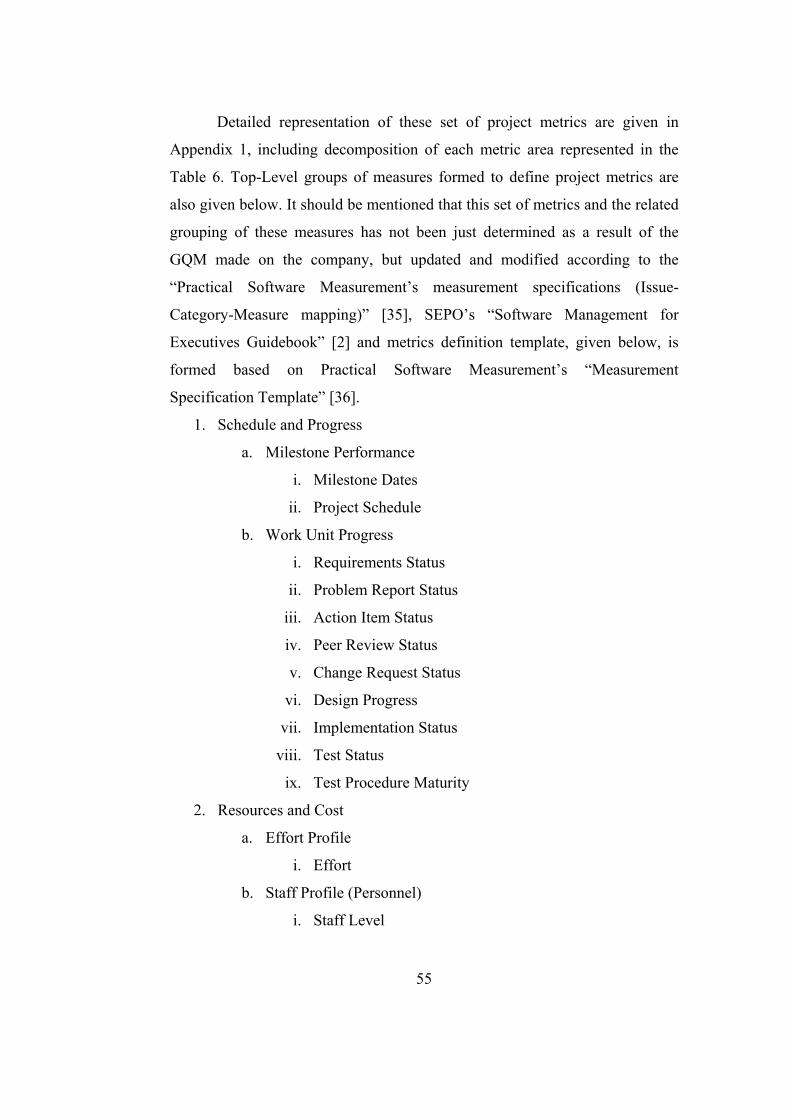
55
Detailed representation of these set of project metrics are given in
Appendix 1, including decomposition of each metric area represented in the
Table 6. Top-Level groups of measures formed to define project metrics are
also given below. It should be mentioned that this set of metrics and the related
grouping of these measures has not been just determined as a result of the
GQM made on the company, but updated and modified according to the
“Practical Software Measurement’s measurement specifications (Issue-
Category-Measure mapping)” [35], SEPO’s “Software Management for
Executives Guidebook” [2] and metrics definition template, given below, is
formed based on Practical Software Measurement’s “Measurement
Specification Template” [36].
1. Schedule and Progress
a. Milestone Performance
i. Milestone Dates
ii. Project Schedule
b. Work Unit Progress
i. Requirements Status
ii. Problem Report Status
iii. Action Item Status
iv. Peer Review Status
v. Change Request Status
vi. Design Progress
vii. Implementation Status
viii. Test Status
ix. Test Procedure Maturity
2. Resources and Cost
a. Effort Profile
i. Effort
b. Staff Profile (Personnel)
i. Staff Level
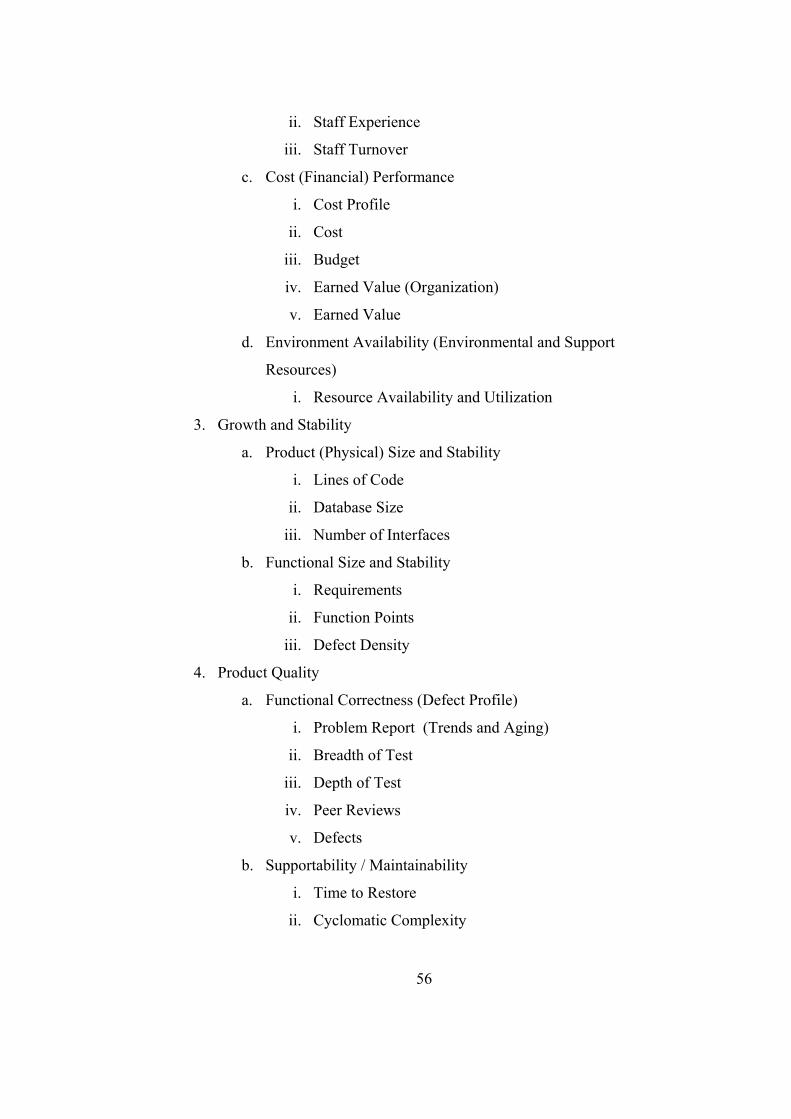
56
ii. Staff Experience
iii. Staff Turnover
c. Cost (Financial) Performance
i. Cost Profile
ii. Cost
iii. Budget
iv. Earned Value (Organization)
v. Earned Value
d. Environment Availability (Environmental and Support
Resources)
i. Resource Availability and Utilization
3. Growth and Stability
a. Product (Physical) Size and Stability
i. Lines of Code
ii. Database Size
iii. Number of Interfaces
b. Functional Size and Stability
i. Requirements
ii. Function Points
iii. Defect Density
4. Product Quality
a. Functional Correctness (Defect Profile)
i. Problem Report (Trends and Aging)
ii. Breadth of Test
iii. Depth of Test
iv. Peer Reviews
v. Defects
b. Supportability / Maintainability
i. Time to Restore
ii. Cyclomatic Complexity
57
iii. Object Oriented Complexity
iv. Coupling
v. Maintenance Actions
c. Efficiency
i. Utilization
ii. Throughput
iii. Timing (Response Time)
d. Portability
i. Standard Compliance
e. Usability
i. Operator Errors
f. Dependability / Reliability
i. Failures
5. Development Performance
a. Process Compliance
i. Reference Model (Maturity) Rating
ii. Process Audit Findings (Organizational)
iii. Process Audit Findings
b. Process Efficiency
i. Productivity (Product & Functional Size/Effort Ratios)
ii. Cycle Time
c. Process Effectiveness
i. Escapes (Defects Escaping)
ii. Rework (Size & Effort)
iii. Defects Contained
6. Customer Satisfaction
a. Customer Feedback
i. Survey Results (Performance Rating)
b. Customer Support
i. Requests for Support
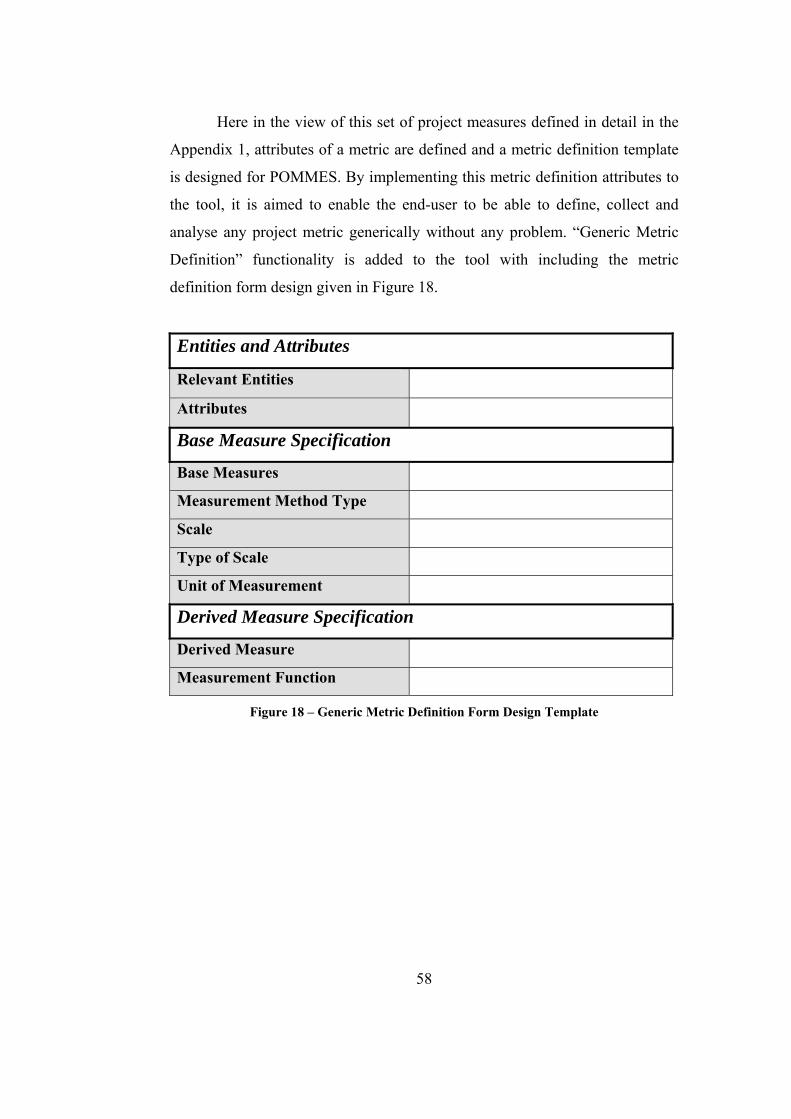
Here in the view of this set of project measures defined in detail in the
Appendix 1, attributes of a metric are defined and a metric definition template
is designed for POMMES. By implementing this metric definition attributes to
the tool, it is aimed to enable the end-user to be able to define, collect and
analyse any project metric generically without any problem. “Generic Metric
Definition” functionality is added to the tool with including the metric
definition form design given in Figure 18.
Entities and Attributes
Relevant Entities
Attributes
Base Measure Specification
Base Measures
Measurement Method Type
Scale
Type of Scale
Unit of Measurement
Derived Measure Specification
Derived Measure
Measurement Function
Figure 18 – Generic Metric Definition Form Design Template
58
59
CHAPTER 4
POMMES TOOL
Detailed functional specifications of the POMMES are given as a separate
document, named “POMMES Technical Documentation” [4]. This document
has the detailed explanation of all the POMMES Form Modules and their
related procedures, functions, database tables, triggers, stored procedures,
packages. In this chapter, it is given Product Perspective (User and
Communication Interfaces), Architectural Specifications and top-level
Functional Specifications of the POMMES.
4.1 Product Perspective
4.1.1 User Interfaces
POMMES will use a standard Oracle Forms appearance, powered by
Java Beans. Each form will have a menu, toolbar, navigation menu, and hint
line (at the bottom of the form) in it and that form will be shown to user in a
java applet by means of any web browser supported by current operating
system. Each form will have items on it to make usage of the application easy,
such as radio buttons or checkboxes. Sample form appearance can be seen
from Figure 19 at the end of this section.
When using POMMES, application will provide popup
failure/warning/information messages to the customer and will wait for
customer action to continue its working.
60
Apart from that, informational text will appear on the hint line located
at the bottom of the application. To optimise the usability of the interfaces,
additional features will be added. At the search screens wildcards can be used
in the text boxes.
All the user interfaces are designed for Internet Explorer 6.0 and with
1024x768 resolutions, of which they will be best viewed, but all the Java
enabled browsers are supported. Users may work on multiple browser windows
at a time.
There will be various user types after implementing POMMES and
POMMES will provide necessary interfaces to the system administrator so that
s/he can create roles and menus to assign users. Definitions of roles will be the
responsibility of end-user. The user interfaces will be characterized according
to the user roles e.g. read only users couldn’t access administrative interfaces.
4.1.2 Communication Interfaces
Since the POMMES is a web-based application, both the client side
machines and the POMMES’s application and database servers must connect to
the Intranet/Internet. And TCP/IP protocol must be installed to communicate
through HTTP messages between client and POMMES.
4.2 POMMES Architectural Specifications
In this section, architectural specifications of the POMMES are given,
including the system representation with a graphical representation of the
system architecture.
4.2.1 System Representation
System representation of the POMMES project is given in Figure 20 at
the end of this section, and the description of the system by taking this figure as
a basis, is as follows. The POMMES system has an n-tier architecture that
comprises mainly two distinct sub-systems. These sub-subsystems are namely,
“POMMES Development System” and “Clients”.
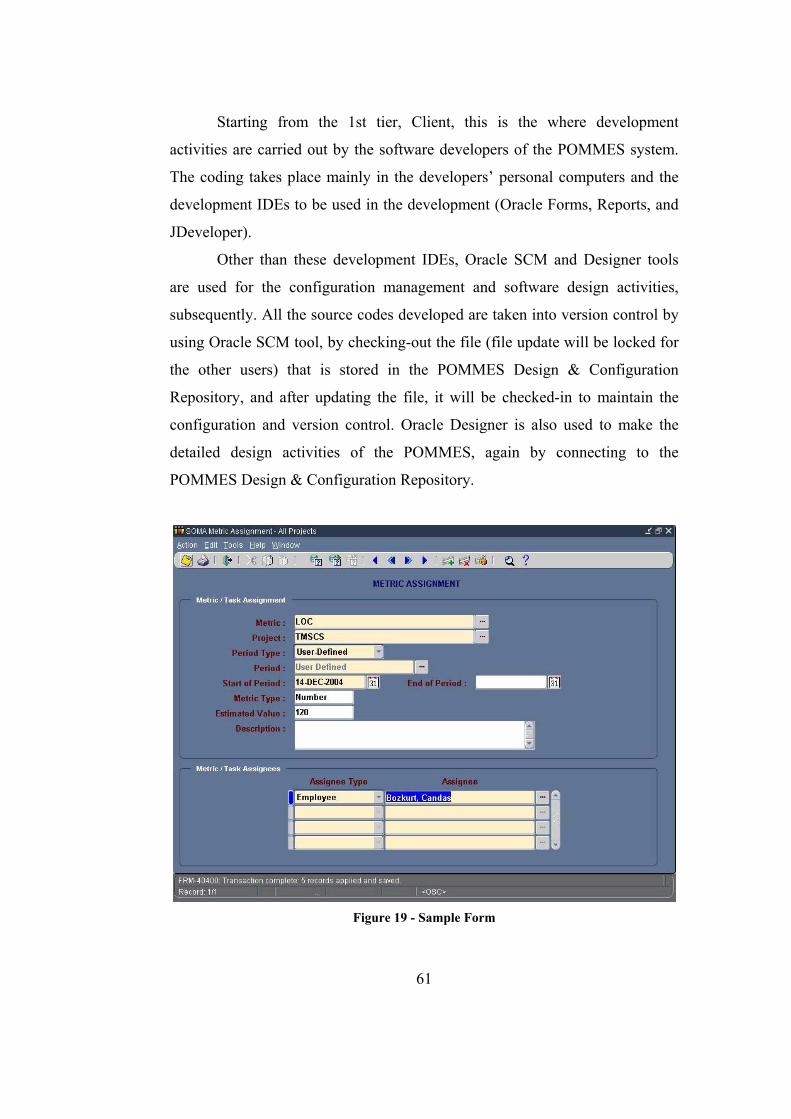
Starting from the 1st tier, Client, this is the where development
activities are carried out by the software developers of the POMMES system.
The coding takes place mainly in the developers’ personal computers and the
development IDEs to be used in the development (Oracle Forms, Reports, and
JDeveloper).
Other than these development IDEs, Oracle SCM and Designer tools
are used for the configuration management and software design activities,
subsequently. All the source codes developed are taken into version control by
using Oracle SCM tool, by checking-out the file (file update will be locked for
the other users) that is stored in the POMMES Design & Configuration
Repository, and after updating the file, it will be checked-in to maintain the
configuration and version control. Oracle Designer is also used to make the
detailed design activities of the POMMES, again by connecting to the
POMMES Design & Configuration Repository.
Figure 19 - Sample Form
61
62
Now, analysing the sub-components of the POMMES Development
System, starting with 2nd tier, Application Server, this is the part where all the
business logic is developed and stored. After producing the executables in the
developer PC, these executable files (“.jar” or “.class” for Java, “.fmx” for the
Forms and “.rep” for the Reports, “plx” for the libraries and “.mmx” for the
Menu files) are deployed to this tier. OC4J (Oracle Application Server
Containers for J2EE), Application Server Portal, Apache HTTP, wireless
application and forms services are all handled in this 2nd tier of the
architecture.
Now, coming to Main Database, 3rd tier of POMMES system, it is the
heart of the system and all the business data are defined and stored in this
production Database. This will be the database to be delivered to the end-user
with the application server structure. Developers always connect the Main
Database for the database related insertion/updating activities (by using 2nd
tier according to the needs of the development activities). The connection
between the Main Database and the developer would be handled by taking
synonyms of views of the tables defined in the Main Database; this is the way
to use the tables for developer. For each module of the POMMES, a user is
defined in the database as schema names, and all the related tables, source
codes, classes and procedures with the module would be embedded and stored
in this database as dependent to this user in the top level. From another point of
view, we could summarize this condition, as “All the objects related with
Business Logic of POMMES system would be stored in this database”. And on
top of all this module-based defined users, a super user, APPS, is defined and
actually this would be the user that the developer use when connecting to the
database for any modification and coding activities. APPS use synonyms to
get/put information from/to main schemas objects. By this way, when a
developer tries to connect to the database, he will connect by the related
module’s username and password but all of them are actually handled by APPS
user that the user will never recognize.
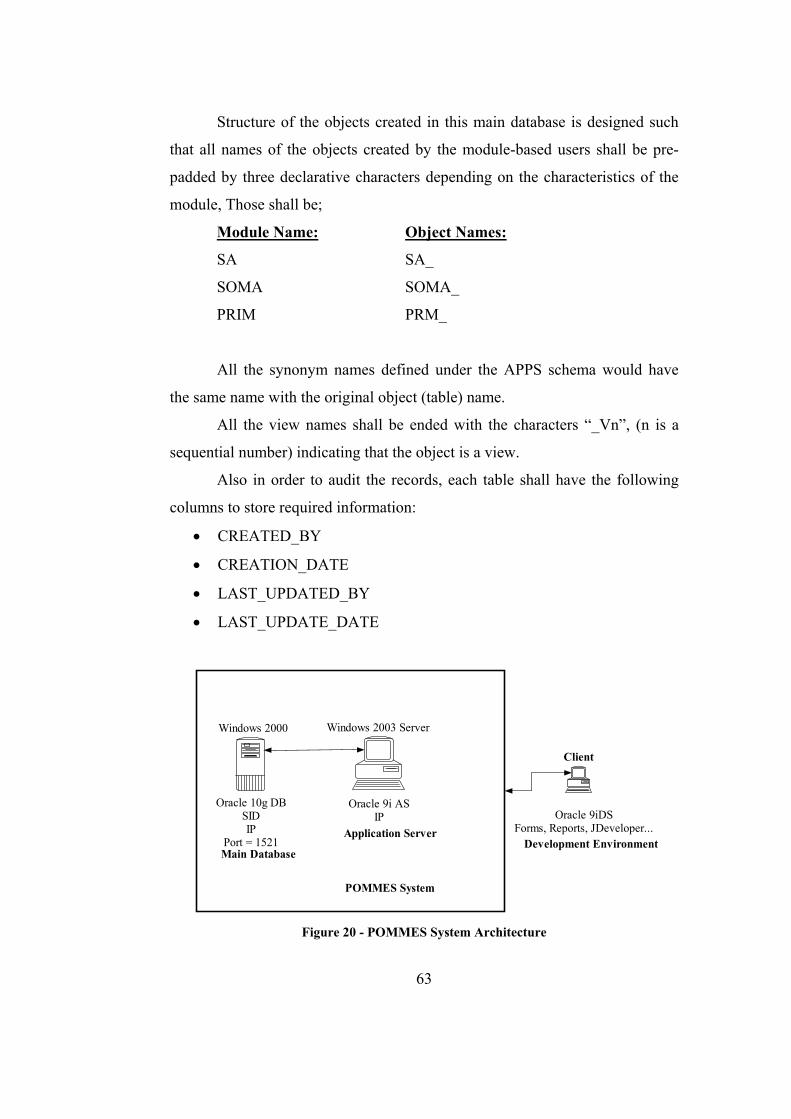
Structure of the objects created in this main database is designed such
that all names of the objects created by the module-based users shall be pre-
padded by three declarative characters depending on the characteristics of the
module, Those shall be;
Module Name: Object Names:
SA SA_
SOMA SOMA_
PRIM PRM_
All the synonym names defined under the APPS schema would have
the same name with the original object (table) name.
All the view names shall be ended with the characters “_Vn”, (n is a
sequential number) indicating that the object is a view.
Also in order to audit the records, each table shall have the following
columns to store required information:
• CREATED_BY
• CREATION_DATE
• LAST_UPDATED_BY
• LAST_UPDATE_DATE
Windows 2003 Server
Oracle 10g DBSIDIP
Port = 1521Main Database
Windows 2000
Oracle 9i ASIP
Application ServerDevelopment Environment
Oracle 9iDSForms, Reports, JDeveloper...
Client
POMMES System
Figure 20 - POMMES System Architecture
63
64
As a final note, it must be stated that the Main Database and
Application Server should be packaged to form a single deliverable “2GB
memory, Windows/Linux Box” POMMES system for the end-user.
4.3 POMMES Functional Specifications
In this section, it is given the top-level functional workflow of the
POMMES, including the information of which form modules and database
tables are used for maintaining which functionality and by this way how the
aims and objectives of the thesis are fulfilled.
4.3.1 Functional Workflow
POMMES, as described in the following diagrams, performs the above
functionalities:
POMMES Login
POMMES Employees Definition
POMMES Departments Definition
POMMES Projects & Roles Definition
POMMES Metric Objects Definition
POMMES Generic Metrics Definition
POMMES MS Project XML Upload
POMMES MS Project Metrics Usage (XML data affectivity)
POMMES Metrics Assignment
POMMES Metrics Collection
POMMES Metrics Value Entry
POMMES Metrics Monitoring and Control
POMMES Project Management (Update Project Data and Export XML to MS
Project Tool)
4.3.1.1 POMMES Login
SA_LOGIN form module is used to make the login process (Figure 21).
User will logon to POMMES by providing username and password. If the user
doesn’t have username/password or she/he has doesn’t know what they are
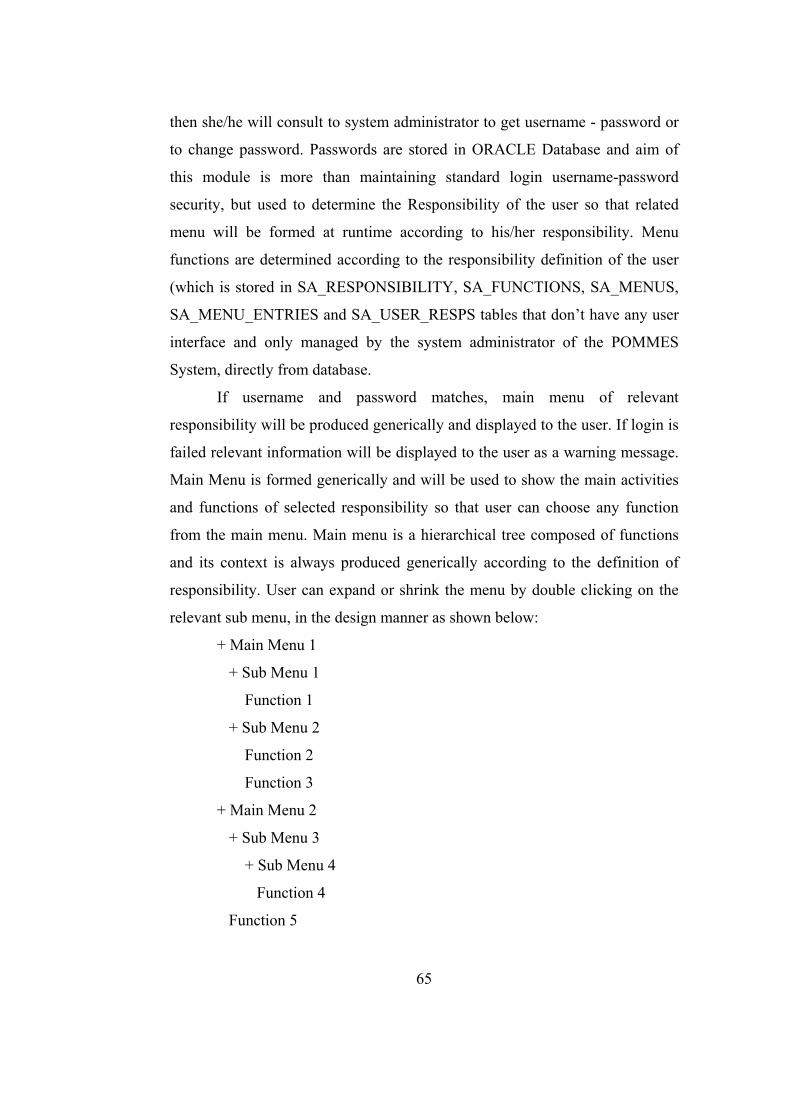
65
then she/he will consult to system administrator to get username - password or
to change password. Passwords are stored in ORACLE Database and aim of
this module is more than maintaining standard login username-password
security, but used to determine the Responsibility of the user so that related
menu will be formed at runtime according to his/her responsibility. Menu
functions are determined according to the responsibility definition of the user
(which is stored in SA_RESPONSIBILITY, SA_FUNCTIONS, SA_MENUS,
SA_MENU_ENTRIES and SA_USER_RESPS tables that don’t have any user
interface and only managed by the system administrator of the POMMES
System, directly from database.
If username and password matches, main menu of relevant
responsibility will be produced generically and displayed to the user. If login is
failed relevant information will be displayed to the user as a warning message.
Main Menu is formed generically and will be used to show the main activities
and functions of selected responsibility so that user can choose any function
from the main menu. Main menu is a hierarchical tree composed of functions
and its context is always produced generically according to the definition of
responsibility. User can expand or shrink the menu by double clicking on the
relevant sub menu, in the design manner as shown below:
+ Main Menu 1
+ Sub Menu 1
Function 1
+ Sub Menu 2
Function 2
Function 3
+ Main Menu 2
+ Sub Menu 3
+ Sub Menu 4
Function 4
Function 5
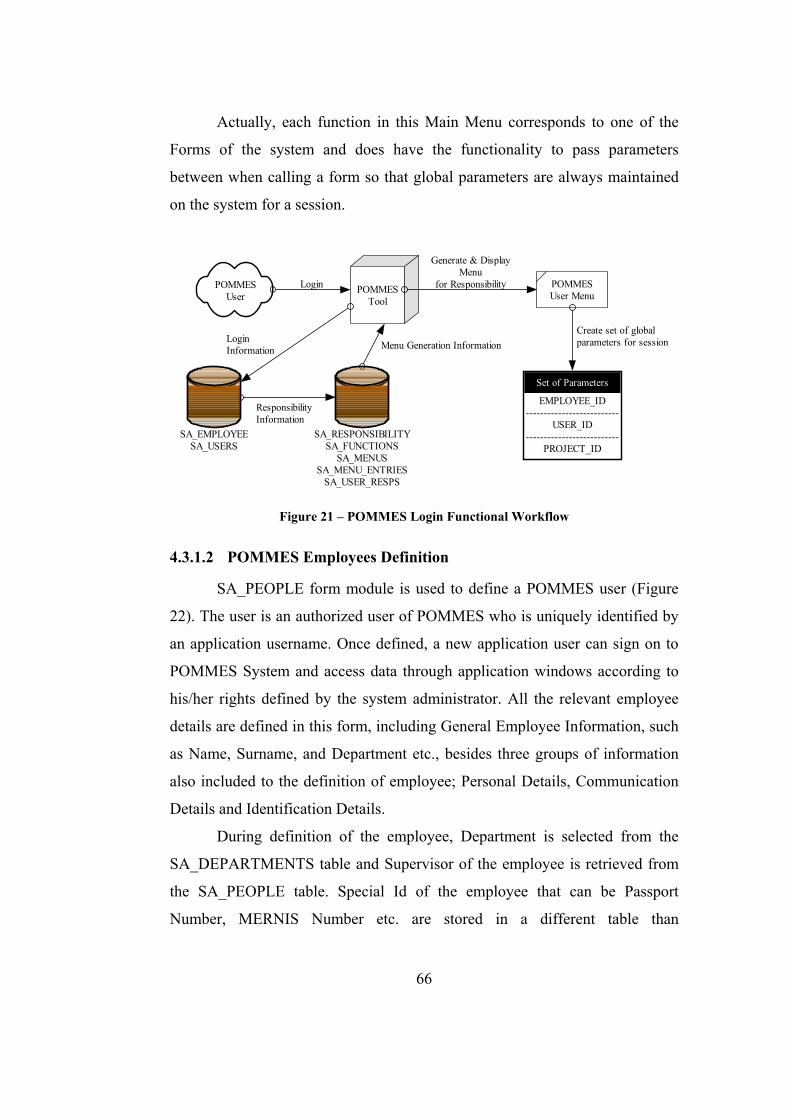
Actually, each function in this Main Menu corresponds to one of the
Forms of the system and does have the functionality to pass parameters
between when calling a form so that global parameters are always maintained
on the system for a session.
POMMESUser
Login POMMESTool
Set of Parameters
EMPLOYEE_ID--------------------------
USER_ID--------------------------
PROJECT_ID
POMMESUser Menu
Generate & DisplayMenu
for Responsibility
SA_RESPONSIBILITYSA_FUNCTIONS
SA_MENUSSA_MENU_ENTRIES
SA_USER_RESPS
ResponsibilityInformation
Create set of globalparameters for session
SA_EMPLOYEESA_USERS
LoginInformation Menu Generation Information
Figure 21 – POMMES Login Functional Workflow
4.3.1.2 POMMES Employees Definition
SA_PEOPLE form module is used to define a POMMES user (Figure
22). The user is an authorized user of POMMES who is uniquely identified by
an application username. Once defined, a new application user can sign on to
POMMES System and access data through application windows according to
his/her rights defined by the system administrator. All the relevant employee
details are defined in this form, including General Employee Information, such
as Name, Surname, and Department etc., besides three groups of information
also included to the definition of employee; Personal Details, Communication
Details and Identification Details.
During definition of the employee, Department is selected from the
SA_DEPARTMENTS table and Supervisor of the employee is retrieved from
the SA_PEOPLE table. Special Id of the employee that can be Passport
Number, MERNIS Number etc. are stored in a different table than
66
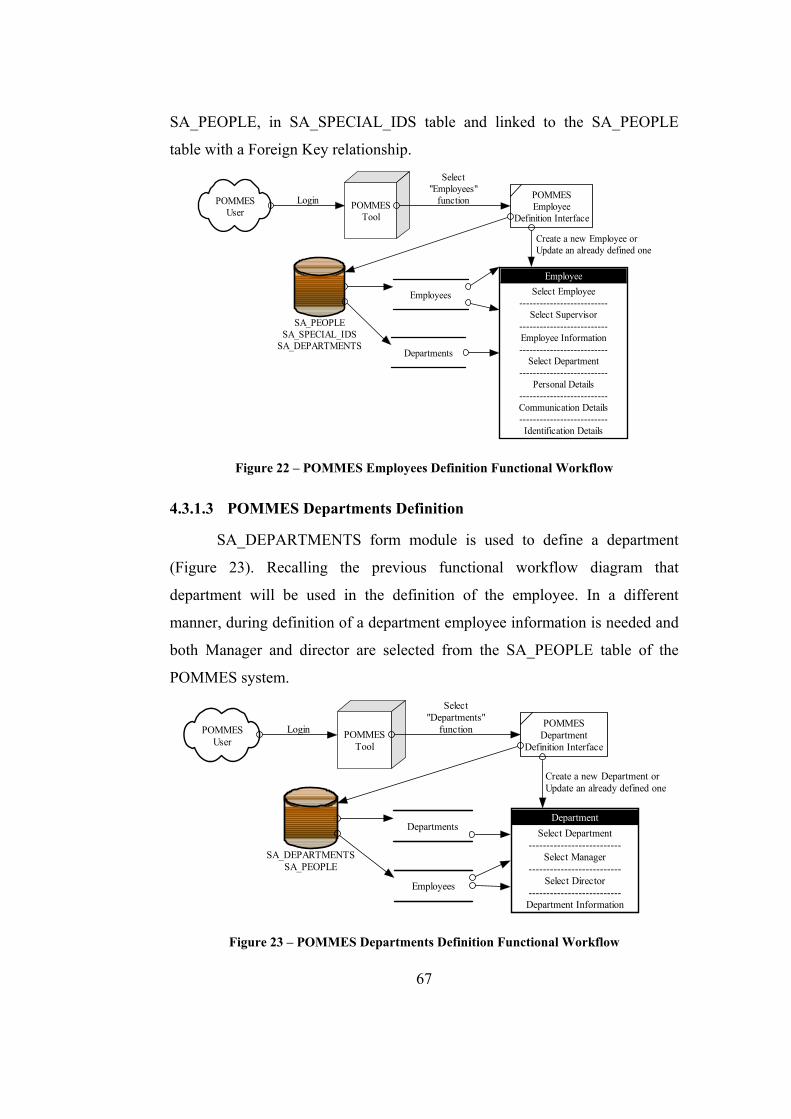
SA_PEOPLE, in SA_SPECIAL_IDS table and linked to the SA_PEOPLE
table with a Foreign Key relationship.
POMMESUser
Login POMMESTool
Departments
EmployeeSelect Employee
--------------------------Select Supervisor
--------------------------Employee Information--------------------------
Select Department--------------------------
Personal Details--------------------------Communication Details--------------------------Identification Details
POMMESEmployee
Definition Interface
Select"Employees"
function
SA_PEOPLESA_SPECIAL_IDS
SA_DEPARTMENTS
Employees
Create a new Employee orUpdate an already defined one
Figure 22 – POMMES Employees Definition Functional Workflow
4.3.1.3 POMMES Departments Definition
SA_DEPARTMENTS form module is used to define a department
(Figure 23). Recalling the previous functional workflow diagram that
department will be used in the definition of the employee. In a different
manner, during definition of a department employee information is needed and
both Manager and director are selected from the SA_PEOPLE table of the
POMMES system.
POMMESUser
Login POMMESTool
Employees
DepartmentSelect Department
--------------------------Select Manager
--------------------------Select Director
--------------------------Department Information
POMMESDepartment
Definition Interface
Select"Departments"
function
SA_DEPARTMENTSSA_PEOPLE
Departments
Create a new Department orUpdate an already defined one
67
Figure 23 – POMMES Departments Definition Functional Workflow
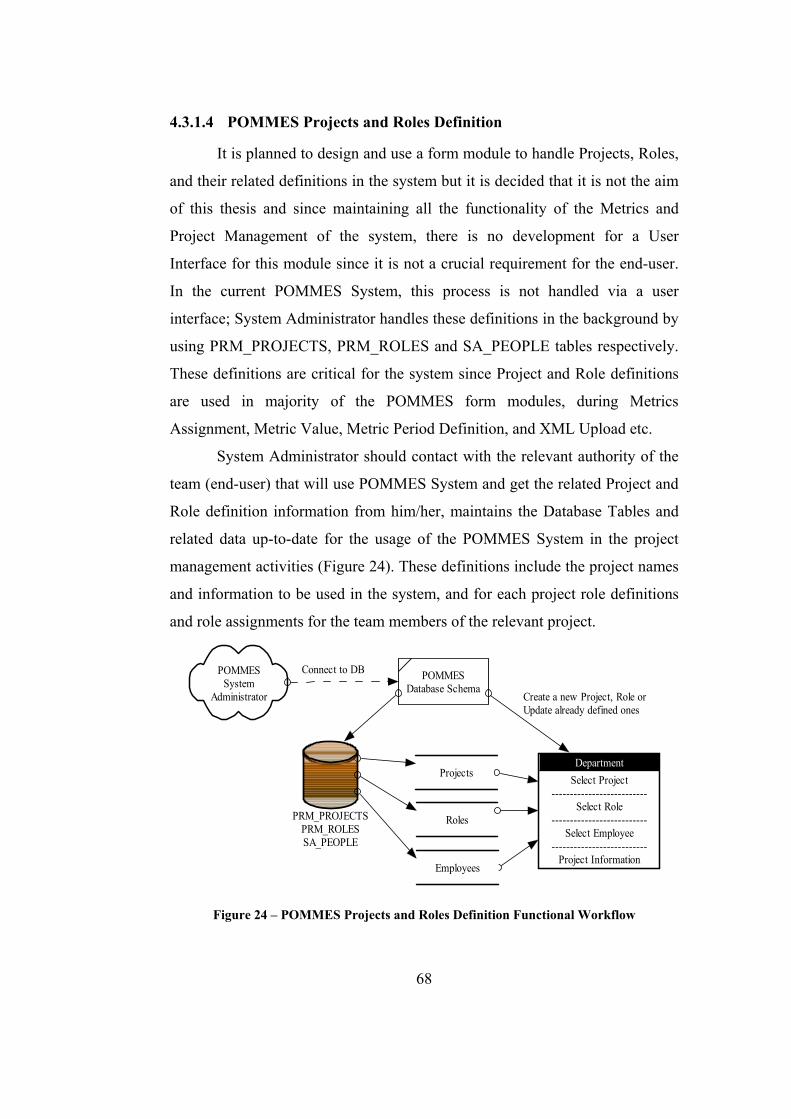
4.3.1.4 POMMES Projects and Roles Definition
It is planned to design and use a form module to handle Projects, Roles,
and their related definitions in the system but it is decided that it is not the aim
of this thesis and since maintaining all the functionality of the Metrics and
Project Management of the system, there is no development for a User
Interface for this module since it is not a crucial requirement for the end-user.
In the current POMMES System, this process is not handled via a user
interface; System Administrator handles these definitions in the background by
using PRM_PROJECTS, PRM_ROLES and SA_PEOPLE tables respectively.
These definitions are critical for the system since Project and Role definitions
are used in majority of the POMMES form modules, during Metrics
Assignment, Metric Value, Metric Period Definition, and XML Upload etc.
System Administrator should contact with the relevant authority of the
team (end-user) that will use POMMES System and get the related Project and
Role definition information from him/her, maintains the Database Tables and
related data up-to-date for the usage of the POMMES System in the project
management activities (Figure 24). These definitions include the project names
and information to be used in the system, and for each project role definitions
and role assignments for the team members of the relevant project.
POMMESSystem
Administrator
Roles
DepartmentSelect Project
--------------------------Select Role
--------------------------Select Employee
--------------------------Project Information
POMMESDatabase Schema
PRM_PROJECTSPRM_ROLESSA_PEOPLE
Projects
Create a new Project, Role orUpdate already defined ones
Employees
Connect to DB
Figure 24 – POMMES Projects and Roles Definition Functional Workflow
68
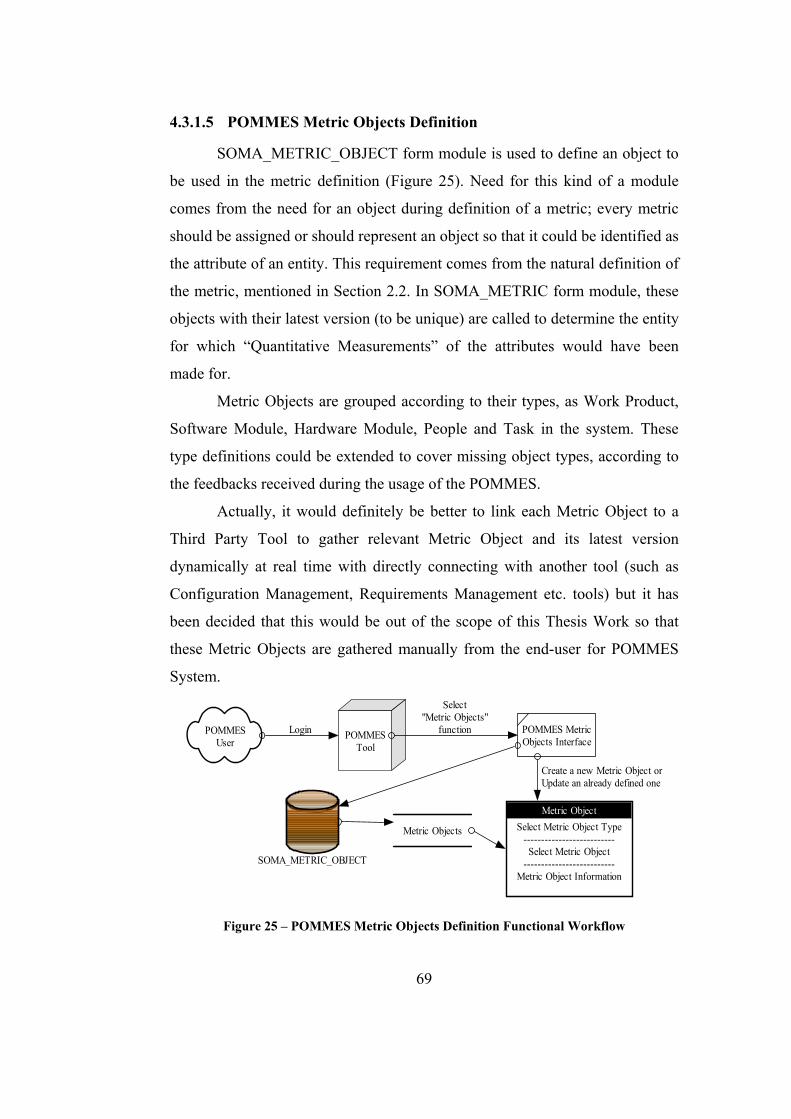
4.3.1.5 POMMES Metric Objects Definition
SOMA_METRIC_OBJECT form module is used to define an object to
be used in the metric definition (Figure 25). Need for this kind of a module
comes from the need for an object during definition of a metric; every metric
should be assigned or should represent an object so that it could be identified as
the attribute of an entity. This requirement comes from the natural definition of
the metric, mentioned in Section 2.2. In SOMA_METRIC form module, these
objects with their latest version (to be unique) are called to determine the entity
for which “Quantitative Measurements” of the attributes would have been
made for.
Metric Objects are grouped according to their types, as Work Product,
Software Module, Hardware Module, People and Task in the system. These
type definitions could be extended to cover missing object types, according to
the feedbacks received during the usage of the POMMES.
Actually, it would definitely be better to link each Metric Object to a
Third Party Tool to gather relevant Metric Object and its latest version
dynamically at real time with directly connecting with another tool (such as
Configuration Management, Requirements Management etc. tools) but it has
been decided that this would be out of the scope of this Thesis Work so that
these Metric Objects are gathered manually from the end-user for POMMES
System.
POMMESUser
Login POMMESTool
Metric ObjectSelect Metric Object Type
--------------------------Select Metric Object
--------------------------Metric Object Information
POMMES MetricObjects Interface
Select"Metric Objects"
function
SOMA_METRIC_OBJECT
Metric Objects
Create a new Metric Object orUpdate an already defined one
Figure 25 – POMMES Metric Objects Definition Functional Workflow
69
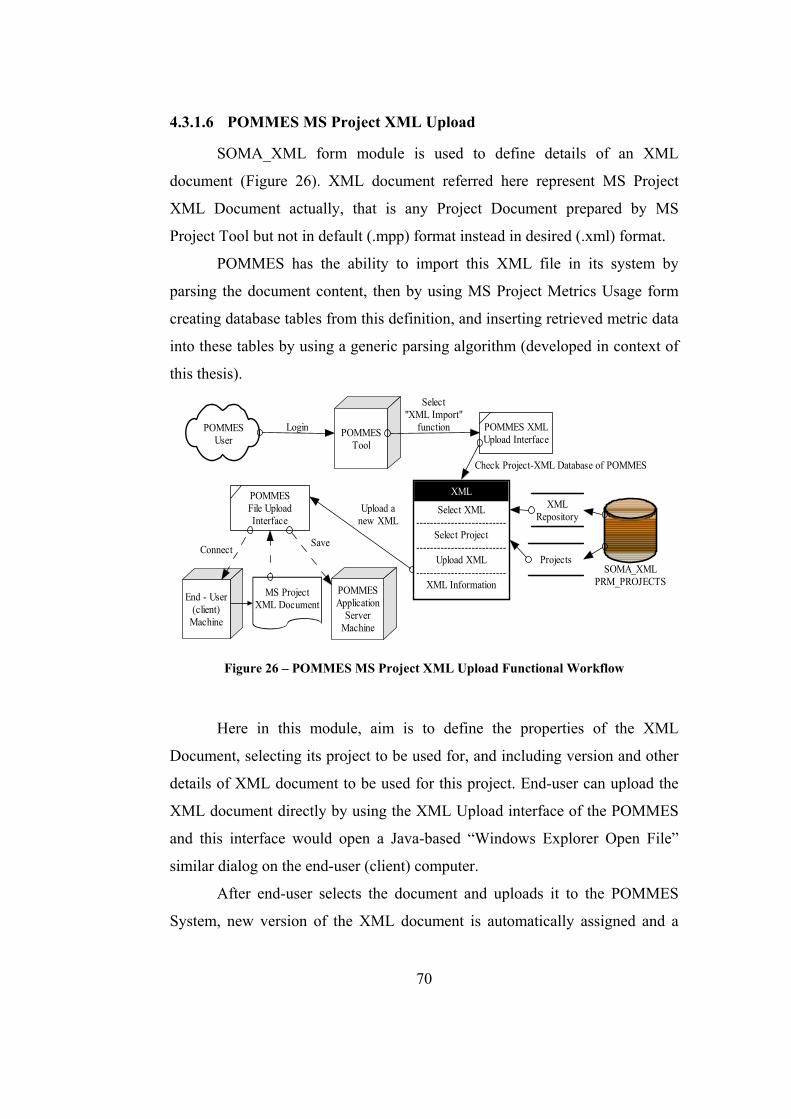
4.3.1.6 POMMES MS Project XML Upload
SOMA_XML form module is used to define details of an XML
document (Figure 26). XML document referred here represent MS Project
XML Document actually, that is any Project Document prepared by MS
Project Tool but not in default (.mpp) format instead in desired (.xml) format.
POMMES has the ability to import this XML file in its system by
parsing the document content, then by using MS Project Metrics Usage form
creating database tables from this definition, and inserting retrieved metric data
into these tables by using a generic parsing algorithm (developed in context of
this thesis).
POMMESUser
Login POMMESTool
POMMES XMLUpload Interface
Select"XML Import"
function
SOMA_XMLPRM_PROJECTS
POMMESFile UploadInterface
End - User(client)
Machine
Connect
Check Project-XML Database of POMMES
Upload anew XML
XML
Select XML--------------------------
Select Project--------------------------
Upload XML--------------------------
XML Information
XMLRepository
MS ProjectXML Document
POMMESApplication
ServerMachine
SaveProjects
Figure 26 – POMMES MS Project XML Upload Functional Workflow
Here in this module, aim is to define the properties of the XML
Document, selecting its project to be used for, and including version and other
details of XML document to be used for this project. End-user can upload the
XML document directly by using the XML Upload interface of the POMMES
and this interface would open a Java-based “Windows Explorer Open File”
similar dialog on the end-user (client) computer.
After end-user selects the document and uploads it to the POMMES
System, new version of the XML document is automatically assigned and a
70
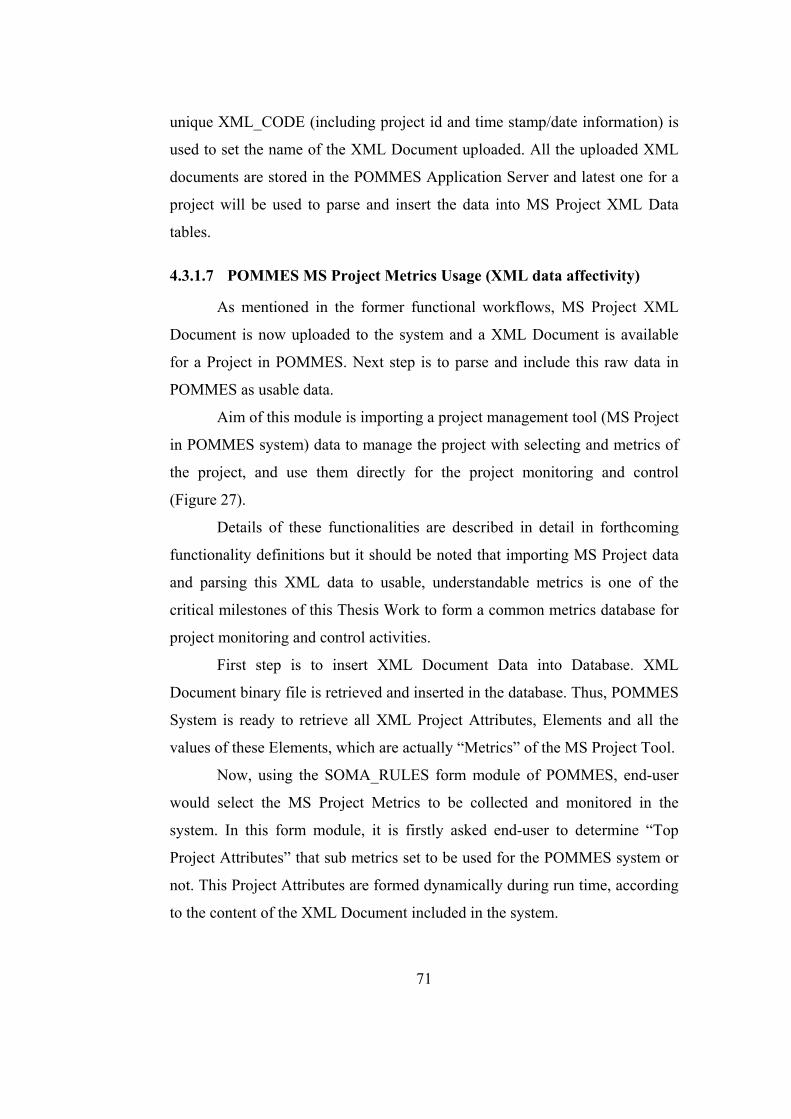
71
unique XML_CODE (including project id and time stamp/date information) is
used to set the name of the XML Document uploaded. All the uploaded XML
documents are stored in the POMMES Application Server and latest one for a
project will be used to parse and insert the data into MS Project XML Data
tables.
4.3.1.7 POMMES MS Project Metrics Usage (XML data affectivity)
As mentioned in the former functional workflows, MS Project XML
Document is now uploaded to the system and a XML Document is available
for a Project in POMMES. Next step is to parse and include this raw data in
POMMES as usable data.
Aim of this module is importing a project management tool (MS Project
in POMMES system) data to manage the project with selecting and metrics of
the project, and use them directly for the project monitoring and control
(Figure 27).
Details of these functionalities are described in detail in forthcoming
functionality definitions but it should be noted that importing MS Project data
and parsing this XML data to usable, understandable metrics is one of the
critical milestones of this Thesis Work to form a common metrics database for
project monitoring and control activities.
First step is to insert XML Document Data into Database. XML
Document binary file is retrieved and inserted in the database. Thus, POMMES
System is ready to retrieve all XML Project Attributes, Elements and all the
values of these Elements, which are actually “Metrics” of the MS Project Tool.
Now, using the SOMA_RULES form module of POMMES, end-user
would select the MS Project Metrics to be collected and monitored in the
system. In this form module, it is firstly asked end-user to determine “Top
Project Attributes” that sub metrics set to be used for the POMMES system or
not. This Project Attributes are formed dynamically during run time, according
to the content of the XML Document included in the system.
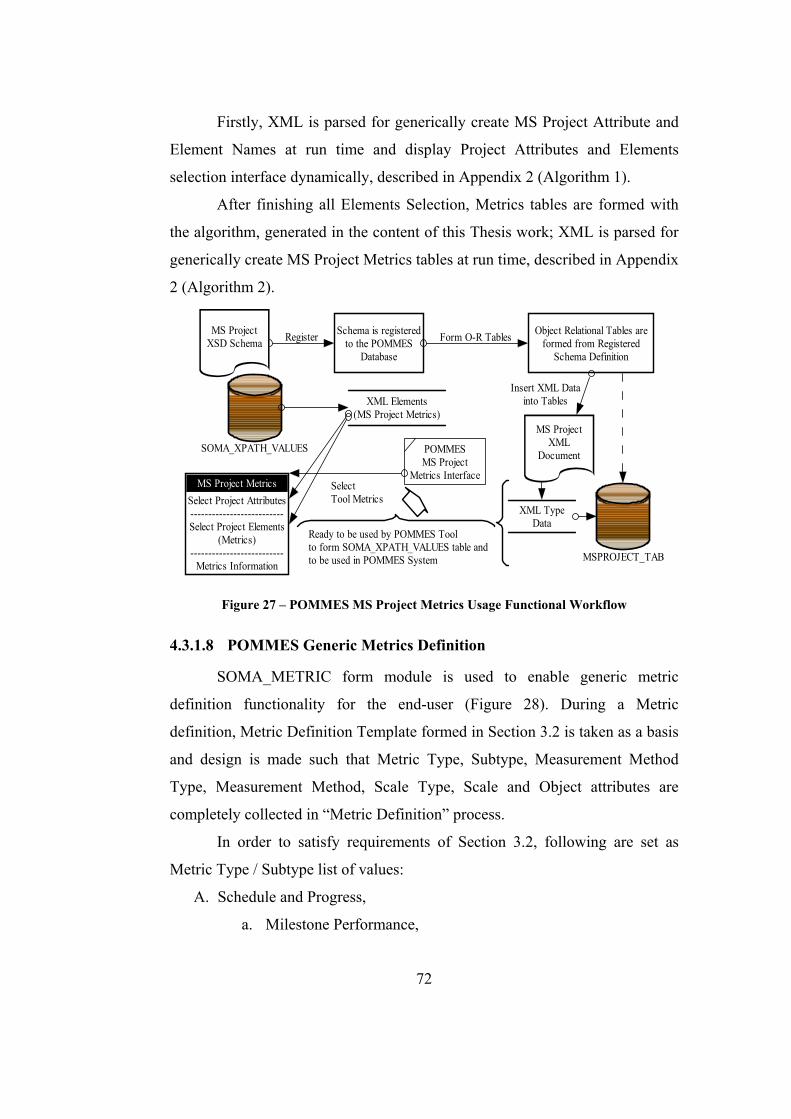
Firstly, XML is parsed for generically create MS Project Attribute and
Element Names at run time and display Project Attributes and Elements
selection interface dynamically, described in Appendix 2 (Algorithm 1).
After finishing all Elements Selection, Metrics tables are formed with
the algorithm, generated in the content of this Thesis work; XML is parsed for
generically create MS Project Metrics tables at run time, described in Appendix
2 (Algorithm 2).
Register
MSPROJECT_TAB
MS ProjectXSD Schema
Schema is registeredto the POMMES
Database
Form O-R Tables Object Relational Tables areformed from Registered
Schema Definition
XML TypeData
MS ProjectXML
Document
Insert XML Datainto Tables
Ready to be used by POMMES Toolto form SOMA_XPATH_VALUES table andto be used in POMMES System
SOMA_XPATH_VALUES POMMESMS Project
Metrics Interface
XML Elements(MS Project Metrics)
SelectTool Metrics
MS Project MetricsSelect Project Attributes--------------------------Select Project Elements
(Metrics)--------------------------
Metrics Information
Figure 27 – POMMES MS Project Metrics Usage Functional Workflow
4.3.1.8 POMMES Generic Metrics Definition
SOMA_METRIC form module is used to enable generic metric
definition functionality for the end-user (Figure 28). During a Metric
definition, Metric Definition Template formed in Section 3.2 is taken as a basis
and design is made such that Metric Type, Subtype, Measurement Method
Type, Measurement Method, Scale Type, Scale and Object attributes are
completely collected in “Metric Definition” process.
In order to satisfy requirements of Section 3.2, following are set as
Metric Type / Subtype list of values:
A. Schedule and Progress,
a. Milestone Performance,
72
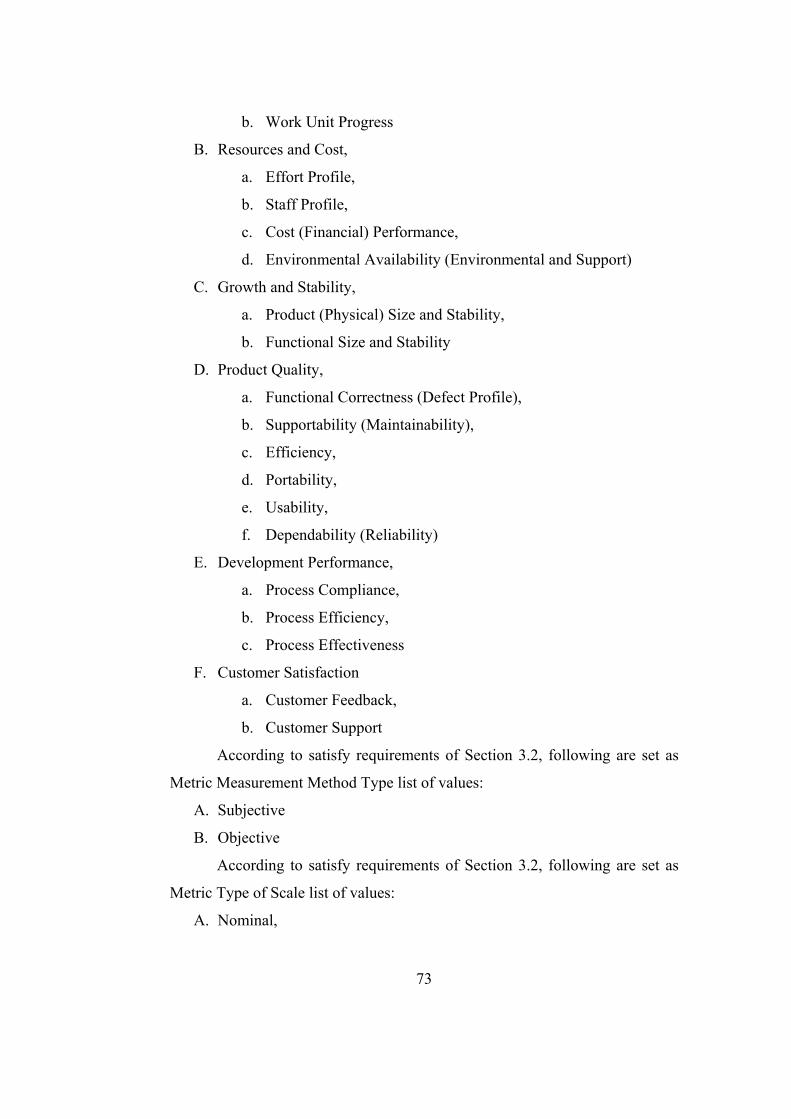
73
b. Work Unit Progress
B. Resources and Cost,
a. Effort Profile,
b. Staff Profile,
c. Cost (Financial) Performance,
d. Environmental Availability (Environmental and Support)
C. Growth and Stability,
a. Product (Physical) Size and Stability,
b. Functional Size and Stability
D. Product Quality,
a. Functional Correctness (Defect Profile),
b. Supportability (Maintainability),
c. Efficiency,
d. Portability,
e. Usability,
f. Dependability (Reliability)
E. Development Performance,
a. Process Compliance,
b. Process Efficiency,
c. Process Effectiveness
F. Customer Satisfaction
a. Customer Feedback,
b. Customer Support
According to satisfy requirements of Section 3.2, following are set as
Metric Measurement Method Type list of values:
A. Subjective
B. Objective
According to satisfy requirements of Section 3.2, following are set as
Metric Type of Scale list of values:
A. Nominal,
74
B. Ordinal,
C. Interval,
D. Ratio,
E. Absolute
According to satisfy requirements of Section 3.2, following are set as
Metric Scale list of values:
A. Integers from zero to infinity,
B. Integers,
C. Rating levels,
D. Date,
E. Time,
F. Text
Another critical design choice in POMMES Generic Metrics Definition
is the “Metric Property” that could take the values of “Direct”, “Indirect” or
“Group”. If metric is set to be a Direct Metric, then standard metric definition
process is followed with setting the related attributes of the metric. When
Indirect Metric choice is selected, then a Formula Entry Section is enabled for
the end-user and user can select Pre-Defined User Metrics or MS Project
Metrics and has the ability to make any Arithmetical Operation on them. For
the last choice, if Group Metric choice is selected, then Metric Group
Definition interface is enabled and from this interface end-user can select Pre-
Defined User Metric or MS Project Metrics to be added to the Group List. It
should be noted a critical difference between Indirect and Group Metric
definition such that when Indirect Metric is defined with usage of more than
one metrics in the formula, result is always a single metric that is using
multiple metrics in its Formula for the calculation of its value, but when Group
Metric is defined with selecting more than one metrics in the group list, result
is more than one metric that is values of all the metrics are retrieved/collected
one-by-one and displayed one-by-one to the end-user in a grouped manner.
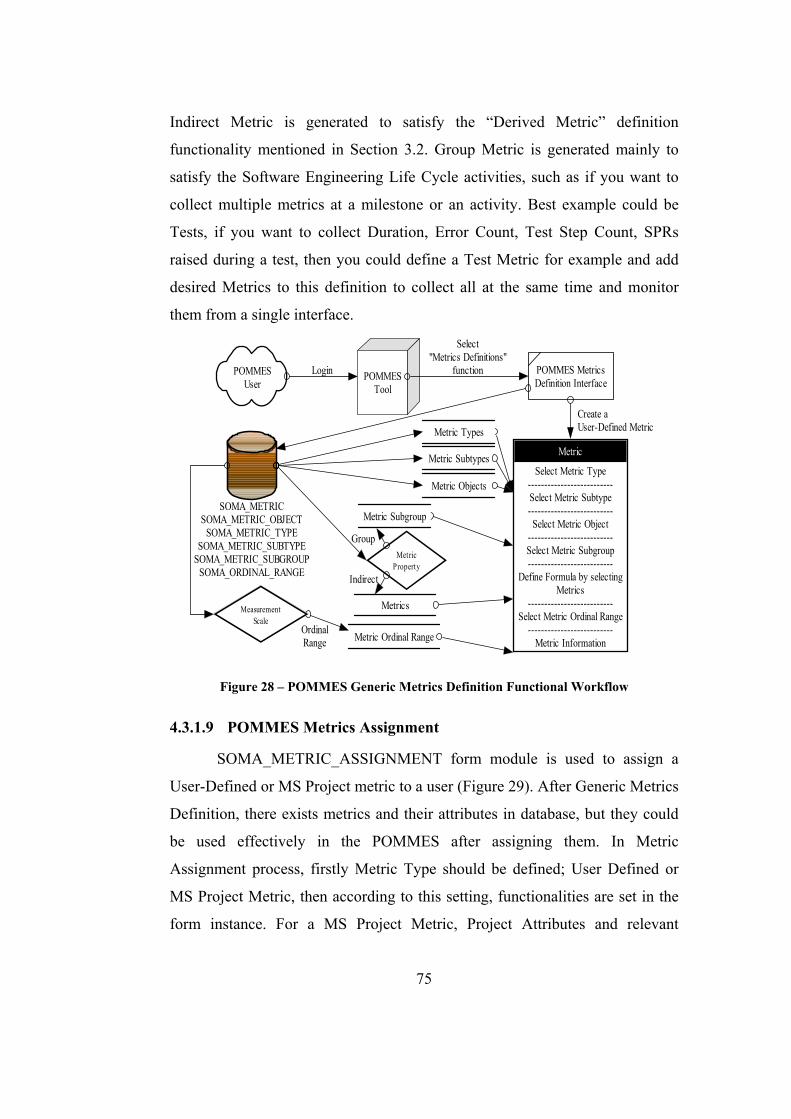
Indirect Metric is generated to satisfy the “Derived Metric” definition
functionality mentioned in Section 3.2. Group Metric is generated mainly to
satisfy the Software Engineering Life Cycle activities, such as if you want to
collect multiple metrics at a milestone or an activity. Best example could be
Tests, if you want to collect Duration, Error Count, Test Step Count, SPRs
raised during a test, then you could define a Test Metric for example and add
desired Metrics to this definition to collect all at the same time and monitor
them from a single interface.
POMMESUser
Login POMMESTool
Metric
Select Metric Type--------------------------Select Metric Subtype--------------------------Select Metric Object
--------------------------Select Metric Subgroup--------------------------
Define Formula by selectingMetrics
--------------------------Select Metric Ordinal Range
--------------------------Metric Information
POMMES MetricsDefinition Interface
Select"Metrics Definitions"
function
SOMA_METRICSOMA_METRIC_OBJECT
SOMA_METRIC_TYPESOMA_METRIC_SUBTYPE
SOMA_METRIC_SUBGROUPSOMA_ORDINAL_RANGE
Metric Objects
Create aUser-Defined MetricMetric Types
Metric Subtypes
Metric Subgroup
Metric Ordinal Range
MetricProperty
Metrics
Indirect
Group
MeasurementScale
OrdinalRange
Figure 28 – POMMES Generic Metrics Definition Functional Workflow
4.3.1.9 POMMES Metrics Assignment
SOMA_METRIC_ASSIGNMENT form module is used to assign a
User-Defined or MS Project metric to a user (Figure 29). After Generic Metrics
Definition, there exists metrics and their attributes in database, but they could
be used effectively in the POMMES after assigning them. In Metric
Assignment process, firstly Metric Type should be defined; User Defined or
MS Project Metric, then according to this setting, functionalities are set in the
form instance. For a MS Project Metric, Project Attributes and relevant
75
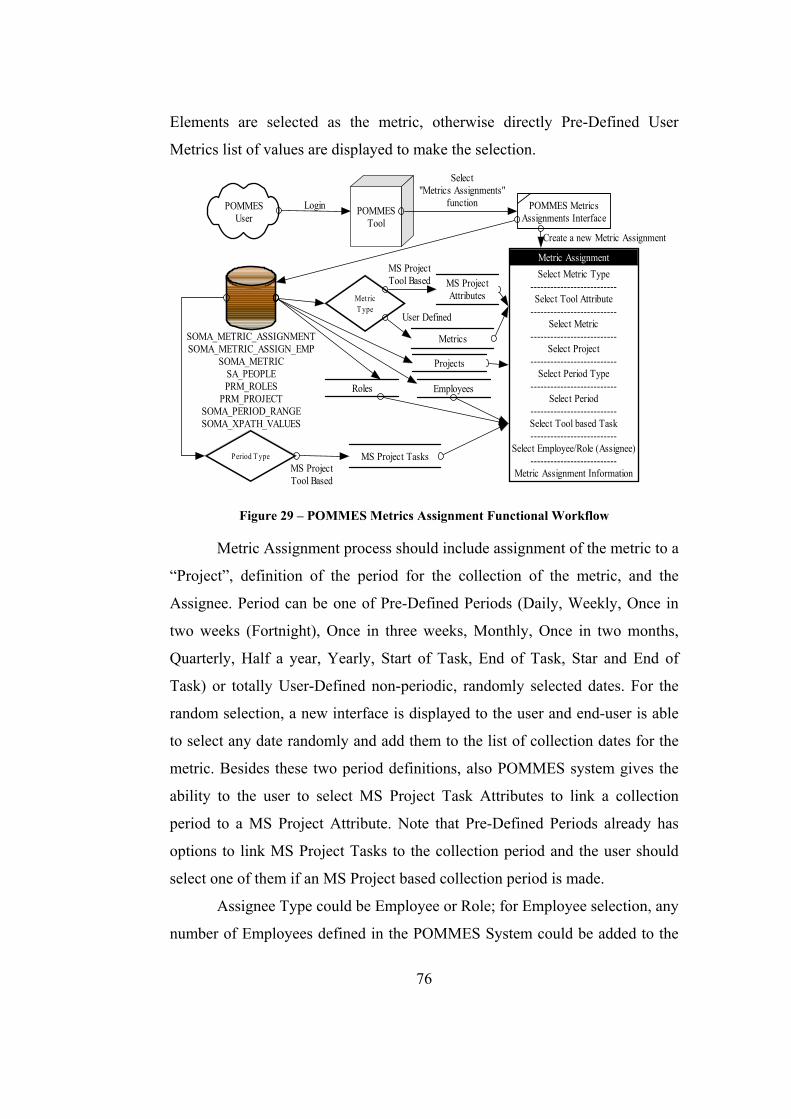
Elements are selected as the metric, otherwise directly Pre-Defined User
Metrics list of values are displayed to make the selection.
POMMESUser
Login POMMESTool
Metric AssignmentSelect Metric Type
--------------------------Select Tool Attribute
--------------------------Select Metric
--------------------------Select Project
--------------------------Select Period Type
--------------------------Select Period
--------------------------Select Tool based Task--------------------------
Select Employee/Role (Assignee)--------------------------
Metric Assignment Information
POMMES MetricsAssignments Interface
SOMA_METRIC_ASSIGNMENTSOMA_METRIC_ASSIGN_EMP
SOMA_METRICSA_PEOPLEPRM_ROLES
PRM_PROJECTSOMA_PERIOD_RANGESOMA_XPATH_VALUES
Roles
Create a new Metric Assignment
Projects
Employees
MS ProjectAttributes
MS Project Tasks
MetricT ype
Metrics
MS ProjectTool Based
User Defined
Period T ypeMS ProjectTool Based
Select"Metrics Assignments"
function
Figure 29 – POMMES Metrics Assignment Functional Workflow
Metric Assignment process should include assignment of the metric to a
“Project”, definition of the period for the collection of the metric, and the
Assignee. Period can be one of Pre-Defined Periods (Daily, Weekly, Once in
two weeks (Fortnight), Once in three weeks, Monthly, Once in two months,
Quarterly, Half a year, Yearly, Start of Task, End of Task, Star and End of
Task) or totally User-Defined non-periodic, randomly selected dates. For the
random selection, a new interface is displayed to the user and end-user is able
to select any date randomly and add them to the list of collection dates for the
metric. Besides these two period definitions, also POMMES system gives the
ability to the user to select MS Project Task Attributes to link a collection
period to a MS Project Attribute. Note that Pre-Defined Periods already has
options to link MS Project Tasks to the collection period and the user should
select one of them if an MS Project based collection period is made.
Assignee Type could be Employee or Role; for Employee selection, any
number of Employees defined in the POMMES System could be added to the
76
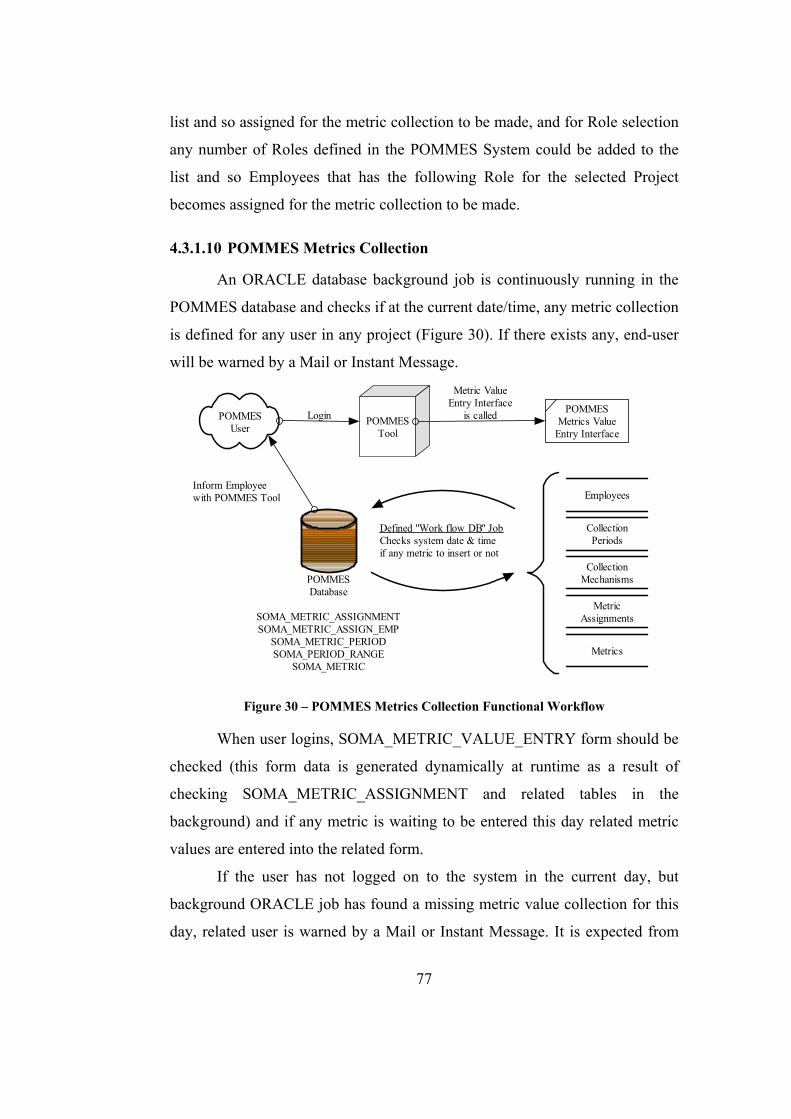
list and so assigned for the metric collection to be made, and for Role selection
any number of Roles defined in the POMMES System could be added to the
list and so Employees that has the following Role for the selected Project
becomes assigned for the metric collection to be made.
4.3.1.10 POMMES Metrics Collection
An ORACLE database background job is continuously running in the
POMMES database and checks if at the current date/time, any metric collection
is defined for any user in any project (Figure 30). If there exists any, end-user
will be warned by a Mail or Instant Message.
POMMESUser
Login POMMESTool
Employees
POMMESMetrics Value
Entry Interface
Metric ValueEntry Interface
is called
POMMESDatabase
SOMA_METRIC_ASSIGNMENTSOMA_METRIC_ASSIGN_EMP
SOMA_METRIC_PERIODSOMA_PERIOD_RANGE
SOMA_METRIC
Inform Employeewith POMMES Tool
CollectionPeriods
CollectionMechanisms
Defined "Work flow DB" JobChecks system date & timeif any metric to insert or not
MetricAssignments
Metrics
Figure 30 – POMMES Metrics Collection Functional Workflow
When user logins, SOMA_METRIC_VALUE_ENTRY form should be
checked (this form data is generated dynamically at runtime as a result of
checking SOMA_METRIC_ASSIGNMENT and related tables in the
background) and if any metric is waiting to be entered this day related metric
values are entered into the related form.
If the user has not logged on to the system in the current day, but
background ORACLE job has found a missing metric value collection for this
day, related user is warned by a Mail or Instant Message. It is expected from
77
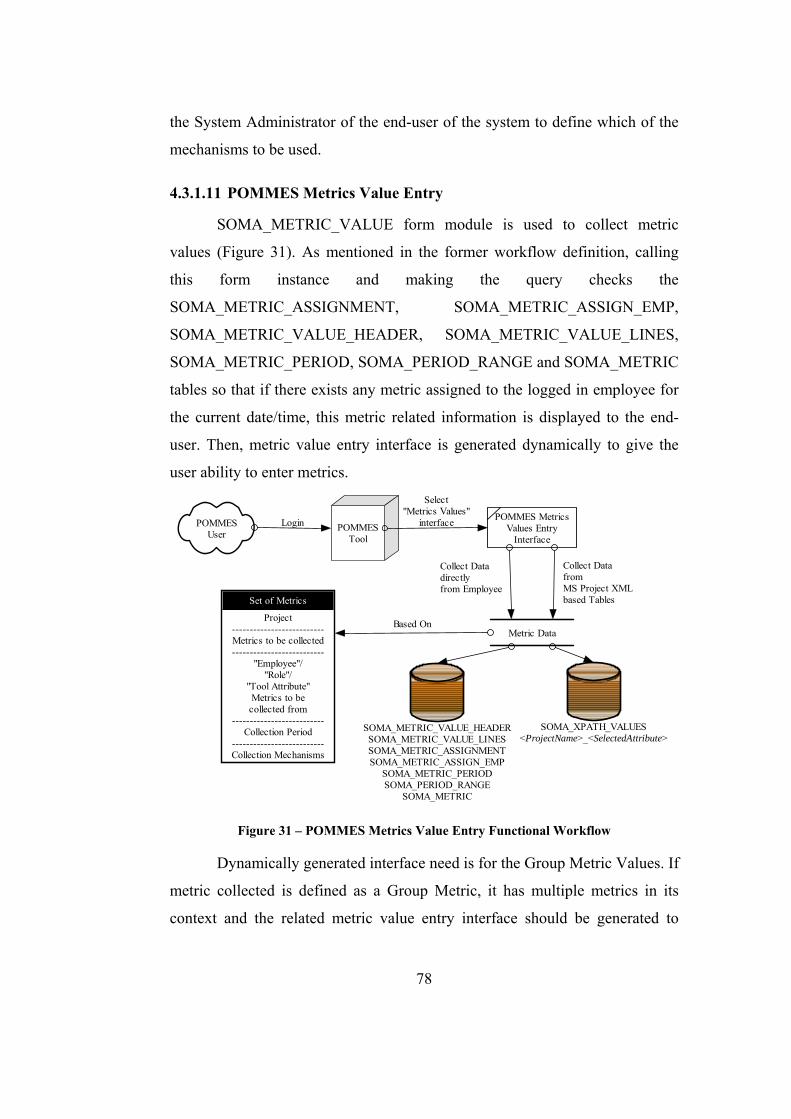
the System Administrator of the end-user of the system to define which of the
mechanisms to be used.
4.3.1.11 POMMES Metrics Value Entry
SOMA_METRIC_VALUE form module is used to collect metric
values (Figure 31). As mentioned in the former workflow definition, calling
this form instance and making the query checks the
SOMA_METRIC_ASSIGNMENT, SOMA_METRIC_ASSIGN_EMP,
SOMA_METRIC_VALUE_HEADER, SOMA_METRIC_VALUE_LINES,
SOMA_METRIC_PERIOD, SOMA_PERIOD_RANGE and SOMA_METRIC
tables so that if there exists any metric assigned to the logged in employee for
the current date/time, this metric related information is displayed to the end-
user. Then, metric value entry interface is generated dynamically to give the
user ability to enter metrics.
POMMESUser
Login POMMESTool
Set of Metrics
Project--------------------------Metrics to be collected--------------------------
"Employee"/"Role"/
"Tool Attribute"Metrics to becollected from
--------------------------Collection Period
--------------------------Collection Mechanisms
POMMES MetricsValues Entry
Interface
Select"Metrics Values"
interface
Collect Datadirectlyfrom Employee
Metric Data
SOMA_METRIC_VALUE_HEADERSOMA_METRIC_VALUE_LINESSOMA_METRIC_ASSIGNMENTSOMA_METRIC_ASSIGN_EMP
SOMA_METRIC_PERIODSOMA_PERIOD_RANGE
SOMA_METRIC
Based On
Collect DatafromMS Project XMLbased Tables
SOMA_XPATH_VALUES<ProjectName>_<SelectedAttribute>
Figure 31 – POMMES Metrics Value Entry Functional Workflow
Dynamically generated interface need is for the Group Metric Values. If
metric collected is defined as a Group Metric, it has multiple metrics in its
context and the related metric value entry interface should be generated to
78
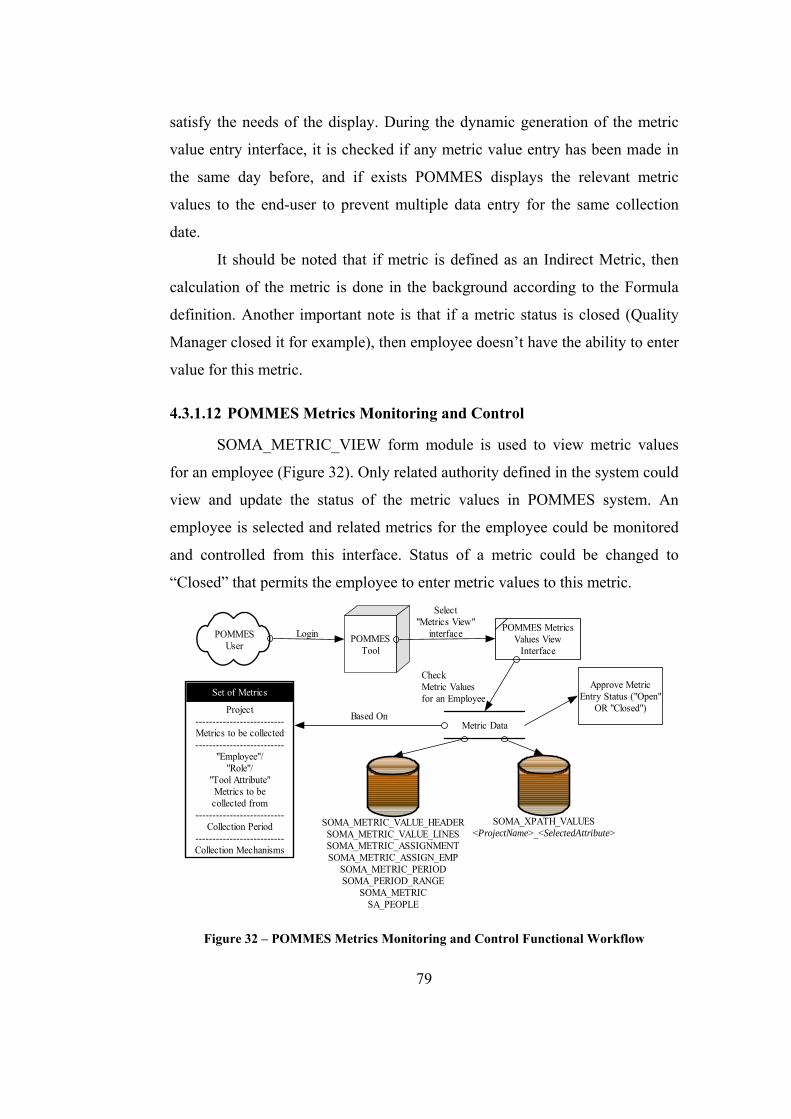
satisfy the needs of the display. During the dynamic generation of the metric
value entry interface, it is checked if any metric value entry has been made in
the same day before, and if exists POMMES displays the relevant metric
values to the end-user to prevent multiple data entry for the same collection
date.
It should be noted that if metric is defined as an Indirect Metric, then
calculation of the metric is done in the background according to the Formula
definition. Another important note is that if a metric status is closed (Quality
Manager closed it for example), then employee doesn’t have the ability to enter
value for this metric.
4.3.1.12 POMMES Metrics Monitoring and Control
SOMA_METRIC_VIEW form module is used to view metric values
for an employee (Figure 32). Only related authority defined in the system could
view and update the status of the metric values in POMMES system. An
employee is selected and related metrics for the employee could be monitored
and controlled from this interface. Status of a metric could be changed to
“Closed” that permits the employee to enter metric values to this metric.
POMMESUser
Login POMMESTool
Set of Metrics
Project--------------------------Metrics to be collected--------------------------
"Employee"/"Role"/
"Tool Attribute"Metrics to becollected from
--------------------------Collection Period
--------------------------Collection Mechanisms
POMMES MetricsValues View
Interface
Select"Metrics View"
interface
CheckMetric Valuesfor an Employee
Metric Data
SOMA_METRIC_VALUE_HEADERSOMA_METRIC_VALUE_LINESSOMA_METRIC_ASSIGNMENTSOMA_METRIC_ASSIGN_EMP
SOMA_METRIC_PERIODSOMA_PERIOD_RANGE
SOMA_METRICSA_PEOPLE
Based On
SOMA_XPATH_VALUES<ProjectName>_<SelectedAttribute>
Approve MetricEntry Status ("Open"
OR "Closed")
Figure 32 – POMMES Metrics Monitoring and Control Functional Workflow
79
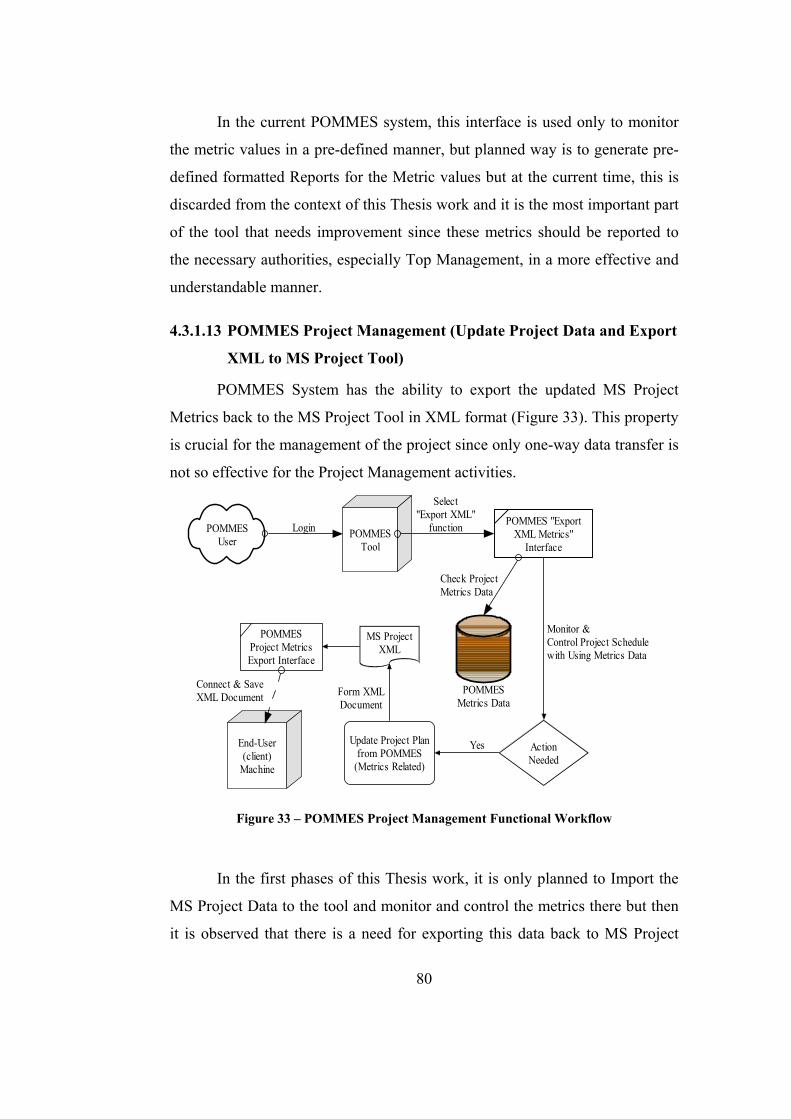
In the current POMMES system, this interface is used only to monitor
the metric values in a pre-defined manner, but planned way is to generate pre-
defined formatted Reports for the Metric values but at the current time, this is
discarded from the context of this Thesis work and it is the most important part
of the tool that needs improvement since these metrics should be reported to
the necessary authorities, especially Top Management, in a more effective and
understandable manner.
4.3.1.13 POMMES Project Management (Update Project Data and Export
XML to MS Project Tool)
POMMES System has the ability to export the updated MS Project
Metrics back to the MS Project Tool in XML format (Figure 33). This property
is crucial for the management of the project since only one-way data transfer is
not so effective for the Project Management activities.
POMMESUser
Login POMMESTool
POMMES "ExportXML Metrics"
Interface
Select"Export XML"
function
POMMESMetrics Data
Yes
POMMESProject MetricsExport Interface
End-User(client)
Machine
Connect & SaveXML Document
Check ProjectMetrics Data
ActionNeeded
Update Project Planfrom POMMES
(Metrics Related)
Monitor &Control Project Schedulewith Using Metrics Data
Form XMLDocument
MS ProjectXML
Figure 33 – POMMES Project Management Functional Workflow
In the first phases of this Thesis work, it is only planned to Import the
MS Project Data to the tool and monitor and control the metrics there but then
it is observed that there is a need for exporting this data back to MS Project
80
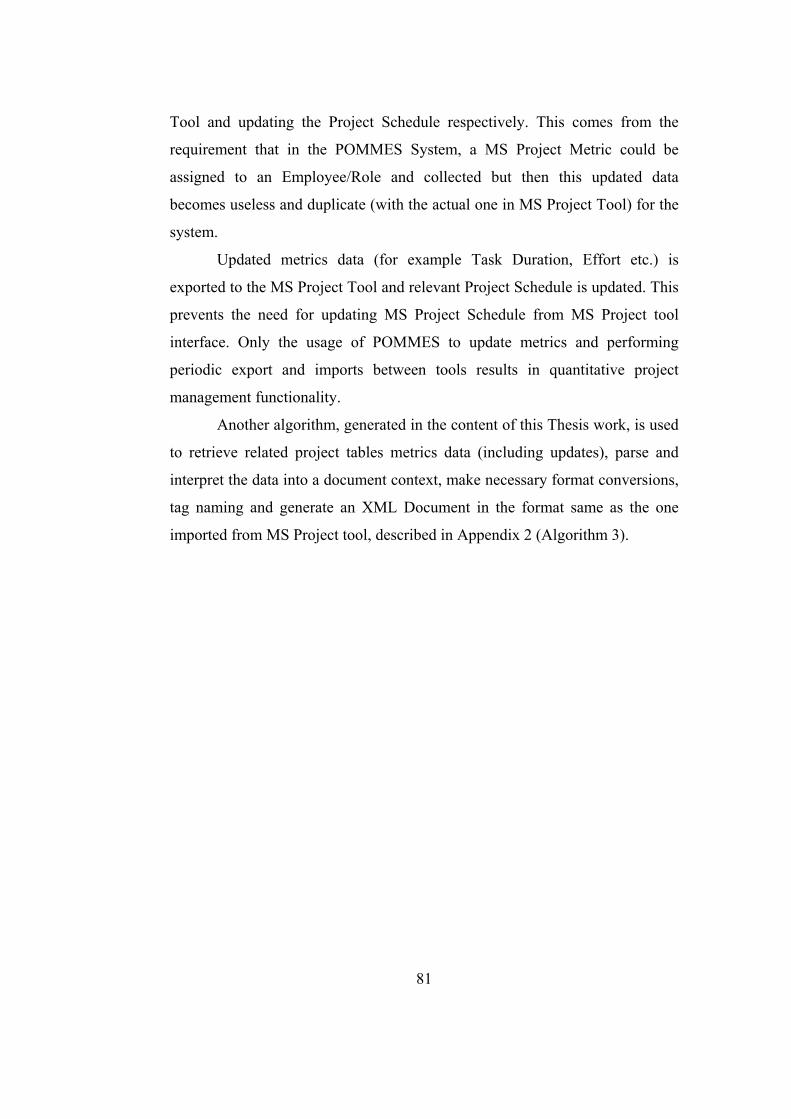
81
Tool and updating the Project Schedule respectively. This comes from the
requirement that in the POMMES System, a MS Project Metric could be
assigned to an Employee/Role and collected but then this updated data
becomes useless and duplicate (with the actual one in MS Project Tool) for the
system.
Updated metrics data (for example Task Duration, Effort etc.) is
exported to the MS Project Tool and relevant Project Schedule is updated. This
prevents the need for updating MS Project Schedule from MS Project tool
interface. Only the usage of POMMES to update metrics and performing
periodic export and imports between tools results in quantitative project
management functionality.
Another algorithm, generated in the content of this Thesis work, is used
to retrieve related project tables metrics data (including updates), parse and
interpret the data into a document context, make necessary format conversions,
tag naming and generate an XML Document in the format same as the one
imported from MS Project tool, described in Appendix 2 (Algorithm 3).
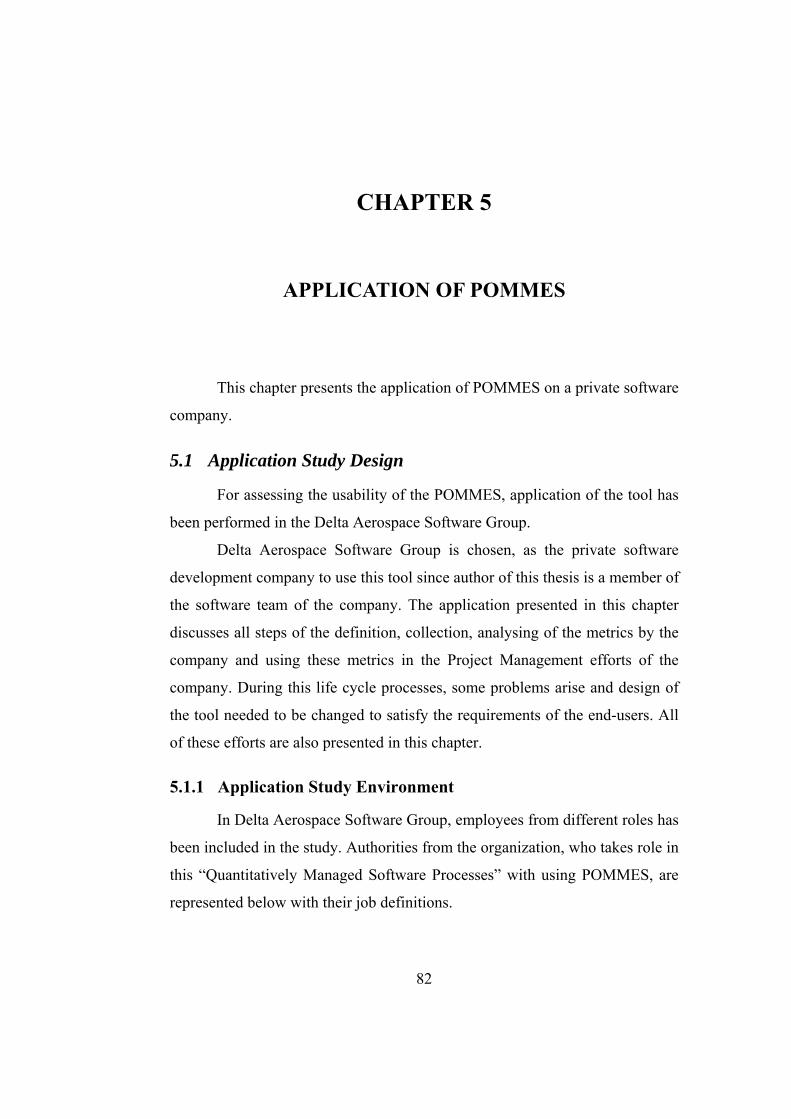
82
CHAPTER 5
APPLICATION OF POMMES
This chapter presents the application of POMMES on a private software
company.
5.1 Application Study Design
For assessing the usability of the POMMES, application of the tool has
been performed in the Delta Aerospace Software Group.
Delta Aerospace Software Group is chosen, as the private software
development company to use this tool since author of this thesis is a member of
the software team of the company. The application presented in this chapter
discusses all steps of the definition, collection, analysing of the metrics by the
company and using these metrics in the Project Management efforts of the
company. During this life cycle processes, some problems arise and design of
the tool needed to be changed to satisfy the requirements of the end-users. All
of these efforts are also presented in this chapter.
5.1.1 Application Study Environment
In Delta Aerospace Software Group, employees from different roles has
been included in the study. Authorities from the organization, who takes role in
this “Quantitatively Managed Software Processes” with using POMMES, are
represented below with their job definitions.
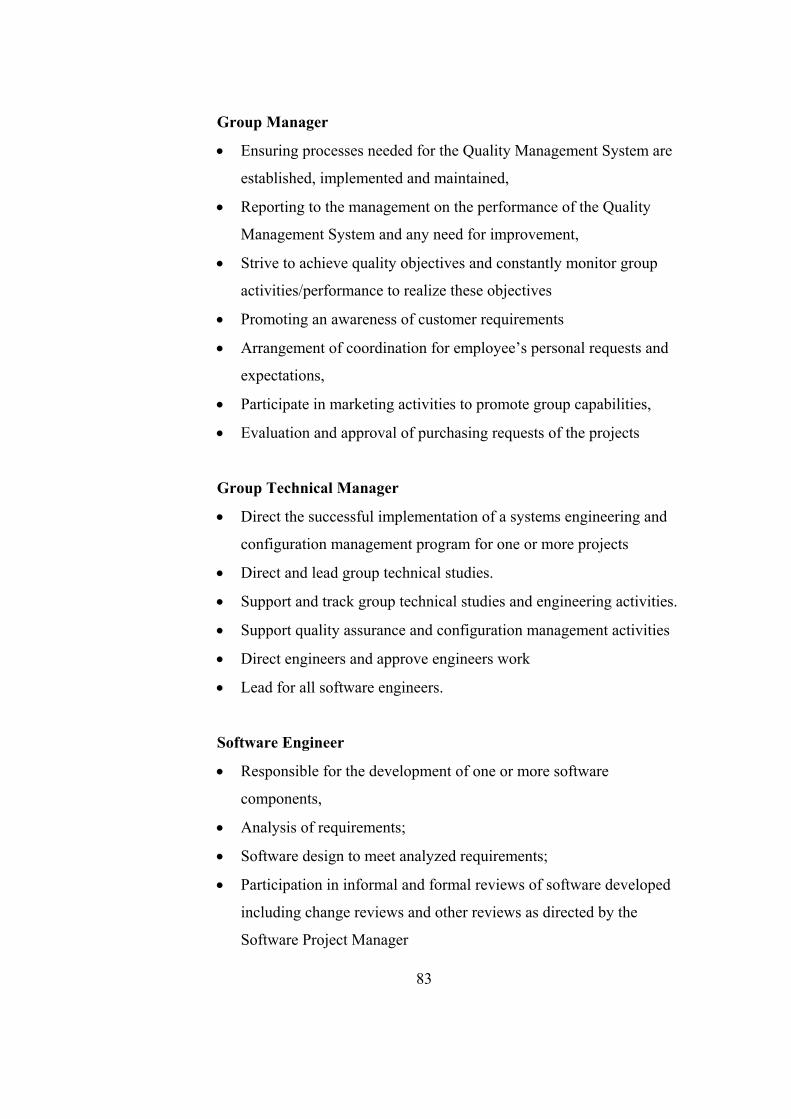
83
Group Manager
• Ensuring processes needed for the Quality Management System are
established, implemented and maintained,
• Reporting to the management on the performance of the Quality
Management System and any need for improvement,
• Strive to achieve quality objectives and constantly monitor group
activities/performance to realize these objectives
• Promoting an awareness of customer requirements
• Arrangement of coordination for employee’s personal requests and
expectations,
• Participate in marketing activities to promote group capabilities,
• Evaluation and approval of purchasing requests of the projects
Group Technical Manager
• Direct the successful implementation of a systems engineering and
configuration management program for one or more projects
• Direct and lead group technical studies.
• Support and track group technical studies and engineering activities.
• Support quality assurance and configuration management activities
• Direct engineers and approve engineers work
• Lead for all software engineers.
Software Engineer
• Responsible for the development of one or more software
components,
• Analysis of requirements;
• Software design to meet analyzed requirements;
• Participation in informal and formal reviews of software developed
including change reviews and other reviews as directed by the
Software Project Manager
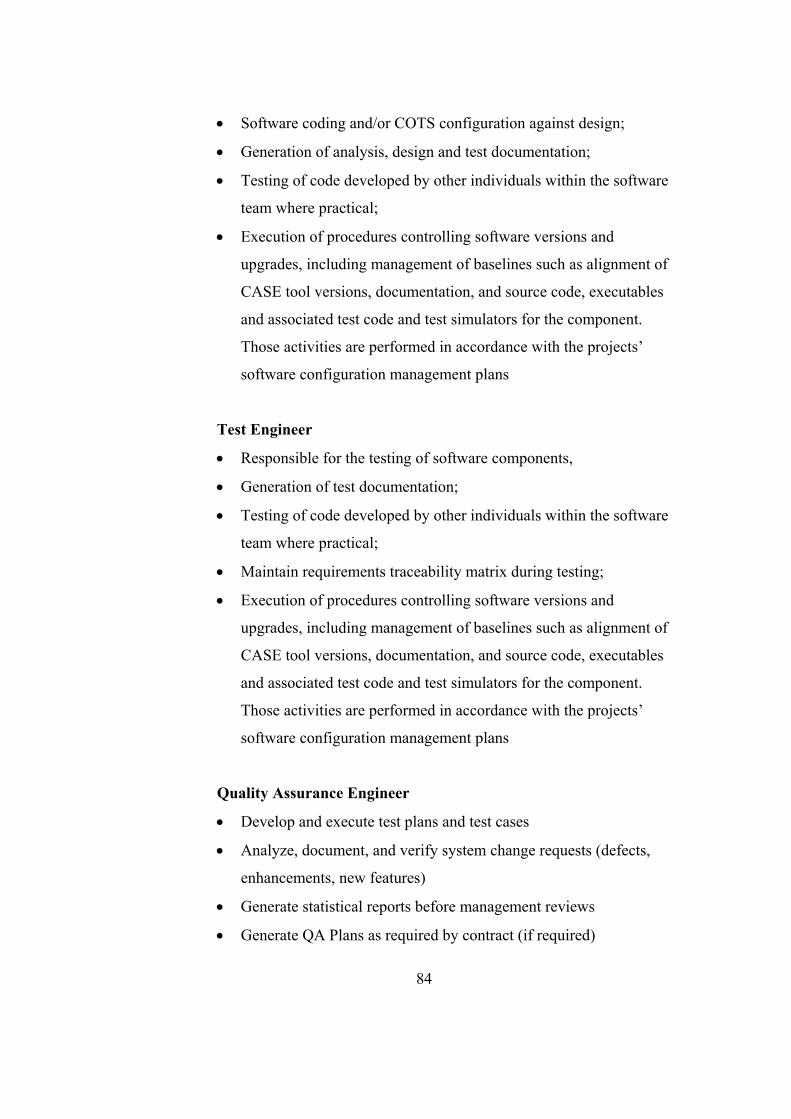
84
• Software coding and/or COTS configuration against design;
• Generation of analysis, design and test documentation;
• Testing of code developed by other individuals within the software
team where practical;
• Execution of procedures controlling software versions and
upgrades, including management of baselines such as alignment of
CASE tool versions, documentation, and source code, executables
and associated test code and test simulators for the component.
Those activities are performed in accordance with the projects’
software configuration management plans
Test Engineer
• Responsible for the testing of software components,
• Generation of test documentation;
• Testing of code developed by other individuals within the software
team where practical;
• Maintain requirements traceability matrix during testing;
• Execution of procedures controlling software versions and
upgrades, including management of baselines such as alignment of
CASE tool versions, documentation, and source code, executables
and associated test code and test simulators for the component.
Those activities are performed in accordance with the projects’
software configuration management plans
Quality Assurance Engineer
• Develop and execute test plans and test cases
• Analyze, document, and verify system change requests (defects,
enhancements, new features)
• Generate statistical reports before management reviews
• Generate QA Plans as required by contract (if required)
85
• Coordination and design of the testing process, and supporting the
design of applications to ensure appropriate quality engineering
from the beginning of the project
• Focus work on establishing and implementing quality processes
within the development process that lead to a quality release
• Working with test plans, testing of the software, identifying defects
in the code, and establishing metrics in a variety of areas
• Review and approve written procedures consistent with contract
specifications
Configuration Management Engineer
• Tracking systems engineering activities and its outcomes.
• Managing to a CM Plan for both hardware and software, overseeing
the institutionalization of the policies and procedures identified
within the plan, researching and implementing a CM tool,
supporting Program Configuration Board (PCB) and Technical
Configuration Control Board (TCCB).
• Identify change in products, documents, SW and HW
• Control change in products, documents, SW and HW
• Ensure that change is being properly implemented.
• Report changes to others who may have an interest.
• Update intranet and the documentation as required by configuration
changes within documentation and product realization.
• Handle document distribution activities
There are 7 personnel from AE, EE, IE, IS, BA disciplines in the
organization. Two software engineers have got 5 to 7 years experience. There
is a junior software engineer in his first year of experience, also with the role of
configuration engineer. Two test engineers have got 11 to 15 years of
experience. Quality engineer has got 5 years of experience. Group Manager has
86
got 12 years of experience. It should be mentioned that since Delta Aerospace
Software Group is a small company, some team members have multiple roles,
as being a configuration engineer and also software engineer. In the usage of
POMMES, every team member should have been assigned a specific role in
the system and metric assignments have been made based on the role.
The company has provided two projects and related members of these
projects to be included in the study; one of them is a large-scale military
project continuing for more than 3 years and other one is a small-scale MIS
project started 1 month before the application of the tool performed in the
company. With the small-scale project, metrics related with first phases of the
development life cycle processes (mainly requirement development and
design) and with the large-scale project, metrics related with mid-and-final
phases of the development life cycle processes (coding, testing and
requirements management mainly) have been observed and studied.
5.1.2 Application Study Database
Metrics defined and collected during the application of POMMES has
been kept in ORACLE Database. All the other system, project and team
members related data has also been kept in ORACLE Database since design of
POMMES form modules are all based on the ORACLE Database and
Development Tools.
Because of the security reasons, none of the metrics data has been
enabled to check directly from database, but instead for reporting of the study
results, an MS Excel Sheet format data has been prepared to show the major
components of the measurement results.
5.1.3 Application Study Anonymity
Since the company is working in Military sector and the entire project
related information and metrics data are highly confidential, name of the
projects and related Project Plans of the projects are all kept confidential. For
the security reasons and not to create any pressure and stressful environment on
87
project members, metric data values are said not to be 100 percent accurate as
in the real project data and users of the tool are allowed to enter metric values
freely without checking accuracy of the data. This doesn’t cause problem for
the reliability of the study since the aim of this study is not to check the
accuracy of the values and create usable reports but to check the application of
the tool and its functionalities.
5.2 Application of POMMES
Tool evaluation made by the company in this study is based on
validating the POMMES’s adequacy to meet the functional requirements
introduced in Chapter 4 (mainly in Section 4.3). This is accomplished with
covering major functional attributes and processes presented above; each is
defined in this chapter within separate section.
o Determination of Software Project Measures (GQM)
o Selection of Measures
o User-Defined Metrics
o Project Attributes and Metrics
o Collection of Metrics
o Analyse Metrics
o Project Management Efforts
o Performance
This study required some prerequisites to be fulfilled by the company,
to succeed. Most important requisite for the company is to establish a group for
learning the “quantitative project management” requirements and
implementing this approach to the current organizational processes. A group of
people is assigned to work on this approach and implement the process with
using POMMES to the current projects of the company. Second point is that
metric collection efforts need to be tracked by the project managers of the
company and needs to be forced to enter the metric values when relevant
88
warning messages came to them. If none of the metrics are collected on time,
the results cannot be gathered effectively. Final expectation from the company
team members is to give necessary feedbacks about the usage of the tool and
functionalities to related authorities, that is actually the most important point
for the validation and important of the tool for future work.
5.2.1 Determination of Software Project Measures (GQM)
This study is mentioned here in this chapter but actually it is the first
part of the study made in the company before development of the POMMES. It
includes determination of the software project measures for the proper design
of the tool and all the details of this work are presented in Section 3.1. It is
presented here again because the company uses this set of software project
measures in selection of software project measures used in the tool.
5.2.2 Selection of Measures
For evaluation of the functional requirements of the tool, there is a need
to select and force some measures to be entered and collected by the end-user.
Within freely entered metrics, there should be some metrics that needs to be
selected for some specific software project attributes. These attributes are all
defined in Section 3.2 and Appendix 1 as set of software project measures, and
in this study this set of project metrics are all distributed to the Delta Aerospace
Software Group members and requested to enter metrics from this list
according to the task they are working on their project.
As the set of software project measures in Appendix 1 are formed to
cover all possible metrics to be collected for a software project, everyone need
to find related measure for his/her project task. In this part of the study, it is
reported that this set of software project measures serve as a complete set for
every software process.
Coverage of the measure has been narrowed or broadened to cover
related task better by the team members, but complete set of measures fits for
the company.
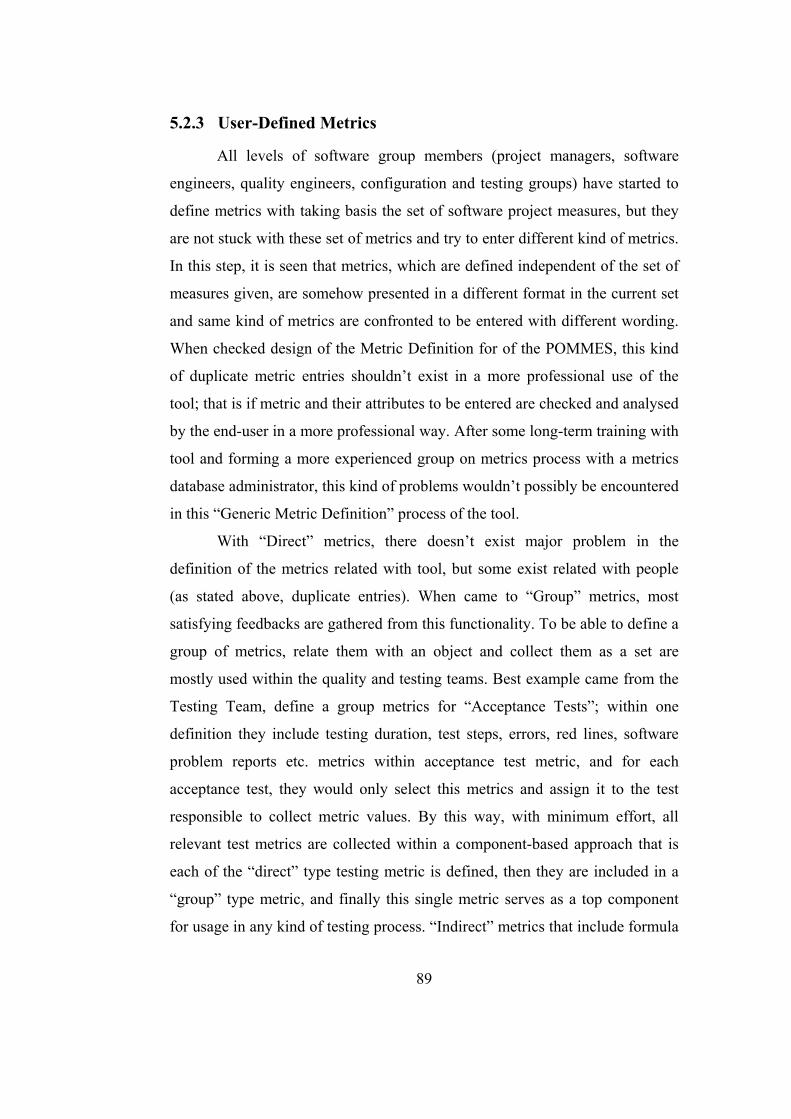
89
5.2.3 User-Defined Metrics
All levels of software group members (project managers, software
engineers, quality engineers, configuration and testing groups) have started to
define metrics with taking basis the set of software project measures, but they
are not stuck with these set of metrics and try to enter different kind of metrics.
In this step, it is seen that metrics, which are defined independent of the set of
measures given, are somehow presented in a different format in the current set
and same kind of metrics are confronted to be entered with different wording.
When checked design of the Metric Definition for of the POMMES, this kind
of duplicate metric entries shouldn’t exist in a more professional use of the
tool; that is if metric and their attributes to be entered are checked and analysed
by the end-user in a more professional way. After some long-term training with
tool and forming a more experienced group on metrics process with a metrics
database administrator, this kind of problems wouldn’t possibly be encountered
in this “Generic Metric Definition” process of the tool.
With “Direct” metrics, there doesn’t exist major problem in the
definition of the metrics related with tool, but some exist related with people
(as stated above, duplicate entries). When came to “Group” metrics, most
satisfying feedbacks are gathered from this functionality. To be able to define a
group of metrics, relate them with an object and collect them as a set are
mostly used within the quality and testing teams. Best example came from the
Testing Team, define a group metrics for “Acceptance Tests”; within one
definition they include testing duration, test steps, errors, red lines, software
problem reports etc. metrics within acceptance test metric, and for each
acceptance test, they would only select this metrics and assign it to the test
responsible to collect metric values. By this way, with minimum effort, all
relevant test metrics are collected within a component-based approach that is
each of the “direct” type testing metric is defined, then they are included in a
“group” type metric, and finally this single metric serves as a top component
for usage in any kind of testing process. “Indirect” metrics that include formula
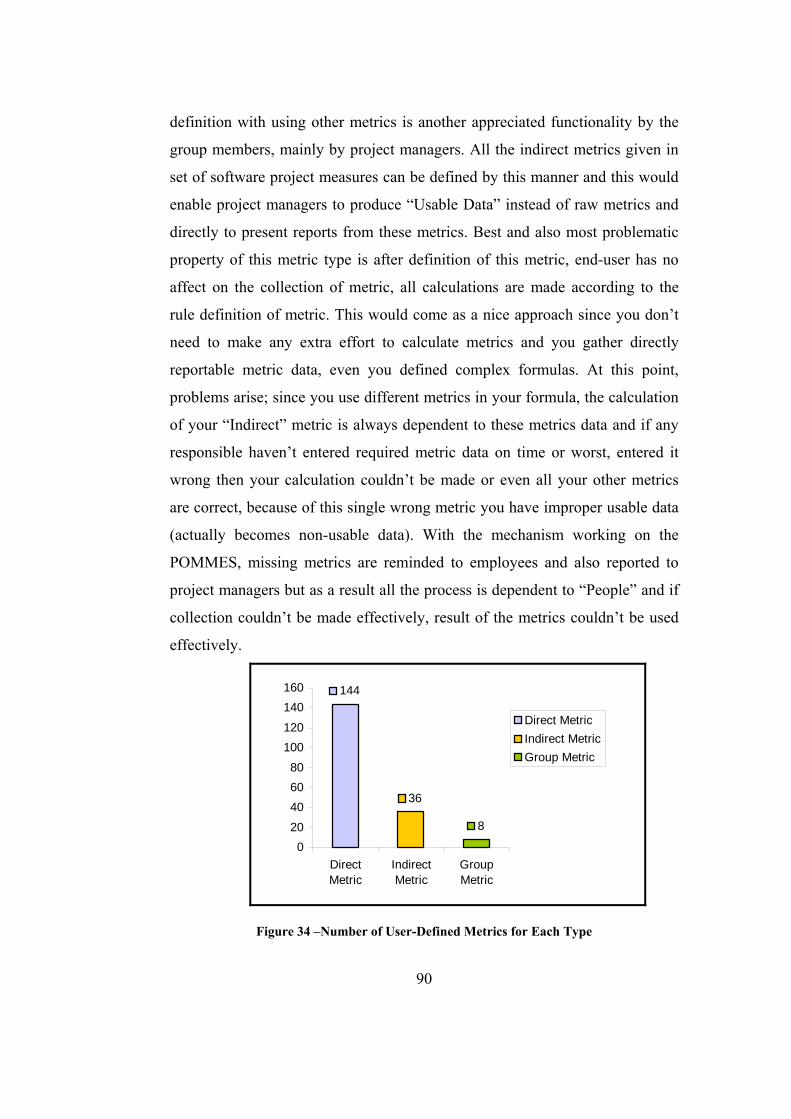
definition with using other metrics is another appreciated functionality by the
group members, mainly by project managers. All the indirect metrics given in
set of software project measures can be defined by this manner and this would
enable project managers to produce “Usable Data” instead of raw metrics and
directly to present reports from these metrics. Best and also most problematic
property of this metric type is after definition of this metric, end-user has no
affect on the collection of metric, all calculations are made according to the
rule definition of metric. This would come as a nice approach since you don’t
need to make any extra effort to calculate metrics and you gather directly
reportable metric data, even you defined complex formulas. At this point,
problems arise; since you use different metrics in your formula, the calculation
of your “Indirect” metric is always dependent to these metrics data and if any
responsible haven’t entered required metric data on time or worst, entered it
wrong then your calculation couldn’t be made or even all your other metrics
are correct, because of this single wrong metric you have improper usable data
(actually becomes non-usable data). With the mechanism working on the
POMMES, missing metrics are reminded to employees and also reported to
project managers but as a result all the process is dependent to “People” and if
collection couldn’t be made effectively, result of the metrics couldn’t be used
effectively.
36
8
144
020406080
100120140160
DirectMetric
IndirectMetric
GroupMetric
Direct MetricIndirect MetricGroup Metric
Figure 34 –Number of User-Defined Metrics for Each Type
90
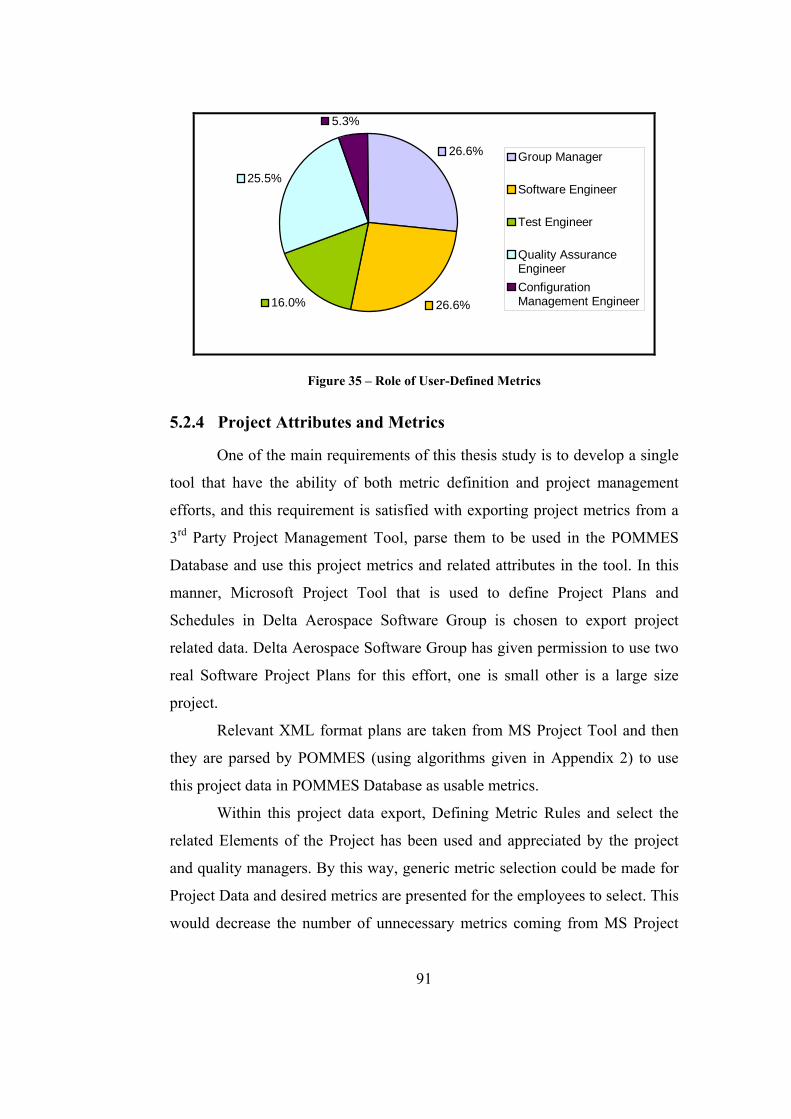
26.6%16.0%
25.5%
5.3%
26.6% Group Manager
Software Engineer
Test Engineer
Quality AssuranceEngineerConfigurationManagement Engineer
Figure 35 – Role of User-Defined Metrics
5.2.4 Project Attributes and Metrics
One of the main requirements of this thesis study is to develop a single
tool that have the ability of both metric definition and project management
efforts, and this requirement is satisfied with exporting project metrics from a
3rd Party Project Management Tool, parse them to be used in the POMMES
Database and use this project metrics and related attributes in the tool. In this
manner, Microsoft Project Tool that is used to define Project Plans and
Schedules in Delta Aerospace Software Group is chosen to export project
related data. Delta Aerospace Software Group has given permission to use two
real Software Project Plans for this effort, one is small other is a large size
project.
Relevant XML format plans are taken from MS Project Tool and then
they are parsed by POMMES (using algorithms given in Appendix 2) to use
this project data in POMMES Database as usable metrics.
Within this project data export, Defining Metric Rules and select the
related Elements of the Project has been used and appreciated by the project
and quality managers. By this way, generic metric selection could be made for
Project Data and desired metrics are presented for the employees to select. This
would decrease the number of unnecessary metrics coming from MS Project
91
Tool; here “unnecessary” states the need of metric to be used in Project
Management process.
After selecting which metrics are to be included in the system, those
metrics are then available for employees to use them in the “Generic Metric
Definition” process. Either they can directly select a MS Project metric to be
included in the system (for example Task Effort, Cost, Duration, Assignee etc.)
or they can use MS Project Task data to define collection dates for other
metrics related with MS Project Data (for example Task Start, End dates etc.),
by this way Project Plan data are directly included in the system and dynamic
generation has been maintained by two different tools, “two tools can
communicate now”.
4
5039
73
45
01020304050607080
Assign
ment
Calend
ar
Projec
t
Resou
rce Task
AssignmentCalendarProjectResourceTask
Figure 36 – Number of Project Metrics for Each Project Attribute
In the view of usage of project metrics, during the application of the
tool in the company, a lot of feedbacks are taken regarding “Project Elements”
definition forms and storage of Project Metrics in database. Project Elements
definition design has been slightly changed to discarding type of project
metrics, none of the people wants to select/change type of project metrics, they
are automatically stored in the database without showing the type of them to
the end-user. Also, when multiple projects are used in POMMES, it is seen that
some tables are designed to support single project data and result in losing data
or confusion when using project attributes, so database design has been slightly
92
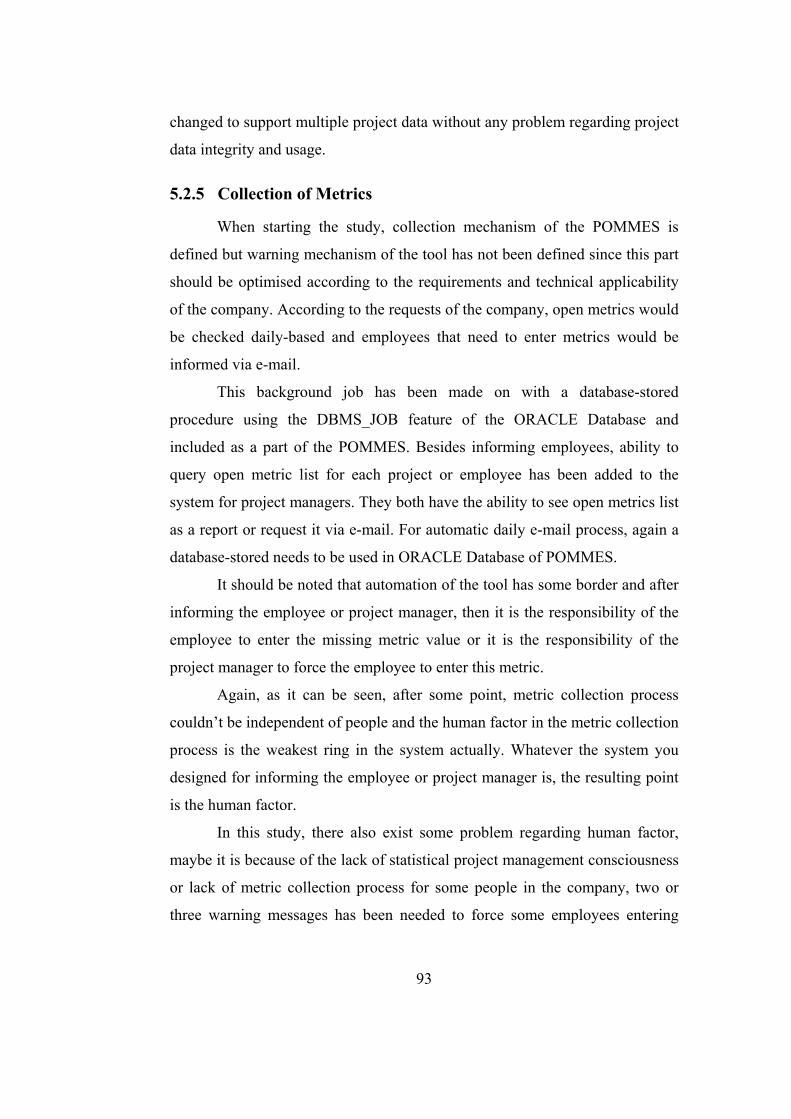
93
changed to support multiple project data without any problem regarding project
data integrity and usage.
5.2.5 Collection of Metrics
When starting the study, collection mechanism of the POMMES is
defined but warning mechanism of the tool has not been defined since this part
should be optimised according to the requirements and technical applicability
of the company. According to the requests of the company, open metrics would
be checked daily-based and employees that need to enter metrics would be
informed via e-mail.
This background job has been made on with a database-stored
procedure using the DBMS_JOB feature of the ORACLE Database and
included as a part of the POMMES. Besides informing employees, ability to
query open metric list for each project or employee has been added to the
system for project managers. They both have the ability to see open metrics list
as a report or request it via e-mail. For automatic daily e-mail process, again a
database-stored needs to be used in ORACLE Database of POMMES.
It should be noted that automation of the tool has some border and after
informing the employee or project manager, then it is the responsibility of the
employee to enter the missing metric value or it is the responsibility of the
project manager to force the employee to enter this metric.
Again, as it can be seen, after some point, metric collection process
couldn’t be independent of people and the human factor in the metric collection
process is the weakest ring in the system actually. Whatever the system you
designed for informing the employee or project manager is, the resulting point
is the human factor.
In this study, there also exist some problem regarding human factor,
maybe it is because of the lack of statistical project management consciousness
or lack of metric collection process for some people in the company, two or
three warning messages has been needed to force some employees entering
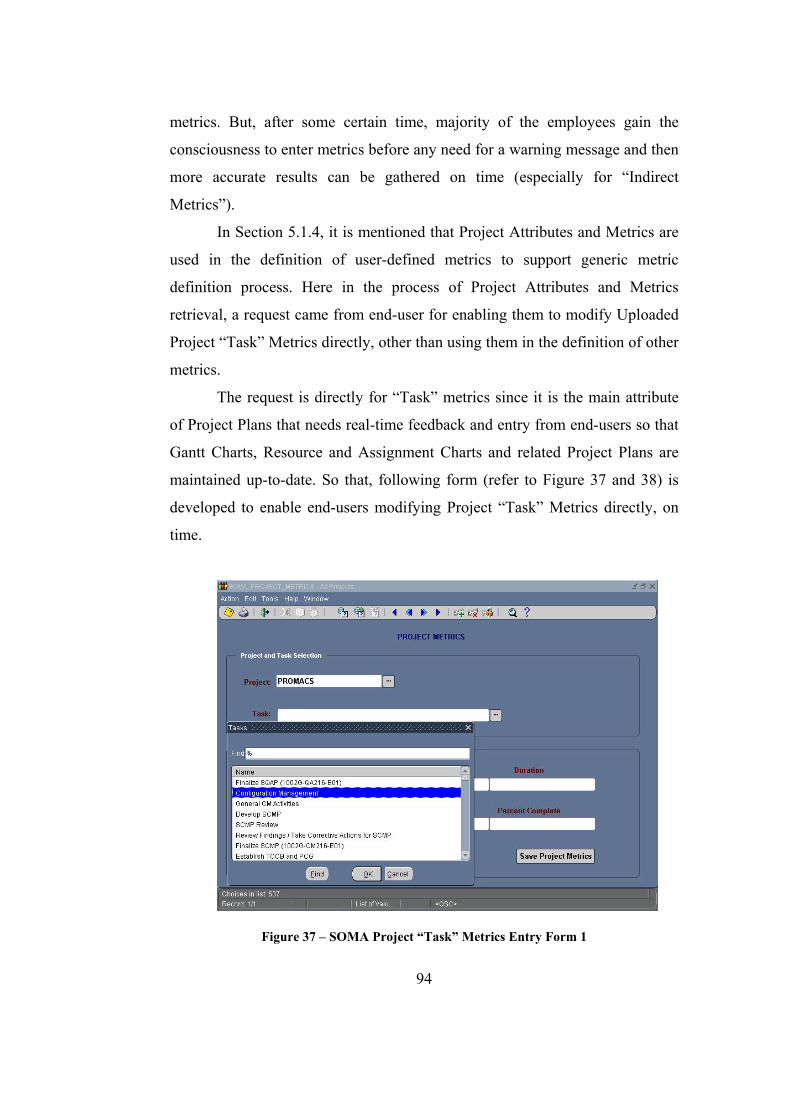
metrics. But, after some certain time, majority of the employees gain the
consciousness to enter metrics before any need for a warning message and then
more accurate results can be gathered on time (especially for “Indirect
Metrics”).
In Section 5.1.4, it is mentioned that Project Attributes and Metrics are
used in the definition of user-defined metrics to support generic metric
definition process. Here in the process of Project Attributes and Metrics
retrieval, a request came from end-user for enabling them to modify Uploaded
Project “Task” Metrics directly, other than using them in the definition of other
metrics.
The request is directly for “Task” metrics since it is the main attribute
of Project Plans that needs real-time feedback and entry from end-users so that
Gantt Charts, Resource and Assignment Charts and related Project Plans are
maintained up-to-date. So that, following form (refer to Figure 37 and 38) is
developed to enable end-users modifying Project “Task” Metrics directly, on
time.
Figure 37 – SOMA Project “Task” Metrics Entry Form 1
94
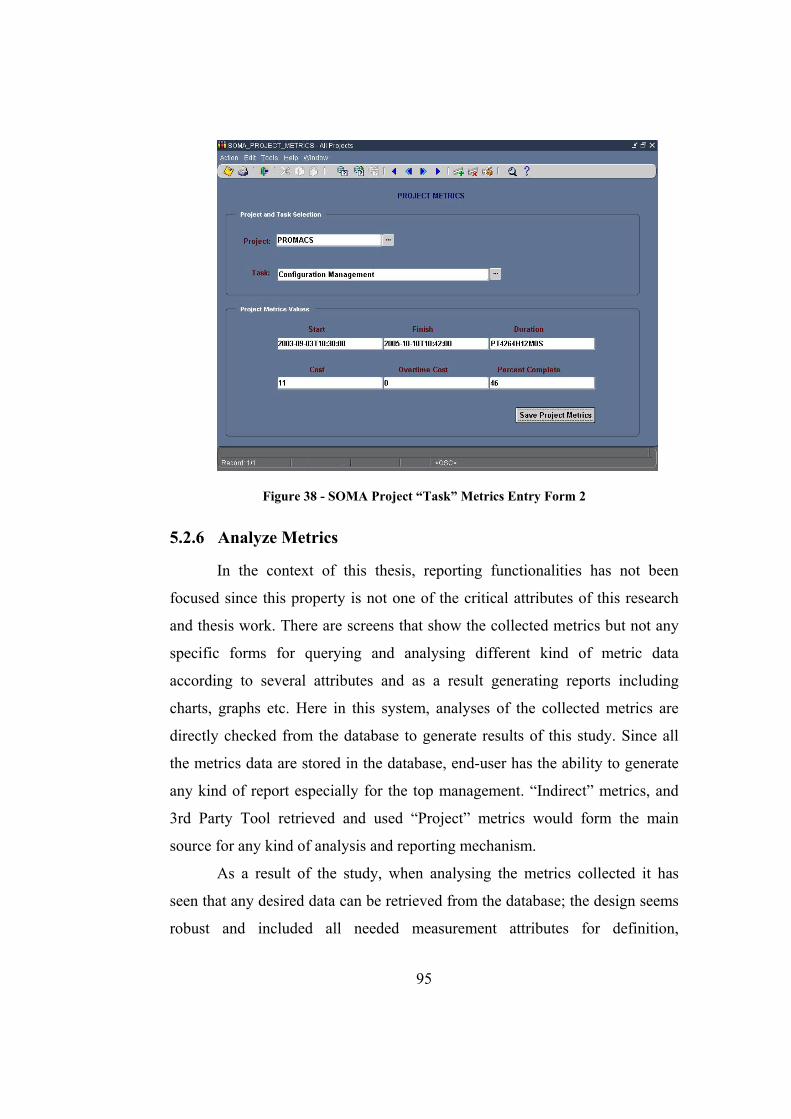
Figure 38 - SOMA Project “Task” Metrics Entry Form 2
5.2.6 Analyze Metrics
In the context of this thesis, reporting functionalities has not been
focused since this property is not one of the critical attributes of this research
and thesis work. There are screens that show the collected metrics but not any
specific forms for querying and analysing different kind of metric data
according to several attributes and as a result generating reports including
charts, graphs etc. Here in this system, analyses of the collected metrics are
directly checked from the database to generate results of this study. Since all
the metrics data are stored in the database, end-user has the ability to generate
any kind of report especially for the top management. “Indirect” metrics, and
3rd Party Tool retrieved and used “Project” metrics would form the main
source for any kind of analysis and reporting mechanism.
As a result of the study, when analysing the metrics collected it has
seen that any desired data can be retrieved from the database; the design seems
robust and included all needed measurement attributes for definition,
95
96
assignment and collection of metrics. Database design allows turning raw
metrics into usable metrics with relevant queries according to type, process
status etc. and results can be used in project management efforts for Delta
Aerospace Company. If different kind of reports could be generated directly
from the application interface instead of querying metrics directly from
database, upper level management are able to evaluate metric data from
POMMES. Instead in the current design, end-user needs to query metrics data
with traditional SQL and ORACLE Database knowledge since no reporting
interface exists in POMMES.
5.2.7 Project Management Efforts
From third party project management tools (MS Project), project
attributes and metrics can be exported into POMMES metrics database
however functional requirements of POMMES require establishing two-way
communication (export and import metric data) with third party project
management tools.
For satisfying this requirement, Project Plan generation from POMMES
Database is included in the system and tested on this study with two different
projects. It is checked that if exported project data in POMMES could be
exported back when these metric values are “modified”. This functionality has
been performed successfully without any data integrity problem on Delta
Aerospace Company. “Task Effort” metric data retrieved from MS Project is
updated from POMMES to reflect the current condition in the project, and then
tried to generate MS Project XML Format document from these modified task
metrics.
Using the parsing algorithms (given in Appendix 2) for generating
XML document from POMMES Metrics database, MS Project Plan is
generated with updated data and then validated in MS Project tool without any
problems. In this XML Generation process, same problem, which has been
reported before, has encountered again; the Database Design supports only a
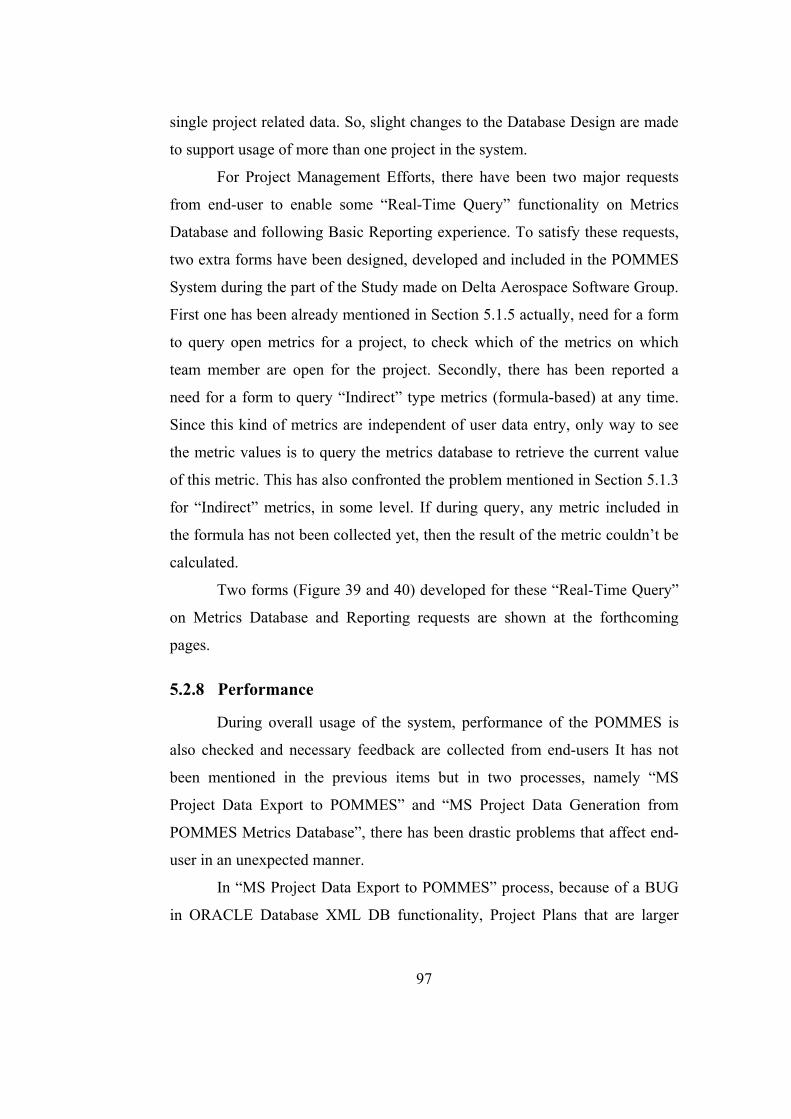
97
single project related data. So, slight changes to the Database Design are made
to support usage of more than one project in the system.
For Project Management Efforts, there have been two major requests
from end-user to enable some “Real-Time Query” functionality on Metrics
Database and following Basic Reporting experience. To satisfy these requests,
two extra forms have been designed, developed and included in the POMMES
System during the part of the Study made on Delta Aerospace Software Group.
First one has been already mentioned in Section 5.1.5 actually, need for a form
to query open metrics for a project, to check which of the metrics on which
team member are open for the project. Secondly, there has been reported a
need for a form to query “Indirect” type metrics (formula-based) at any time.
Since this kind of metrics are independent of user data entry, only way to see
the metric values is to query the metrics database to retrieve the current value
of this metric. This has also confronted the problem mentioned in Section 5.1.3
for “Indirect” metrics, in some level. If during query, any metric included in
the formula has not been collected yet, then the result of the metric couldn’t be
calculated.
Two forms (Figure 39 and 40) developed for these “Real-Time Query”
on Metrics Database and Reporting requests are shown at the forthcoming
pages.
5.2.8 Performance
During overall usage of the system, performance of the POMMES is
also checked and necessary feedback are collected from end-users It has not
been mentioned in the previous items but in two processes, namely “MS
Project Data Export to POMMES” and “MS Project Data Generation from
POMMES Metrics Database”, there has been drastic problems that affect end-
user in an unexpected manner.
In “MS Project Data Export to POMMES” process, because of a BUG
in ORACLE Database XML DB functionality, Project Plans that are larger
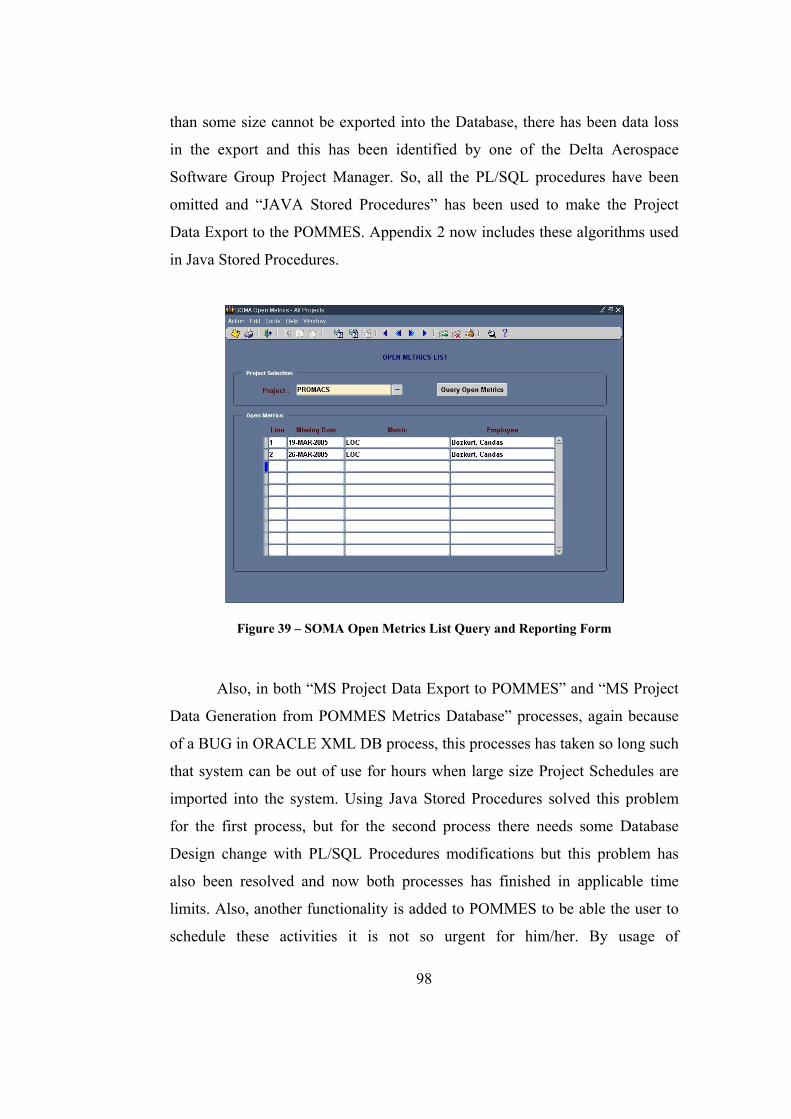
than some size cannot be exported into the Database, there has been data loss
in the export and this has been identified by one of the Delta Aerospace
Software Group Project Manager. So, all the PL/SQL procedures have been
omitted and “JAVA Stored Procedures” has been used to make the Project
Data Export to the POMMES. Appendix 2 now includes these algorithms used
in Java Stored Procedures.
Figure 39 – SOMA Open Metrics List Query and Reporting Form
Also, in both “MS Project Data Export to POMMES” and “MS Project
Data Generation from POMMES Metrics Database” processes, again because
of a BUG in ORACLE XML DB process, this processes has taken so long such
that system can be out of use for hours when large size Project Schedules are
imported into the system. Using Java Stored Procedures solved this problem
for the first process, but for the second process there needs some Database
Design change with PL/SQL Procedures modifications but this problem has
also been resolved and now both processes has finished in applicable time
limits. Also, another functionality is added to POMMES to be able the user to
schedule these activities it is not so urgent for him/her. By usage of
98
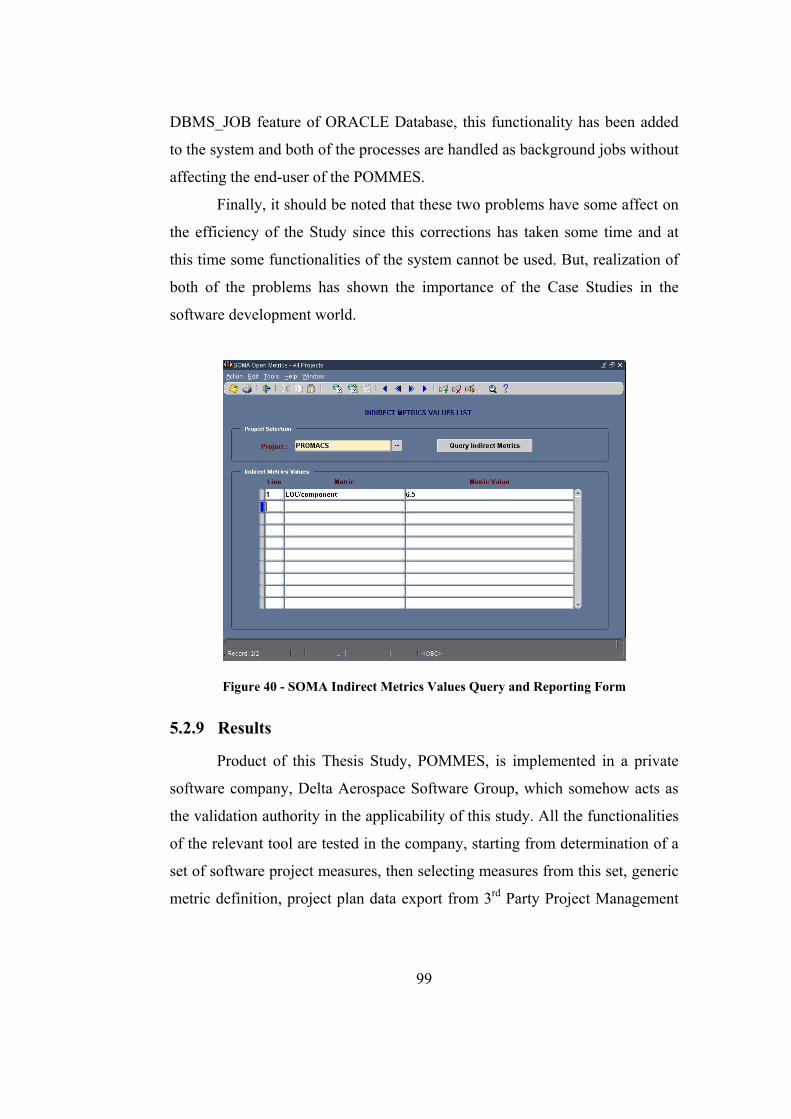
DBMS_JOB feature of ORACLE Database, this functionality has been added
to the system and both of the processes are handled as background jobs without
affecting the end-user of the POMMES.
Finally, it should be noted that these two problems have some affect on
the efficiency of the Study since this corrections has taken some time and at
this time some functionalities of the system cannot be used. But, realization of
both of the problems has shown the importance of the Case Studies in the
software development world.
Figure 40 - SOMA Indirect Metrics Values Query and Reporting Form
5.2.9 Results
Product of this Thesis Study, POMMES, is implemented in a private
software company, Delta Aerospace Software Group, which somehow acts as
the validation authority in the applicability of this study. All the functionalities
of the relevant tool are tested in the company, starting from determination of a
set of software project measures, then selecting measures from this set, generic
metric definition, project plan data export from 3rd Party Project Management
99
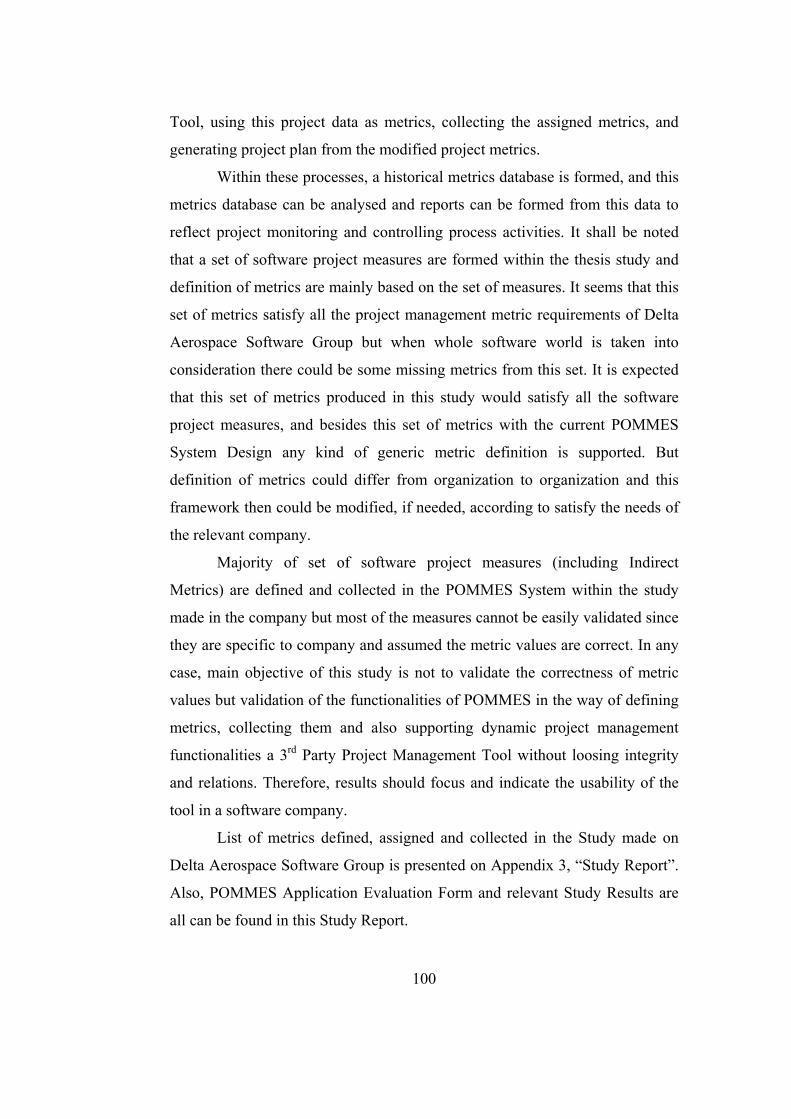
100
Tool, using this project data as metrics, collecting the assigned metrics, and
generating project plan from the modified project metrics.
Within these processes, a historical metrics database is formed, and this
metrics database can be analysed and reports can be formed from this data to
reflect project monitoring and controlling process activities. It shall be noted
that a set of software project measures are formed within the thesis study and
definition of metrics are mainly based on the set of measures. It seems that this
set of metrics satisfy all the project management metric requirements of Delta
Aerospace Software Group but when whole software world is taken into
consideration there could be some missing metrics from this set. It is expected
that this set of metrics produced in this study would satisfy all the software
project measures, and besides this set of metrics with the current POMMES
System Design any kind of generic metric definition is supported. But
definition of metrics could differ from organization to organization and this
framework then could be modified, if needed, according to satisfy the needs of
the relevant company.
Majority of set of software project measures (including Indirect
Metrics) are defined and collected in the POMMES System within the study
made in the company but most of the measures cannot be easily validated since
they are specific to company and assumed the metric values are correct. In any
case, main objective of this study is not to validate the correctness of metric
values but validation of the functionalities of POMMES in the way of defining
metrics, collecting them and also supporting dynamic project management
functionalities a 3rd Party Project Management Tool without loosing integrity
and relations. Therefore, results should focus and indicate the usability of the
tool in a software company.
List of metrics defined, assigned and collected in the Study made on
Delta Aerospace Software Group is presented on Appendix 3, “Study Report”.
Also, POMMES Application Evaluation Form and relevant Study Results are
all can be found in this Study Report.
101
Before concluding this section, it should be mentioned that lack of an
auxiliary tool, similar to YazOlc-Yardim Tool [37], to collect user-defined
metrics defined in the POMMES from CASE Tools is perceived. In POMMES
System, during metric definition, metric is assigned to an object but since there
is no defined interface with any tool to collect metrics, these linked objects are
static and end-user always need to enter metric values for the related object
attribute instead of collecting it from a 3rd Party Tool. In [37], a tool is
designed that aims measurement of a software development process and acts as
an interface with CASE Tools to collect five group of metrics (namely Defects,
Problem Report Status, Review Status, Source File and Complexity Measures).
But this is not applicable for POMMES since for enabling such a system there
needs developing an interface for each user-defined metric, so this would
somehow restrict the generic metric definition concept by limiting metrics
definition with only the ones that has an interface with a tool. For future
improvements, it is the most important functionality to develop interfaces for
automatically collecting metrics from CASE Tools since this is one of the most
desired “un-supported” features of the POMMES in the current design.
102
CHAPTER 6
CONCLUSION
This chapter finalizes this study by presenting “Quantitative Project
Management” objective and aim fulfilled by the development of POMMES.
On the other hand incomplete parts and applications of this tool, which may
need development and improvement in the “Quantitative Project Management
with Usage of Metrics” concept, application of this concept, architecture of the
tool and functionalities of the tool shall be presented. Summary of future
improvement and development recommendations regarding the tool shall
conclude this chapter.
6.1 Thesis Concept
As explained in the introduction part of this thesis, importance of the
generic metric definition, metric collection process and project management
process are highlighted. Within this concept, project monitoring and control
process is analysed through functionalities lacking on existing software project
management tools. Since these two processes cannot be integrated using
existing Project Management and Metric Collection Tools available in the
market, thus cannot share a common metrics database this would result at
resource, cost and time loss in software projects.
One way to overcome these losses is to develop a single tool with the
multi-functional capability of generic metric definition, collection, retrieval of
project metrics data from third party project management tools and usage of
103
these collected project metrics data in software project planning, tracking and
oversight. So, POMMES is developed under this thesis study to satisfy these
integration needs.
One of the objectives is to assist software companies establishing
“Quantitative Project Management” process with the application of this tool in
their project software life cycle via revising and redefining the “Software
Project Management Planning, Tracking and Oversight” and “Metric
Collection” processes.
After redefining these two major processes according to needs of the
company, inputs, outputs and shared data shall be collected, used and analysed
by POMMES which will establish the “Quantitative Project Management”
activities and tasks. In this viewpoint, this tool shall support these processes by
forming a common metrics database that includes “Generic Metrics Definition”
and “Imported Project Management Metrics” data. Benefits of the common
metrics database formation via POMMES shall enlist the following:
• Easy project schedule tracking (according to collected metrics
data)
• Easy project attributes data tracking (resource, task, assignment
etc.)
• Easy project schedule maintenance (according to collected
metrics data from other tools)
• Organization visibility to schedule and project attributes
This tool shall provide the ability / possibility of improvement in
overall organizational processes, and the results of these improvements will
furnish company with better, accurate, correct, reliable estimations for the
future references. Also from software quality perspective, when better, correct,
accurate and reliable metric data collection is established and implemented
during software development life cycle, it shall highly improve the companies
organizational quality standards level and shall enable company to achieve the
104
requirements various “Software Quality Standards Certification” (e.g. CMMI,
ISO etc.) [36].
6.2 Fulfillment of Thesis Objectives and Aims
Two main objectives are Generic Metric Definition and Project
Management with Usage of Metrics are fulfilled by the development of the
POMMES that integrates both of the functionalities in a single tool. Generic
Metric Definition functionality is maintained mainly by SOMA_METRIC
module to give the ability to user for defining any type of metric (Direct,
Indirect, Group) with all the necessary metric attributes (Metric Type, Metric
Subtype, Unit, Measurement Method, Scale Type, Metric Object etc.).
Metric Attributes are designated by GQM Methodology to satisfy
collection of the entire software project metrics defined in Section 3.2. This set
of software project measures has been a template for defining the metrics in
POMMES System. User Defined Metric Definition is also maintained when
importing MS Project Metrics by SOMA_RULES module that gives the ability
to the user for selecting the Top Project Attributes and specifically Elements
(metrics) from them. This functionality gives the user to select metrics
available to be used.
SOMA_METRIC_ASSIGNMENT module has the competence to
define collection period for the User Defined Metrics and also MS Project
Metrics that results in combining Project Management and Metrics Tool
functionalities in a single tool. Also in the same module, metric collection
period can be assigned to the MS Project Task Attributes thus the Project
Milestones could be used as metric collection dates. By this way, project plan
attributes and user-defined project metric entities are combined and coupled.
Critical point that lies behind all of these functionalities is the need to use a
common metrics database. This is satisfied by SOMA_XML module with
importing, and parsing MS Project Tool Data so that it could be used in the
same manner as other User Defined Metrics in POMMES.
105
Import/export of project metrics establishes the two-way
communication between 3rd Party Project Management tool and POMMES
with introducing a critical requirement. Integration of data between two tools
shall be established with guarantying update of project metrics (project
schedule) only from POMMES interface. After importing metrics data to
POMMES, in case of any change on Project Schedule from 3rd Party Tool
interface shall result in loss of the data integrity and shall be obstructed for
accurate, correct, reliable project tracking and oversight. Project schedule,
which includes project metrics, shall only be updated with performing
POMMES functionalities and then updated project schedule shall be exported
back to 3rd Party Project Management tool.
Other than these fulfilled aims, POMMES also has some System
Administration modules that prevent the need the dependability to other 3rd
Party Tools for some basic Project Management activities. These critical
project management activities include Human Resources, Department Project
and Roles definitions, which are maintained by SA_PEOPLE,
SA_DEPARTMENTS modules, and PRM_PROJECTS, PRM_ROLES
database system administration tables respectively. After including Human
Resources module in POMMES, module maintains a secure Login System for
each employee (SA_LOGON module) and so Metric Collection activities
could be easily performed and controlled from a centric, web based, n-tier
application, “Warning” and “Reminder” mechanism for Metric Collection
requirements are all defined according to the needs of the companies and
maintained as scheduled ORACLE background jobs on the POMMES
Database. Through Application Server, all clients can be easily controlled and
monitored to prevent disorganization of metrics assignment and collection
activities, which is actually one of the biggest problems of large-scale
companies.
Usage of POMMES with the above mentioned capabilities would result
in development of a historical metrics database to be implemented in the future
106
project estimations and analysis. This historical metrics database could be
queried, project progress could be easily monitored with project metrics and
therefore, desired metrics analysis and reports could be generated, namely raw
data would be transferred into logical data. This contributes to all project
members becoming aware of the status of the project, and software
development life cycle phase activities are easily viewable.
6.3 Future Directions of Thesis Work
Recommendation for future improvement and development for
POMMES shall be described in this section. First of all the tool should be used
from initialisation phase to final product delivery during a project. All project
phases during a project life cycle will be implemented with POMMES, thus the
feedbacks and improvement suggestions from the project members will be
collected to evaluate and improve the tool. In this thesis, study has been only
performed on certain phases of the projects for a defined time period. During
this implementation, requirements for forming a “Historical” Metrics Database
should be analysed and identified. Current design hasn’t been satisfying the
necessary database design requirements. Thus, necessary design changes
should be made on both POMMES Database and Forms for establishing a
“Historical” Metrics Database.
Second of all, although the tool generates “Usable Data” from the “Raw
Metrics Data”, reporting mechanism of these Usable Data in need of
improvement. Different reporting mechanisms, report formats and templates,
graphical reports should be provided in the tool and these metrics data should
be converted into more understandable format (as to generate weekly, monthly
status report, comparative or projected status to be presented to upper
management or customer). Since these kinds of reports include more clear,
understandable, accurate, reliable and easily accessible data, upper project
management shall easily be aware of the on-going activities, needs and
resources of the projects.
107
Another important functionality could be identifying existing or
potential deficiencies/risks for an on-going project and automatically reporting
them to the team members and upper management to take the necessary
precautions in order to prevent these risks and deficiencies from happening. If
Critical Values for each metric can be defined, an interface may be designed
and implemented to collect and calculated the critical values.
Last of all, retrieving Metric Objects from other 3rd Party Tools may be
the most costly but also important functionality for POMMES. Such as
retrieving configuration items from a Configuration Management Tool (version
control tools), quantity and properties of requirements from a Requirements
Management Tool, or calculating SLOC (software lines of code) directly from
the Development Tool will provide organizations with correct, accurate,
reliable data with maximum EFFORT and TIME gain. POMMES. This will
result in a highly detailed and accurate Historical Metrics Database, but this
functionality could be only included in POMMES by developing parser
algorithms for each 3rd Party Tool, as done for MS Project Tool in the concept
of this thesis study.
108
REFERENCES
[1] The Standish Group International Inc. (2001). Extreme Chaos. Retrieved September 11, 2004, from http://www.standishgroup.com/sample_research/ PDFpages/
[2] SEPO. (2003). Software Management for Executives Guidebook, Version 1.8a. Retrieved September 25, 2004, from http://sepo.spawar.navy.mil/
[3] Basili V. R., Caldiera G., Rombach H. D. (1999). The Goal Question Metric Approach. Retrieved January 19, 2004, from http:// www.cs.umd.edu/projects/SoftEng/ESEG/papers/
[4] Bozkurt C. (2005). POMMES Technical Documentation. METU Information Systems.
[5] Fenton N. E., Pfleeger S. L. (1997). Software Metrics A Rigorous and Practical Approach, Second Edition. International Thomson Computer Press.
[6] CMMI for Systems Engineering and Software Engineering (CMMI-SE/SW, V1.1), Continuous Representation. (2002). Software Engineering Institue.
[7] Dumke R. R., Winkler A. S. (1977). Managing the Component-Based Software Engineering with Metrics. Retrieved August 15, 2004, from http:// doi.ieeecomputersociety.org/10.1109/AST.1997.599920
[8] IEEE Standard for a Software Quality Metrics Methodology, IEEE Std 1061-1998. (1998). Software Engineering Standards Committee of the IEEE Computer Society.
109
[9] Şengül E. S. (2001). Intermediate: An Integration Tool for Measurement Data Collection. METU Information Systems.
[10] Riguzzi F. (1996). A Survey of Software Metrics. Retrieved August 15, 2004, from http://www-lia.deis.unibo.it/Staff/FabrizioRiguzzi/
[11] SEPO. (1999). Software Process Improvement (SPI) Tracking and Oversight Procedure, Version 1.1. Retrieved November 16, 2003, from http:// sepo.spawar.navy.mil/
[12] Fitzhenry P., Gardiner G. (1995). Enhanced Software Project Management by Application of Metrics and Cost Estimation Techniques. Retrieved May 4, 2004, from http://intl.ieeexplore.ieee.org/xpl/abs_free.jsp?arNumber=494938
[13] Weller E. F., Fellow P. (1999). Using Metrics to Manage Software Projects”, Bull HN Information Systems. Retrieved December 2, 2003, from http://www.stt.com/
[14] A Guide to the Project Management Body Of Knowledge (PMBOK Guide). (2000). Project Management Institute.
[15] SEPO. Software Project Tracking and Oversight (Metrics), Version 3.6. Retrieved February 18, 2004, from http://sepo.spawar.navy.mil/
[16] McGarry J. J., Jones C. L. (1994). Application of a Quantitative Software Metrics Assessment Process to Military Software Development Programs. Retrieved June 27, 2003, from http://intl.ieeexplore.ieee.org/xpl/abs_free.jsp?arNumber=472701
[17] Daich G. T., Giles A. E. (1995). Universal Metrics Tools. Retrieved April 7, 2004, from http://www.stsc.hill.af.mil/crosstalk/1995/09/Universa.asp
[18] Integrated Computer Engineering Directorate, American Systems Corporation (2003). Risk Radar 3.3 User Manual. Retrieved October 1, 2003, from http://www.iceincusa.com/
110
[19] Laitenberger O., Dreyer H. M. (1998). Evaluating the Usefulness and the Ease of a Web-Based Inspection Data Collection Tool. Retrieved March 20, 2004, from http://www.iese.fraunhofer.de/network/ ISERN/pub/technical_reports/
[20] Wu C., Simmons D. B. (2000). Software Project Planning Associate (SSPA): A Knowledge-Based Approach for Dynamic Software Project Planning and Tracking. Retrieved October 1, 2003, from http://csdl.computer.org/comp/proceedings/compsac/2000/0792/00/07920305abs.htm
[21] HSS Web Based Project Metrics Collection and Analysis Tool. Retrieved September 20, 2003, from http://www.hssworld.com/services/Quality_web/tools/prj_matric.htm
[22] Duncan A. S. (1988). Software Development Productivity Tools and Metrics. Retrieved January 30, 2004, from http://intl.ieeexplore.ieee.org/xpl/abs_free.jsp?arNumber=93686
[23] TychoMetrics. Retrieved September 20, 2003, from http://www.tychometrics.com/products.htm
[24] SLIM – Suite (SLIM – Metrics, SLIM – DataManager, SLIM – Control). Retrieved September 19, 2003, from http://www.qsm.com/products.html
[25] Mercury Project Management. Retrieved September 26, 2003, from http://www.mercury.com/us/products/it-governance-center/project-management
[26] SPC Estimate. Retrieved September 20, 2003, from http://www.spc.ca/products/estimate/index.htm
[27] SEER-SEM (with SEER-SEM Client). Retrieved September 27, 2003, from http://www.galorath.com/tools_sem.shtm
[28] eProject. Retrieved September 10, 2003, from http://www.eproject.com
111
[29] Lam H. E., Maheswari P. (2001). Task and Team Management in the Distributed Software Project Management Tool. Retrieved April 2, 2004, from http://csdl.computer.org/comp/proceedings/compsac/2001/1372/00/13720401abs.htm
[30] Visibility Project Workbench. Retrieved September 25, 2003, from http://www.visibility.com/pages/2_4_ea_projwork.html
[31] Rational ProjectConsole. Retrieved September 22, 2003, from http://www-136.ibm.com/developerworks/rational/products/projectconsole
[32] Cognos Metrics Manager. Retrieved September 3, 2003, from http://www.cognos.com/products/metrics_manager
[33] Aimware Project Manager. Retrieved September 27, 2003, from http://www.aimware.com/projectmanager
[34] Primavera SureTrak Project Manager. Retrieved September 27, 2003, from http://www.primavera.com/products/sure.html
[35] Practical Software & Systems Measurement. Retrieved November 9, 2003, from http://www.psmsc.com
[36] Lordahl R. H. (1994). Starting a Large Scale Software Development Project Using the SEI CMM as the Guiding Vision. Retrieved July 8, 2003, from http://neptune2.mis.ttu.edu.tw/~ywang/cmmi/cmmi_paper.htm
[37] Eralp Ö. (2004). Design and Implementation of a Software Development Process Measurement System. METU Electrical and Electronics Engineering.
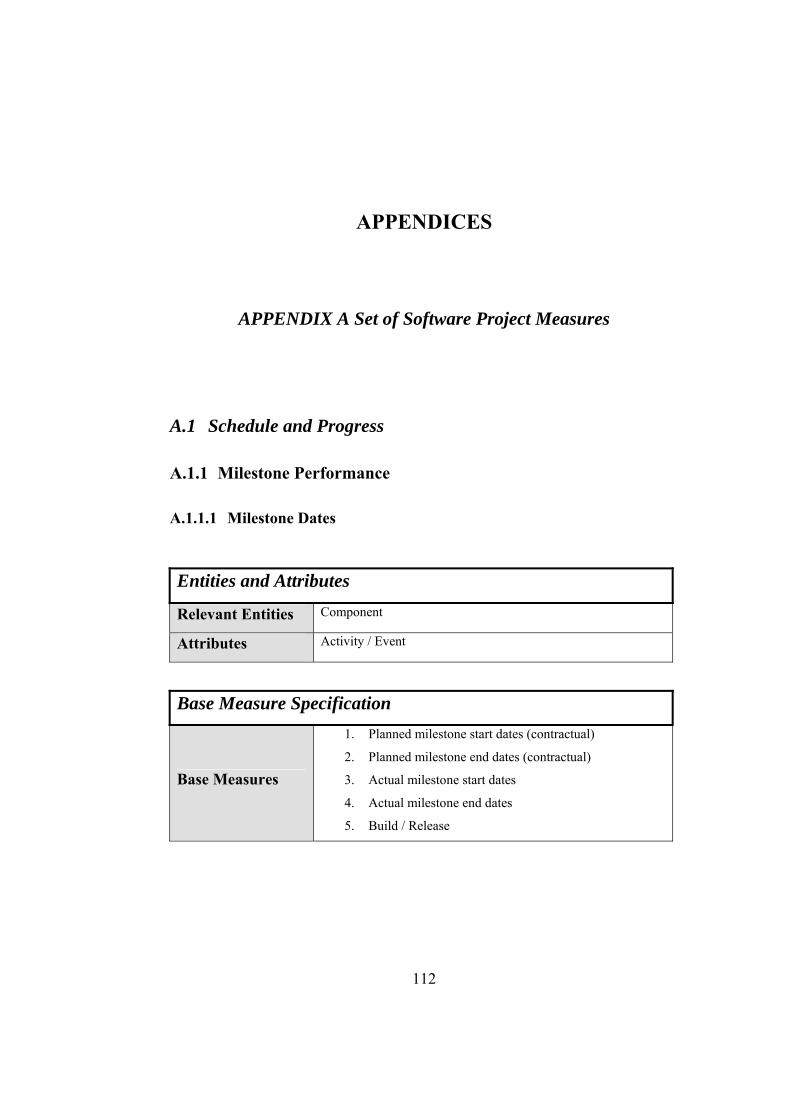
112
APPENDICES
APPENDIX A Set of Software Project Measures
A.1 Schedule and Progress
A.1.1 Milestone Performance
A.1.1.1 Milestone Dates
Entities and Attributes
Relevant Entities Component
Attributes Activity / Event
Base Measure Specification
Base Measures
1. Planned milestone start dates (contractual)
2. Planned milestone end dates (contractual)
3. Actual milestone start dates
4. Actual milestone end dates
5. Build / Release
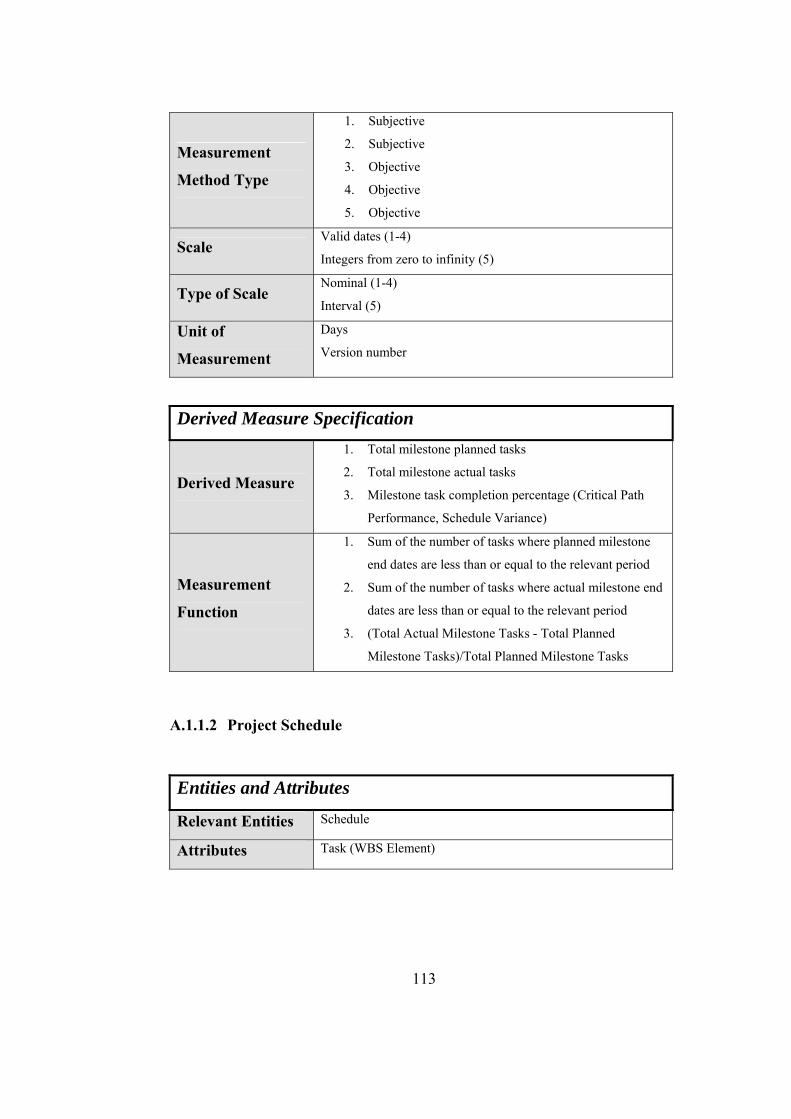
Measurement
Method Type
1. Subjective
2. Subjective
3. Objective
4. Objective
5. Objective
Scale Valid dates (1-4)
Integers from zero to infinity (5)
Type of Scale Nominal (1-4)
Interval (5)
Unit of
Measurement
Days
Version number
Derived Measure Specification
Derived Measure
1. Total milestone planned tasks
2. Total milestone actual tasks
3. Milestone task completion percentage (Critical Path
Performance, Schedule Variance)
Measurement
Function
1. Sum of the number of tasks where planned milestone
end dates are less than or equal to the relevant period
2. Sum of the number of tasks where actual milestone end
dates are less than or equal to the relevant period
3. (Total Actual Milestone Tasks - Total Planned
Milestone Tasks)/Total Planned Milestone Tasks
A.1.1.2 Project Schedule
Entities and Attributes Schedule Relevant Entities Task (WBS Element) Attributes
113
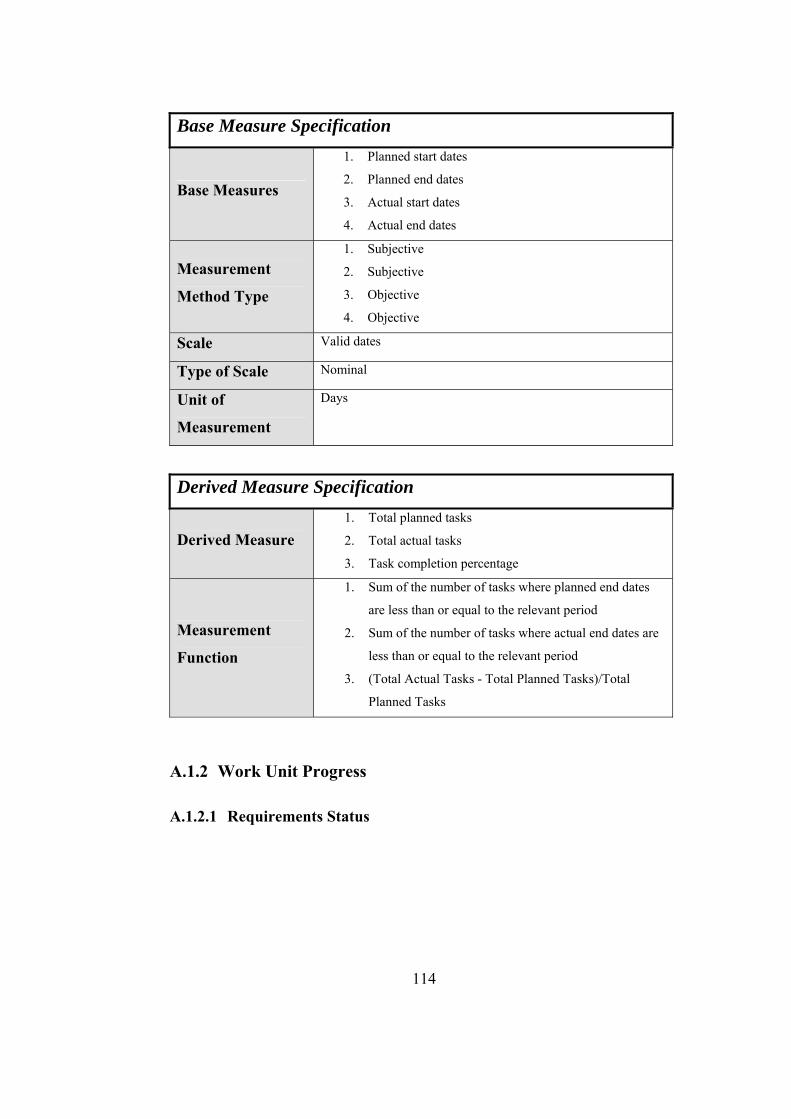
Base Measure Specification
Base Measures
1. Planned start dates
2. Planned end dates
3. Actual start dates
4. Actual end dates
Measurement
Method Type
1. Subjective
2. Subjective
3. Objective
4. Objective
Scale Valid dates
Type of Scale Nominal
Unit of
Measurement
Days
Derived Measure Specification
Derived Measure 1. Total planned tasks
2. Total actual tasks
3. Task completion percentage
Measurement
Function
1. Sum of the number of tasks where planned end dates
are less than or equal to the relevant period
2. Sum of the number of tasks where actual end dates are
less than or equal to the relevant period
3. (Total Actual Tasks - Total Planned Tasks)/Total
Planned Tasks
A.1.2 Work Unit Progress
A.1.2.1 Requirements Status
114
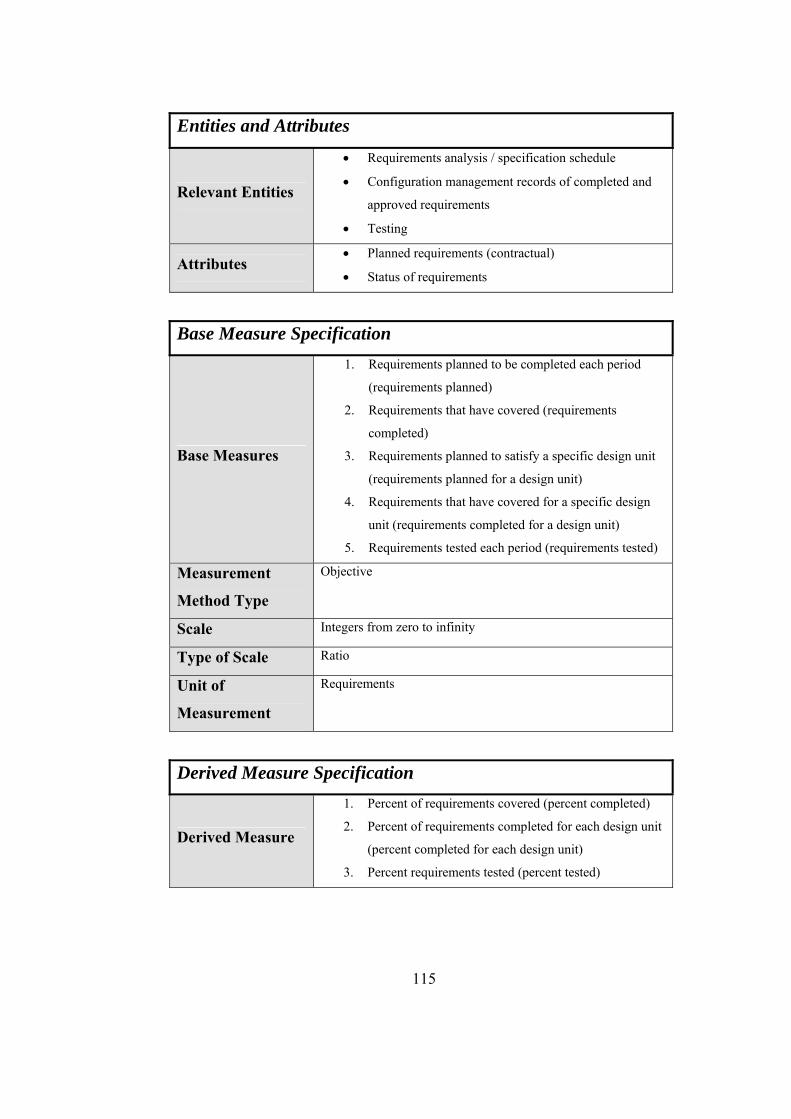
Entities and Attributes
Relevant Entities
• Requirements analysis / specification schedule
• Configuration management records of completed and
approved requirements
• Testing
Attributes • Planned requirements (contractual)
• Status of requirements
Base Measure Specification
Base Measures
1. Requirements planned to be completed each period
(requirements planned)
2. Requirements that have covered (requirements
completed)
3. Requirements planned to satisfy a specific design unit
(requirements planned for a design unit)
4. Requirements that have covered for a specific design
unit (requirements completed for a design unit)
5. Requirements tested each period (requirements tested)
Measurement
Method Type
Objective
Scale Integers from zero to infinity
Type of Scale Ratio
Unit of
Measurement
Requirements
Derived Measure Specification
Derived Measure
1. Percent of requirements covered (percent completed)
2. Percent of requirements completed for each design unit
(percent completed for each design unit)
3. Percent requirements tested (percent tested)
115
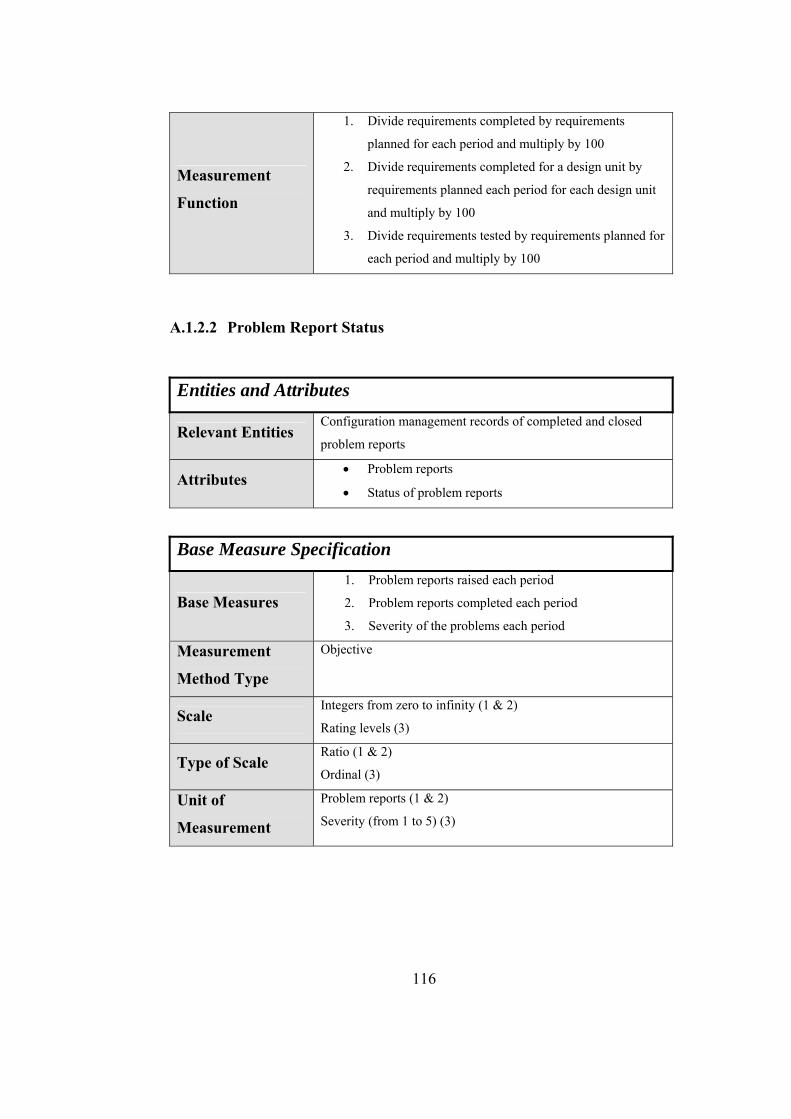
116
Measurement
Function
1. Divide requirements completed by requirements
planned for each period and multiply by 100
2. Divide requirements completed for a design unit by
requirements planned each period for each design unit
and multiply by 100
3. Divide requirements tested by requirements planned for
each period and multiply by 100
A.1.2.2 Problem Report Status
Entities and Attributes
Relevant Entities Configuration management records of completed and closed
problem reports
Attributes • Problem reports
• Status of problem reports
Base Measure Specification
Base Measures 1. Problem reports raised each period
2. Problem reports completed each period
3. Severity of the problems each period
Measurement
Method Type
Objective
Scale Integers from zero to infinity (1 & 2)
Rating levels (3)
Type of Scale Ratio (1 & 2)
Ordinal (3)
Unit of
Measurement
Problem reports (1 & 2)
Severity (from 1 to 5) (3)
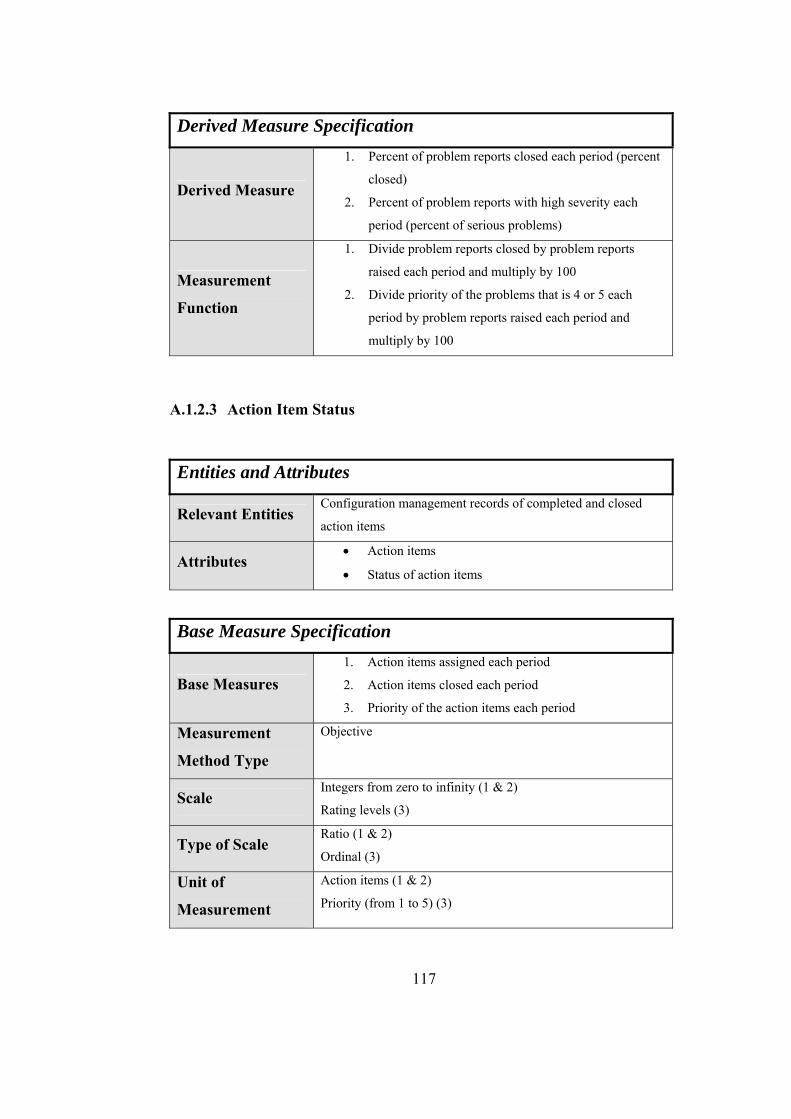
Derived Measure Specification
Derived Measure
1. Percent of problem reports closed each period (percent
closed)
2. Percent of problem reports with high severity each
period (percent of serious problems)
Measurement
Function
1. Divide problem reports closed by problem reports
raised each period and multiply by 100
2. Divide priority of the problems that is 4 or 5 each
period by problem reports raised each period and
multiply by 100
A.1.2.3 Action Item Status
Entities and Attributes Configuration management records of completed and closed
action items Relevant Entities
Attributes • Action items
• Status of action items
Base Measure Specification
Base Measures 1. Action items assigned each period
2. Action items closed each period
3. Priority of the action items each period
Measurement
Method Type
Objective
Scale Integers from zero to infinity (1 & 2)
Rating levels (3)
Type of Scale Ratio (1 & 2)
Ordinal (3)
Unit of
Measurement
Action items (1 & 2)
Priority (from 1 to 5) (3)
117
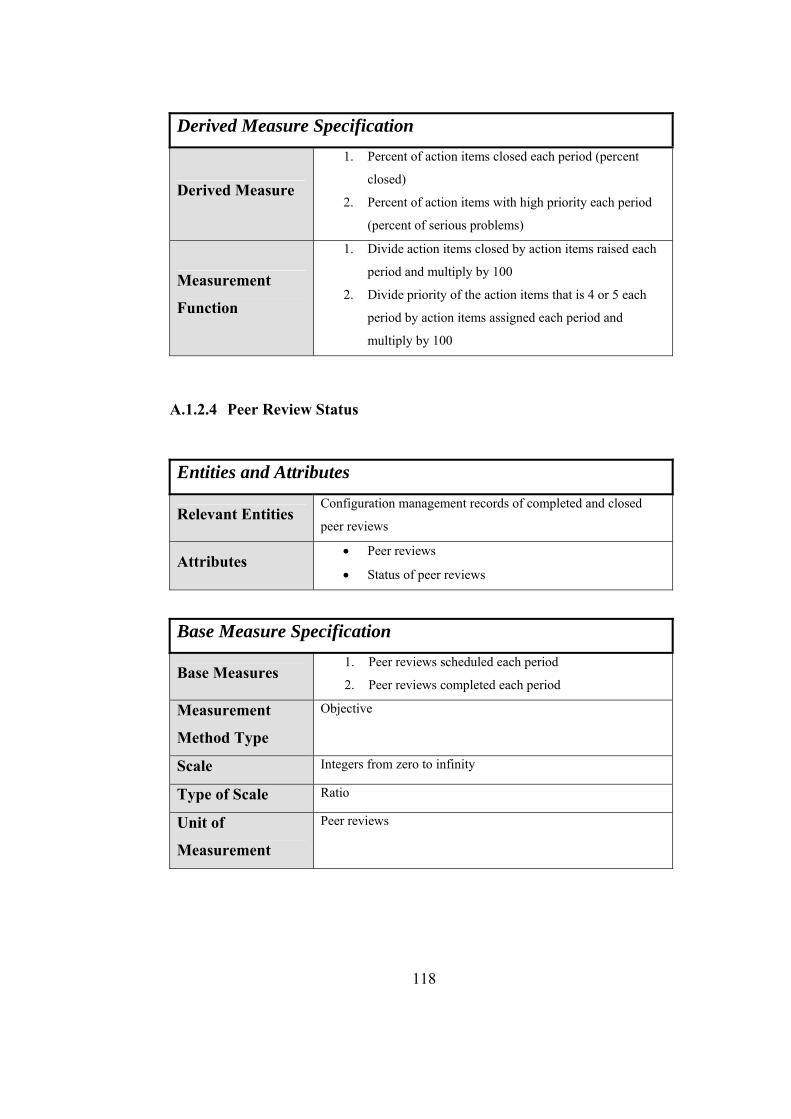
Derived Measure Specification
Derived Measure
1. Percent of action items closed each period (percent
closed)
2. Percent of action items with high priority each period
(percent of serious problems)
Measurement
Function
1. Divide action items closed by action items raised each
period and multiply by 100
2. Divide priority of the action items that is 4 or 5 each
period by action items assigned each period and
multiply by 100
A.1.2.4 Peer Review Status
Entities and Attributes Configuration management records of completed and closed
peer reviews Relevant Entities
Attributes • Peer reviews
• Status of peer reviews
Base Measure Specification
Base Measures 1. Peer reviews scheduled each period
2. Peer reviews completed each period
Measurement
Method Type
Objective
Scale Integers from zero to infinity
Type of Scale Ratio
Unit of
Measurement
Peer reviews
118
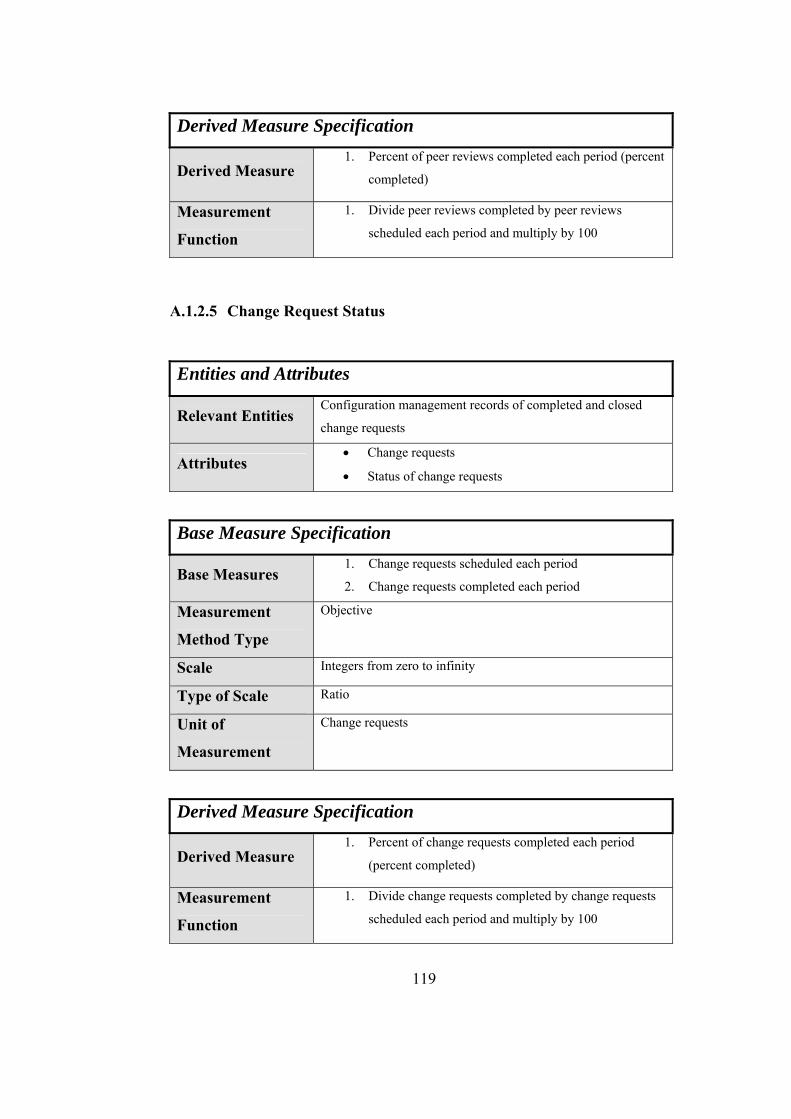
Derived Measure Specification
1. Percent of peer reviews completed each period (percent
completed) Derived Measure
1. Divide peer reviews completed by peer reviews
scheduled each period and multiply by 100 Measurement
Function
A.1.2.5 Change Request Status
Entities and Attributes Configuration management records of completed and closed
change requests Relevant Entities
Attributes • Change requests
• Status of change requests
Base Measure Specification
Base Measures 1. Change requests scheduled each period
2. Change requests completed each period
Measurement
Method Type
Objective
Scale Integers from zero to infinity
Type of Scale Ratio
Unit of
Measurement
Change requests
Derived Measure Specification
1. Percent of change requests completed each period
(percent completed) Derived Measure
1. Divide change requests completed by change requests
scheduled each period and multiply by 100 Measurement
Function
119
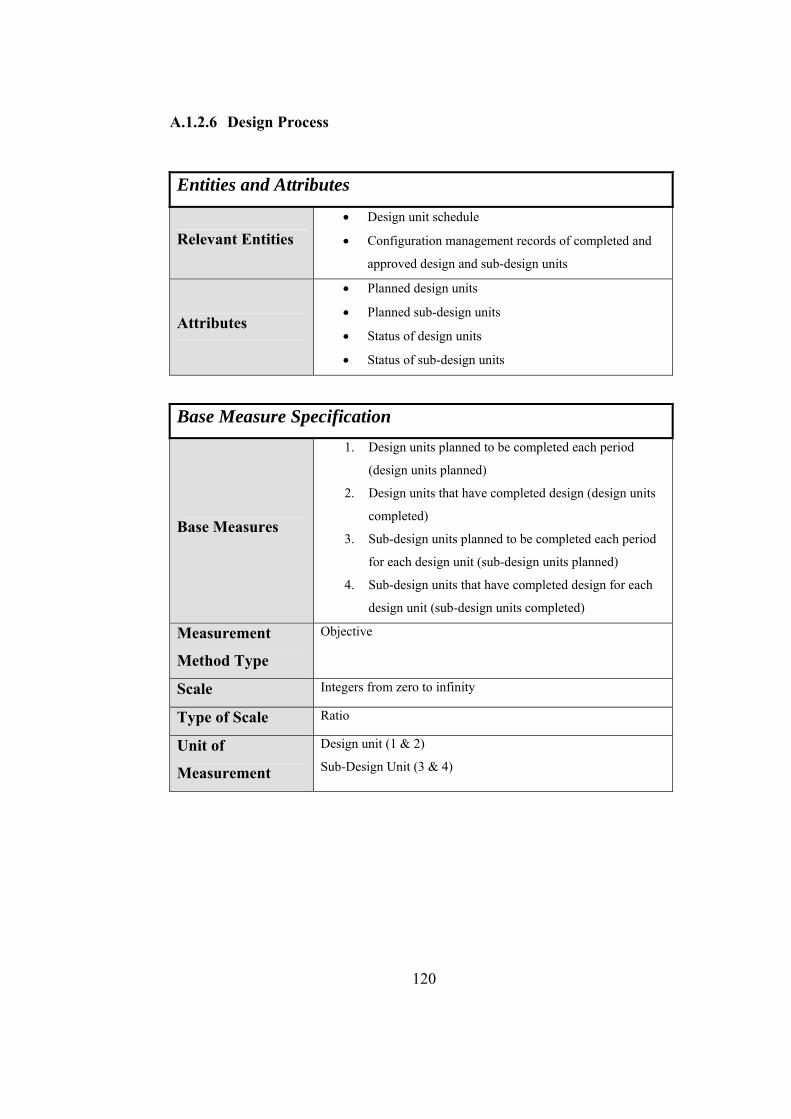
120
A.1.2.6 Design Process
Entities and Attributes
Relevant Entities • Design unit schedule
• Configuration management records of completed and
approved design and sub-design units
Attributes
• Planned design units
• Planned sub-design units
• Status of design units
• Status of sub-design units
Base Measure Specification
Base Measures
1. Design units planned to be completed each period
(design units planned)
2. Design units that have completed design (design units
completed)
3. Sub-design units planned to be completed each period
for each design unit (sub-design units planned)
4. Sub-design units that have completed design for each
design unit (sub-design units completed)
Measurement
Method Type
Objective
Scale Integers from zero to infinity
Type of Scale Ratio
Unit of
Measurement
Design unit (1 & 2)
Sub-Design Unit (3 & 4)
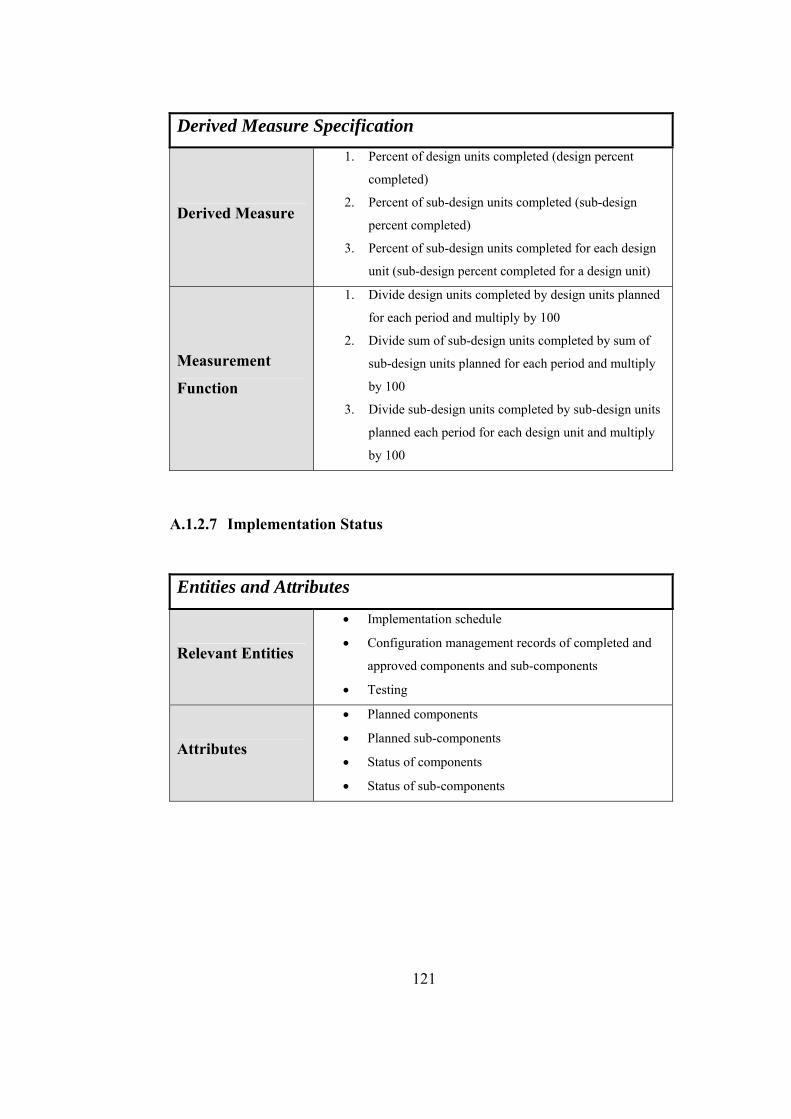
Derived Measure Specification
Derived Measure
1. Percent of design units completed (design percent
completed)
2. Percent of sub-design units completed (sub-design
percent completed)
3. Percent of sub-design units completed for each design
unit (sub-design percent completed for a design unit)
Measurement
Function
1. Divide design units completed by design units planned
for each period and multiply by 100
2. Divide sum of sub-design units completed by sum of
sub-design units planned for each period and multiply
by 100
3. Divide sub-design units completed by sub-design units
planned each period for each design unit and multiply
by 100
A.1.2.7 Implementation Status
Entities and Attributes
Relevant Entities
• Implementation schedule
• Configuration management records of completed and
approved components and sub-components
• Testing
Attributes
• Planned components
• Planned sub-components
• Status of components
• Status of sub-components
121
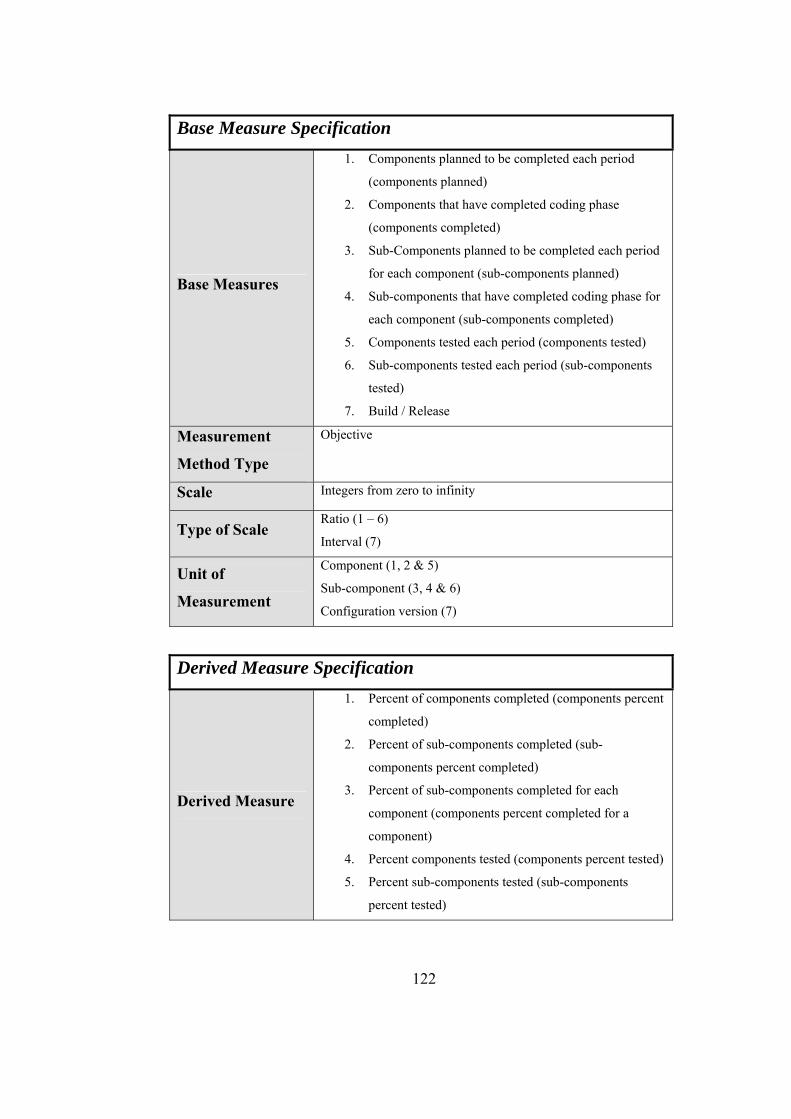
Base Measure Specification
Base Measures
1. Components planned to be completed each period
(components planned)
2. Components that have completed coding phase
(components completed)
3. Sub-Components planned to be completed each period
for each component (sub-components planned)
4. Sub-components that have completed coding phase for
each component (sub-components completed)
5. Components tested each period (components tested)
6. Sub-components tested each period (sub-components
tested)
7. Build / Release
Measurement
Method Type
Objective
Scale Integers from zero to infinity
Type of Scale Ratio (1 – 6)
Interval (7)
Unit of
Measurement
Component (1, 2 & 5)
Sub-component (3, 4 & 6)
Configuration version (7)
Derived Measure Specification
Derived Measure
1. Percent of components completed (components percent
completed)
2. Percent of sub-components completed (sub-
components percent completed)
3. Percent of sub-components completed for each
component (components percent completed for a
component)
4. Percent components tested (components percent tested)
5. Percent sub-components tested (sub-components
percent tested)
122
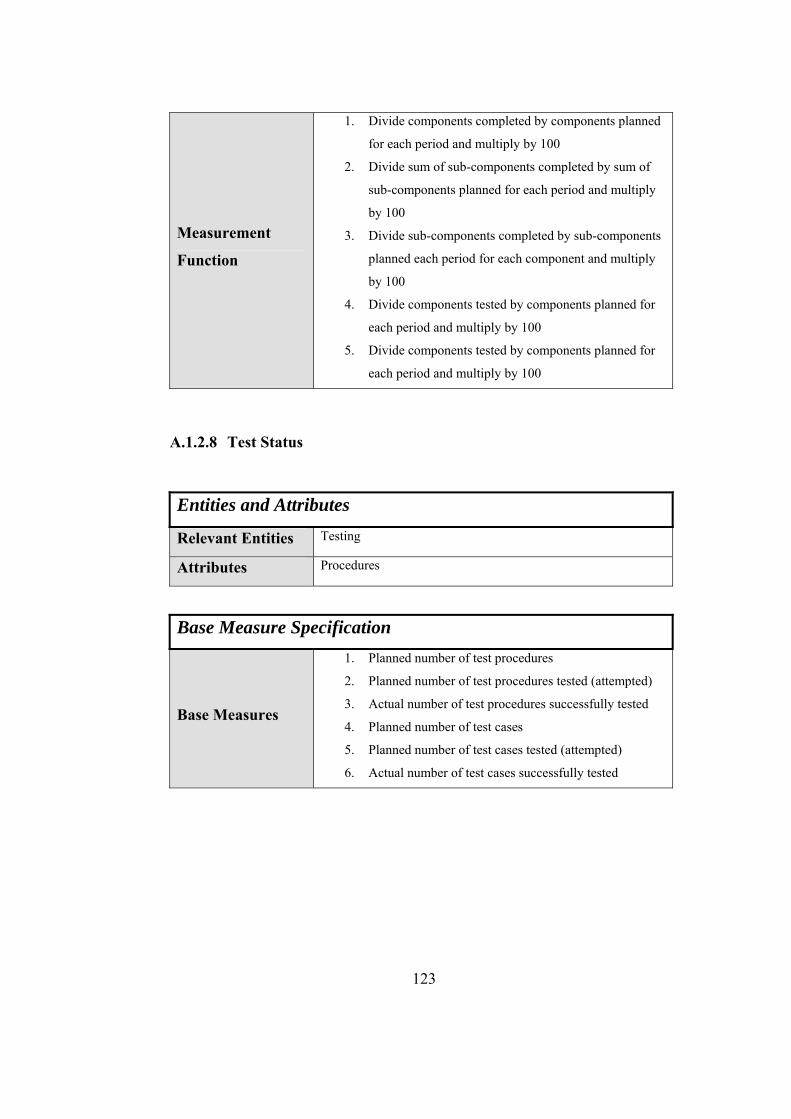
123
Measurement
Function
1. Divide components completed by components planned
for each period and multiply by 100
2. Divide sum of sub-components completed by sum of
sub-components planned for each period and multiply
by 100
3. Divide sub-components completed by sub-components
planned each period for each component and multiply
by 100
4. Divide components tested by components planned for
each period and multiply by 100
5. Divide components tested by components planned for
each period and multiply by 100
A.1.2.8 Test Status
Entities and Attributes
Relevant Entities Testing
Attributes Procedures
Base Measure Specification
Base Measures
1. Planned number of test procedures
2. Planned number of test procedures tested (attempted)
3. Actual number of test procedures successfully tested
4. Planned number of test cases
5. Planned number of test cases tested (attempted)
6. Actual number of test cases successfully tested
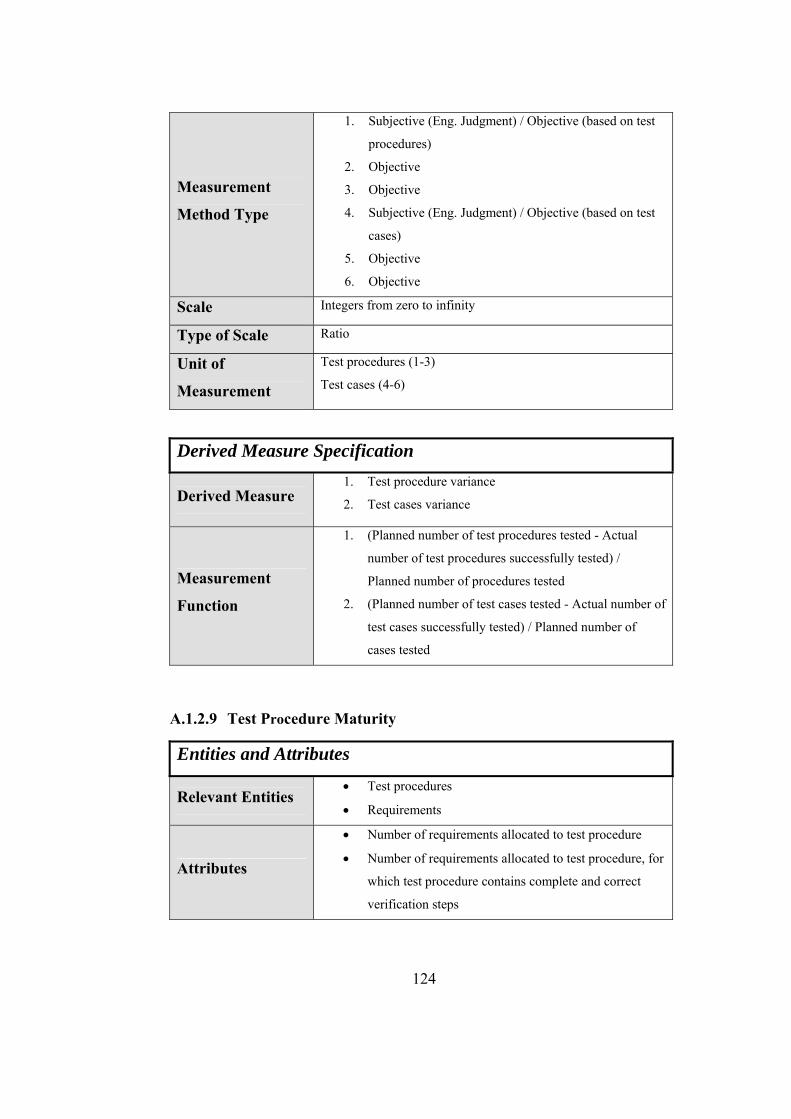
Measurement
Method Type
1. Subjective (Eng. Judgment) / Objective (based on test
procedures)
2. Objective
3. Objective
4. Subjective (Eng. Judgment) / Objective (based on test
cases)
5. Objective
6. Objective
Scale Integers from zero to infinity
Type of Scale Ratio
Unit of
Measurement
Test procedures (1-3)
Test cases (4-6)
Derived Measure Specification
Derived Measure 1. Test procedure variance
2. Test cases variance
Measurement
Function
1. (Planned number of test procedures tested - Actual
number of test procedures successfully tested) /
Planned number of procedures tested
2. (Planned number of test cases tested - Actual number of
test cases successfully tested) / Planned number of
cases tested
A.1.2.9 Test Procedure Maturity
Entities and Attributes
Relevant Entities • Test procedures
• Requirements
Attributes
• Number of requirements allocated to test procedure
• Number of requirements allocated to test procedure, for
which test procedure contains complete and correct
verification steps
124
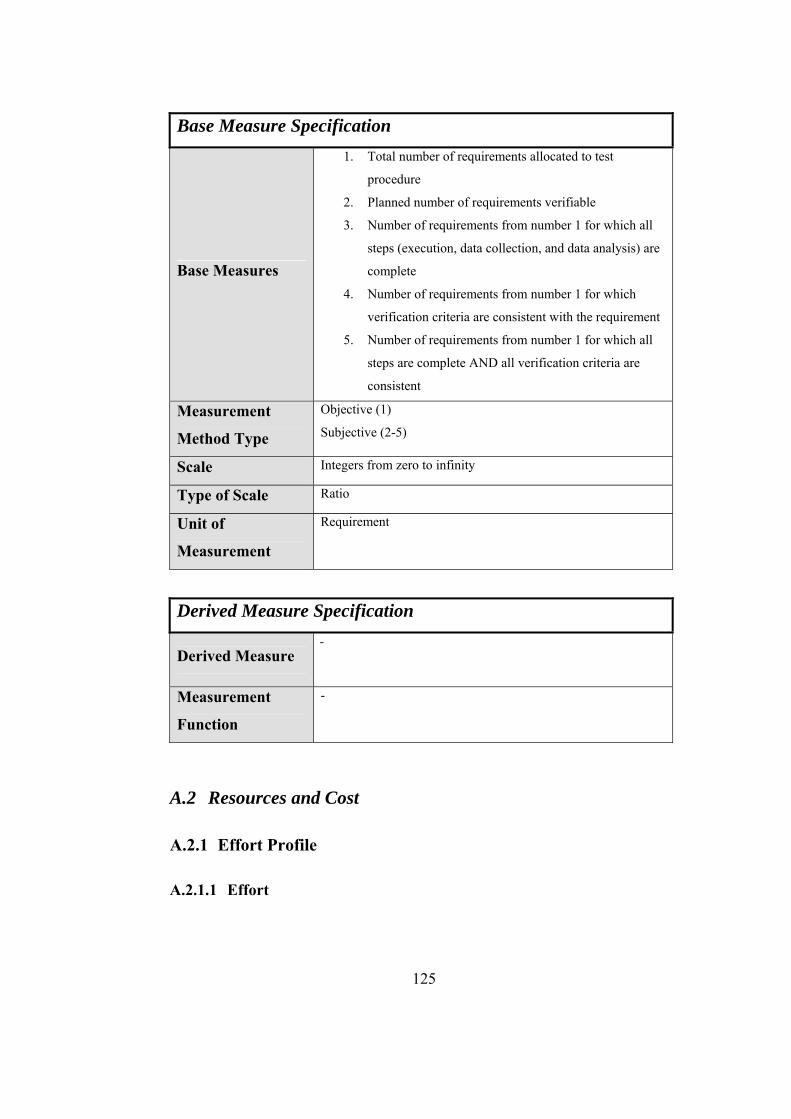
Base Measure Specification
Base Measures
1. Total number of requirements allocated to test
procedure
2. Planned number of requirements verifiable
3. Number of requirements from number 1 for which all
steps (execution, data collection, and data analysis) are
complete
4. Number of requirements from number 1 for which
verification criteria are consistent with the requirement
5. Number of requirements from number 1 for which all
steps are complete AND all verification criteria are
consistent
Measurement
Method Type
Objective (1)
Subjective (2-5)
Scale Integers from zero to infinity
Type of Scale Ratio
Unit of
Measurement
Requirement
Derived Measure Specification
- Derived Measure
Measurement
Function
-
A.2 Resources and Cost
A.2.1 Effort Profile
A.2.1.1 Effort
125
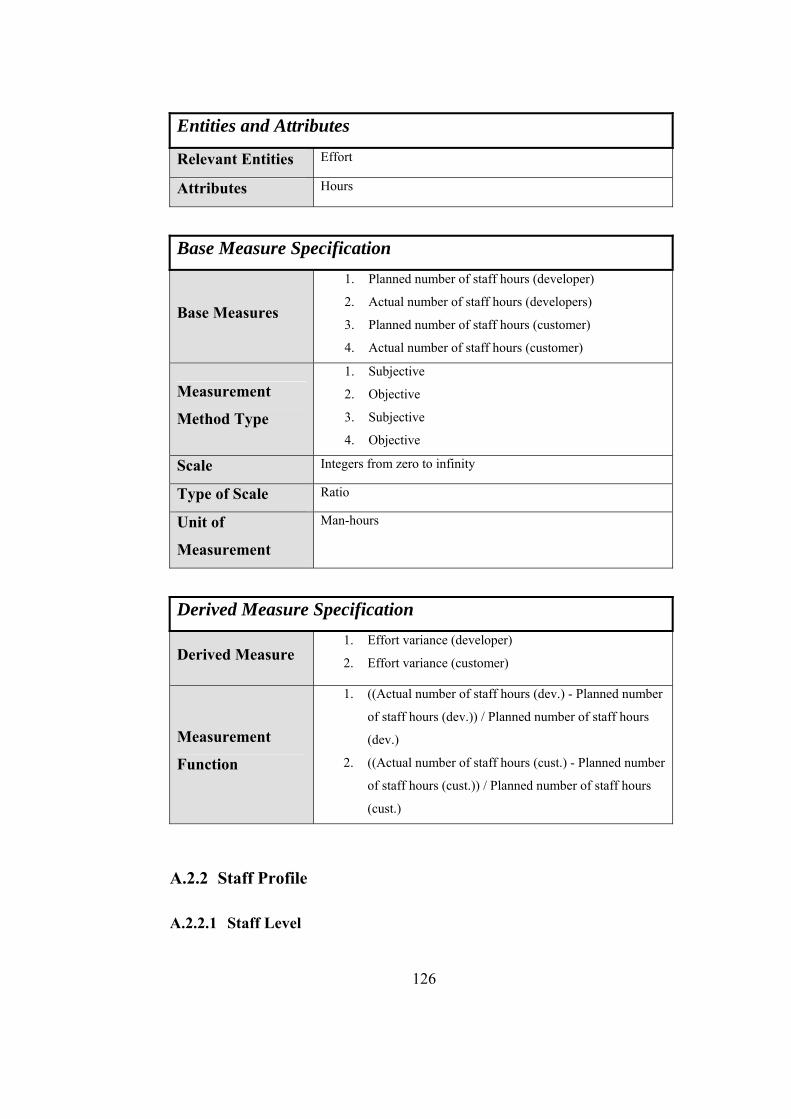
Entities and Attributes Effort Relevant Entities Hours Attributes
Base Measure Specification
Base Measures
1. Planned number of staff hours (developer)
2. Actual number of staff hours (developers)
3. Planned number of staff hours (customer)
4. Actual number of staff hours (customer)
Measurement
Method Type
1. Subjective
2. Objective
3. Subjective
4. Objective
Scale Integers from zero to infinity
Type of Scale Ratio
Unit of
Measurement
Man-hours
Derived Measure Specification
Derived Measure 1. Effort variance (developer)
2. Effort variance (customer)
Measurement
Function
1. ((Actual number of staff hours (dev.) - Planned number
of staff hours (dev.)) / Planned number of staff hours
(dev.)
2. ((Actual number of staff hours (cust.) - Planned number
of staff hours (cust.)) / Planned number of staff hours
(cust.)
A.2.2 Staff Profile
A.2.2.1 Staff Level
126
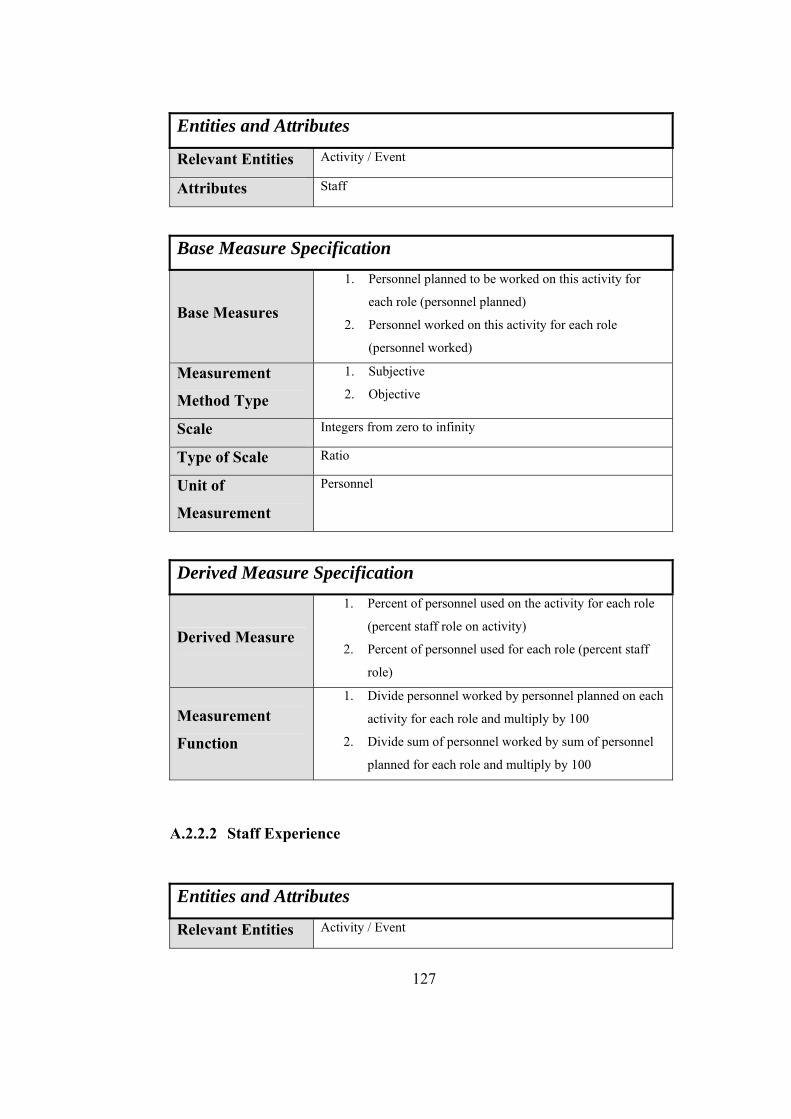
Entities and Attributes Activity / Event Relevant Entities Staff Attributes
Base Measure Specification
Base Measures
1. Personnel planned to be worked on this activity for
each role (personnel planned)
2. Personnel worked on this activity for each role
(personnel worked)
Measurement
Method Type
1. Subjective
2. Objective
Scale Integers from zero to infinity
Type of Scale Ratio
Unit of
Measurement
Personnel
Derived Measure Specification
Derived Measure
1. Percent of personnel used on the activity for each role
(percent staff role on activity)
2. Percent of personnel used for each role (percent staff
role)
Measurement
Function
1. Divide personnel worked by personnel planned on each
activity for each role and multiply by 100
2. Divide sum of personnel worked by sum of personnel
planned for each role and multiply by 100
A.2.2.2 Staff Experience
Entities and Attributes Activity / Event Relevant Entities
127
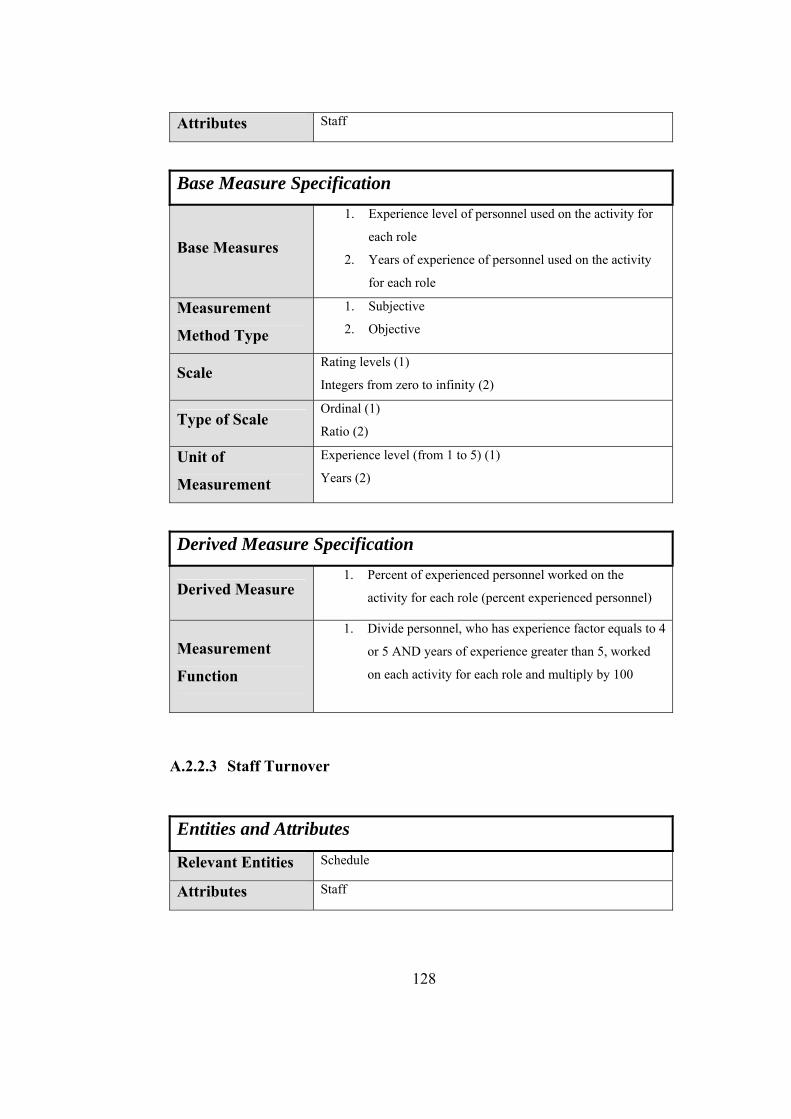
Staff Attributes
Base Measure Specification
Base Measures
1. Experience level of personnel used on the activity for
each role
2. Years of experience of personnel used on the activity
for each role
Measurement
Method Type
1. Subjective
2. Objective
Scale Rating levels (1)
Integers from zero to infinity (2)
Type of Scale Ordinal (1)
Ratio (2)
Unit of
Measurement
Experience level (from 1 to 5) (1)
Years (2)
Derived Measure Specification
1. Percent of experienced personnel worked on the
activity for each role (percent experienced personnel) Derived Measure
Measurement
Function
1. Divide personnel, who has experience factor equals to 4
or 5 AND years of experience greater than 5, worked
on each activity for each role and multiply by 100
A.2.2.3 Staff Turnover
Entities and Attributes Schedule Relevant Entities Staff Attributes
128
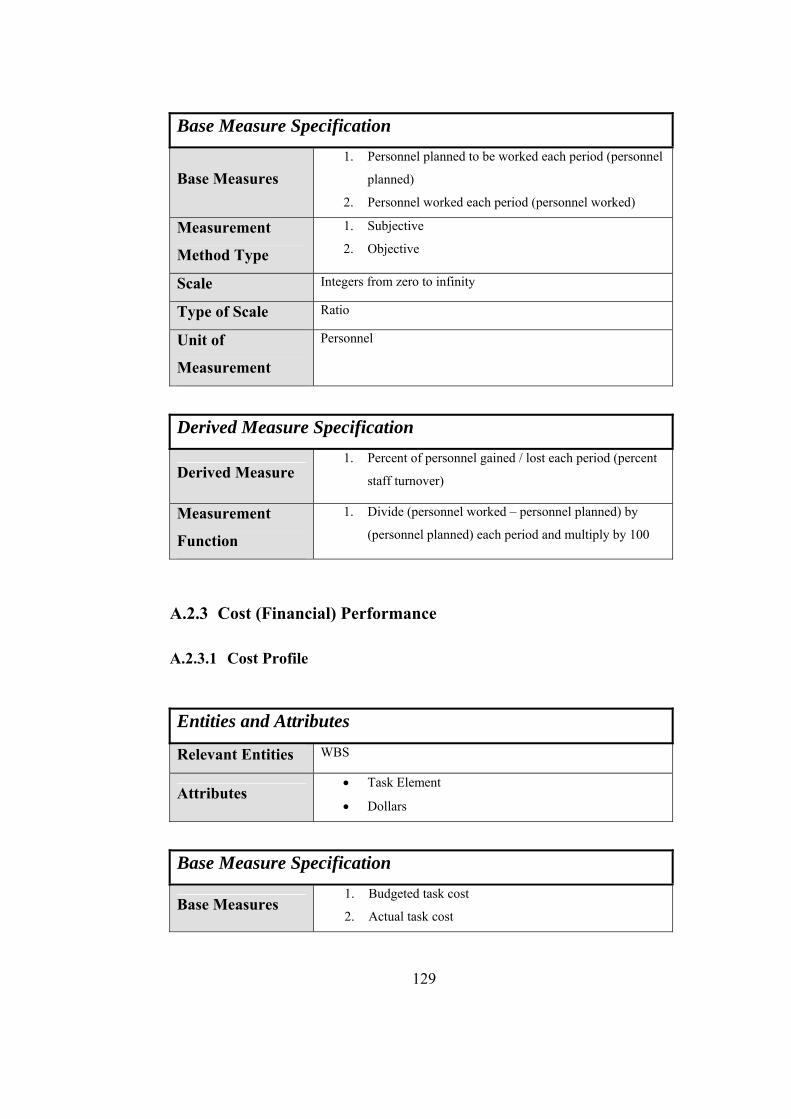
Base Measure Specification
Base Measures 1. Personnel planned to be worked each period (personnel
planned)
2. Personnel worked each period (personnel worked)
Measurement
Method Type
1. Subjective
2. Objective
Scale Integers from zero to infinity
Type of Scale Ratio
Unit of
Measurement
Personnel
Derived Measure Specification
Derived Measure 1. Percent of personnel gained / lost each period (percent
staff turnover)
Measurement
Function
1. Divide (personnel worked – personnel planned) by
(personnel planned) each period and multiply by 100
A.2.3 Cost (Financial) Performance
A.2.3.1 Cost Profile
Entities and Attributes WBS Relevant Entities
Attributes • Task Element
• Dollars
Base Measure Specification
Base Measures 1. Budgeted task cost
2. Actual task cost
129
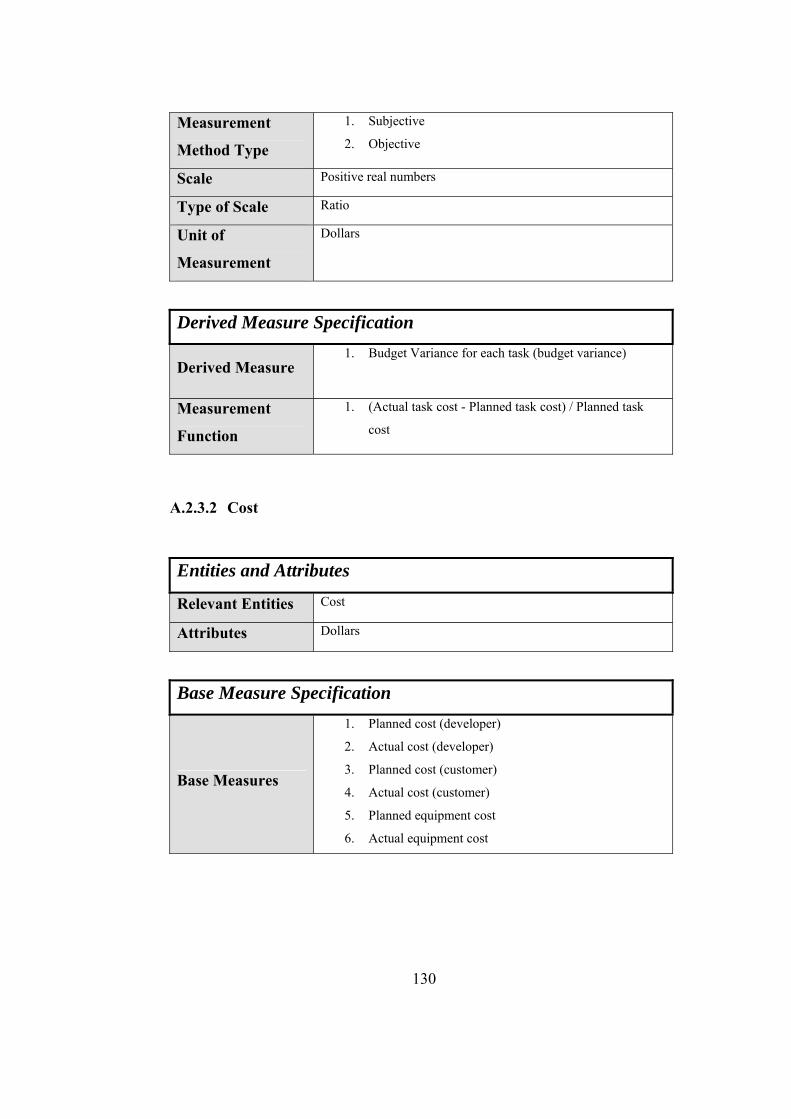
Measurement
Method Type
1. Subjective
2. Objective
Scale Positive real numbers
Type of Scale Ratio
Unit of
Measurement
Dollars
Derived Measure Specification
1. Budget Variance for each task (budget variance) Derived Measure
1. (Actual task cost - Planned task cost) / Planned task
cost Measurement
Function
A.2.3.2 Cost
Entities and Attributes Cost Relevant Entities Dollars Attributes
Base Measure Specification
Base Measures
1. Planned cost (developer)
2. Actual cost (developer)
3. Planned cost (customer)
4. Actual cost (customer)
5. Planned equipment cost
6. Actual equipment cost
130
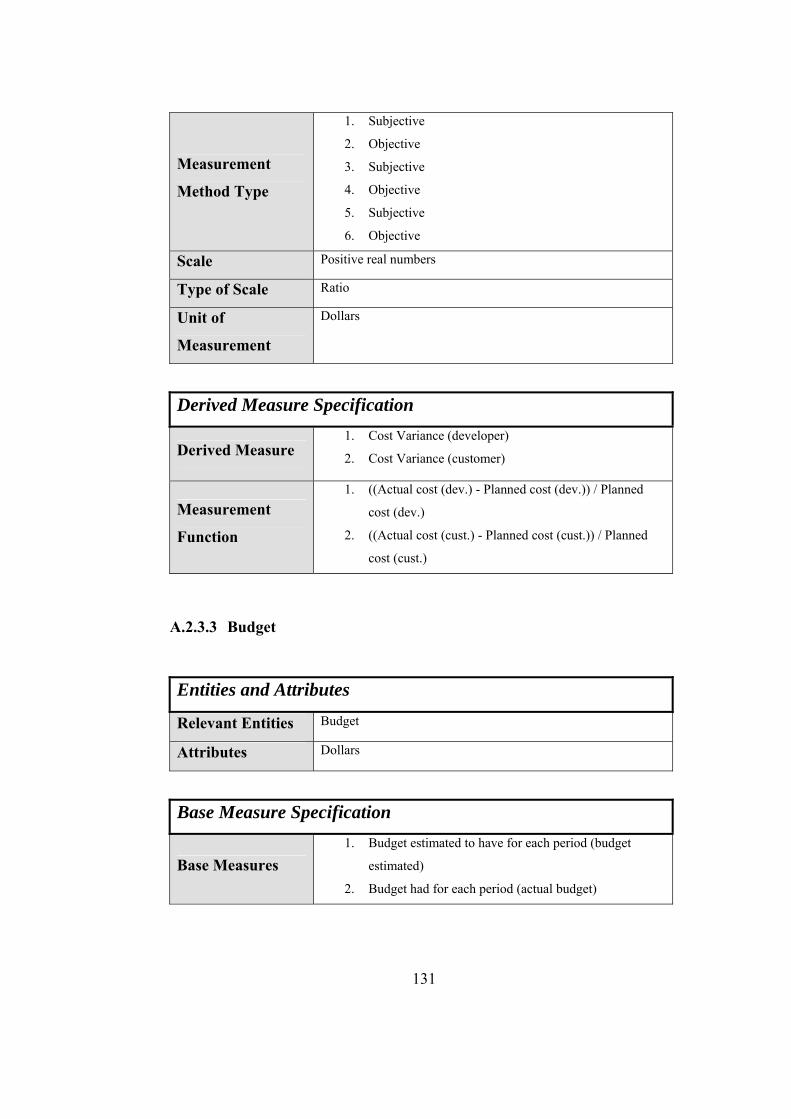
Measurement
Method Type
1. Subjective
2. Objective
3. Subjective
4. Objective
5. Subjective
6. Objective
Scale Positive real numbers
Type of Scale Ratio
Unit of
Measurement
Dollars
Derived Measure Specification
Derived Measure 1. Cost Variance (developer)
2. Cost Variance (customer)
Measurement
Function
1. ((Actual cost (dev.) - Planned cost (dev.)) / Planned
cost (dev.)
2. ((Actual cost (cust.) - Planned cost (cust.)) / Planned
cost (cust.)
A.2.3.3 Budget
Entities and Attributes Budget Relevant Entities Dollars Attributes
Base Measure Specification
Base Measures 1. Budget estimated to have for each period (budget
estimated)
2. Budget had for each period (actual budget)
131
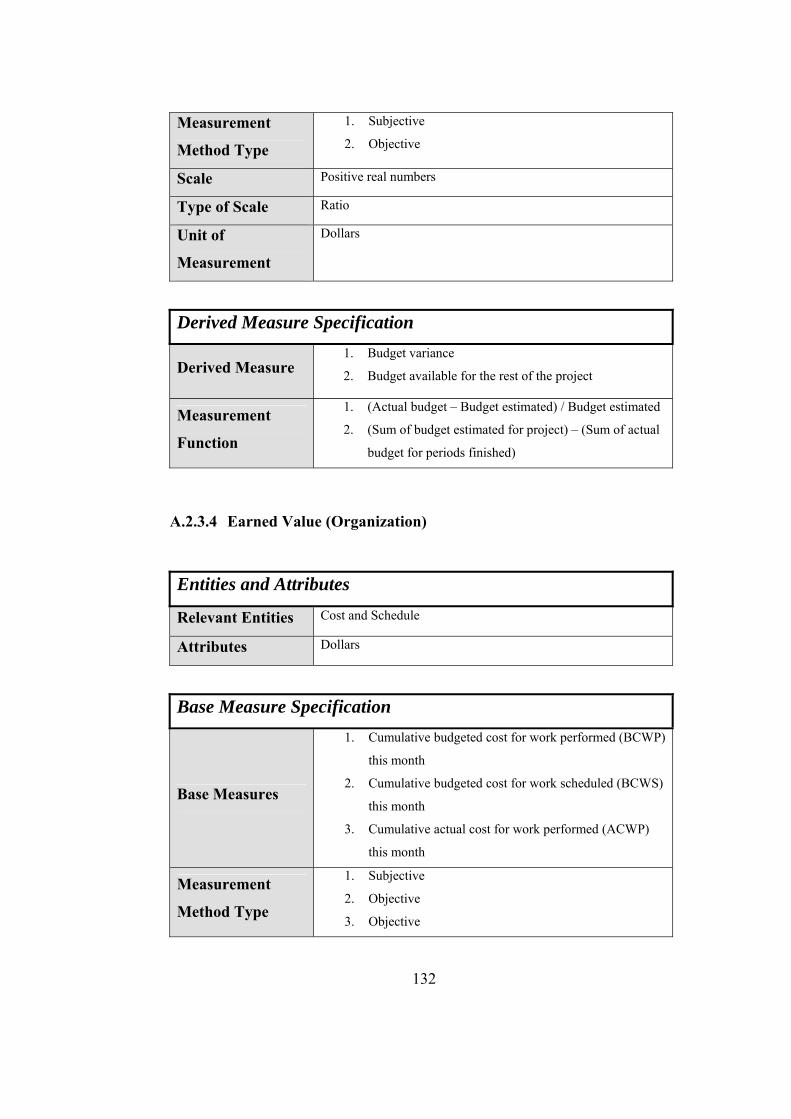
Measurement
Method Type
1. Subjective
2. Objective
Scale Positive real numbers
Type of Scale Ratio
Unit of
Measurement
Dollars
Derived Measure Specification
Derived Measure 1. Budget variance
2. Budget available for the rest of the project
Measurement
Function
1. (Actual budget – Budget estimated) / Budget estimated
2. (Sum of budget estimated for project) – (Sum of actual
budget for periods finished)
A.2.3.4 Earned Value (Organization)
Entities and Attributes Cost and Schedule Relevant Entities Dollars Attributes
Base Measure Specification
Base Measures
1. Cumulative budgeted cost for work performed (BCWP)
this month
2. Cumulative budgeted cost for work scheduled (BCWS)
this month
3. Cumulative actual cost for work performed (ACWP)
this month
Measurement
Method Type
1. Subjective
2. Objective
3. Objective
132
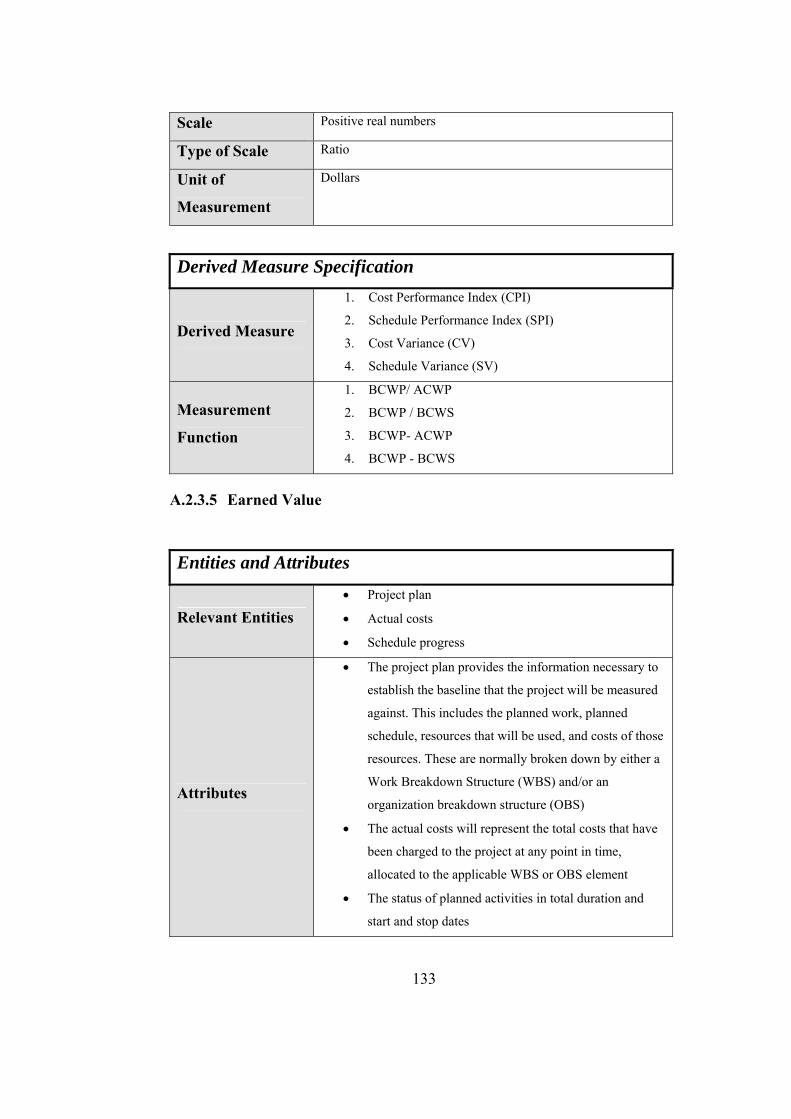
133
Scale Positive real numbers
Type of Scale Ratio
Unit of
Measurement
Dollars
Derived Measure Specification
Derived Measure
1. Cost Performance Index (CPI)
2. Schedule Performance Index (SPI)
3. Cost Variance (CV)
4. Schedule Variance (SV)
Measurement
Function
1. BCWP/ ACWP
2. BCWP / BCWS
3. BCWP- ACWP
4. BCWP - BCWS
A.2.3.5 Earned Value
Entities and Attributes
Relevant Entities • Project plan
• Actual costs
• Schedule progress
Attributes
• The project plan provides the information necessary to
establish the baseline that the project will be measured
against. This includes the planned work, planned
schedule, resources that will be used, and costs of those
resources. These are normally broken down by either a
Work Breakdown Structure (WBS) and/or an
organization breakdown structure (OBS)
• The actual costs will represent the total costs that have
been charged to the project at any point in time,
allocated to the applicable WBS or OBS element
• The status of planned activities in total duration and
start and stop dates
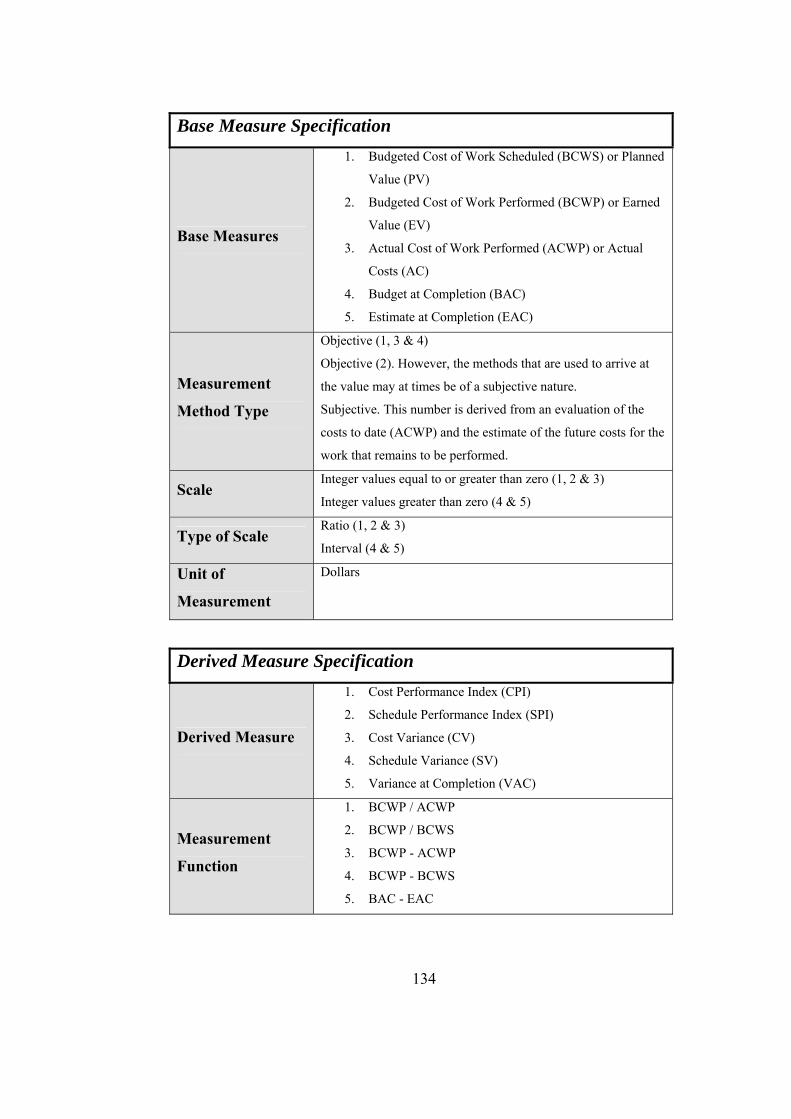
Base Measure Specification
Base Measures
1. Budgeted Cost of Work Scheduled (BCWS) or Planned
Value (PV)
2. Budgeted Cost of Work Performed (BCWP) or Earned
Value (EV)
3. Actual Cost of Work Performed (ACWP) or Actual
Costs (AC)
4. Budget at Completion (BAC)
5. Estimate at Completion (EAC)
Measurement
Method Type
Objective (1, 3 & 4)
Objective (2). However, the methods that are used to arrive at
the value may at times be of a subjective nature.
Subjective. This number is derived from an evaluation of the
costs to date (ACWP) and the estimate of the future costs for the
work that remains to be performed.
Scale Integer values equal to or greater than zero (1, 2 & 3)
Integer values greater than zero (4 & 5)
Type of Scale Ratio (1, 2 & 3)
Interval (4 & 5)
Unit of
Measurement
Dollars
Derived Measure Specification
Derived Measure
1. Cost Performance Index (CPI)
2. Schedule Performance Index (SPI)
3. Cost Variance (CV)
4. Schedule Variance (SV)
5. Variance at Completion (VAC)
Measurement
Function
1. BCWP / ACWP
2. BCWP / BCWS
3. BCWP - ACWP
4. BCWP - BCWS
5. BAC - EAC
134
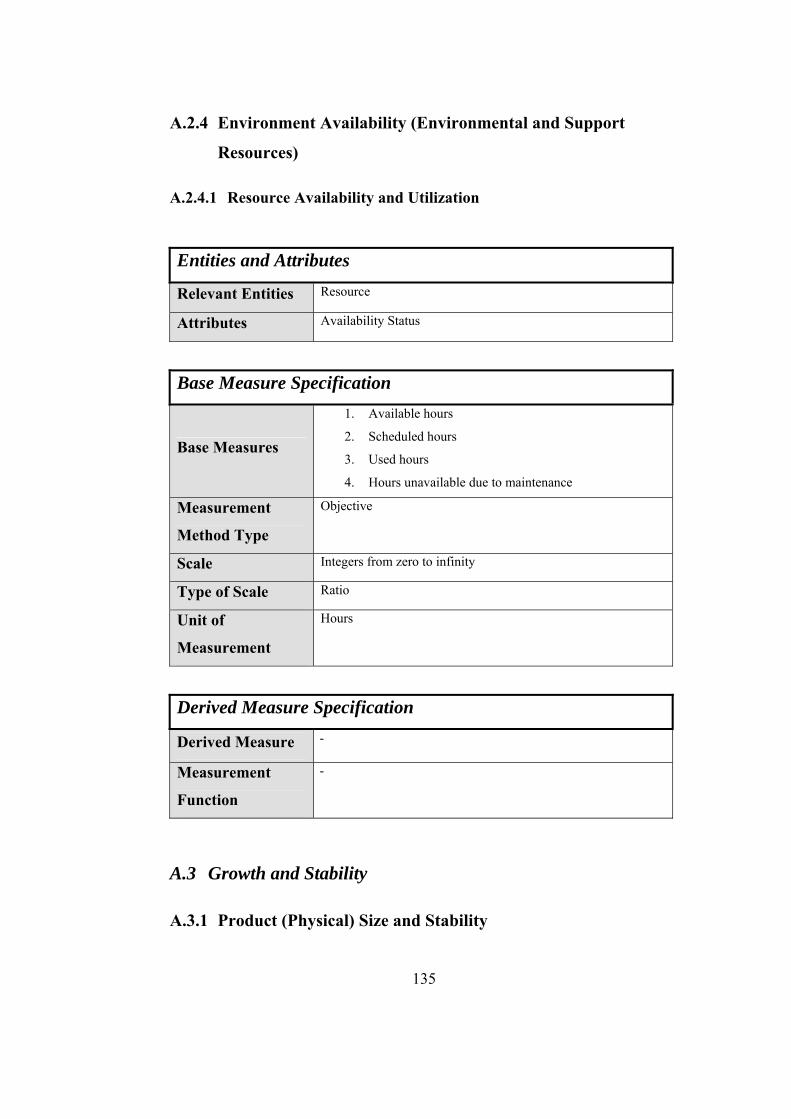
A.2.4 Environment Availability (Environmental and Support
Resources)
A.2.4.1 Resource Availability and Utilization
Entities and Attributes Resource Relevant Entities Availability Status Attributes
Base Measure Specification
Base Measures
1. Available hours
2. Scheduled hours
3. Used hours
4. Hours unavailable due to maintenance
Measurement
Method Type
Objective
Scale Integers from zero to infinity
Type of Scale Ratio
Unit of
Measurement
Hours
Derived Measure Specification
- Derived Measure
Measurement
Function
-
A.3 Growth and Stability
A.3.1 Product (Physical) Size and Stability
135
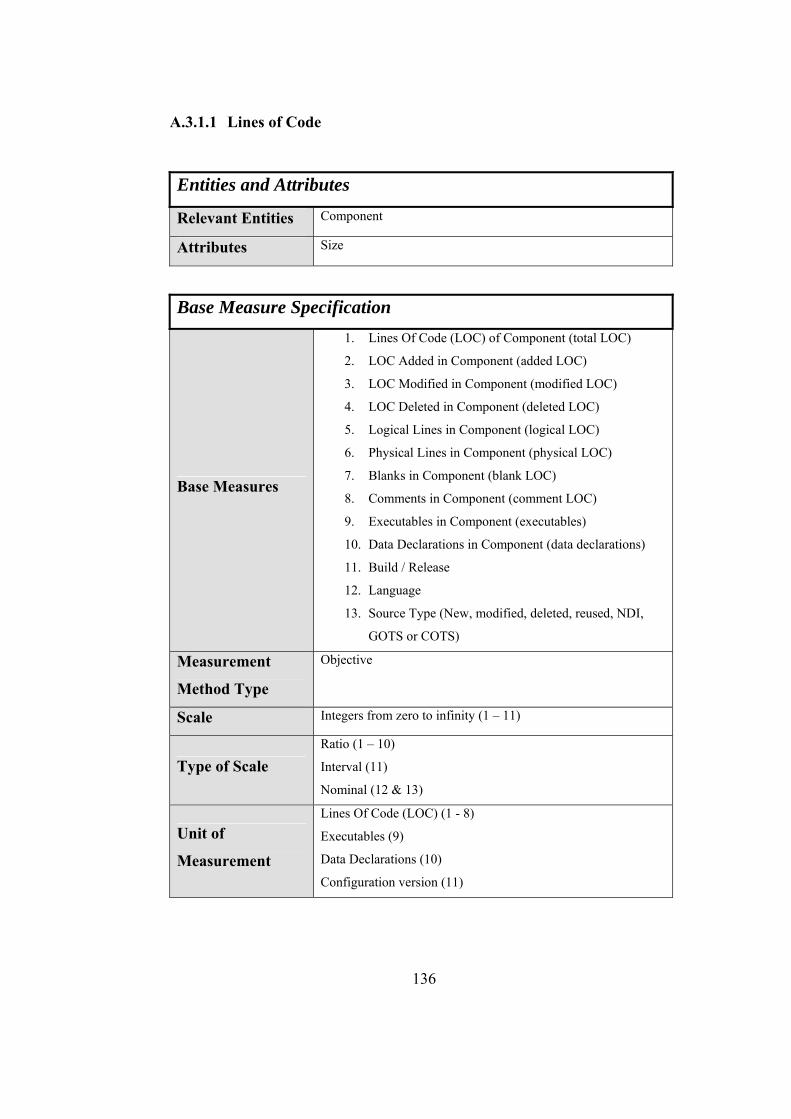
136
A.3.1.1 Lines of Code
Entities and Attributes
Relevant Entities Component
Attributes Size
Base Measure Specification
Base Measures
1. Lines Of Code (LOC) of Component (total LOC)
2. LOC Added in Component (added LOC)
3. LOC Modified in Component (modified LOC)
4. LOC Deleted in Component (deleted LOC)
5. Logical Lines in Component (logical LOC)
6. Physical Lines in Component (physical LOC)
7. Blanks in Component (blank LOC)
8. Comments in Component (comment LOC)
9. Executables in Component (executables)
10. Data Declarations in Component (data declarations)
11. Build / Release
12. Language
13. Source Type (New, modified, deleted, reused, NDI,
GOTS or COTS)
Measurement
Method Type
Objective
Scale Integers from zero to infinity (1 – 11)
Type of Scale Ratio (1 – 10)
Interval (11)
Nominal (12 & 13)
Unit of
Measurement
Lines Of Code (LOC) (1 - 8)
Executables (9)
Data Declarations (10)
Configuration version (11)
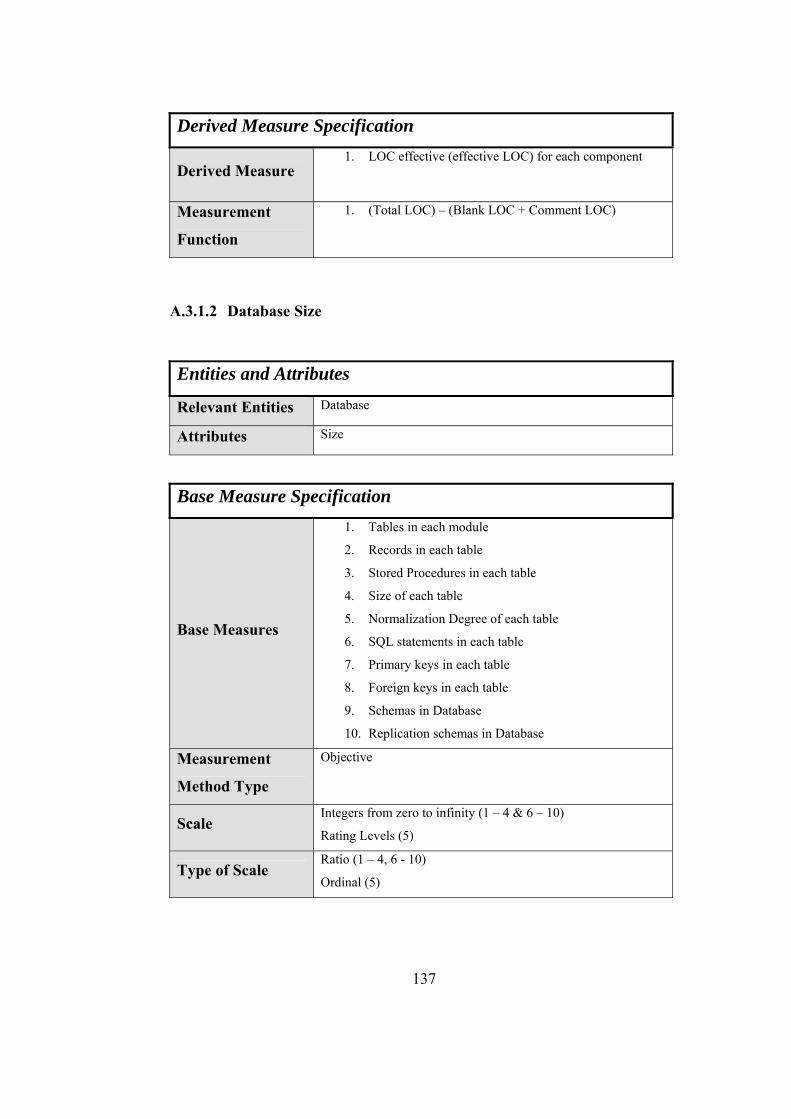
Derived Measure Specification
1. LOC effective (effective LOC) for each component Derived Measure
1. (Total LOC) – (Blank LOC + Comment LOC) Measurement
Function
A.3.1.2 Database Size
Entities and Attributes Database Relevant Entities Size Attributes
Base Measure Specification
Base Measures
1. Tables in each module
2. Records in each table
3. Stored Procedures in each table
4. Size of each table
5. Normalization Degree of each table
6. SQL statements in each table
7. Primary keys in each table
8. Foreign keys in each table
9. Schemas in Database
10. Replication schemas in Database
Measurement
Method Type
Objective
Scale Integers from zero to infinity (1 – 4 & 6 – 10)
Rating Levels (5)
Type of Scale Ratio (1 – 4, 6 - 10)
Ordinal (5)
137
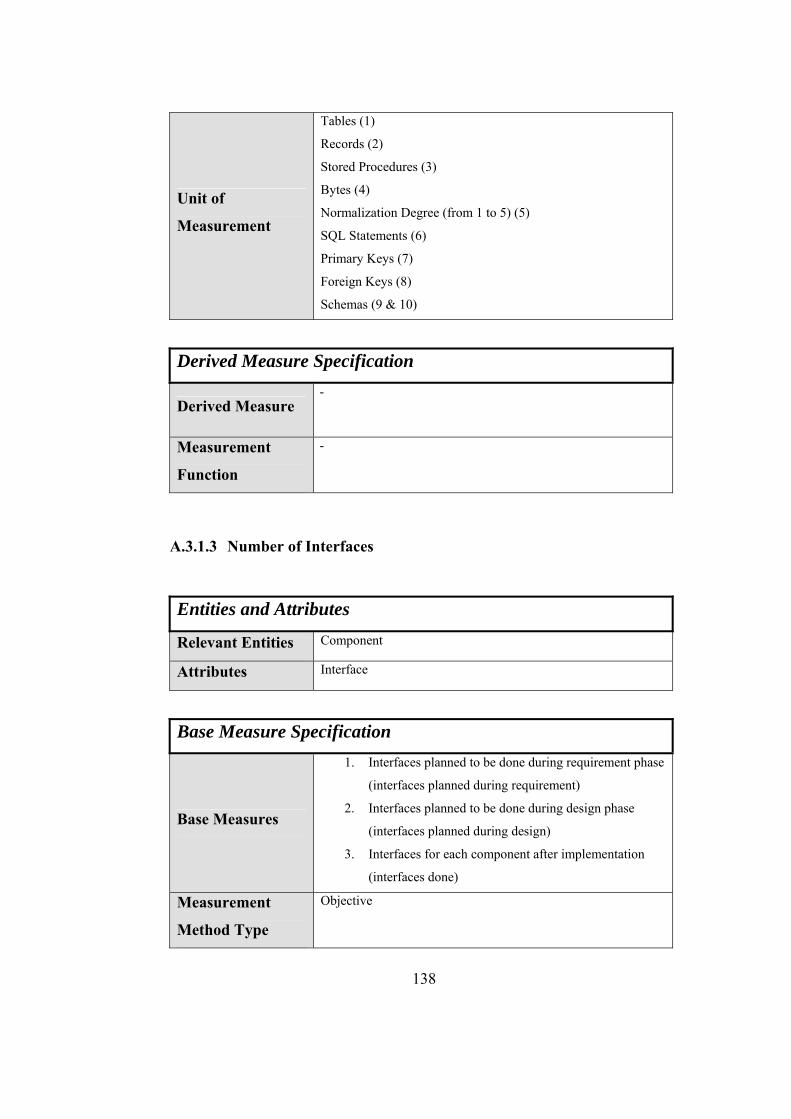
Unit of
Measurement
Tables (1)
Records (2)
Stored Procedures (3)
Bytes (4)
Normalization Degree (from 1 to 5) (5)
SQL Statements (6)
Primary Keys (7)
Foreign Keys (8)
Schemas (9 & 10)
Derived Measure Specification
- Derived Measure
Measurement
Function
-
A.3.1.3 Number of Interfaces
Entities and Attributes Component Relevant Entities Interface Attributes
Base Measure Specification
Base Measures
1. Interfaces planned to be done during requirement phase
(interfaces planned during requirement)
2. Interfaces planned to be done during design phase
(interfaces planned during design)
3. Interfaces for each component after implementation
(interfaces done)
Measurement
Method Type
Objective
138
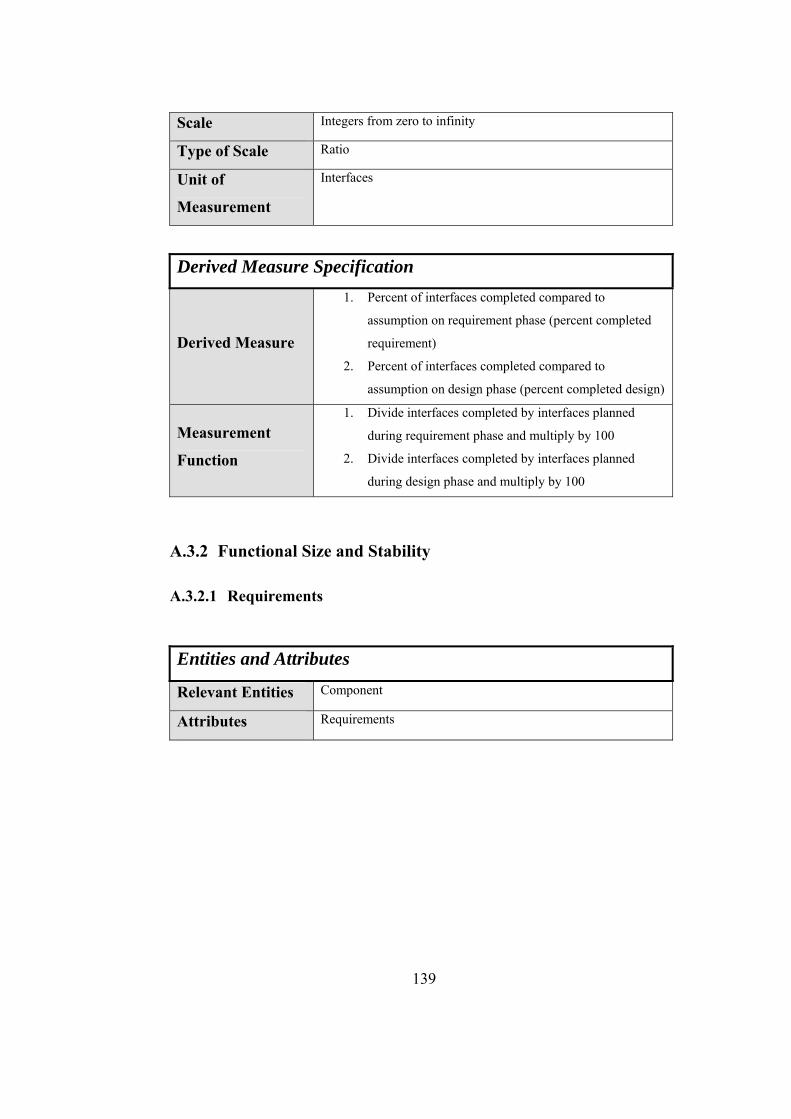
139
Scale Integers from zero to infinity
Type of Scale Ratio
Unit of
Measurement
Interfaces
Derived Measure Specification
Derived Measure
1. Percent of interfaces completed compared to
assumption on requirement phase (percent completed
requirement)
2. Percent of interfaces completed compared to
assumption on design phase (percent completed design)
Measurement
Function
1. Divide interfaces completed by interfaces planned
during requirement phase and multiply by 100
2. Divide interfaces completed by interfaces planned
during design phase and multiply by 100
A.3.2 Functional Size and Stability
A.3.2.1 Requirements
Entities and Attributes Component Relevant Entities Requirements Attributes
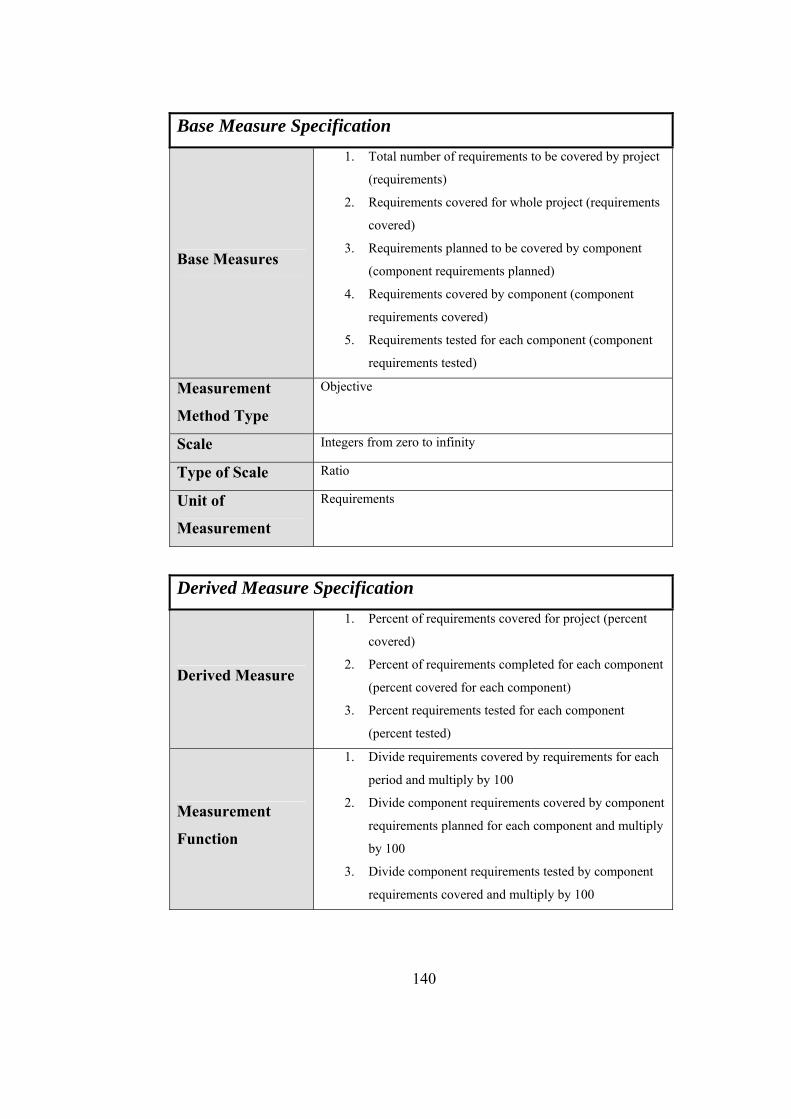
Base Measure Specification
Base Measures
1. Total number of requirements to be covered by project
(requirements)
2. Requirements covered for whole project (requirements
covered)
3. Requirements planned to be covered by component
(component requirements planned)
4. Requirements covered by component (component
requirements covered)
5. Requirements tested for each component (component
requirements tested)
Measurement
Method Type
Objective
Scale Integers from zero to infinity
Type of Scale Ratio
Unit of
Measurement
Requirements
Derived Measure Specification
Derived Measure
1. Percent of requirements covered for project (percent
covered)
2. Percent of requirements completed for each component
(percent covered for each component)
3. Percent requirements tested for each component
(percent tested)
Measurement
Function
1. Divide requirements covered by requirements for each
period and multiply by 100
2. Divide component requirements covered by component
requirements planned for each component and multiply
by 100
3. Divide component requirements tested by component
requirements covered and multiply by 100
140
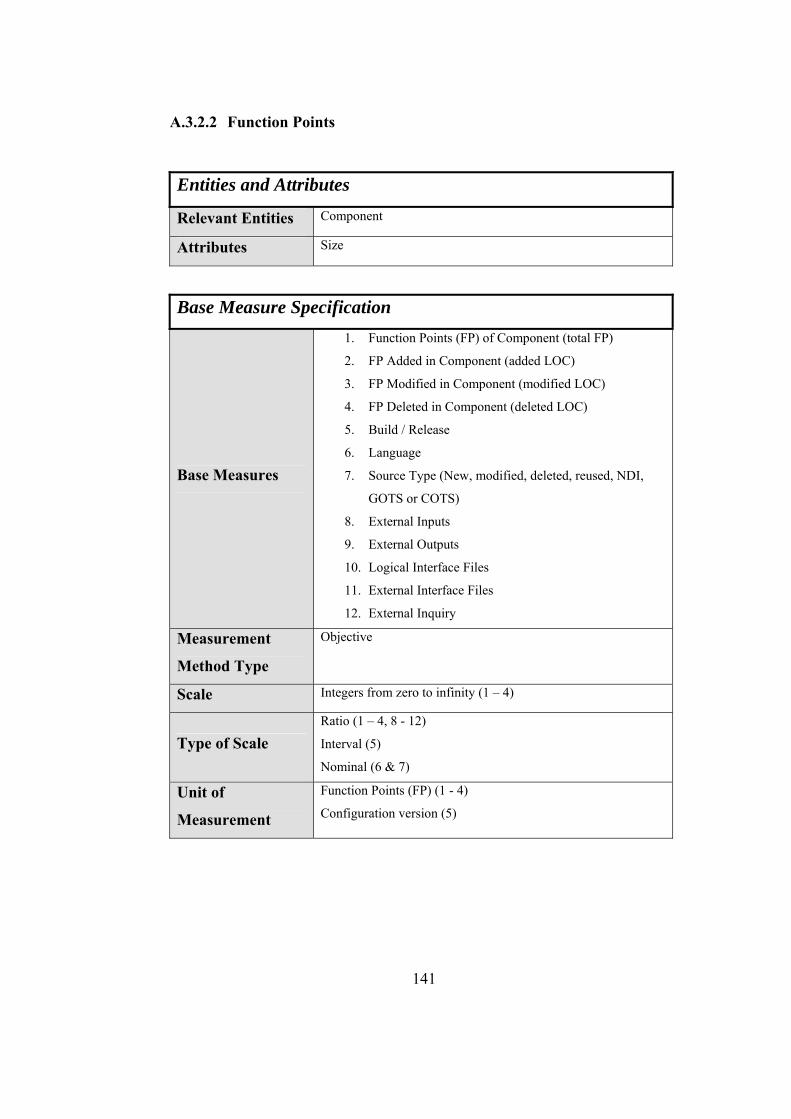
141
A.3.2.2 Function Points
Entities and Attributes
Relevant Entities Component
Attributes Size
Base Measure Specification
Base Measures
1. Function Points (FP) of Component (total FP)
2. FP Added in Component (added LOC)
3. FP Modified in Component (modified LOC)
4. FP Deleted in Component (deleted LOC)
5. Build / Release
6. Language
7. Source Type (New, modified, deleted, reused, NDI,
GOTS or COTS)
8. External Inputs
9. External Outputs
10. Logical Interface Files
11. External Interface Files
12. External Inquiry
Measurement
Method Type
Objective
Scale Integers from zero to infinity (1 – 4)
Type of Scale Ratio (1 – 4, 8 - 12)
Interval (5)
Nominal (6 & 7)
Unit of
Measurement
Function Points (FP) (1 - 4)
Configuration version (5)
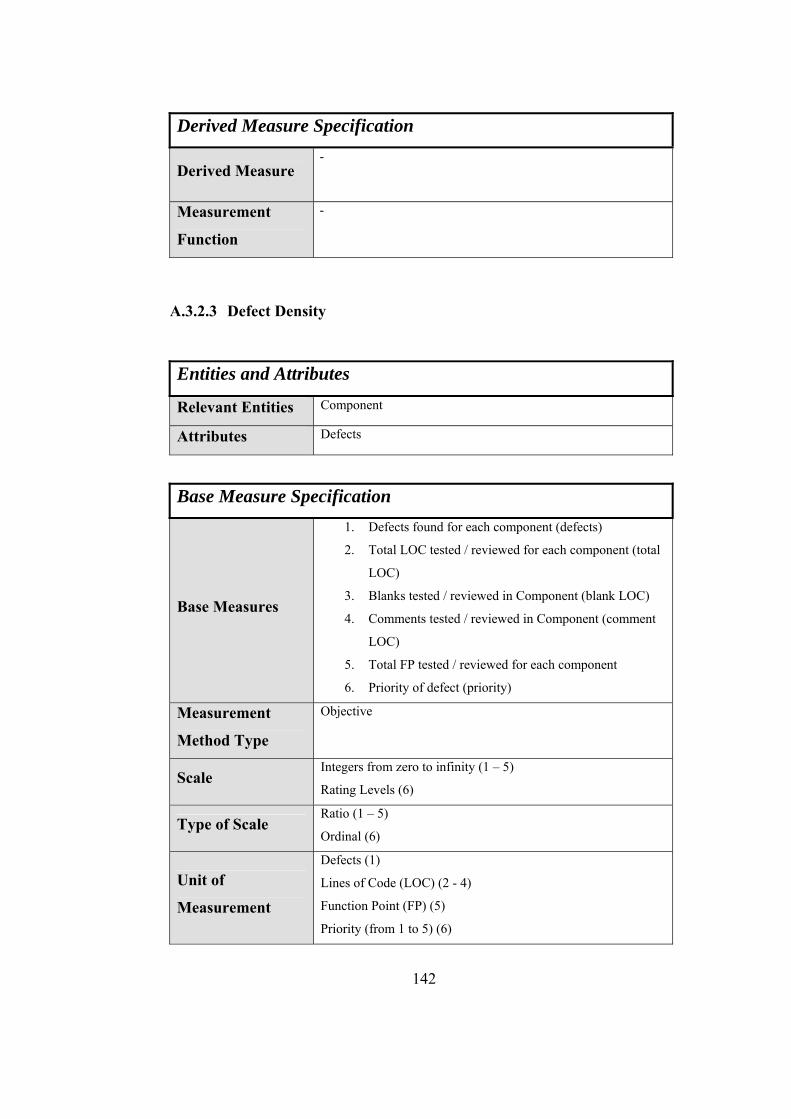
Derived Measure Specification
- Derived Measure
Measurement
Function
-
A.3.2.3 Defect Density
Entities and Attributes Component Relevant Entities Defects Attributes
Base Measure Specification
Base Measures
1. Defects found for each component (defects)
2. Total LOC tested / reviewed for each component (total
LOC)
3. Blanks tested / reviewed in Component (blank LOC)
4. Comments tested / reviewed in Component (comment
LOC)
5. Total FP tested / reviewed for each component
6. Priority of defect (priority)
Measurement
Method Type
Objective
Scale Integers from zero to infinity (1 – 5)
Rating Levels (6)
Type of Scale Ratio (1 – 5)
Ordinal (6)
Unit of
Measurement
Defects (1)
Lines of Code (LOC) (2 - 4)
Function Point (FP) (5)
Priority (from 1 to 5) (6)
142
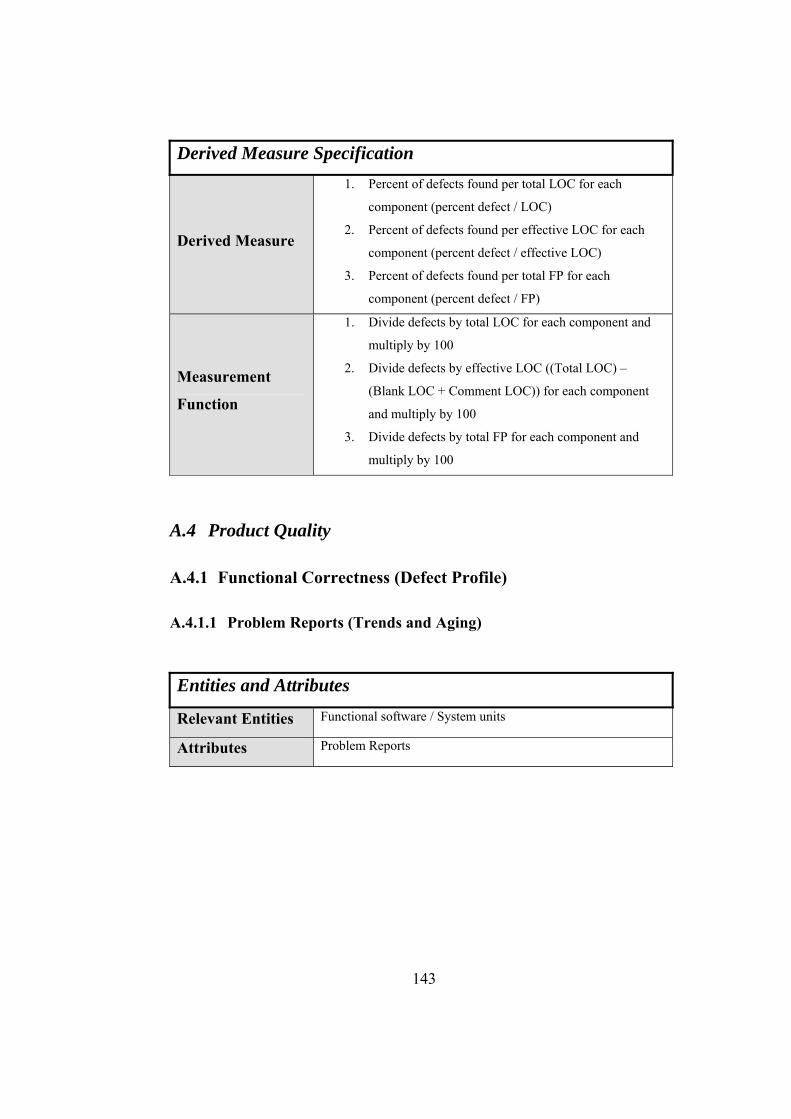
Derived Measure Specification
Derived Measure
1. Percent of defects found per total LOC for each
component (percent defect / LOC)
2. Percent of defects found per effective LOC for each
component (percent defect / effective LOC)
3. Percent of defects found per total FP for each
component (percent defect / FP)
Measurement
Function
1. Divide defects by total LOC for each component and
multiply by 100
2. Divide defects by effective LOC ((Total LOC) –
(Blank LOC + Comment LOC)) for each component
and multiply by 100
3. Divide defects by total FP for each component and
multiply by 100
A.4 Product Quality
A.4.1 Functional Correctness (Defect Profile)
A.4.1.1 Problem Reports (Trends and Aging)
Entities and Attributes Functional software / System units Relevant Entities Problem Reports Attributes
143
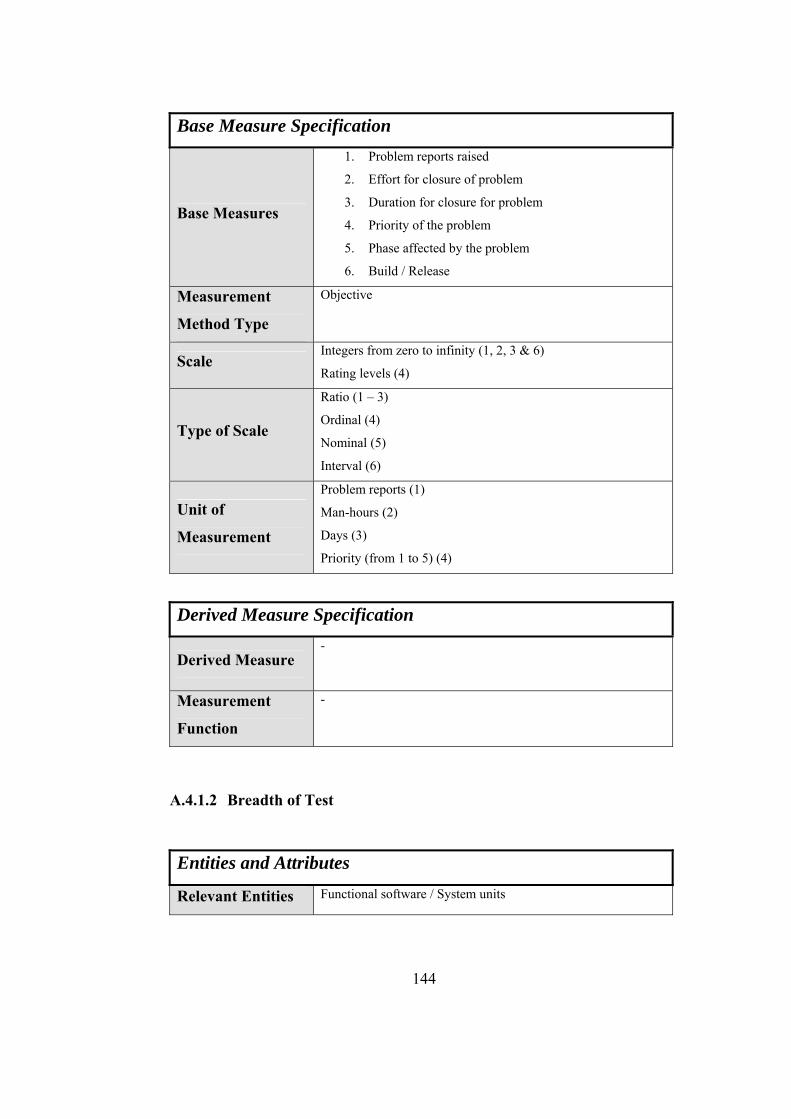
Base Measure Specification
Base Measures
1. Problem reports raised
2. Effort for closure of problem
3. Duration for closure for problem
4. Priority of the problem
5. Phase affected by the problem
6. Build / Release
Measurement
Method Type
Objective
Scale Integers from zero to infinity (1, 2, 3 & 6)
Rating levels (4)
Type of Scale
Ratio (1 – 3)
Ordinal (4)
Nominal (5)
Interval (6)
Unit of
Measurement
Problem reports (1)
Man-hours (2)
Days (3)
Priority (from 1 to 5) (4)
Derived Measure Specification
- Derived Measure
Measurement
Function
-
A.4.1.2 Breadth of Test
Entities and Attributes Functional software / System units Relevant Entities
144
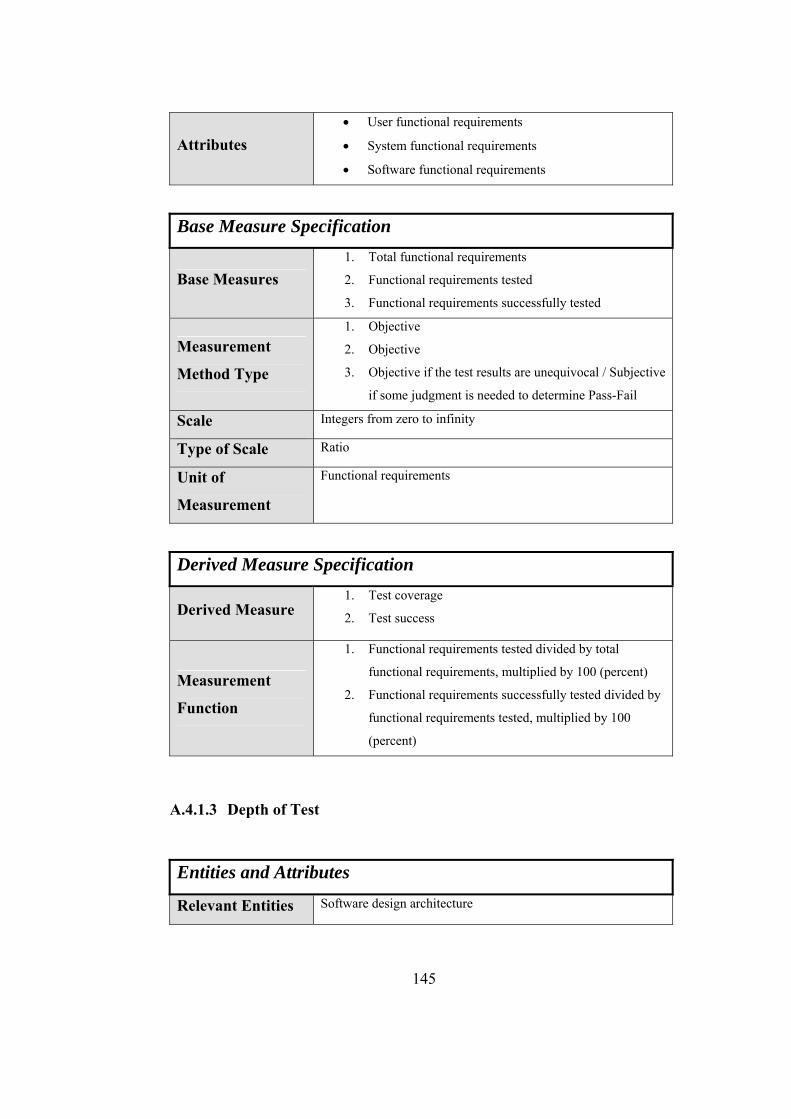
Attributes • User functional requirements
• System functional requirements
• Software functional requirements
Base Measure Specification
Base Measures 1. Total functional requirements
2. Functional requirements tested
3. Functional requirements successfully tested
Measurement
Method Type
1. Objective
2. Objective
3. Objective if the test results are unequivocal / Subjective
if some judgment is needed to determine Pass-Fail
Scale Integers from zero to infinity
Type of Scale Ratio
Unit of
Measurement
Functional requirements
Derived Measure Specification
Derived Measure 1. Test coverage
2. Test success
Measurement
Function
1. Functional requirements tested divided by total
functional requirements, multiplied by 100 (percent)
2. Functional requirements successfully tested divided by
functional requirements tested, multiplied by 100
(percent)
A.4.1.3 Depth of Test
Entities and Attributes Software design architecture Relevant Entities
145
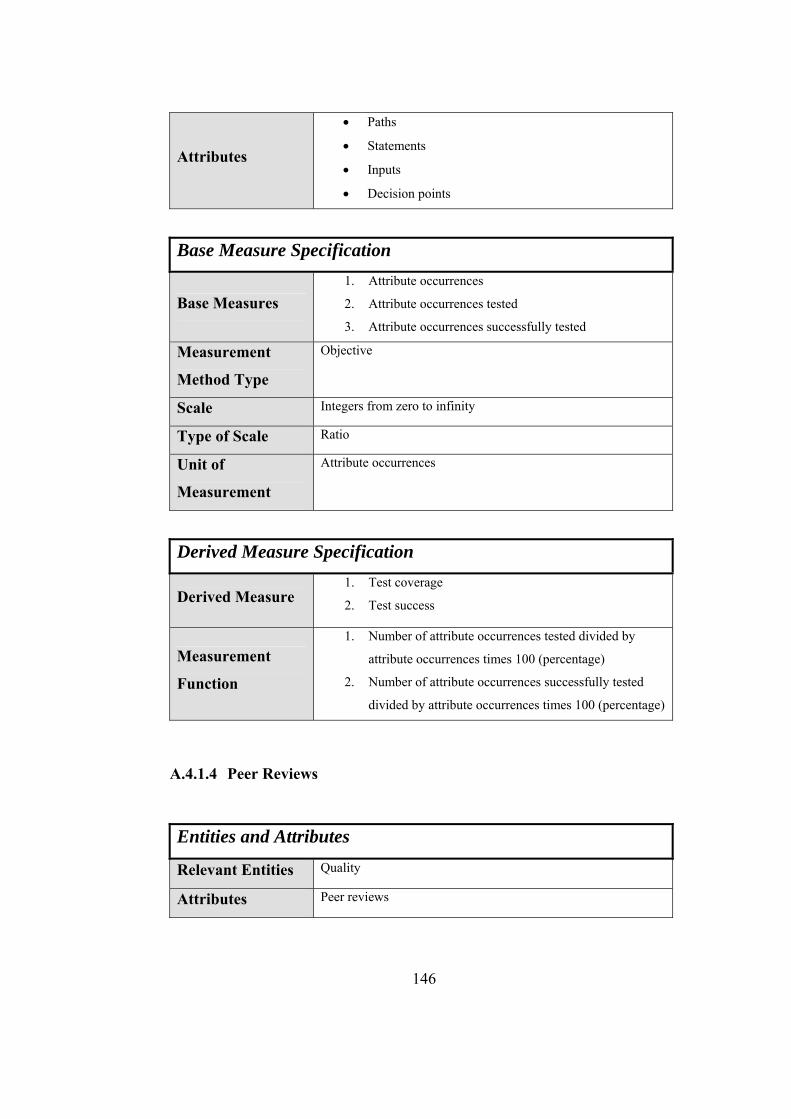
Attributes
• Paths
• Statements
• Inputs
• Decision points
Base Measure Specification
Base Measures 1. Attribute occurrences
2. Attribute occurrences tested
3. Attribute occurrences successfully tested
Measurement
Method Type
Objective
Scale Integers from zero to infinity
Type of Scale Ratio
Unit of
Measurement
Attribute occurrences
Derived Measure Specification
Derived Measure 1. Test coverage
2. Test success
Measurement
Function
1. Number of attribute occurrences tested divided by
attribute occurrences times 100 (percentage)
2. Number of attribute occurrences successfully tested
divided by attribute occurrences times 100 (percentage)
A.4.1.4 Peer Reviews
Entities and Attributes Quality Relevant Entities Peer reviews Attributes
146
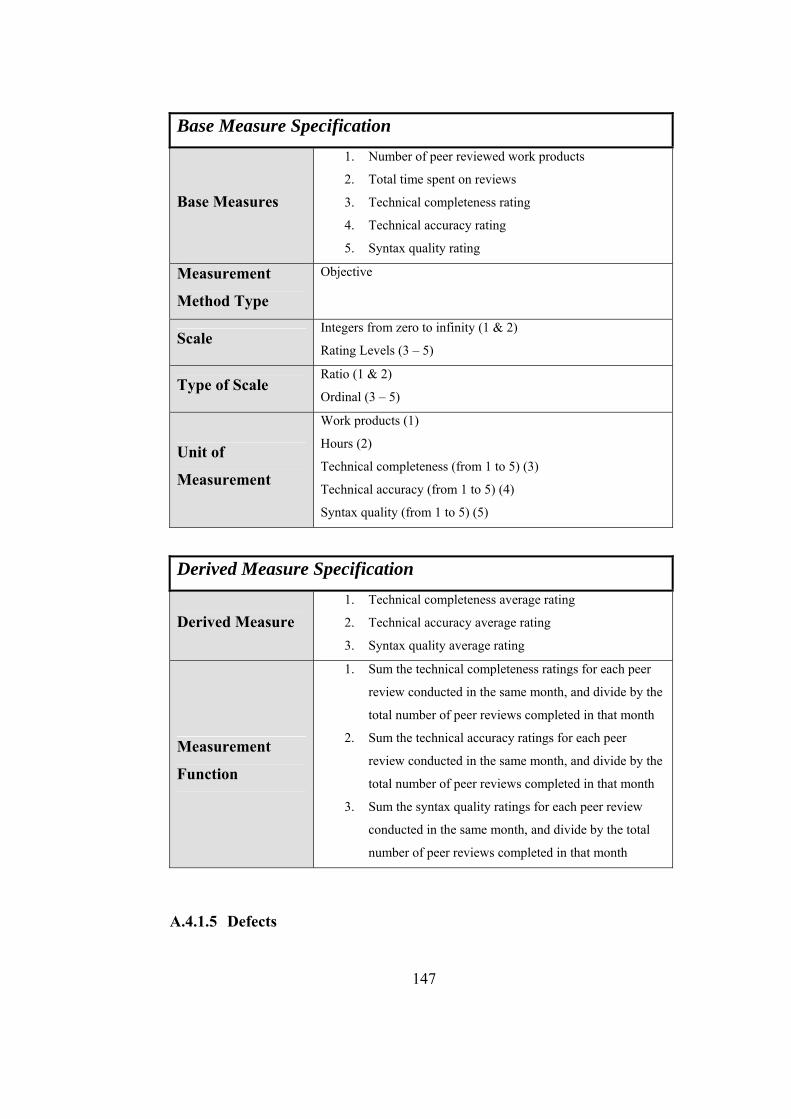
Base Measure Specification
Base Measures
1. Number of peer reviewed work products
2. Total time spent on reviews
3. Technical completeness rating
4. Technical accuracy rating
5. Syntax quality rating
Measurement
Method Type
Objective
Scale Integers from zero to infinity (1 & 2)
Rating Levels (3 – 5)
Type of Scale Ratio (1 & 2)
Ordinal (3 – 5)
Unit of
Measurement
Work products (1)
Hours (2)
Technical completeness (from 1 to 5) (3)
Technical accuracy (from 1 to 5) (4)
Syntax quality (from 1 to 5) (5)
Derived Measure Specification
Derived Measure 1. Technical completeness average rating
2. Technical accuracy average rating
3. Syntax quality average rating
Measurement
Function
1. Sum the technical completeness ratings for each peer
review conducted in the same month, and divide by the
total number of peer reviews completed in that month
2. Sum the technical accuracy ratings for each peer
review conducted in the same month, and divide by the
total number of peer reviews completed in that month
3. Sum the syntax quality ratings for each peer review
conducted in the same month, and divide by the total
number of peer reviews completed in that month
A.4.1.5 Defects
147
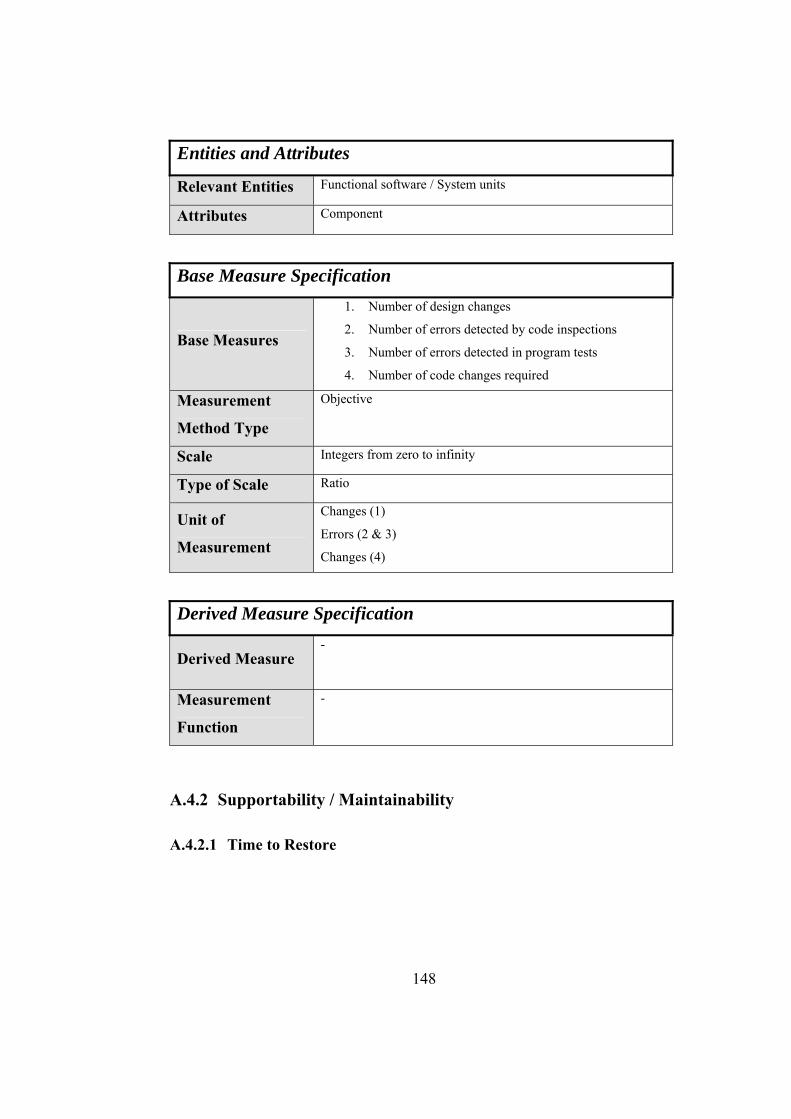
Entities and Attributes Functional software / System units Relevant Entities Component Attributes
Base Measure Specification
Base Measures
1. Number of design changes
2. Number of errors detected by code inspections
3. Number of errors detected in program tests
4. Number of code changes required
Measurement
Method Type
Objective
Scale Integers from zero to infinity
Type of Scale Ratio
Unit of
Measurement
Changes (1)
Errors (2 & 3)
Changes (4)
Derived Measure Specification
- Derived Measure
Measurement
Function
-
A.4.2 Supportability / Maintainability
A.4.2.1 Time to Restore
148
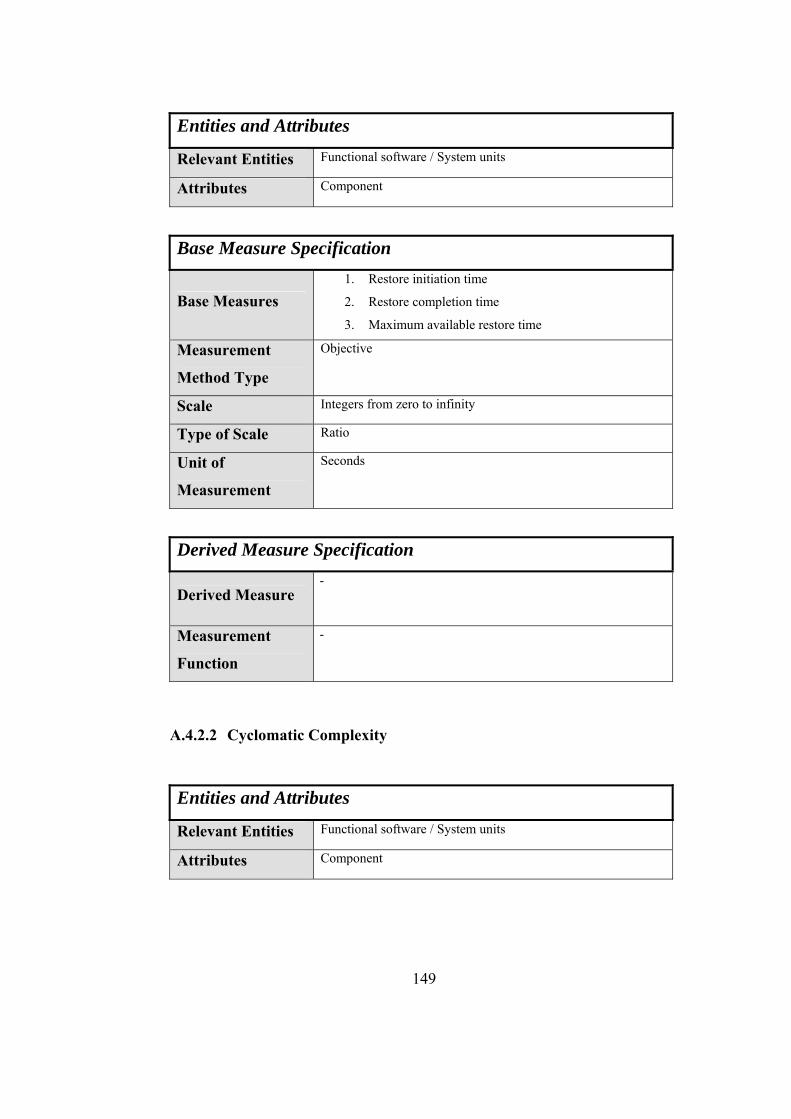
Entities and Attributes Functional software / System units Relevant Entities Component Attributes
Base Measure Specification
Base Measures 1. Restore initiation time
2. Restore completion time
3. Maximum available restore time
Measurement
Method Type
Objective
Scale Integers from zero to infinity
Type of Scale Ratio
Unit of
Measurement
Seconds
Derived Measure Specification
- Derived Measure
Measurement
Function
-
A.4.2.2 Cyclomatic Complexity
Entities and Attributes Functional software / System units Relevant Entities Component Attributes
149
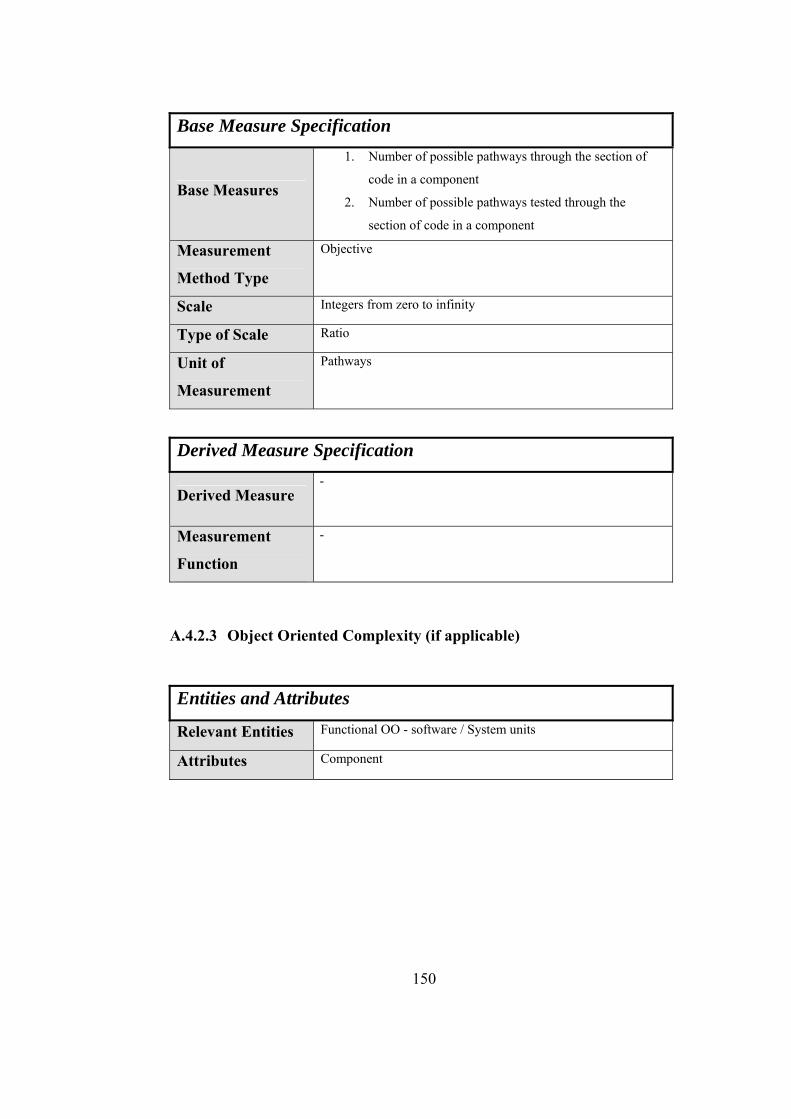
Base Measure Specification
Base Measures
1. Number of possible pathways through the section of
code in a component
2. Number of possible pathways tested through the
section of code in a component
Measurement
Method Type
Objective
Scale Integers from zero to infinity
Type of Scale Ratio
Unit of
Measurement
Pathways
Derived Measure Specification
- Derived Measure
Measurement
Function
-
A.4.2.3 Object Oriented Complexity (if applicable)
Entities and Attributes Functional OO - software / System units Relevant Entities Component Attributes
150
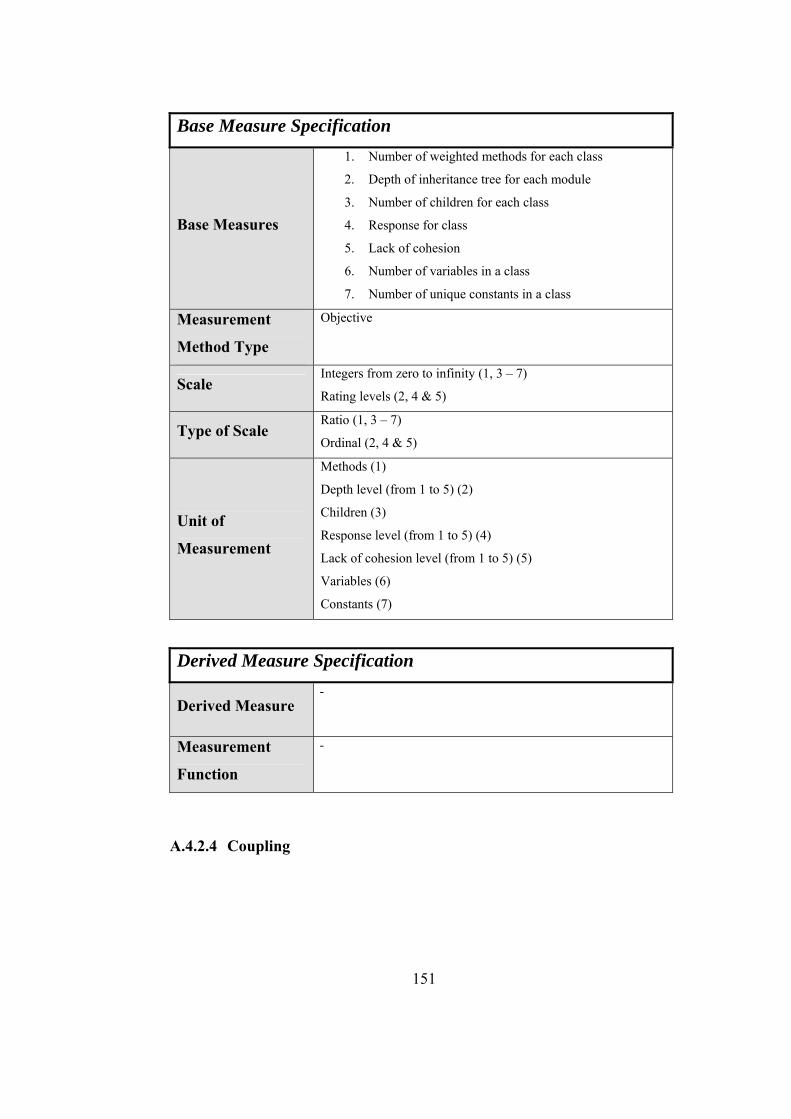
Base Measure Specification
Base Measures
1. Number of weighted methods for each class
2. Depth of inheritance tree for each module
3. Number of children for each class
4. Response for class
5. Lack of cohesion
6. Number of variables in a class
7. Number of unique constants in a class
Measurement
Method Type
Objective
Scale Integers from zero to infinity (1, 3 – 7)
Rating levels (2, 4 & 5)
Type of Scale Ratio (1, 3 – 7)
Ordinal (2, 4 & 5)
Unit of
Measurement
Methods (1)
Depth level (from 1 to 5) (2)
Children (3)
Response level (from 1 to 5) (4)
Lack of cohesion level (from 1 to 5) (5)
Variables (6)
Constants (7)
Derived Measure Specification
- Derived Measure
Measurement
Function
-
A.4.2.4 Coupling
151
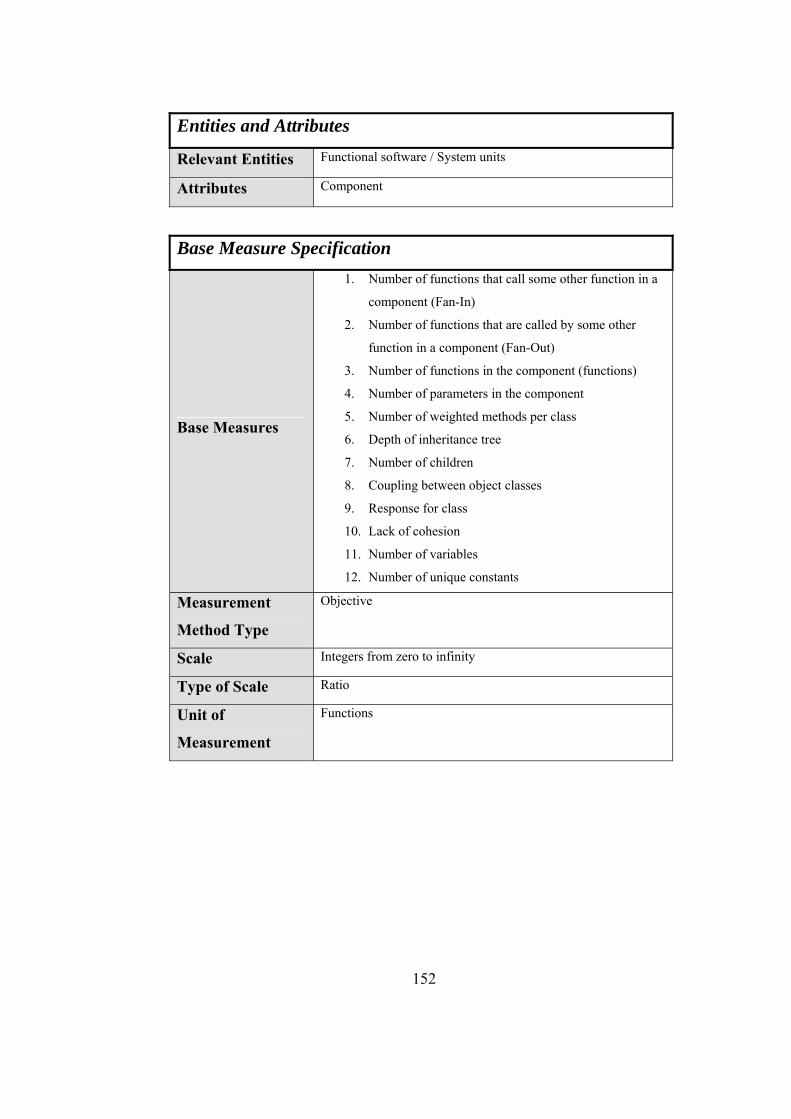
152
Entities and Attributes
Relevant Entities Functional software / System units
Attributes Component
Base Measure Specification
Base Measures
1. Number of functions that call some other function in a
component (Fan-In)
2. Number of functions that are called by some other
function in a component (Fan-Out)
3. Number of functions in the component (functions)
4. Number of parameters in the component
5. Number of weighted methods per class
6. Depth of inheritance tree
7. Number of children
8. Coupling between object classes
9. Response for class
10. Lack of cohesion
11. Number of variables
12. Number of unique constants
Measurement
Method Type
Objective
Scale Integers from zero to infinity
Type of Scale Ratio
Unit of
Measurement
Functions
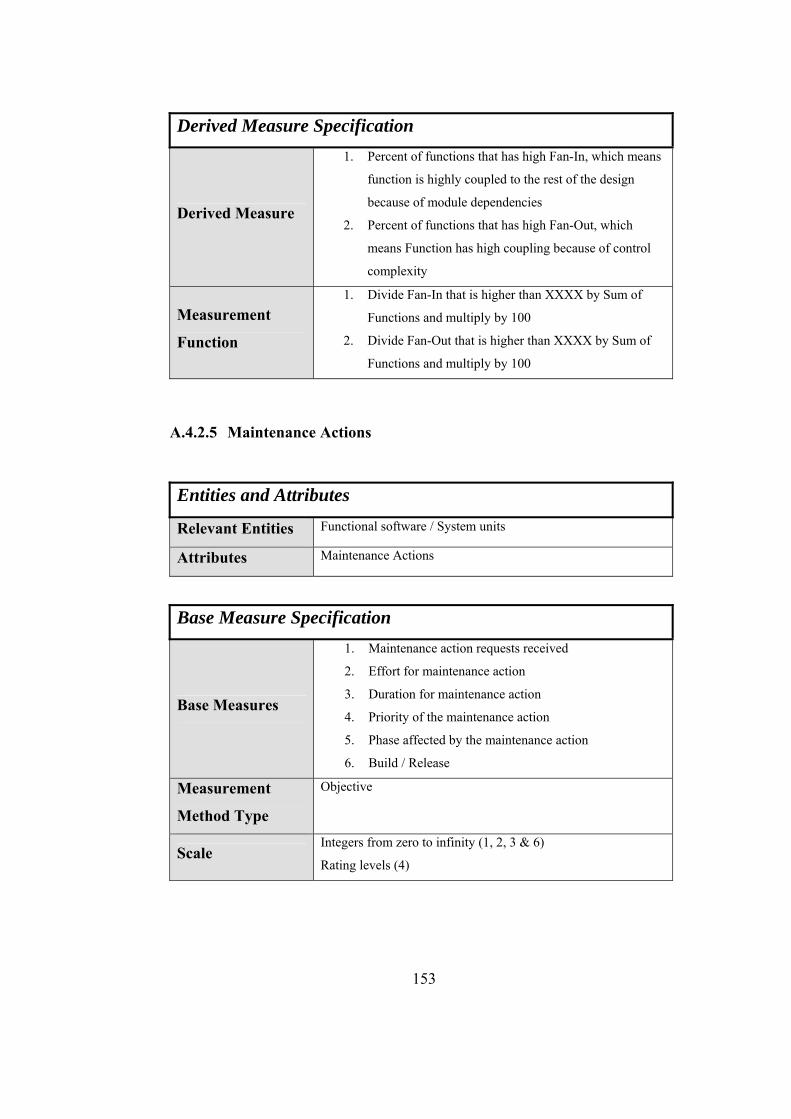
Derived Measure Specification
Derived Measure
1. Percent of functions that has high Fan-In, which means
function is highly coupled to the rest of the design
because of module dependencies
2. Percent of functions that has high Fan-Out, which
means Function has high coupling because of control
complexity
Measurement
Function
1. Divide Fan-In that is higher than XXXX by Sum of
Functions and multiply by 100
2. Divide Fan-Out that is higher than XXXX by Sum of
Functions and multiply by 100
A.4.2.5 Maintenance Actions
Entities and Attributes Functional software / System units Relevant Entities Maintenance Actions Attributes
Base Measure Specification
Base Measures
1. Maintenance action requests received
2. Effort for maintenance action
3. Duration for maintenance action
4. Priority of the maintenance action
5. Phase affected by the maintenance action
6. Build / Release
Measurement
Method Type
Objective
Scale Integers from zero to infinity (1, 2, 3 & 6)
Rating levels (4)
153
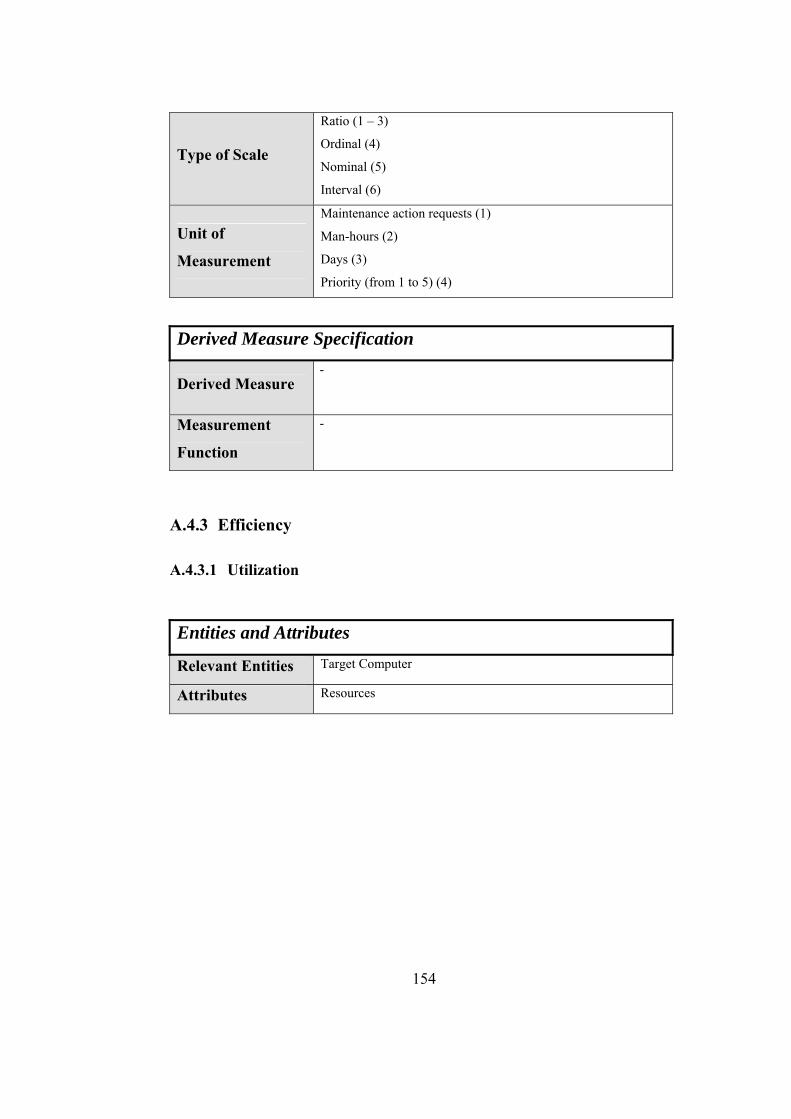
Type of Scale
Ratio (1 – 3)
Ordinal (4)
Nominal (5)
Interval (6)
Unit of
Measurement
Maintenance action requests (1)
Man-hours (2)
Days (3)
Priority (from 1 to 5) (4)
Derived Measure Specification
- Derived Measure
Measurement
Function
-
A.4.3 Efficiency
A.4.3.1 Utilization
Entities and Attributes Target Computer Relevant Entities Resources Attributes
154
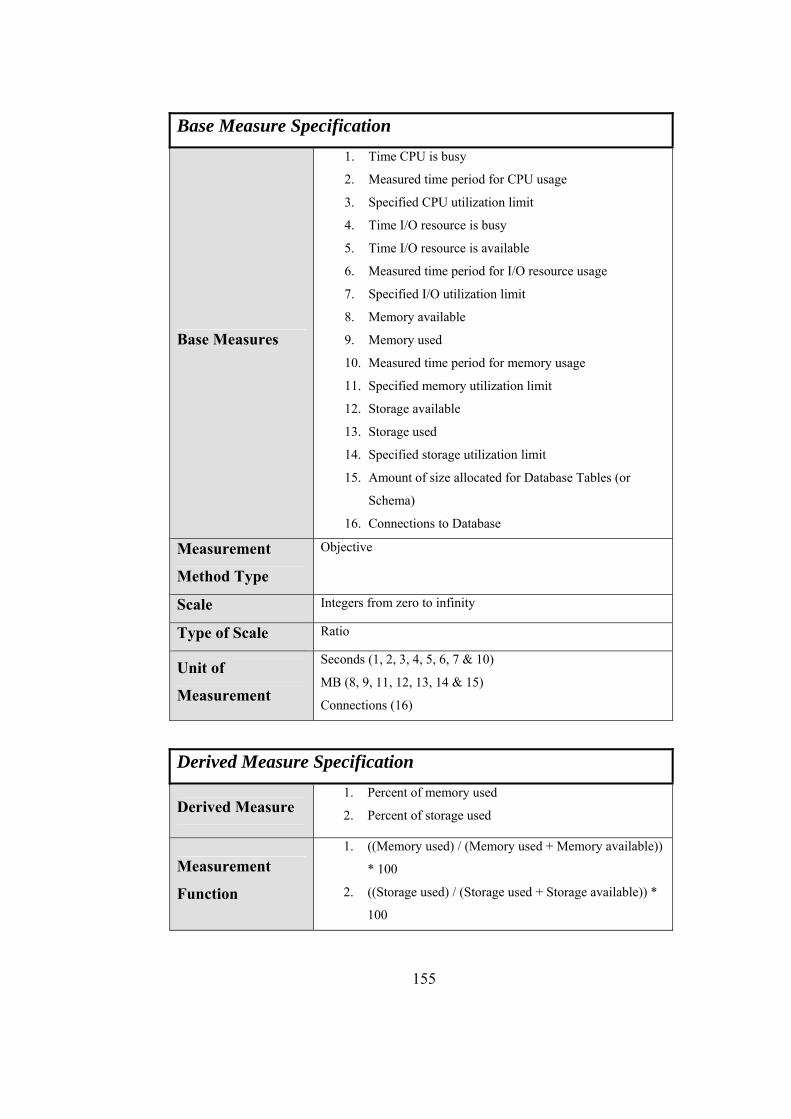
Base Measure Specification
Base Measures
1. Time CPU is busy
2. Measured time period for CPU usage
3. Specified CPU utilization limit
4. Time I/O resource is busy
5. Time I/O resource is available
6. Measured time period for I/O resource usage
7. Specified I/O utilization limit
8. Memory available
9. Memory used
10. Measured time period for memory usage
11. Specified memory utilization limit
12. Storage available
13. Storage used
14. Specified storage utilization limit
15. Amount of size allocated for Database Tables (or
Schema)
16. Connections to Database
Measurement
Method Type
Objective
Scale Integers from zero to infinity
Type of Scale Ratio
Unit of
Measurement
Seconds (1, 2, 3, 4, 5, 6, 7 & 10)
MB (8, 9, 11, 12, 13, 14 & 15)
Connections (16)
Derived Measure Specification
Derived Measure 1. Percent of memory used
2. Percent of storage used
Measurement
Function
1. ((Memory used) / (Memory used + Memory available))
* 100
2. ((Storage used) / (Storage used + Storage available)) *
100
155
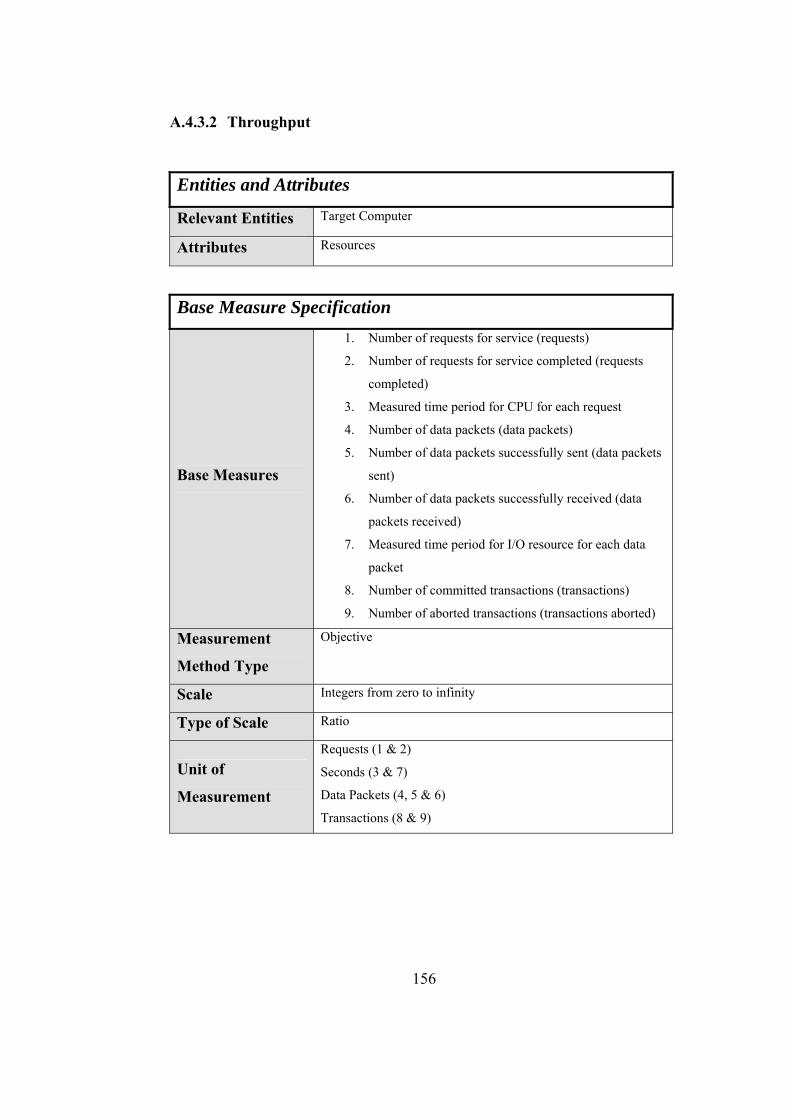
156
A.4.3.2 Throughput
Entities and Attributes
Relevant Entities Target Computer
Attributes Resources
Base Measure Specification
Base Measures
1. Number of requests for service (requests)
2. Number of requests for service completed (requests
completed)
3. Measured time period for CPU for each request
4. Number of data packets (data packets)
5. Number of data packets successfully sent (data packets
sent)
6. Number of data packets successfully received (data
packets received)
7. Measured time period for I/O resource for each data
packet
8. Number of committed transactions (transactions)
9. Number of aborted transactions (transactions aborted)
Measurement
Method Type
Objective
Scale Integers from zero to infinity
Type of Scale Ratio
Unit of
Measurement
Requests (1 & 2)
Seconds (3 & 7)
Data Packets (4, 5 & 6)
Transactions (8 & 9)
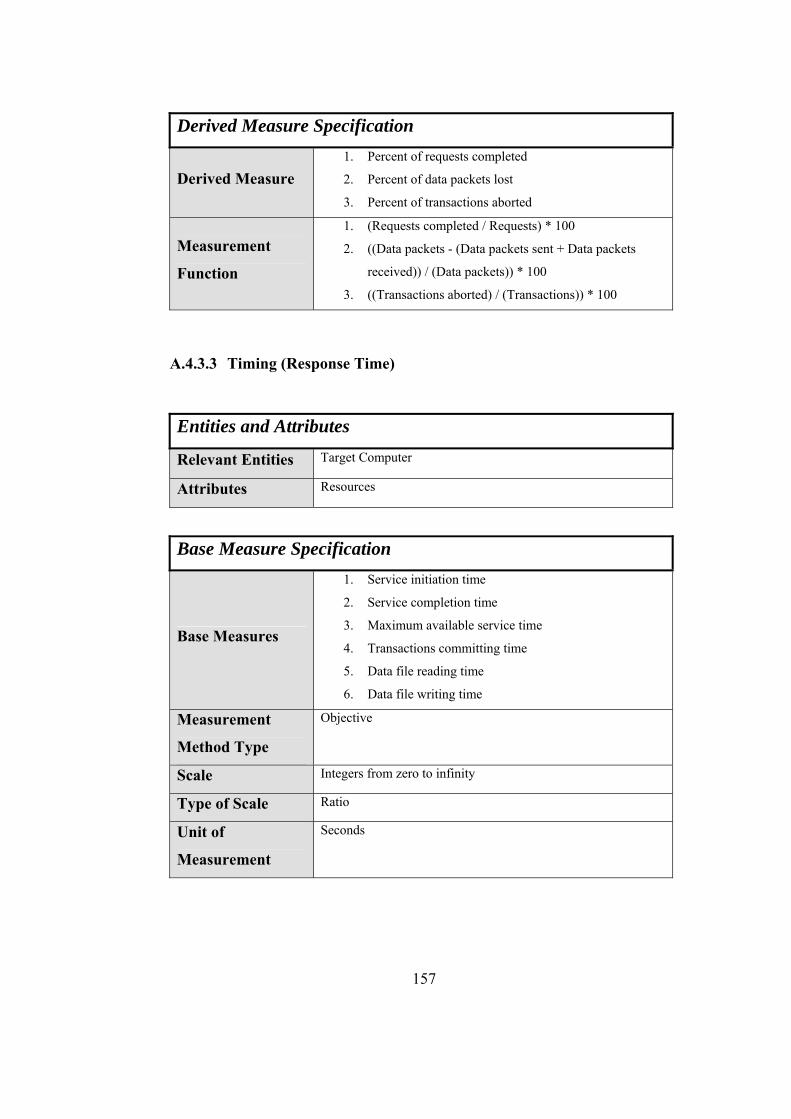
Derived Measure Specification
Derived Measure 1. Percent of requests completed
2. Percent of data packets lost
3. Percent of transactions aborted
Measurement
Function
1. (Requests completed / Requests) * 100
2. ((Data packets - (Data packets sent + Data packets
received)) / (Data packets)) * 100
3. ((Transactions aborted) / (Transactions)) * 100
A.4.3.3 Timing (Response Time)
Entities and Attributes Target Computer Relevant Entities Resources Attributes
Base Measure Specification
Base Measures
1. Service initiation time
2. Service completion time
3. Maximum available service time
4. Transactions committing time
5. Data file reading time
6. Data file writing time
Measurement
Method Type
Objective
Scale Integers from zero to infinity
Type of Scale Ratio
Unit of
Measurement
Seconds
157
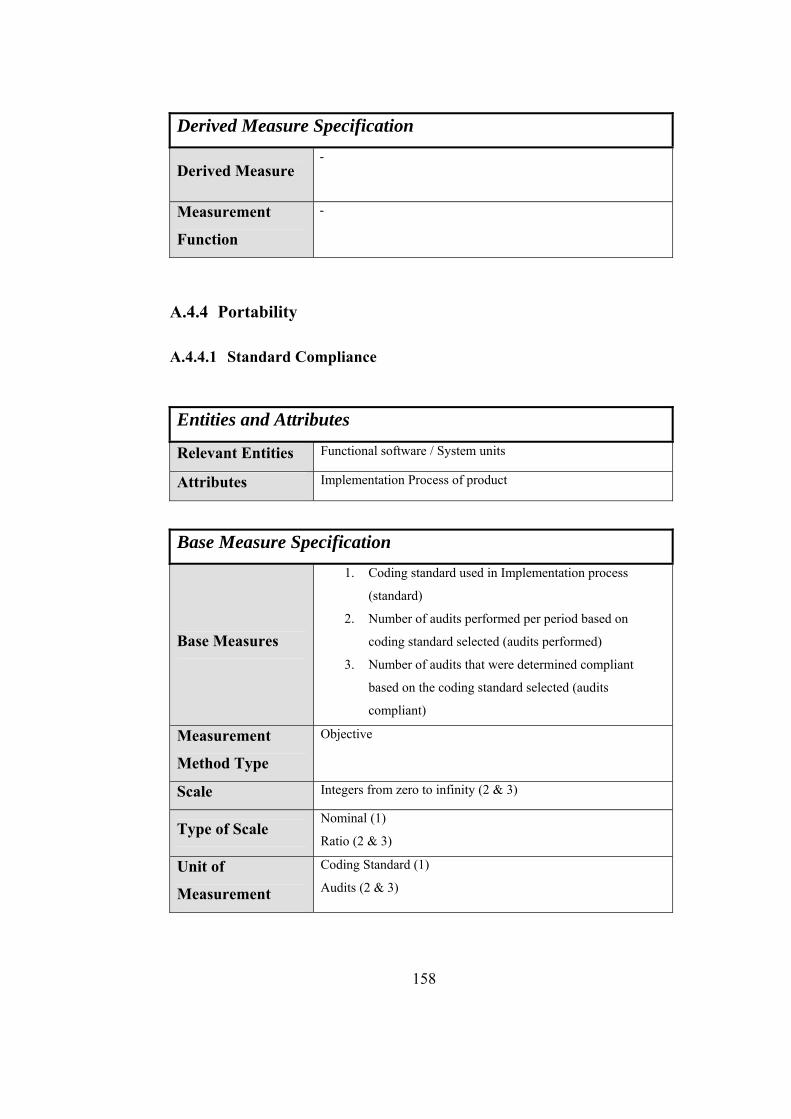
Derived Measure Specification
- Derived Measure
Measurement
Function
-
A.4.4 Portability
A.4.4.1 Standard Compliance
Entities and Attributes Functional software / System units Relevant Entities Implementation Process of product Attributes
Base Measure Specification
Base Measures
1. Coding standard used in Implementation process
(standard)
2. Number of audits performed per period based on
coding standard selected (audits performed)
3. Number of audits that were determined compliant
based on the coding standard selected (audits
compliant)
Measurement
Method Type
Objective
Scale Integers from zero to infinity (2 & 3)
Type of Scale Nominal (1)
Ratio (2 & 3)
Unit of
Measurement
Coding Standard (1)
Audits (2 & 3)
158
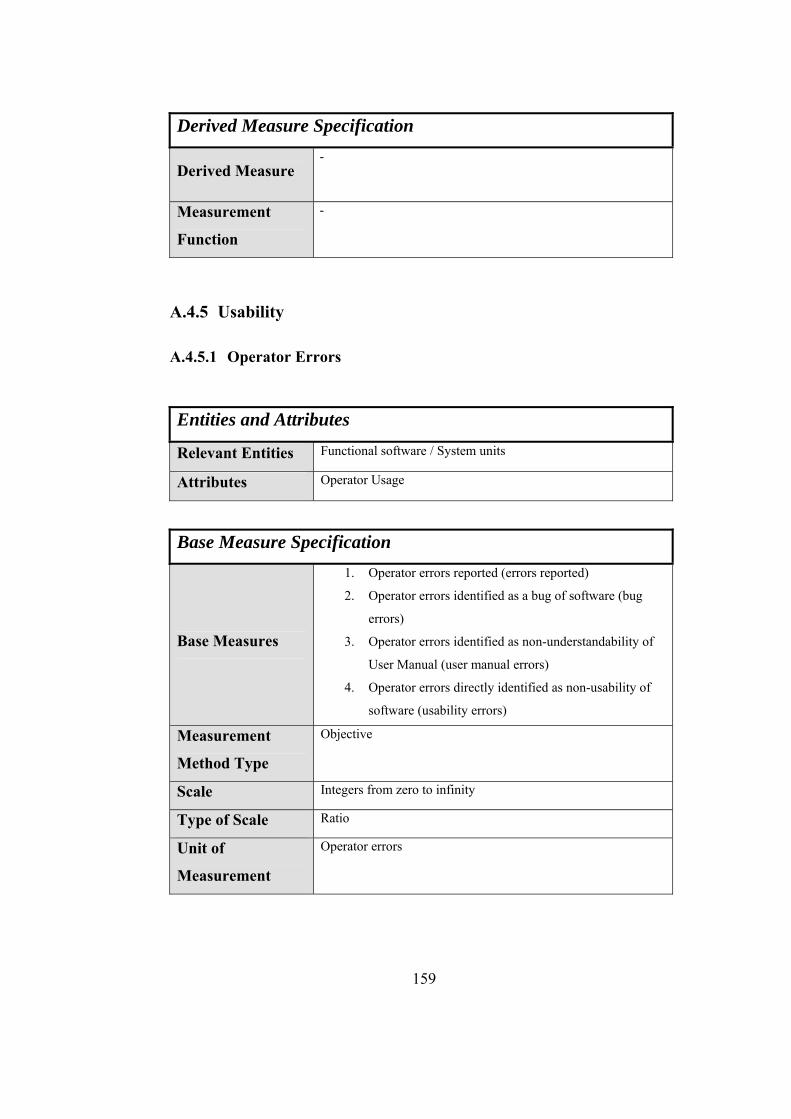
Derived Measure Specification
- Derived Measure
Measurement
Function
-
A.4.5 Usability
A.4.5.1 Operator Errors
Entities and Attributes Functional software / System units Relevant Entities Operator Usage Attributes
Base Measure Specification
Base Measures
1. Operator errors reported (errors reported)
2. Operator errors identified as a bug of software (bug
errors)
3. Operator errors identified as non-understandability of
User Manual (user manual errors)
4. Operator errors directly identified as non-usability of
software (usability errors)
Measurement
Method Type
Objective
Scale Integers from zero to infinity
Type of Scale Ratio
Unit of
Measurement
Operator errors
159
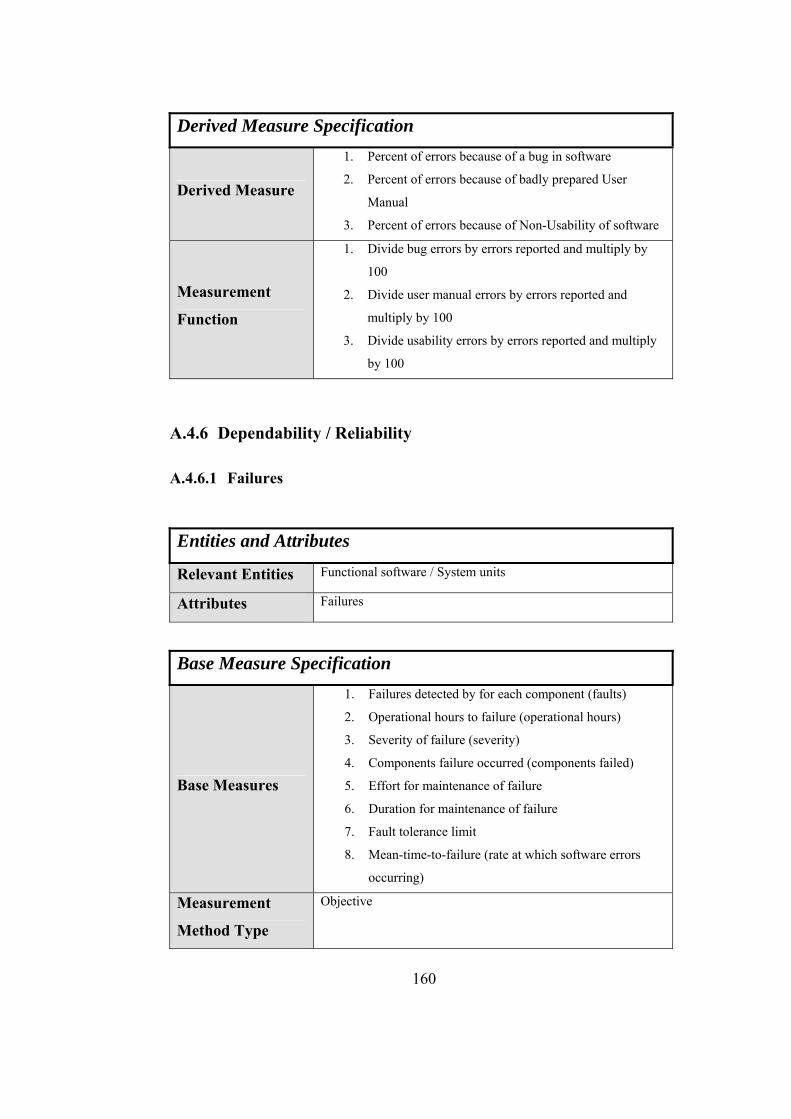
Derived Measure Specification
Derived Measure
1. Percent of errors because of a bug in software
2. Percent of errors because of badly prepared User
Manual
3. Percent of errors because of Non-Usability of software
Measurement
Function
1. Divide bug errors by errors reported and multiply by
100
2. Divide user manual errors by errors reported and
multiply by 100
3. Divide usability errors by errors reported and multiply
by 100
A.4.6 Dependability / Reliability
A.4.6.1 Failures
Entities and Attributes Functional software / System units Relevant Entities Failures Attributes
Base Measure Specification
Base Measures
1. Failures detected by for each component (faults)
2. Operational hours to failure (operational hours)
3. Severity of failure (severity)
4. Components failure occurred (components failed)
5. Effort for maintenance of failure
6. Duration for maintenance of failure
7. Fault tolerance limit
8. Mean-time-to-failure (rate at which software errors
occurring)
Measurement
Method Type
Objective
160
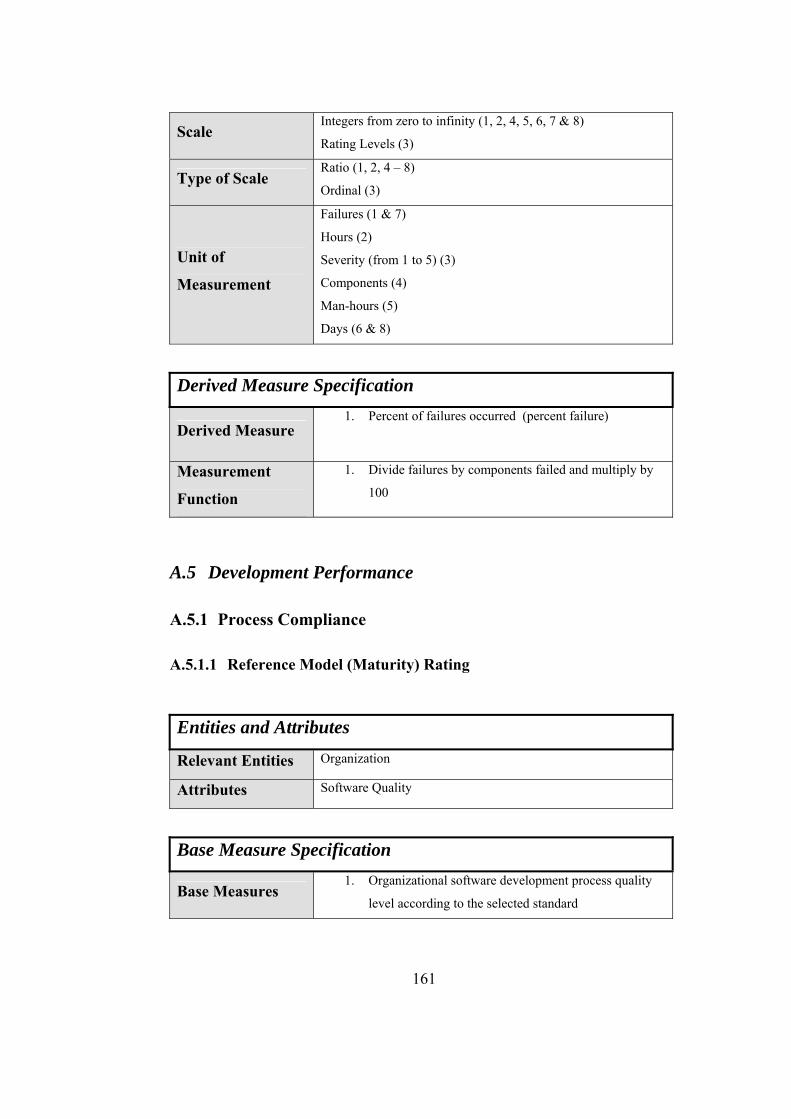
Scale Integers from zero to infinity (1, 2, 4, 5, 6, 7 & 8)
Rating Levels (3)
Type of Scale Ratio (1, 2, 4 – 8)
Ordinal (3)
Unit of
Measurement
Failures (1 & 7)
Hours (2)
Severity (from 1 to 5) (3)
Components (4)
Man-hours (5)
Days (6 & 8)
Derived Measure Specification
1. Percent of failures occurred (percent failure) Derived Measure
1. Divide failures by components failed and multiply by
100 Measurement
Function
A.5 Development Performance
A.5.1 Process Compliance
A.5.1.1 Reference Model (Maturity) Rating
Entities and Attributes Organization Relevant Entities Software Quality Attributes
Base Measure Specification
1. Organizational software development process quality
level according to the selected standard Base Measures
161
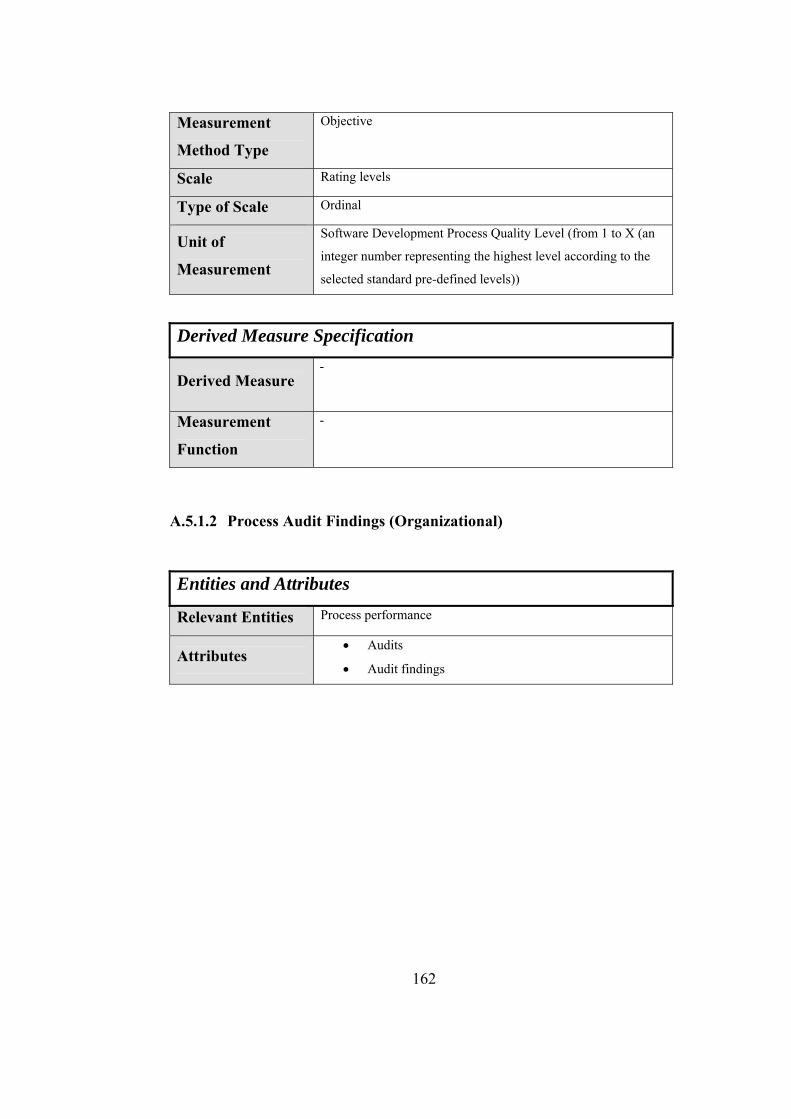
162
Measurement
Method Type
Objective
Scale Rating levels
Type of Scale Ordinal
Software Development Process Quality Level (from 1 to X (an
integer number representing the highest level according to the
selected standard pre-defined levels))
Unit of
Measurement
Derived Measure Specification
- Derived Measure
Measurement
Function
-
A.5.1.2 Process Audit Findings (Organizational)
Entities and Attributes Process performance Relevant Entities
Attributes • Audits
• Audit findings
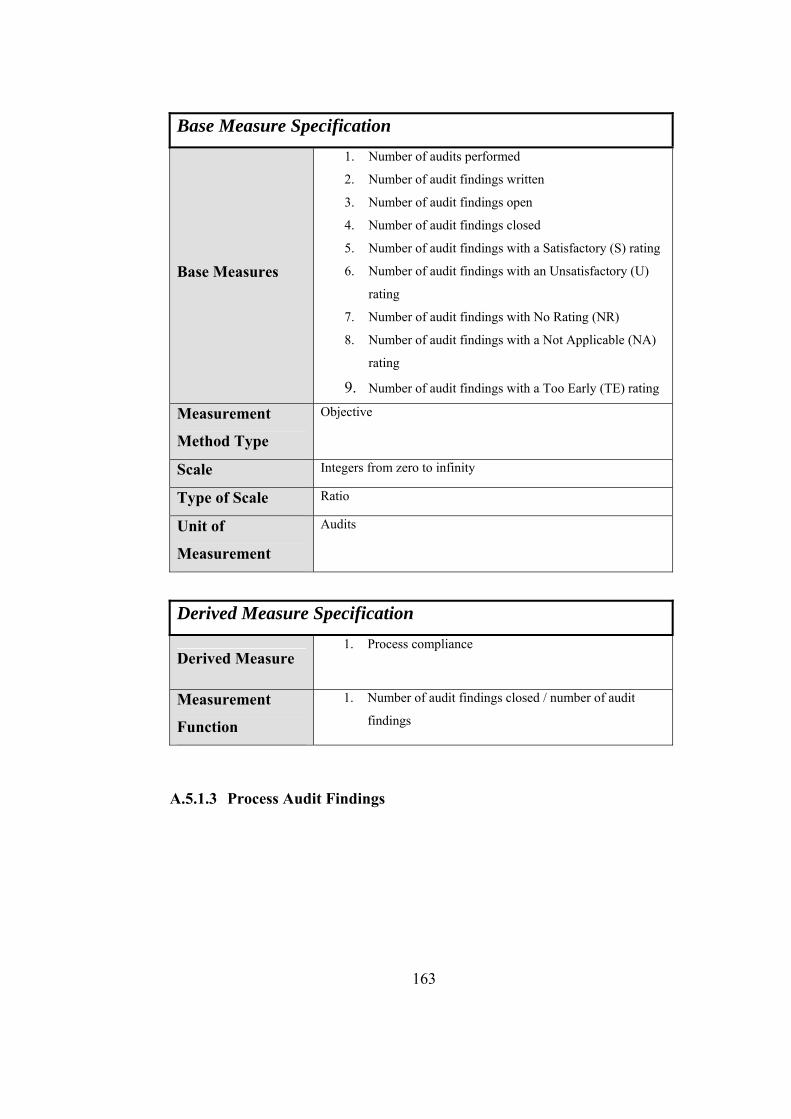
Base Measure Specification
Base Measures
1. Number of audits performed
2. Number of audit findings written
3. Number of audit findings open
4. Number of audit findings closed
5. Number of audit findings with a Satisfactory (S) rating
6. Number of audit findings with an Unsatisfactory (U)
rating
7. Number of audit findings with No Rating (NR)
8. Number of audit findings with a Not Applicable (NA)
rating
9. Number of audit findings with a Too Early (TE) rating Measurement
Method Type
Objective
Scale Integers from zero to infinity
Type of Scale Ratio
Unit of
Measurement
Audits
Derived Measure Specification
1. Process compliance Derived Measure
1. Number of audit findings closed / number of audit
findings Measurement
Function
A.5.1.3 Process Audit Findings
163
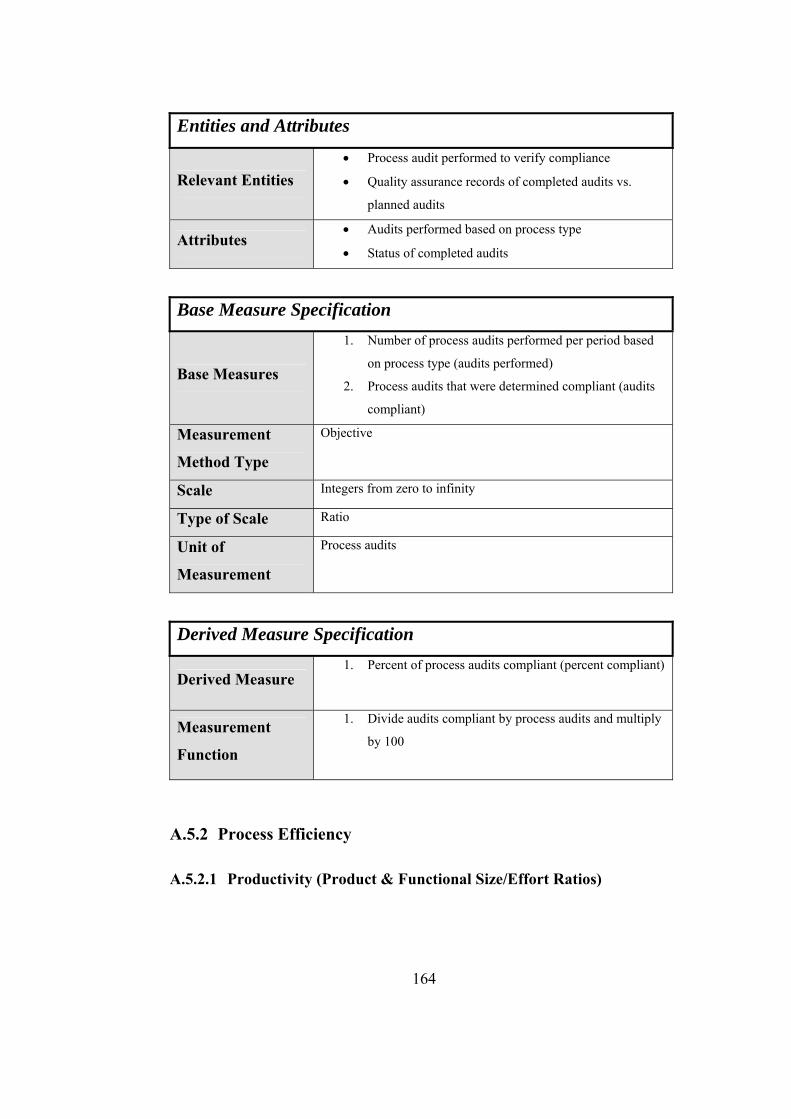
Entities and Attributes
Relevant Entities • Process audit performed to verify compliance
• Quality assurance records of completed audits vs.
planned audits
Attributes • Audits performed based on process type
• Status of completed audits
Base Measure Specification
Base Measures
1. Number of process audits performed per period based
on process type (audits performed)
2. Process audits that were determined compliant (audits
compliant)
Measurement
Method Type
Objective
Scale Integers from zero to infinity
Type of Scale Ratio
Unit of
Measurement
Process audits
Derived Measure Specification
1. Percent of process audits compliant (percent compliant) Derived Measure
Measurement
Function
1. Divide audits compliant by process audits and multiply
by 100
A.5.2 Process Efficiency
A.5.2.1 Productivity (Product & Functional Size/Effort Ratios)
164
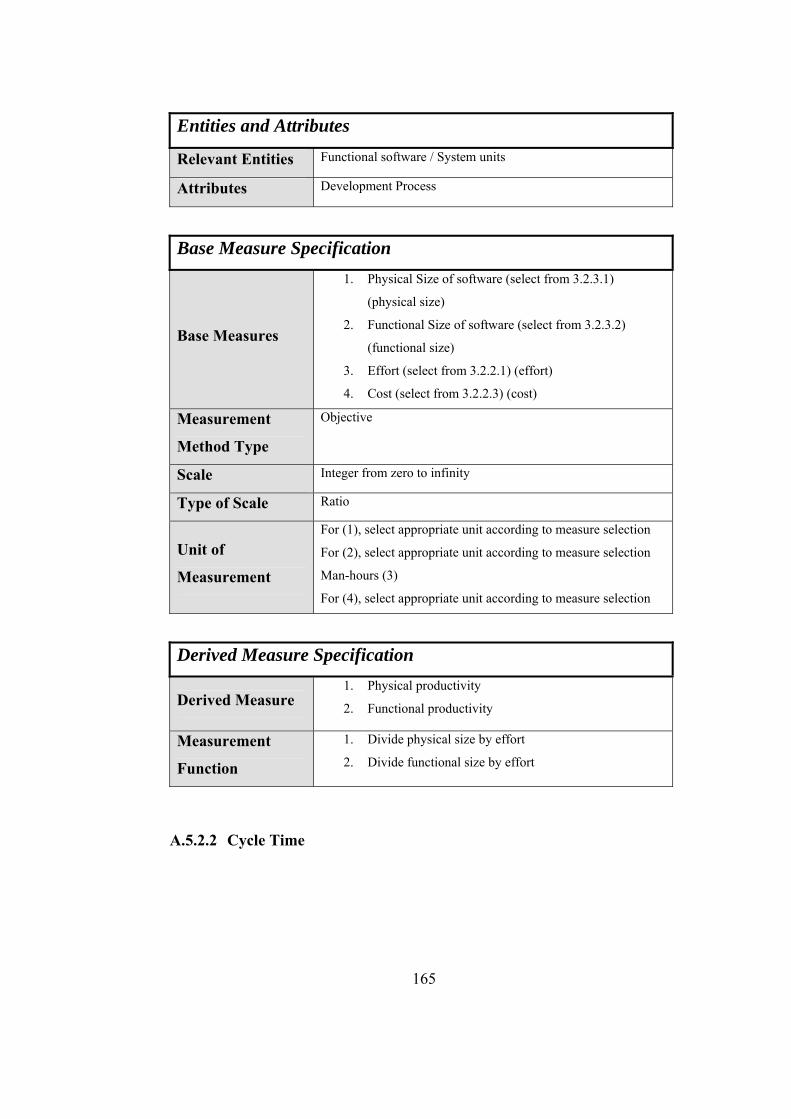
Entities and Attributes Functional software / System units Relevant Entities Development Process Attributes
Base Measure Specification
Base Measures
1. Physical Size of software (select from 3.2.3.1)
(physical size)
2. Functional Size of software (select from 3.2.3.2)
(functional size)
3. Effort (select from 3.2.2.1) (effort)
4. Cost (select from 3.2.2.3) (cost)
Measurement
Method Type
Objective
Scale Integer from zero to infinity
Type of Scale Ratio
Unit of
Measurement
For (1), select appropriate unit according to measure selection
For (2), select appropriate unit according to measure selection
Man-hours (3)
For (4), select appropriate unit according to measure selection
Derived Measure Specification
Derived Measure 1. Physical productivity
2. Functional productivity
Measurement
Function
1. Divide physical size by effort
2. Divide functional size by effort
A.5.2.2 Cycle Time
165
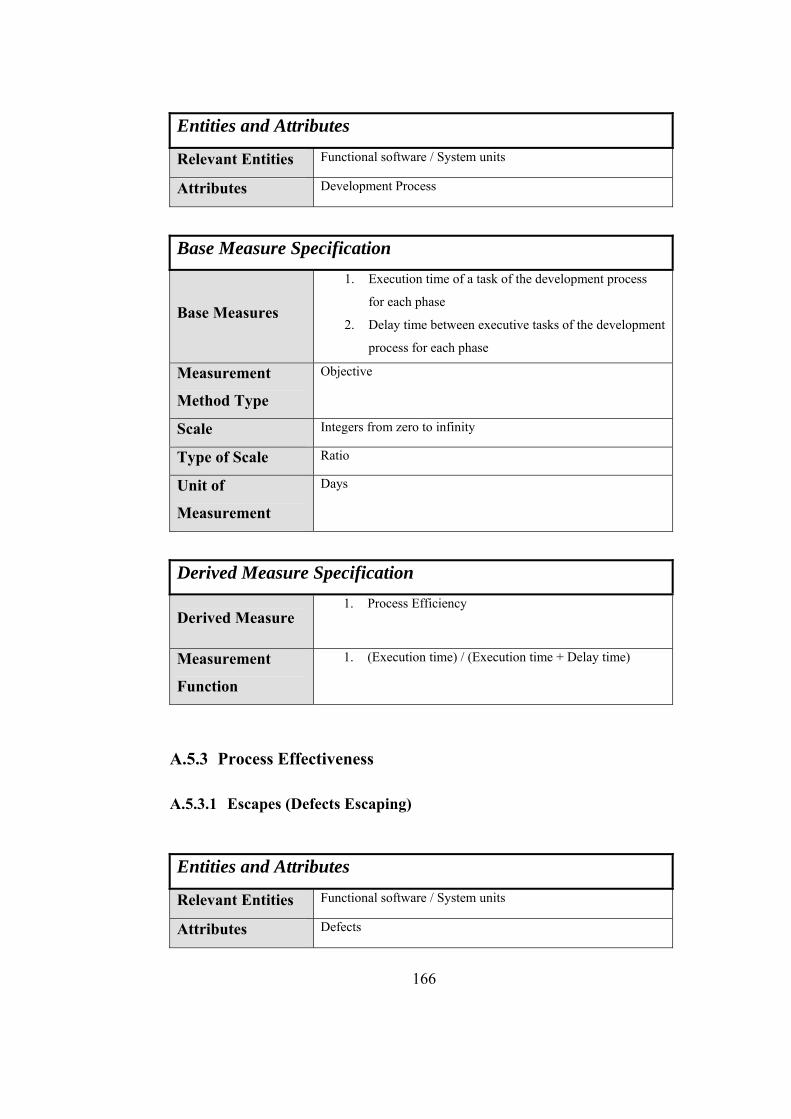
Entities and Attributes Functional software / System units Relevant Entities Development Process Attributes
Base Measure Specification
Base Measures
1. Execution time of a task of the development process
for each phase
2. Delay time between executive tasks of the development
process for each phase
Measurement
Method Type
Objective
Scale Integers from zero to infinity
Type of Scale Ratio
Unit of
Measurement
Days
Derived Measure Specification
1. Process Efficiency Derived Measure
1. (Execution time) / (Execution time + Delay time) Measurement
Function
A.5.3 Process Effectiveness
A.5.3.1 Escapes (Defects Escaping)
Entities and Attributes Functional software / System units Relevant Entities Defects Attributes
166
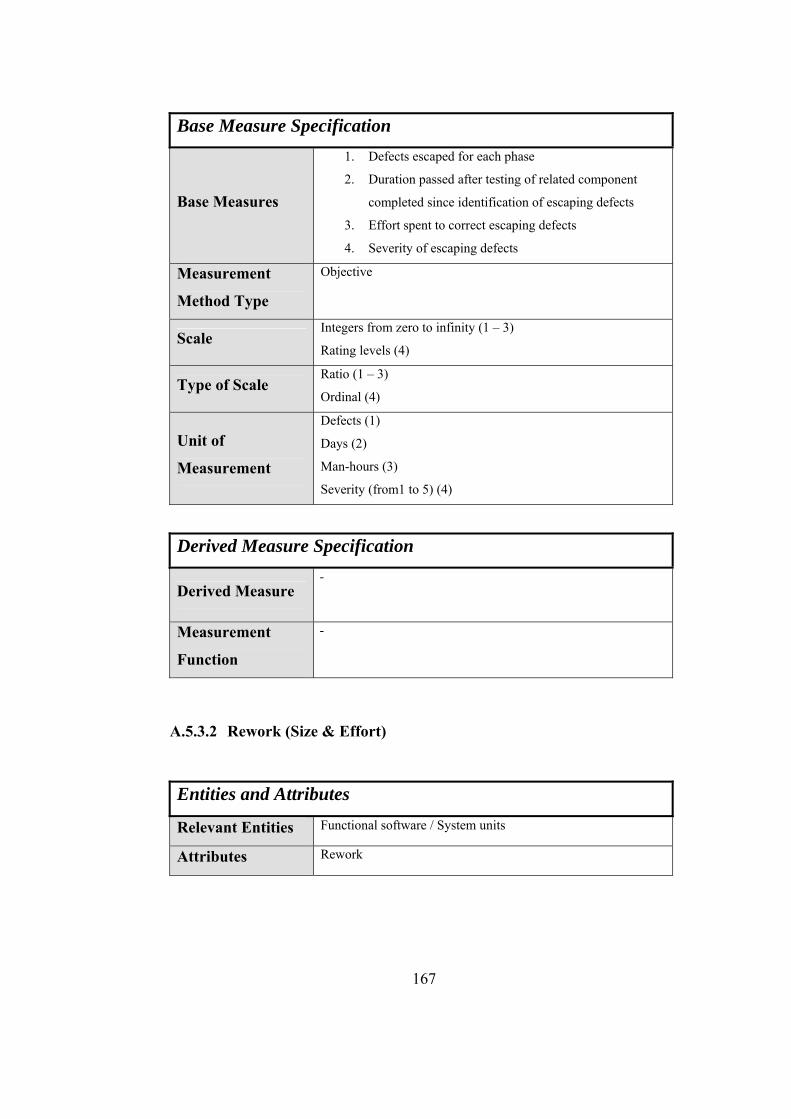
Base Measure Specification
Base Measures
1. Defects escaped for each phase
2. Duration passed after testing of related component
completed since identification of escaping defects
3. Effort spent to correct escaping defects
4. Severity of escaping defects
Measurement
Method Type
Objective
Scale Integers from zero to infinity (1 – 3)
Rating levels (4)
Type of Scale Ratio (1 – 3)
Ordinal (4)
Unit of
Measurement
Defects (1)
Days (2)
Man-hours (3)
Severity (from1 to 5) (4)
Derived Measure Specification
- Derived Measure
Measurement
Function
-
A.5.3.2 Rework (Size & Effort)
Entities and Attributes Functional software / System units Relevant Entities Rework Attributes
167
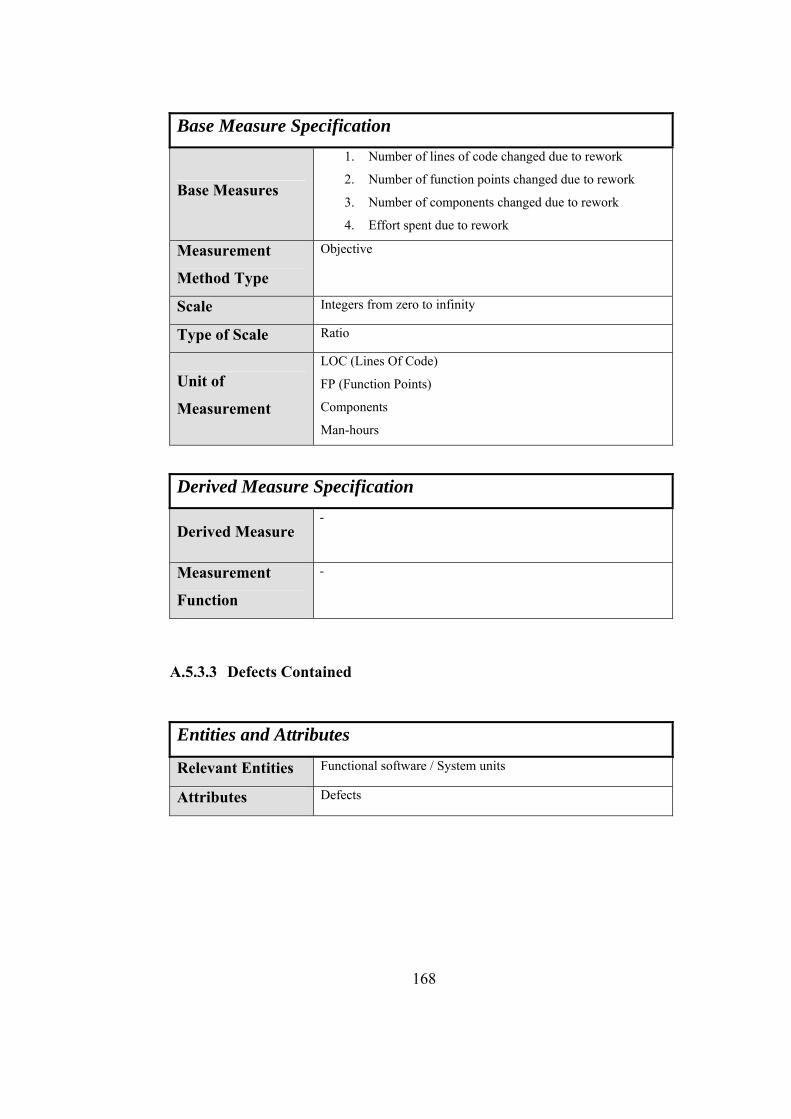
Base Measure Specification
Base Measures
1. Number of lines of code changed due to rework
2. Number of function points changed due to rework
3. Number of components changed due to rework
4. Effort spent due to rework
Measurement
Method Type
Objective
Scale Integers from zero to infinity
Type of Scale Ratio
Unit of
Measurement
LOC (Lines Of Code)
FP (Function Points)
Components
Man-hours
Derived Measure Specification
- Derived Measure
Measurement
Function
-
A.5.3.3 Defects Contained
Entities and Attributes Functional software / System units Relevant Entities Defects Attributes
168
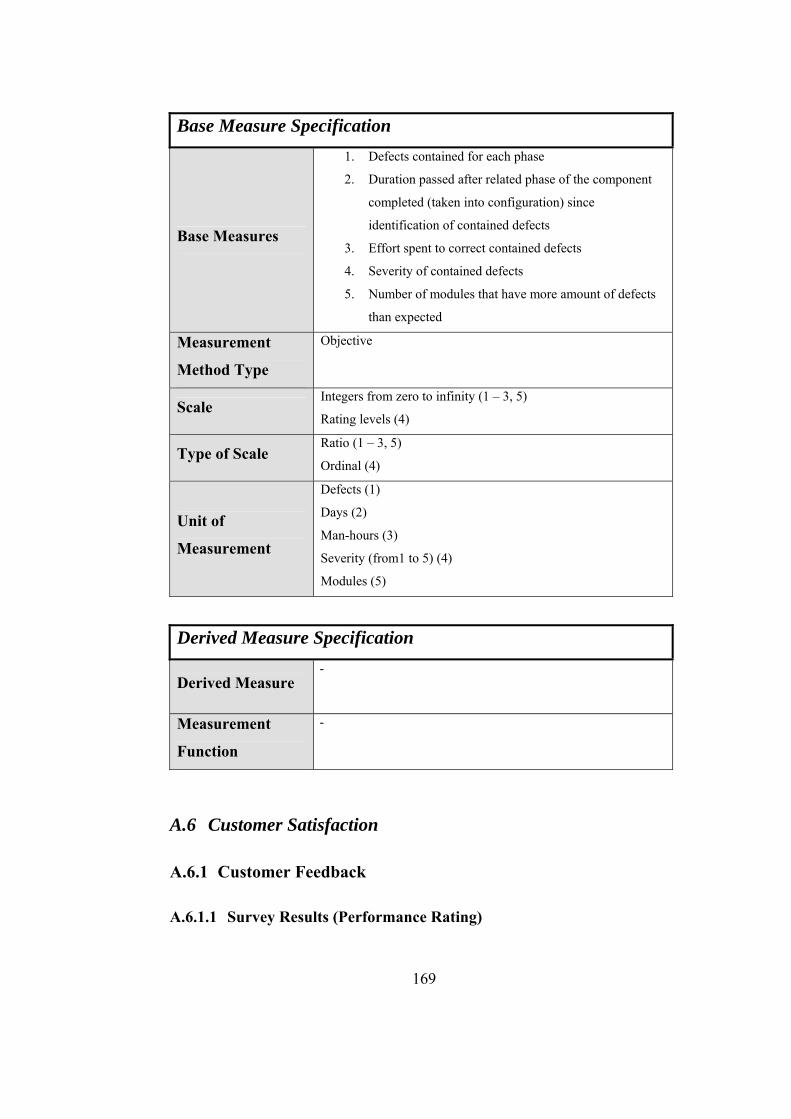
Base Measure Specification
Base Measures
1. Defects contained for each phase
2. Duration passed after related phase of the component
completed (taken into configuration) since
identification of contained defects
3. Effort spent to correct contained defects
4. Severity of contained defects
5. Number of modules that have more amount of defects
than expected
Measurement
Method Type
Objective
Scale Integers from zero to infinity (1 – 3, 5)
Rating levels (4)
Type of Scale Ratio (1 – 3, 5)
Ordinal (4)
Unit of
Measurement
Defects (1)
Days (2)
Man-hours (3)
Severity (from1 to 5) (4)
Modules (5)
Derived Measure Specification
- Derived Measure
Measurement
Function
-
A.6 Customer Satisfaction
A.6.1 Customer Feedback
A.6.1.1 Survey Results (Performance Rating)
169
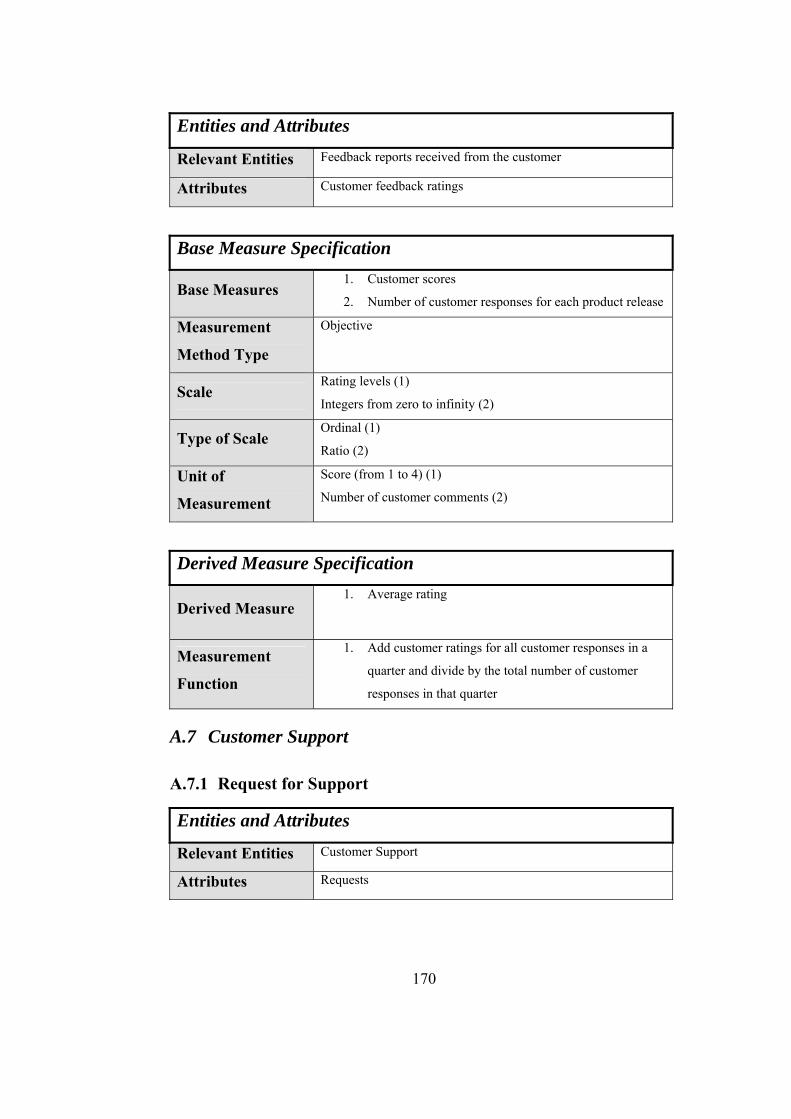
Entities and Attributes Feedback reports received from the customer Relevant Entities Customer feedback ratings Attributes
Base Measure Specification
Base Measures 1. Customer scores
2. Number of customer responses for each product release
Measurement
Method Type
Objective
Scale Rating levels (1)
Integers from zero to infinity (2)
Type of Scale Ordinal (1)
Ratio (2)
Unit of
Measurement
Score (from 1 to 4) (1)
Number of customer comments (2)
Derived Measure Specification
1. Average rating Derived Measure
1. Add customer ratings for all customer responses in a
quarter and divide by the total number of customer
responses in that quarter
Measurement
Function
A.7 Customer Support
A.7.1 Request for Support
Entities and Attributes
Relevant Entities Customer Support
Attributes Requests
170
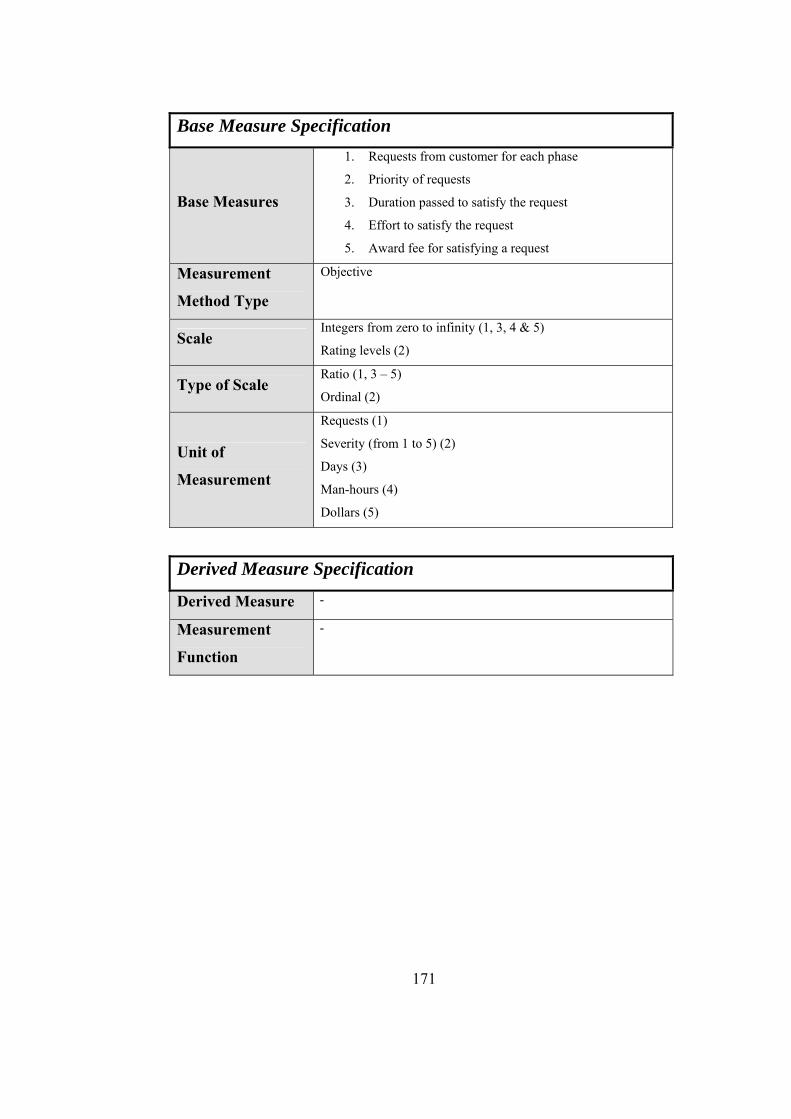
Base Measure Specification
Base Measures
1. Requests from customer for each phase
2. Priority of requests
3. Duration passed to satisfy the request
4. Effort to satisfy the request
5. Award fee for satisfying a request
Measurement
Method Type
Objective
Scale Integers from zero to infinity (1, 3, 4 & 5)
Rating levels (2)
Type of Scale Ratio (1, 3 – 5)
Ordinal (2)
Unit of
Measurement
Requests (1)
Severity (from 1 to 5) (2)
Days (3)
Man-hours (4)
Dollars (5)
Derived Measure Specification
Derived Measure -
Measurement
Function
-
171
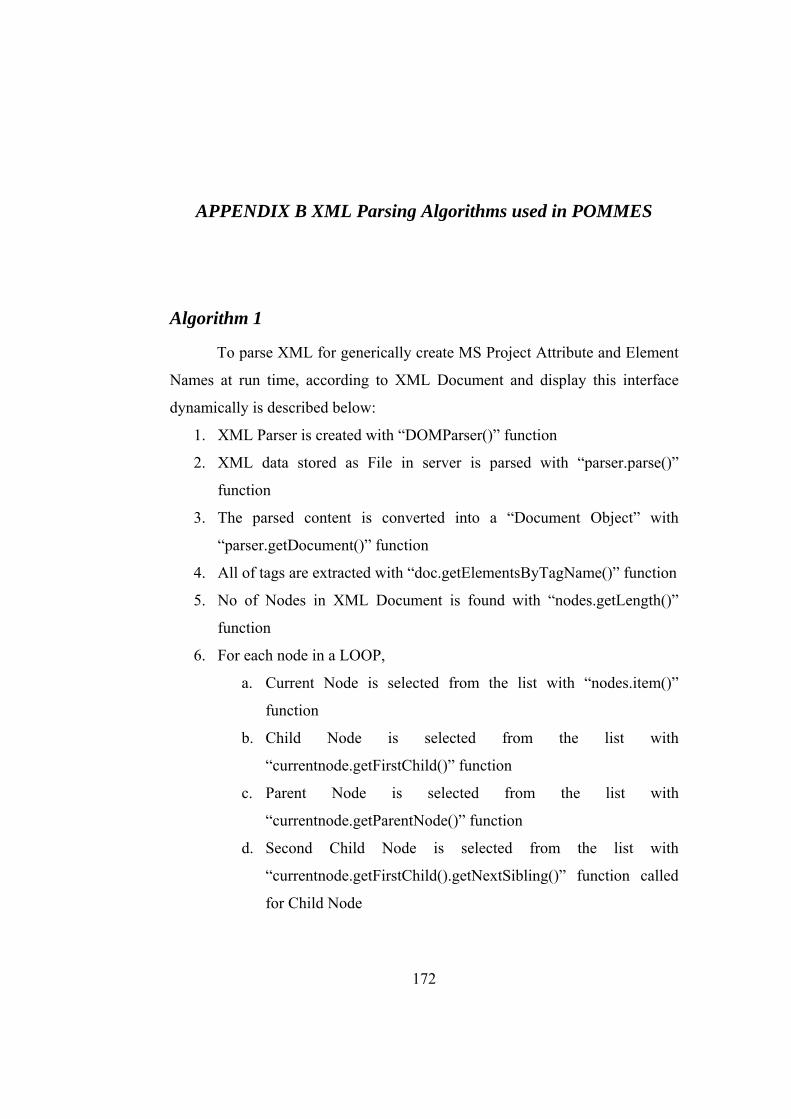
172
APPENDIX B XML Parsing Algorithms used in POMMES
Algorithm 1
To parse XML for generically create MS Project Attribute and Element
Names at run time, according to XML Document and display this interface
dynamically is described below:
1. XML Parser is created with “DOMParser()” function
2. XML data stored as File in server is parsed with “parser.parse()”
function
3. The parsed content is converted into a “Document Object” with
“parser.getDocument()” function
4. All of tags are extracted with “doc.getElementsByTagName()” function
5. No of Nodes in XML Document is found with “nodes.getLength()”
function
6. For each node in a LOOP,
a. Current Node is selected from the list with “nodes.item()”
function
b. Child Node is selected from the list with
“currentnode.getFirstChild()” function
c. Parent Node is selected from the list with
“currentnode.getParentNode()” function
d. Second Child Node is selected from the list with
“currentnode.getFirstChild().getNextSibling()” function called
for Child Node
173
e. The Tag Name is extracted from the element with
“currentnode.getNodeName()” function
f. Child Node Type is extracted for the Child Node with
“childnode.getNodeType()” function
g. Parent Node Type is extracted for the Parent Node with
“parentnode.getNodeType()” function
h. Second Child Node Type is extracted for the Second Child
Node with “secondchildnode.getNodeType()” function
i. IF child_node_type = Node.TEXT_NODE AND
parent_node_type = Node.ELEMENT_NODE
“Tag Value” is extracted with
“childnode.getNodeValue()” function
i. IF ( (sec_child_node_type == Node.ELEMENT_NODE)
AND (flag1 != 1) )
flag1 is set to 1
ii. ELSE IF ( (sec_child_node_type ==
Node.ELEMENT_NODE) AND (flag1 == 1) )
flag1 is set to 2
i. IF Child Level is not “0”
Child Level is increased
ii. ELSE
Child Level is set to the value of “rootlevel”
i. IF ((flag == 1) || (flag == 2))
Array is extended
“name_oftag” is set to “tagname”
“level_oftag” is set to “childlevel”
“parent_oftag” is set with “parentnode.getNodeName()”
arrayindex is increased
174
j. ELSE IF ((child_node_type == Node.ELEMENT_NODE) AND
(parent_node_type == Node.ELEMENT_NODE))
i. IF ( (sec_child_node_type == Node.ELEMENT_NODE)
AND (flag2 != 1) )
Flag is set to 1
Tag Index is set to 0
“tagname_root” is set with
“childnode.getNodeName()” function
For all records in Array LOOP,
I. IF ( xpathArray[loopindex3].NAME_OFTAG ==
childnode.getNodeName() )
Flag is set to 2
End LOOP
a) IF flag = 0
Do nothing
b) ELSE
“rootlevel” is increased
“childlevel” is set to
“rootlevel”
Flag is set to 1
Flag2 is set to 1
II. IF ( (tagname == tagname_root) AND (tagindex
== 0) )
Flag is set to 1
“tagindex” is increased
“tagname_root” is set to “tagname”
175
“child_tagindex” is set to “0”
a. IF (tagindex == 1)
For all records in Array LOOP,
I. IF ( xpathArray[loopindex].NAME_OFTAG ==
tagname )
Flag is set to 2
End LOOP
a) IF flag = 0
“tagindex” is set to “0”
b) ELSE IF (flag == 1)
Array is extended
“name_oftag” is set to “tagname”
“level_oftag” is set to “rootlevel”
a) IF ( (
parentnode.getNodeName(
).substring(1,
parentnode.getNodeName(
).length() - 1)
).equalsIgnoreCase(tagna
me) == true )
“parent_oftag” is set with
“parentnode.getParentNode().getNodeName()”
b) ELSE
“parent_oftag” is set with
“parentnode.getNodeName()”
arrayindex is increased
Flag is set to 1
“tagindex” is set to “0”
176
b. ELSE
Flag is set to “0”
III. ELSE
Flag is set to 1
a. IF (tagindex == 1)
For all records in Array LOOP,
I. IF ( xpathArray[loopindex].NAME_OFTAG ==
tagname )
Flag is set to 2
End LOOP
c) IF flag = 0
“tagindex” is set to “0”
d) ELSE IF (flag == 1)
Array is extended
“rootlevel” is increased
“childlevel” is set to “rootlevel”
“name_oftag” is set to “tagname”
“level_oftag” is set to “rootlevel”
a) IF ( (
parentnode.getParentNode
().getNodeName().substrin
g(0,
parentnode.getParentNode
().getNodeName().length()
- 1)
).equalsIgnoreCase(parent
node.getNodeName()) ==
true )
“parent_oftag” is set with “parentnode.getNodeName()”
177
b) ELSE IF ( (
parentnode.getNodeName(
).substring(0,
parentnode.getNodeName(
).length() - 1)
).equalsIgnoreCase(tagna
me) == true )
“parent_oftag” is set with
“parentnode.getNodeName()”
c) ELSE
“parent_oftag” is set with
“parentnode.getNodeName()”
arrayindex is increased
Flag is set to 1
“tagindex” is set to “0”
b. ELSE
Flag is set to “0”
k. ELSE IF ( (sec_child_node_type == Node.ELEMENT_NODE )
AND (flag2 == 1) )
Flag is set to 1
Tag Index is set to 0
“tagname_root” is set with
“childnode.getNodeName()” function
For all records in Array LOOP,
I. IF ( xpathArray[loopindex3].NAME_OFTAG ==
childnode.getNodeName() )
Flag is set to 2
End LOOP
178
c) IF flag = 0
Do nothing
d) ELSE
“rootlevel” is increased
“childlevel” is set to
“rootlevel”
Flag is set to 1
Flag2 is set to 2
II. IF ( (tagname == tagname_root) AND (tagindex
== 0) )
Flag is set to 1
“tagindex” is increased
“tagname_root” is set to “tagname”
“child_tagindex” is set to “0”
a. IF (tagindex == 1)
For all records in Array LOOP,
I. IF ( xpathArray[loopindex].NAME_OFTAG ==
tagname )
Flag is set to 2
End LOOP
e) IF flag = 0
“tagindex” is set to “0”
f) ELSE IF (flag == 1)
Array is extended
“name_oftag” is set to “tagname”
“level_oftag” is set to “rootlevel”
179
a) IF ( (
parentnode.getNodeName(
).substring(1,
parentnode.getNodeName(
).length() - 1)
).equalsIgnoreCase(tagna
me) == true )
“parent_oftag” is set with
“parentnode.getParentNode().getNodeName()”
b) ELSE
“parent_oftag” is set with
“parentnode.getNodeName()”
arrayindex is increased
Flag is set to 1
“tagindex” is set to “0”
b. ELSE
Flag is set to “0”
III. ELSE
Flag is set to 1
a. IF (tagindex == 1)
For all records in Array LOOP,
I. IF ( xpathArray[loopindex].NAME_OFTAG ==
tagname )
Flag is set to 2
End LOOP
g) IF flag = 0
“tagindex” is set to “0”
h) ELSE IF (flag == 1)
180
Array is extended
“rootlevel” is increased
“childlevel” is set to “rootlevel”
“name_oftag” is set to “tagname”
“level_oftag” is set to “rootlevel”
a) IF ( (
parentnode.getParentNode
().getNodeName().substrin
g(0,
parentnode.getParentNode
().getNodeName().length()
- 1)
).equalsIgnoreCase(parent
node.getNodeName()) ==
true )
“parent_oftag” is set with “parentnode.getNodeName()”
b) ELSE IF ( (
parentnode.getNodeName(
).substring(0,
parentnode.getNodeName(
).length() - 1)
).equalsIgnoreCase(tagna
me) == true )
“parent_oftag” is set with
“parentnode.getNodeName()”
c) ELSE
“parent_oftag” is set with
“parentnode.getNodeName()”
arrayindex is increased
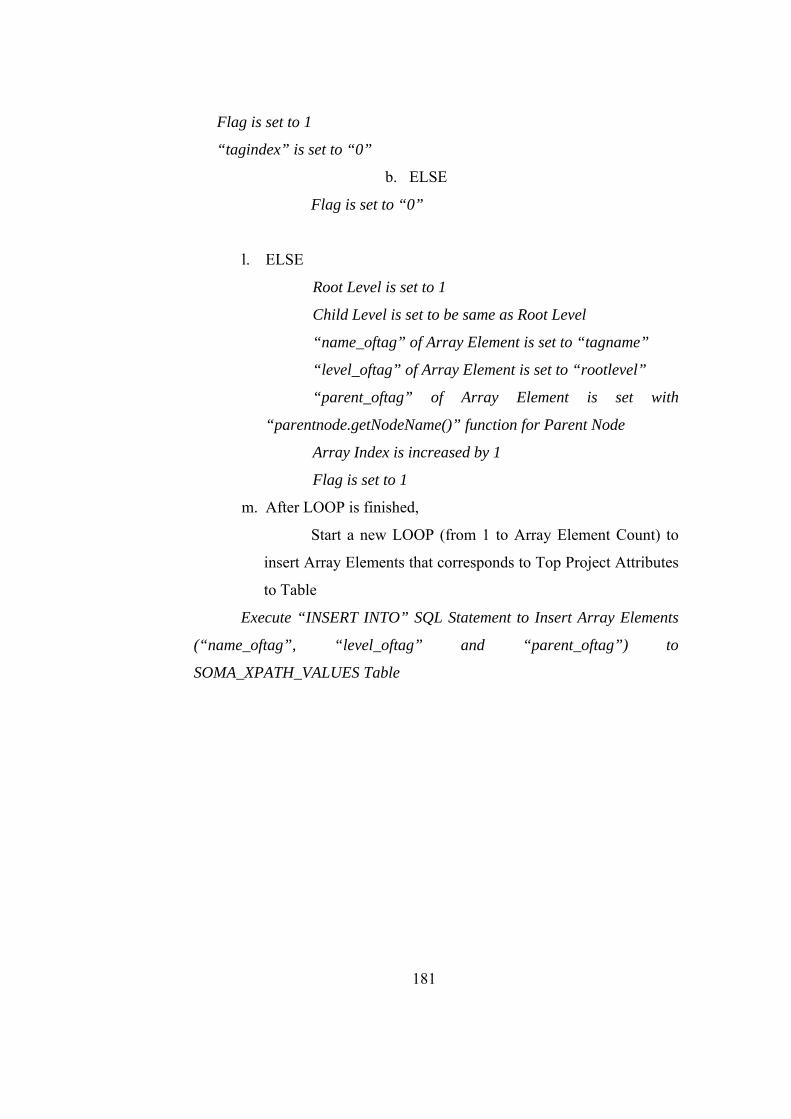
181
Flag is set to 1
“tagindex” is set to “0”
b. ELSE
Flag is set to “0”
l. ELSE
Root Level is set to 1
Child Level is set to be same as Root Level
“name_oftag” of Array Element is set to “tagname”
“level_oftag” of Array Element is set to “rootlevel”
“parent_oftag” of Array Element is set with
“parentnode.getNodeName()” function for Parent Node
Array Index is increased by 1
Flag is set to 1
m. After LOOP is finished,
Start a new LOOP (from 1 to Array Element Count) to
insert Array Elements that corresponds to Top Project Attributes
to Table
Execute “INSERT INTO” SQL Statement to Insert Array Elements
(“name_oftag”, “level_oftag” and “parent_oftag”) to
SOMA_XPATH_VALUES Table
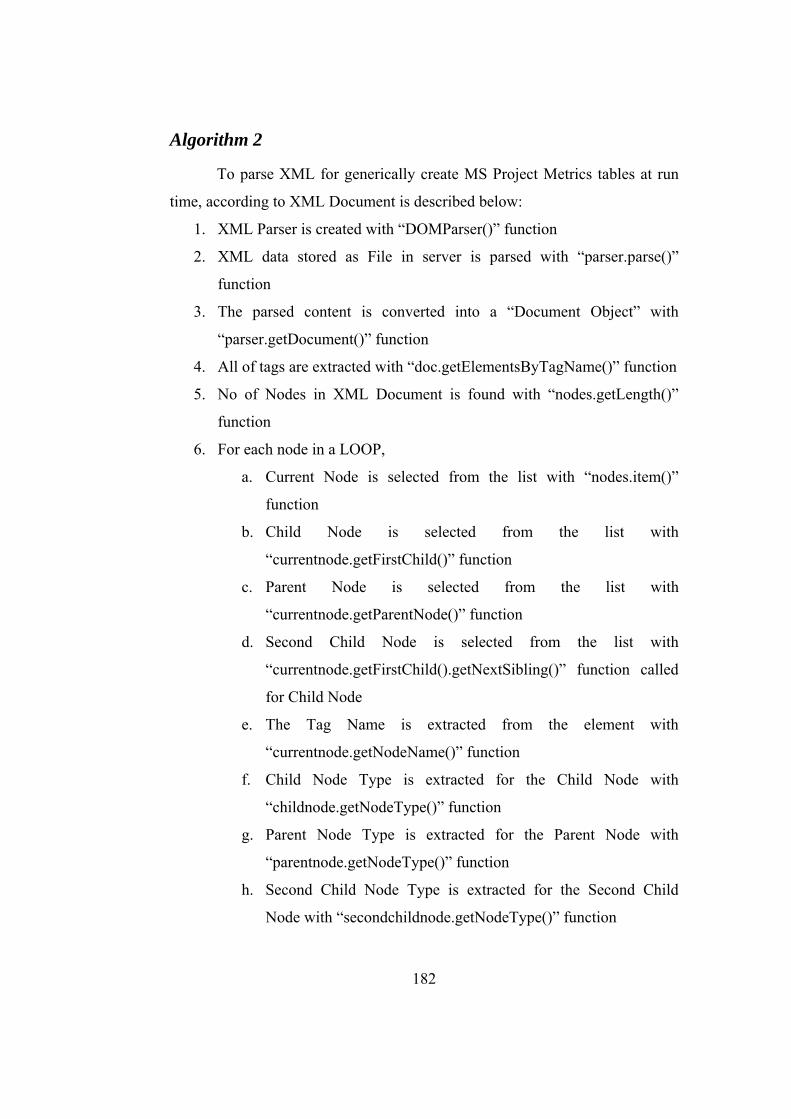
182
Algorithm 2
To parse XML for generically create MS Project Metrics tables at run
time, according to XML Document is described below:
1. XML Parser is created with “DOMParser()” function
2. XML data stored as File in server is parsed with “parser.parse()”
function
3. The parsed content is converted into a “Document Object” with
“parser.getDocument()” function
4. All of tags are extracted with “doc.getElementsByTagName()” function
5. No of Nodes in XML Document is found with “nodes.getLength()”
function
6. For each node in a LOOP,
a. Current Node is selected from the list with “nodes.item()”
function
b. Child Node is selected from the list with
“currentnode.getFirstChild()” function
c. Parent Node is selected from the list with
“currentnode.getParentNode()” function
d. Second Child Node is selected from the list with
“currentnode.getFirstChild().getNextSibling()” function called
for Child Node
e. The Tag Name is extracted from the element with
“currentnode.getNodeName()” function
f. Child Node Type is extracted for the Child Node with
“childnode.getNodeType()” function
g. Parent Node Type is extracted for the Parent Node with
“parentnode.getNodeType()” function
h. Second Child Node Type is extracted for the Second Child
Node with “secondchildnode.getNodeType()” function
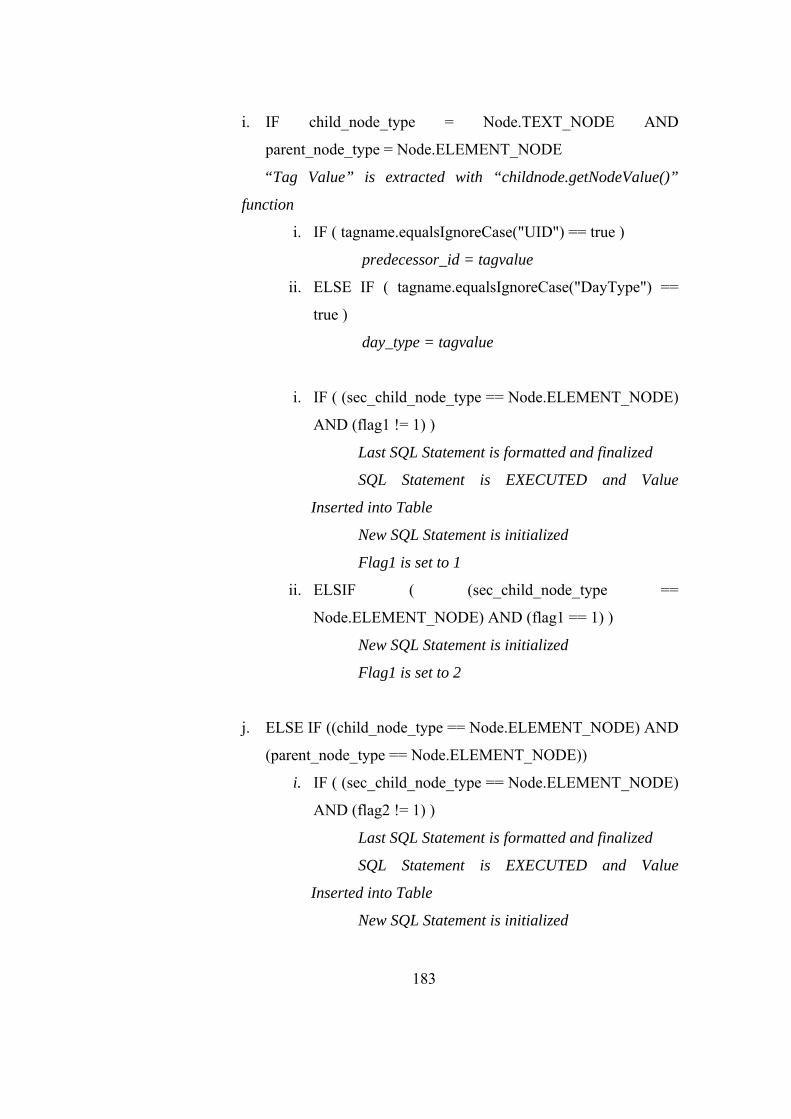
183
i. IF child_node_type = Node.TEXT_NODE AND
parent_node_type = Node.ELEMENT_NODE
“Tag Value” is extracted with “childnode.getNodeValue()”
function
i. IF ( tagname.equalsIgnoreCase("UID") == true )
predecessor_id = tagvalue
ii. ELSE IF ( tagname.equalsIgnoreCase("DayType") ==
true )
day_type = tagvalue
i. IF ( (sec_child_node_type == Node.ELEMENT_NODE)
AND (flag1 != 1) )
Last SQL Statement is formatted and finalized
SQL Statement is EXECUTED and Value
Inserted into Table
New SQL Statement is initialized
Flag1 is set to 1
ii. ELSIF ( (sec_child_node_type ==
Node.ELEMENT_NODE) AND (flag1 == 1) )
New SQL Statement is initialized
Flag1 is set to 2
j. ELSE IF ((child_node_type == Node.ELEMENT_NODE) AND
(parent_node_type == Node.ELEMENT_NODE))
i. IF ( (sec_child_node_type == Node.ELEMENT_NODE)
AND (flag2 != 1) )
Last SQL Statement is formatted and finalized
SQL Statement is EXECUTED and Value
Inserted into Table
New SQL Statement is initialized
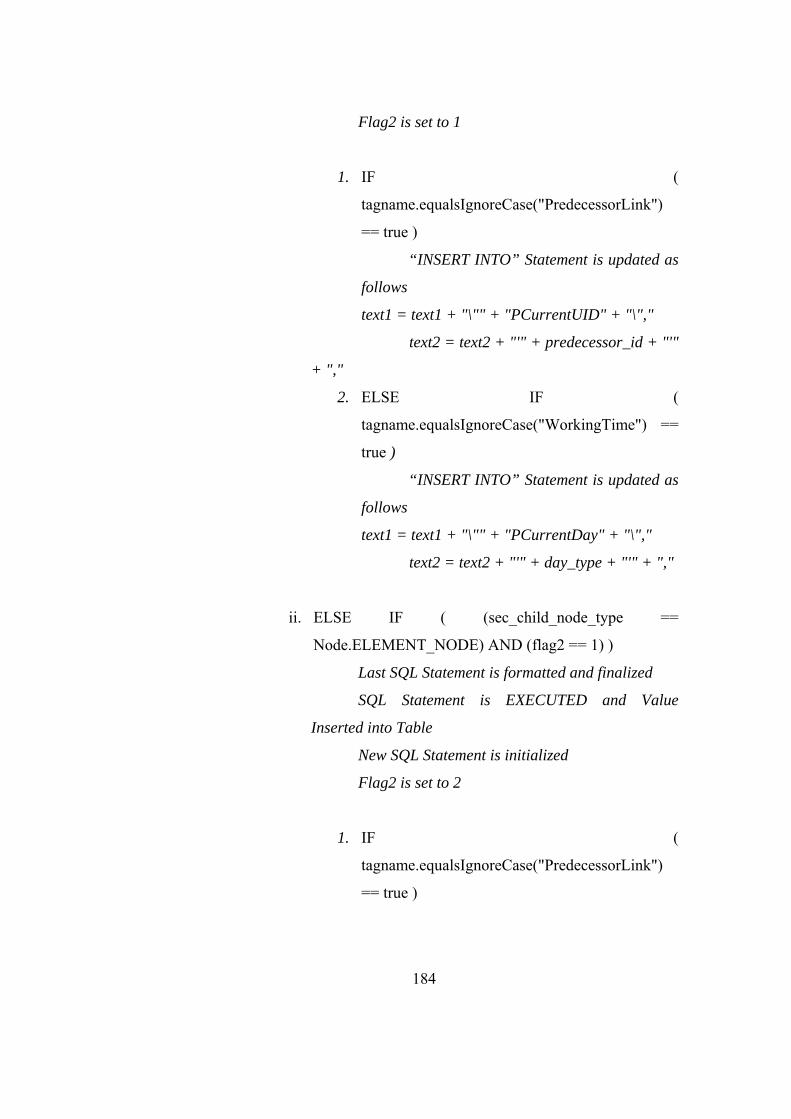
184
Flag2 is set to 1
1. IF (
tagname.equalsIgnoreCase("PredecessorLink")
== true )
“INSERT INTO” Statement is updated as
follows
text1 = text1 + "\"" + "PCurrentUID" + "\","
text2 = text2 + "'" + predecessor_id + "'"
+ ","
2. ELSE IF (
tagname.equalsIgnoreCase("WorkingTime") ==
true )
“INSERT INTO” Statement is updated as
follows
text1 = text1 + "\"" + "PCurrentDay" + "\","
text2 = text2 + "'" + day_type + "'" + ","
ii. ELSE IF ( (sec_child_node_type ==
Node.ELEMENT_NODE) AND (flag2 == 1) )
Last SQL Statement is formatted and finalized
SQL Statement is EXECUTED and Value
Inserted into Table
New SQL Statement is initialized
Flag2 is set to 2
1. IF (
tagname.equalsIgnoreCase("PredecessorLink")
== true )
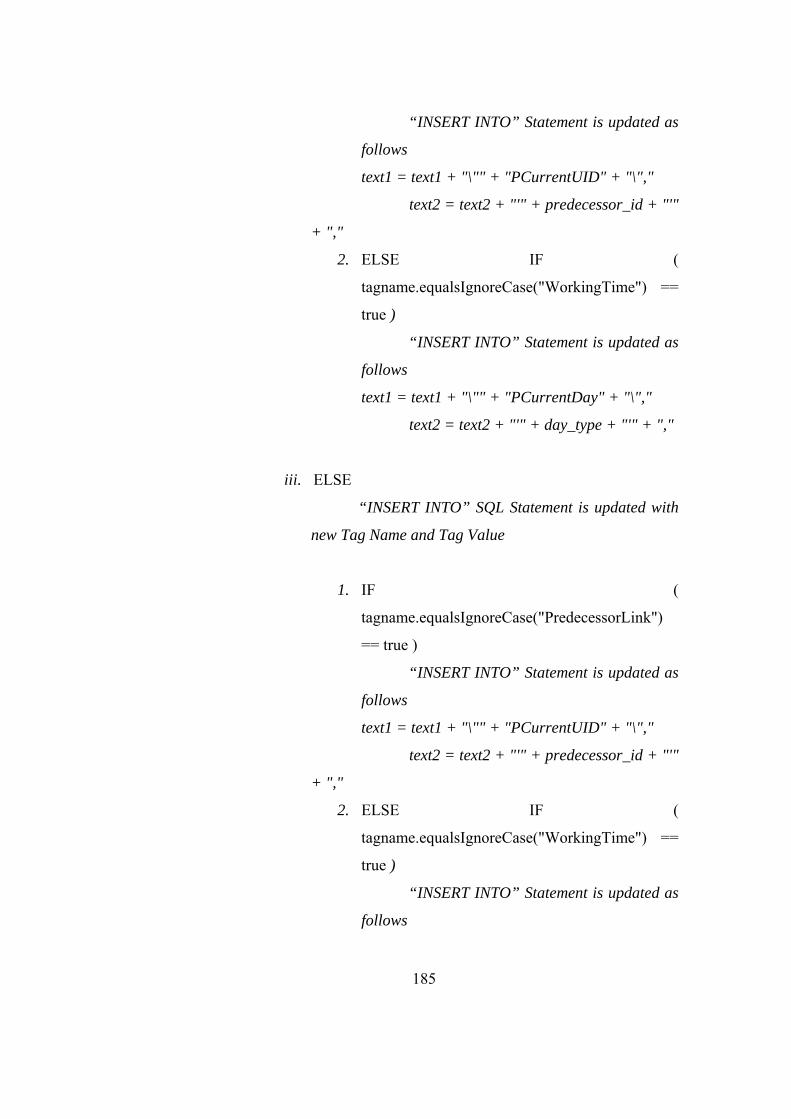
185
“INSERT INTO” Statement is updated as
follows
text1 = text1 + "\"" + "PCurrentUID" + "\","
text2 = text2 + "'" + predecessor_id + "'"
+ ","
2. ELSE IF (
tagname.equalsIgnoreCase("WorkingTime") ==
true )
“INSERT INTO” Statement is updated as
follows
text1 = text1 + "\"" + "PCurrentDay" + "\","
text2 = text2 + "'" + day_type + "'" + ","
iii. ELSE
“INSERT INTO” SQL Statement is updated with
new Tag Name and Tag Value
1. IF (
tagname.equalsIgnoreCase("PredecessorLink")
== true )
“INSERT INTO” Statement is updated as
follows
text1 = text1 + "\"" + "PCurrentUID" + "\","
text2 = text2 + "'" + predecessor_id + "'"
+ ","
2. ELSE IF (
tagname.equalsIgnoreCase("WorkingTime") ==
true )
“INSERT INTO” Statement is updated as
follows

186
text1 = text1 + "\"" + "PCurrentDay" + "\","
text2 = text2 + "'" + day_type + "'" + ","
n. After LOOP is finished,
Last SQL Statement is formatted and finalized
SQL Statement is EXECUTED and Value Inserted into
Table
187
Algorithm 3
To retrieve related project tables metrics data (including updates), join
the data into a document context, make necessary format conversions, tag
naming and generate an XML Document in the format same as the one
imported from MS Project, is described below:
1. XML Tag Names are retrieved from <ProjectName>_NAMES table
2. Generating a single but complex SQL Statement (with multiple cursors
included) is written to cover each Project Attribute Table (for example,
Task, Resource, Attribute etc.) and retrieve the Elements in this table
with the Child Elements (retrieved by using the Foreign Key relations
between tables) and sending it to the “dbms_xmlgen.newcontext”
function as a string parameter, “dbms_xmlgen.ctxhandle” TYPE
handler is formed.
3. “dbms_xmlgen.setrowsettag” and “dbms_xmlgen.setrowtag” functions
are use to set Root Tag Names, and then “dbms_xmlgen.getxml”
function is called to convert “dbms_xmlgen.ctxhandle” TYPE handler
into CLOB type to make formatting.
4. All formatting has been made on CLOB Type variable by using
multiple string functions. An important note is that MS Project XML
Document is case sensitive and this takes the most of formatting
process. Besides this activity, also changing from ORACLE Table
format to XML Document format needs some action.
5. Formed CLOB variable holds all XML Data in a correct format, but it
couldn’t be selected directly because of Memory Requirements. It
should be sent in 32KB packets through network interface. Also
constant 32KB is not applicable, since you can cut some line at 32KB,
and new line comes with New Line character that causes all XML
Document formed is useless for MS Project and is not a valid
document. So, Tag Closure (/>) character based search is made, and

188
after a tag close around 30KB file package is sent, length of file is
calculated and next line starts with a Tag Open (>) character on a new
line that causes no problem at this time. Result is the correct XML
Document ready to be used by MS Project Tool. Note that UTL_FILE
procedure functions are used to form the related XML file (FOPEN,
PUT_LINE, FCLOSE).
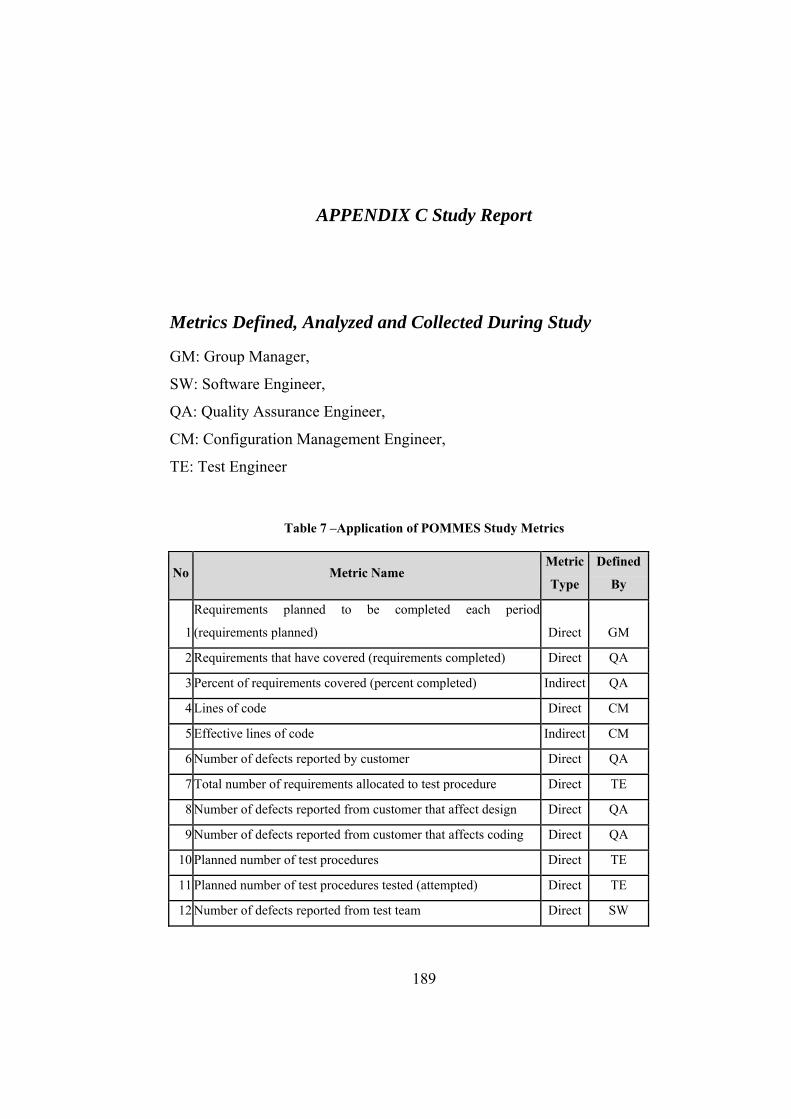
189
APPENDIX C Study Report
Metrics Defined, Analyzed and Collected During Study
GM: Group Manager,
SW: Software Engineer,
QA: Quality Assurance Engineer,
CM: Configuration Management Engineer,
TE: Test Engineer
Table 7 –Application of POMMES Study Metrics
No Metric Name Metric
Type
Defined
By
1
Requirements planned to be completed each period
(requirements planned) Direct GM
2 Requirements that have covered (requirements completed) Direct QA
3 Percent of requirements covered (percent completed) Indirect QA
4 Lines of code Direct CM
5 Effective lines of code Indirect CM
6 Number of defects reported by customer Direct QA
7 Total number of requirements allocated to test procedure Direct TE
8 Number of defects reported from customer that affect design Direct QA
9 Number of defects reported from customer that affects coding Direct QA
10 Planned number of test procedures Direct TE
11 Planned number of test procedures tested (attempted) Direct TE
12 Number of defects reported from test team Direct SW
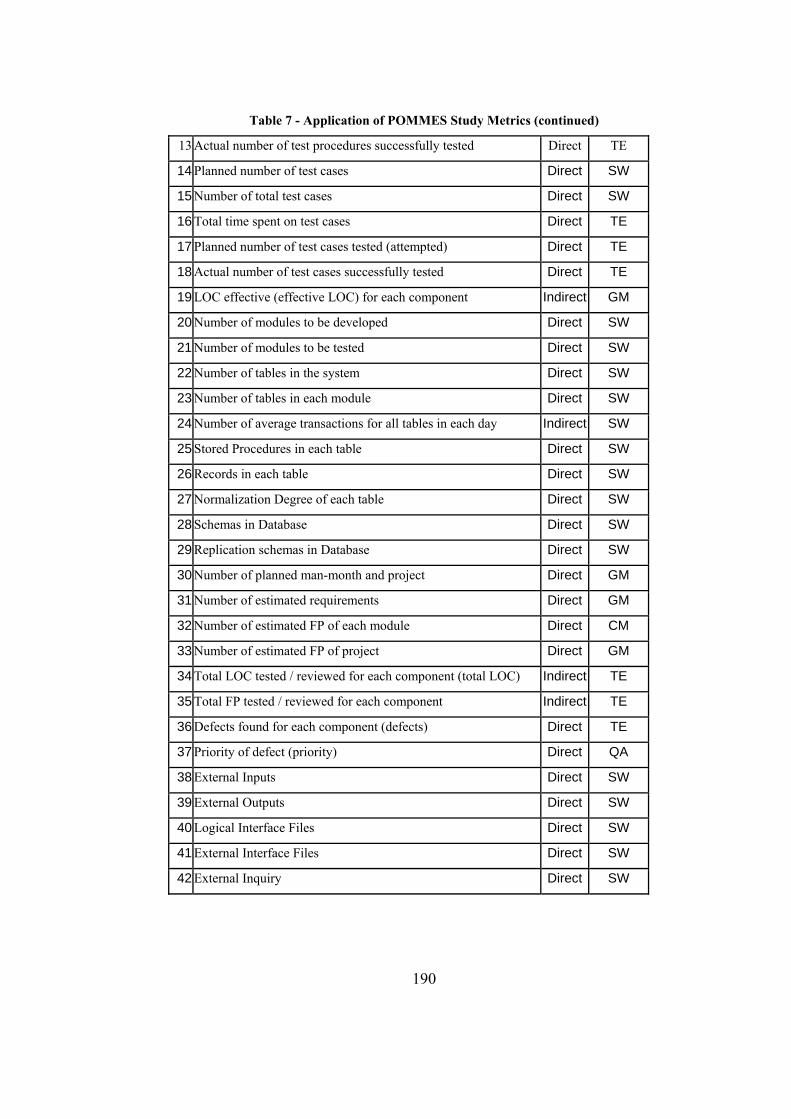
190
Table 7 - Application of POMMES Study Metrics (continued) 13 Actual number of test procedures successfully tested Direct TE
14 Planned number of test cases Direct SW
15 Number of total test cases Direct SW
16 Total time spent on test cases Direct TE
17 Planned number of test cases tested (attempted) Direct TE
18 Actual number of test cases successfully tested Direct TE
19 LOC effective (effective LOC) for each component Indirect GM
20 Number of modules to be developed Direct SW
21 Number of modules to be tested Direct SW
22 Number of tables in the system Direct SW
23 Number of tables in each module Direct SW
24 Number of average transactions for all tables in each day Indirect SW
25 Stored Procedures in each table Direct SW
26 Records in each table Direct SW
27 Normalization Degree of each table Direct SW
28 Schemas in Database Direct SW
29 Replication schemas in Database Direct SW
30 Number of planned man-month and project Direct GM
31 Number of estimated requirements Direct GM
32 Number of estimated FP of each module Direct CM
33 Number of estimated FP of project Direct GM
34 Total LOC tested / reviewed for each component (total LOC) Indirect TE
35 Total FP tested / reviewed for each component Indirect TE
36 Defects found for each component (defects) Direct TE
37 Priority of defect (priority) Direct QA
38 External Inputs Direct SW
39 External Outputs Direct SW
40 Logical Interface Files Direct SW
41 External Interface Files Direct SW
42 External Inquiry Direct SW
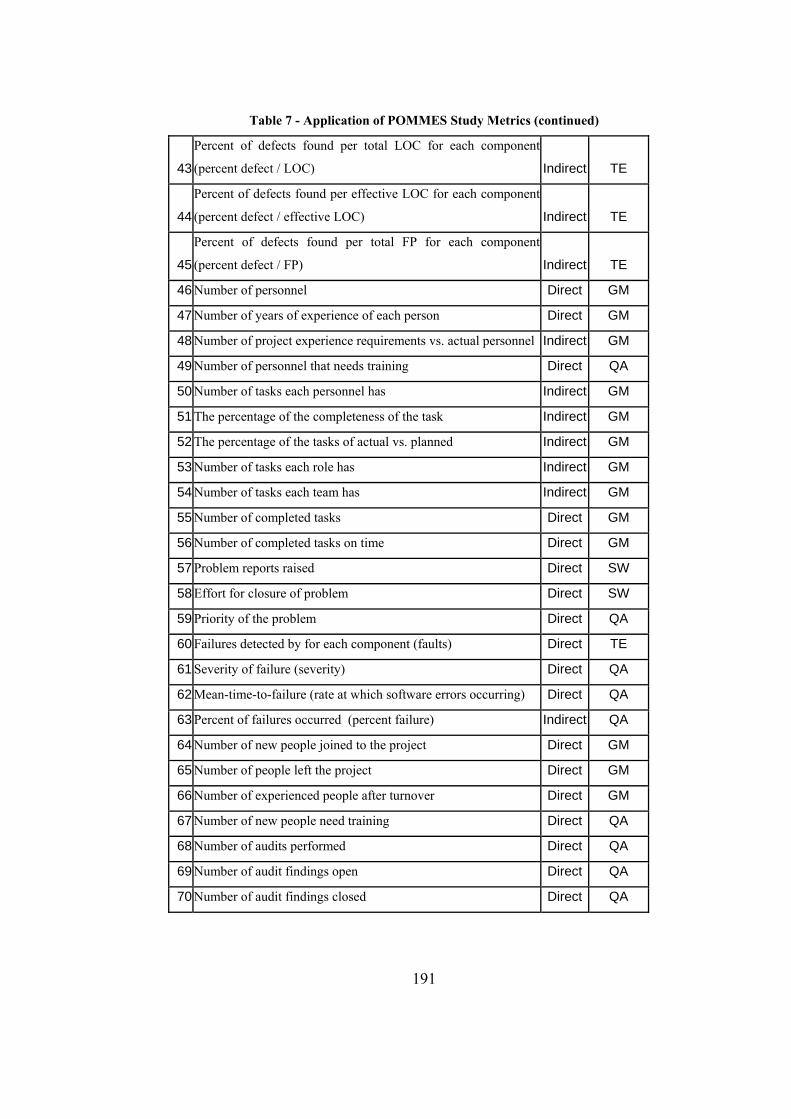
191
Table 7 - Application of POMMES Study Metrics (continued)
43
Percent of defects found per total LOC for each component
(percent defect / LOC) Indirect TE
44
Percent of defects found per effective LOC for each component
(percent defect / effective LOC) Indirect TE
45
Percent of defects found per total FP for each component
(percent defect / FP) Indirect TE
46 Number of personnel Direct GM
47 Number of years of experience of each person Direct GM
48 Number of project experience requirements vs. actual personnel Indirect GM
49 Number of personnel that needs training Direct QA
50 Number of tasks each personnel has Indirect GM
51 The percentage of the completeness of the task Indirect GM
52 The percentage of the tasks of actual vs. planned Indirect GM
53 Number of tasks each role has Indirect GM
54 Number of tasks each team has Indirect GM
55 Number of completed tasks Direct GM
56 Number of completed tasks on time Direct GM
57 Problem reports raised Direct SW
58 Effort for closure of problem Direct SW
59 Priority of the problem Direct QA
60 Failures detected by for each component (faults) Direct TE
61 Severity of failure (severity) Direct QA
62 Mean-time-to-failure (rate at which software errors occurring) Direct QA
63 Percent of failures occurred (percent failure) Indirect QA
64 Number of new people joined to the project Direct GM
65 Number of people left the project Direct GM
66 Number of experienced people after turnover Direct GM
67 Number of new people need training Direct QA
68 Number of audits performed Direct QA
69 Number of audit findings open Direct QA
70 Number of audit findings closed Direct QA
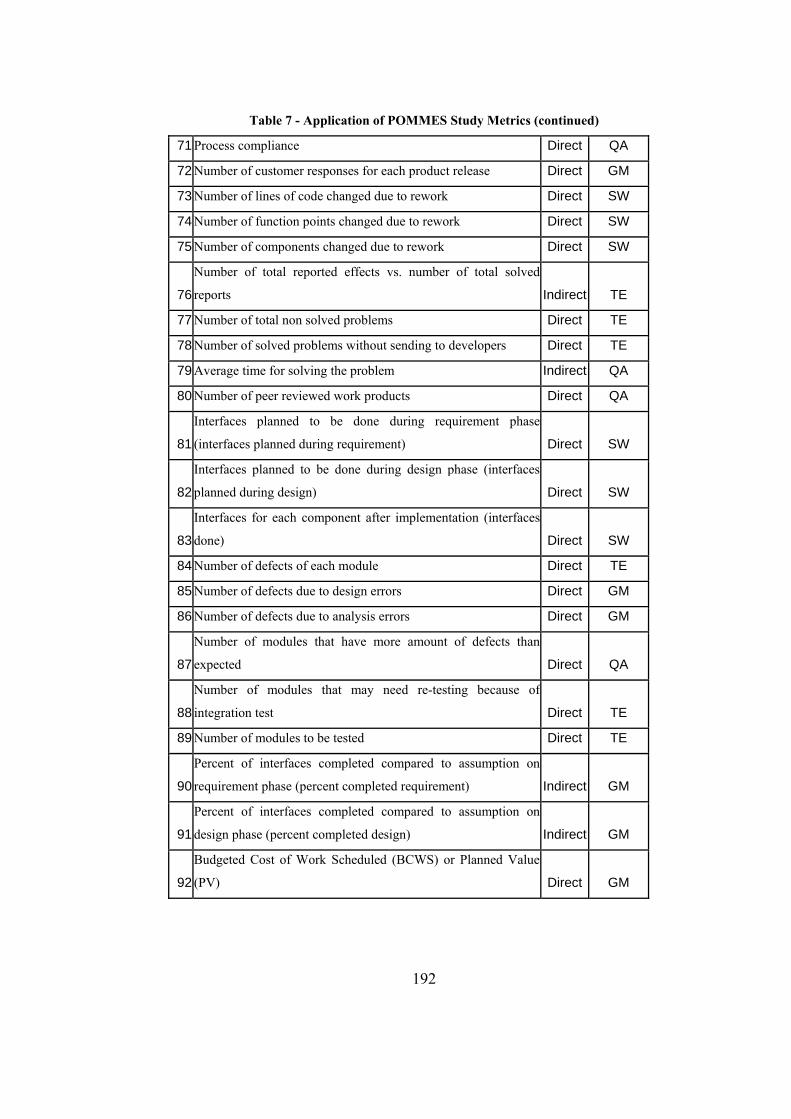
192
Table 7 - Application of POMMES Study Metrics (continued) 71 Process compliance Direct QA
72 Number of customer responses for each product release Direct GM
73 Number of lines of code changed due to rework Direct SW
74 Number of function points changed due to rework Direct SW
75 Number of components changed due to rework Direct SW
76
Number of total reported effects vs. number of total solved
reports Indirect TE
77 Number of total non solved problems Direct TE
78 Number of solved problems without sending to developers Direct TE
79 Average time for solving the problem Indirect QA
80 Number of peer reviewed work products Direct QA
81
Interfaces planned to be done during requirement phase
(interfaces planned during requirement) Direct SW
82
Interfaces planned to be done during design phase (interfaces
planned during design) Direct SW
83
Interfaces for each component after implementation (interfaces
done) Direct SW
84 Number of defects of each module Direct TE
85 Number of defects due to design errors Direct GM
86 Number of defects due to analysis errors Direct GM
87
Number of modules that have more amount of defects than
expected Direct QA
88
Number of modules that may need re-testing because of
integration test Direct TE
89 Number of modules to be tested Direct TE
90
Percent of interfaces completed compared to assumption on
requirement phase (percent completed requirement) Indirect GM
91
Percent of interfaces completed compared to assumption on
design phase (percent completed design) Indirect GM
92
Budgeted Cost of Work Scheduled (BCWS) or Planned Value
(PV) Direct GM
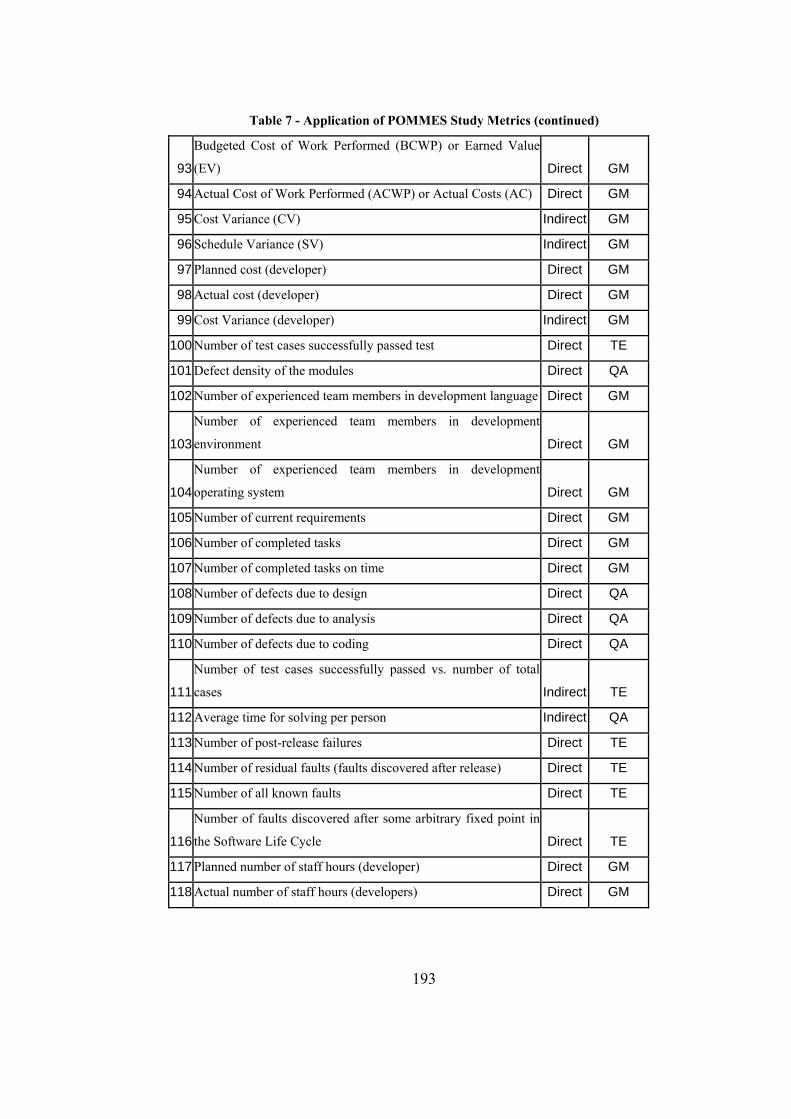
193
Table 7 - Application of POMMES Study Metrics (continued)
93
Budgeted Cost of Work Performed (BCWP) or Earned Value
(EV) Direct GM
94 Actual Cost of Work Performed (ACWP) or Actual Costs (AC) Direct GM
95 Cost Variance (CV) Indirect GM
96 Schedule Variance (SV) Indirect GM
97 Planned cost (developer) Direct GM
98 Actual cost (developer) Direct GM
99 Cost Variance (developer) Indirect GM
100 Number of test cases successfully passed test Direct TE
101 Defect density of the modules Direct QA
102 Number of experienced team members in development language Direct GM
103
Number of experienced team members in development
environment Direct GM
104
Number of experienced team members in development
operating system Direct GM
105 Number of current requirements Direct GM
106 Number of completed tasks Direct GM
107 Number of completed tasks on time Direct GM
108 Number of defects due to design Direct QA
109 Number of defects due to analysis Direct QA
110 Number of defects due to coding Direct QA
111
Number of test cases successfully passed vs. number of total
cases Indirect TE
112 Average time for solving per person Indirect QA
113 Number of post-release failures Direct TE
114 Number of residual faults (faults discovered after release) Direct TE
115 Number of all known faults Direct TE
116
Number of faults discovered after some arbitrary fixed point in
the Software Life Cycle Direct TE
117 Planned number of staff hours (developer) Direct GM
118 Actual number of staff hours (developers) Direct GM
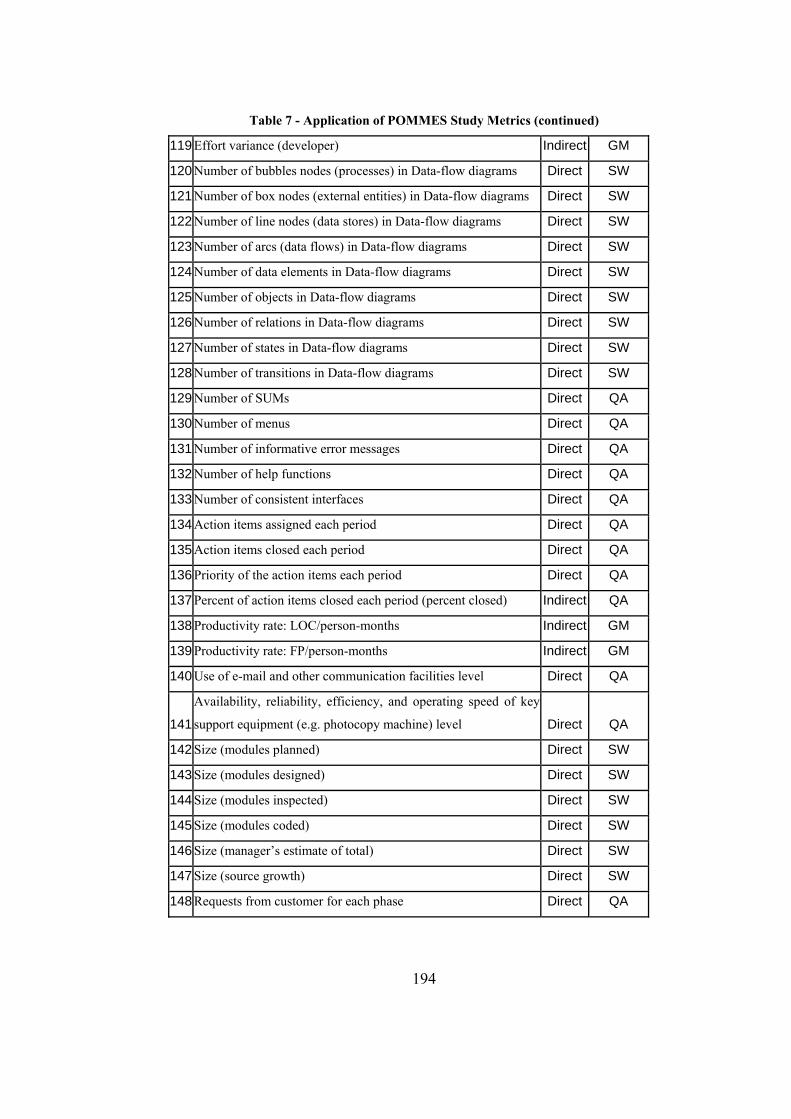
194
Table 7 - Application of POMMES Study Metrics (continued) 119 Effort variance (developer) Indirect GM
120 Number of bubbles nodes (processes) in Data-flow diagrams Direct SW
121 Number of box nodes (external entities) in Data-flow diagrams Direct SW
122 Number of line nodes (data stores) in Data-flow diagrams Direct SW
123 Number of arcs (data flows) in Data-flow diagrams Direct SW
124 Number of data elements in Data-flow diagrams Direct SW
125 Number of objects in Data-flow diagrams Direct SW
126 Number of relations in Data-flow diagrams Direct SW
127 Number of states in Data-flow diagrams Direct SW
128 Number of transitions in Data-flow diagrams Direct SW
129 Number of SUMs Direct QA
130 Number of menus Direct QA
131 Number of informative error messages Direct QA
132 Number of help functions Direct QA
133 Number of consistent interfaces Direct QA
134 Action items assigned each period Direct QA
135 Action items closed each period Direct QA
136 Priority of the action items each period Direct QA
137 Percent of action items closed each period (percent closed) Indirect QA
138 Productivity rate: LOC/person-months Indirect GM
139 Productivity rate: FP/person-months Indirect GM
140 Use of e-mail and other communication facilities level Direct QA
141
Availability, reliability, efficiency, and operating speed of key
support equipment (e.g. photocopy machine) level Direct QA
142 Size (modules planned) Direct SW
143 Size (modules designed) Direct SW
144 Size (modules inspected) Direct SW
145 Size (modules coded) Direct SW
146 Size (manager’s estimate of total) Direct SW
147 Size (source growth) Direct SW
148 Requests from customer for each phase Direct QA
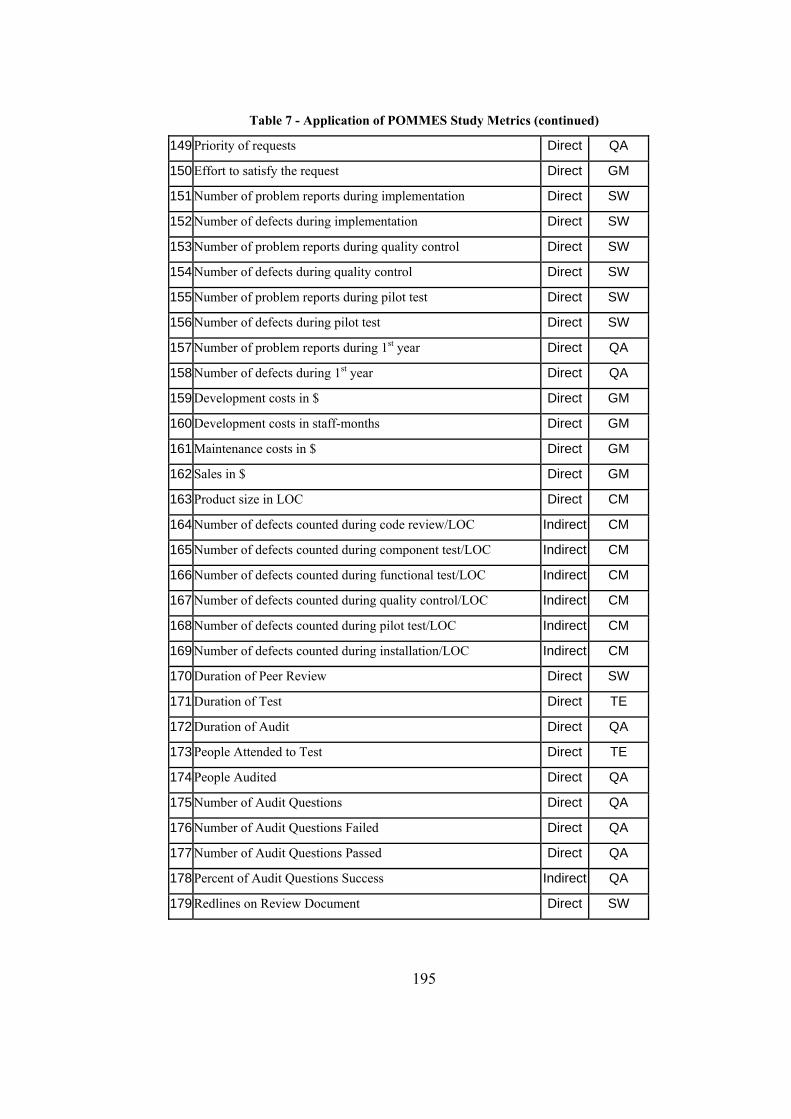
195
Table 7 - Application of POMMES Study Metrics (continued) 149 Priority of requests Direct QA
150 Effort to satisfy the request Direct GM
151 Number of problem reports during implementation Direct SW
152 Number of defects during implementation Direct SW
153 Number of problem reports during quality control Direct SW
154 Number of defects during quality control Direct SW
155 Number of problem reports during pilot test Direct SW
156 Number of defects during pilot test Direct SW
157 Number of problem reports during 1st year Direct QA
158 Number of defects during 1st year Direct QA
159 Development costs in $ Direct GM
160 Development costs in staff-months Direct GM
161 Maintenance costs in $ Direct GM
162 Sales in $ Direct GM
163 Product size in LOC Direct CM
164 Number of defects counted during code review/LOC Indirect CM
165 Number of defects counted during component test/LOC Indirect CM
166 Number of defects counted during functional test/LOC Indirect CM
167 Number of defects counted during quality control/LOC Indirect CM
168 Number of defects counted during pilot test/LOC Indirect CM
169 Number of defects counted during installation/LOC Indirect CM
170 Duration of Peer Review Direct SW
171 Duration of Test Direct TE
172 Duration of Audit Direct QA
173 People Attended to Test Direct TE
174 People Audited Direct QA
175 Number of Audit Questions Direct QA
176 Number of Audit Questions Failed Direct QA
177 Number of Audit Questions Passed Direct QA
178 Percent of Audit Questions Success Indirect QA
179 Redlines on Review Document Direct SW
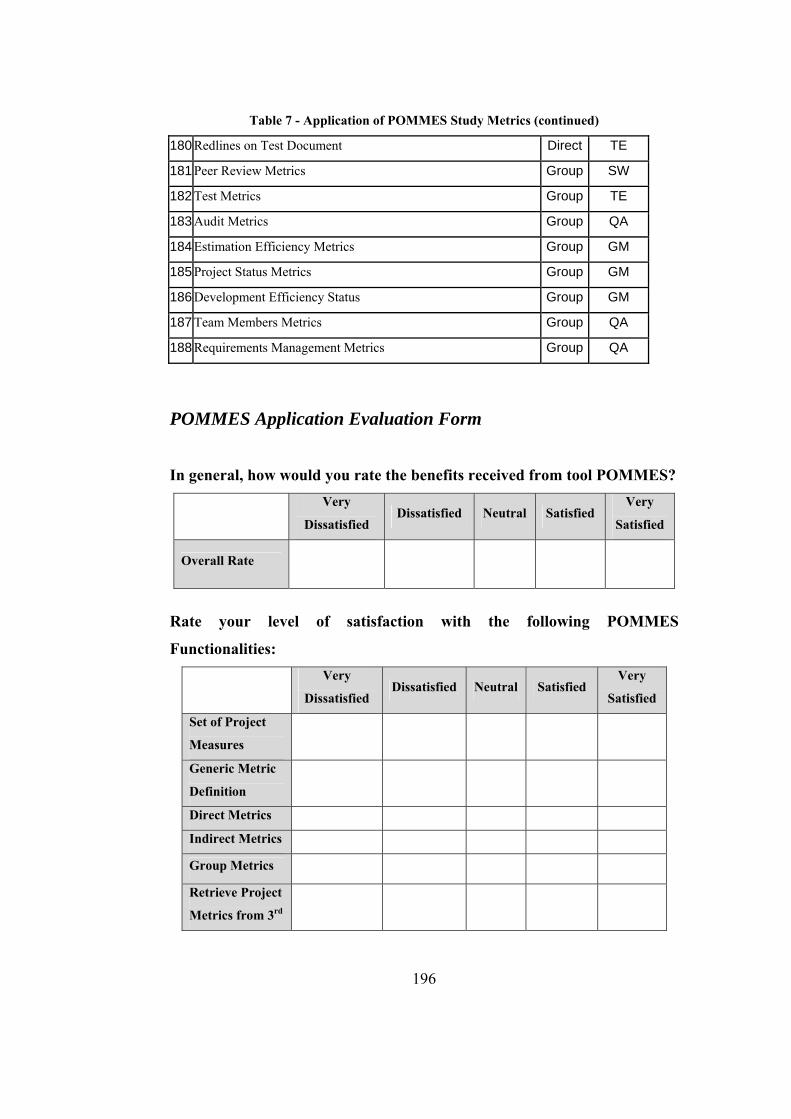
196
Table 7 - Application of POMMES Study Metrics (continued) 180 Redlines on Test Document Direct TE
181 Peer Review Metrics Group SW
182 Test Metrics Group TE
183 Audit Metrics Group QA
184 Estimation Efficiency Metrics Group GM
185 Project Status Metrics Group GM
186 Development Efficiency Status Group GM
187 Team Members Metrics Group QA
188 Requirements Management Metrics Group QA
POMMES Application Evaluation Form
In general, how would you rate the benefits received from tool POMMES? Very
Dissatisfied Dissatisfied Neutral Satisfied
Very
Satisfied
Overall Rate
Rate your level of satisfaction with the following POMMES
Functionalities:
Very
Dissatisfied Dissatisfied Neutral Satisfied
Very
Satisfied
Set of Project
Measures
Generic Metric
Definition
Direct Metrics
Indirect Metrics
Group Metrics
Retrieve Project
Metrics from 3rd
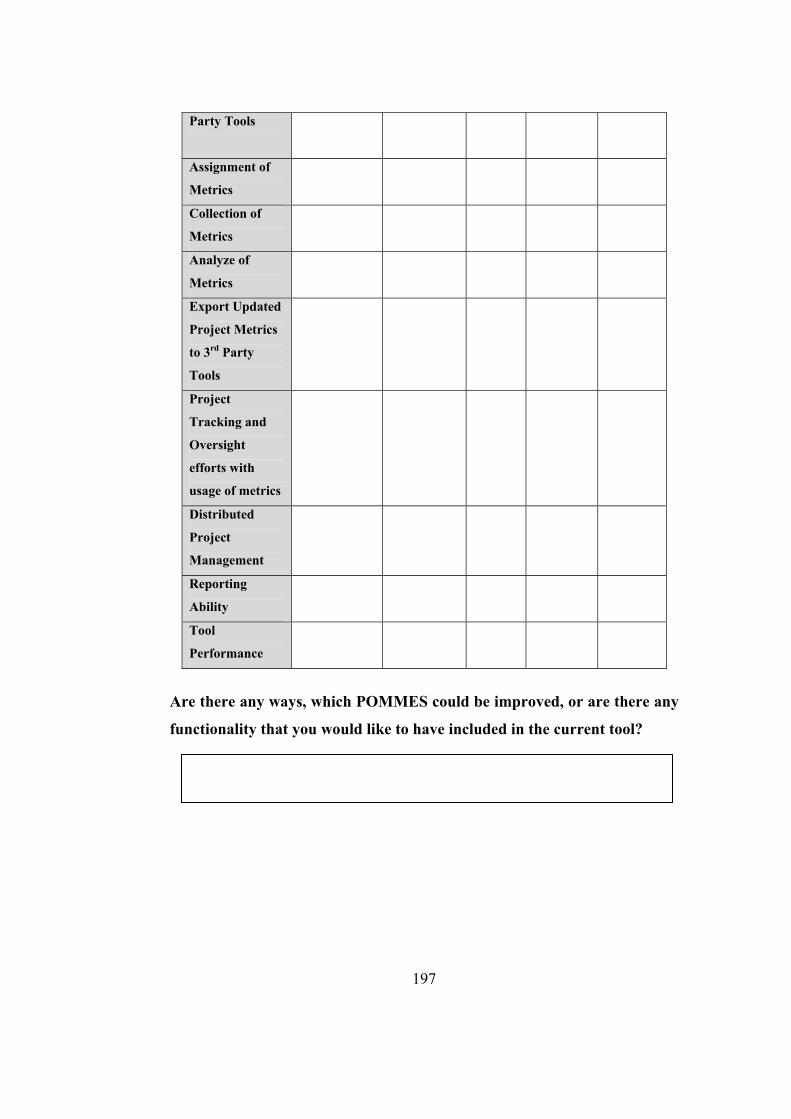
Party Tools
Assignment of
Metrics
Collection of
Metrics
Analyze of
Metrics
Export Updated
Project Metrics
to 3rd Party
Tools
Project
Tracking and
Oversight
efforts with
usage of metrics
Distributed
Project
Management
Reporting
Ability
Tool
Performance
Are there any ways, which POMMES could be improved, or are there any
functionality that you would like to have included in the current tool?
197
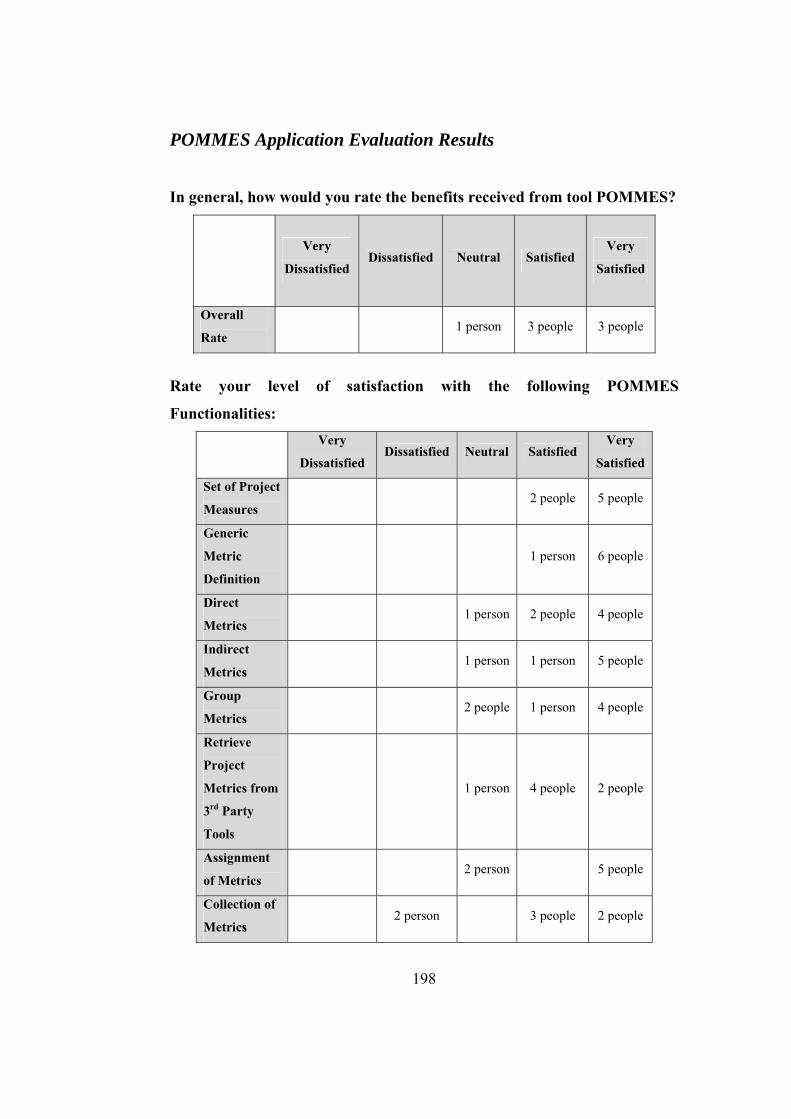
198
POMMES Application Evaluation Results
In general, how would you rate the benefits received from tool POMMES?
Very
Dissatisfied Dissatisfied Neutral Satisfied
Very
Satisfied
Overall
Rate 1 person 3 people 3 people
Rate your level of satisfaction with the following POMMES
Functionalities: Very
Dissatisfied Dissatisfied Neutral Satisfied
Very
Satisfied
Set of Project
Measures 2 people 5 people
Generic
Metric
Definition
1 person 6 people
Direct
Metrics 1 person 2 people 4 people
Indirect
Metrics 1 person 1 person 5 people
Group
Metrics 2 people 1 person 4 people
Retrieve
Project
Metrics from
3rd Party
Tools
1 person 4 people 2 people
Assignment
of Metrics 2 person 5 people
Collection of
Metrics 2 person 3 people 2 people
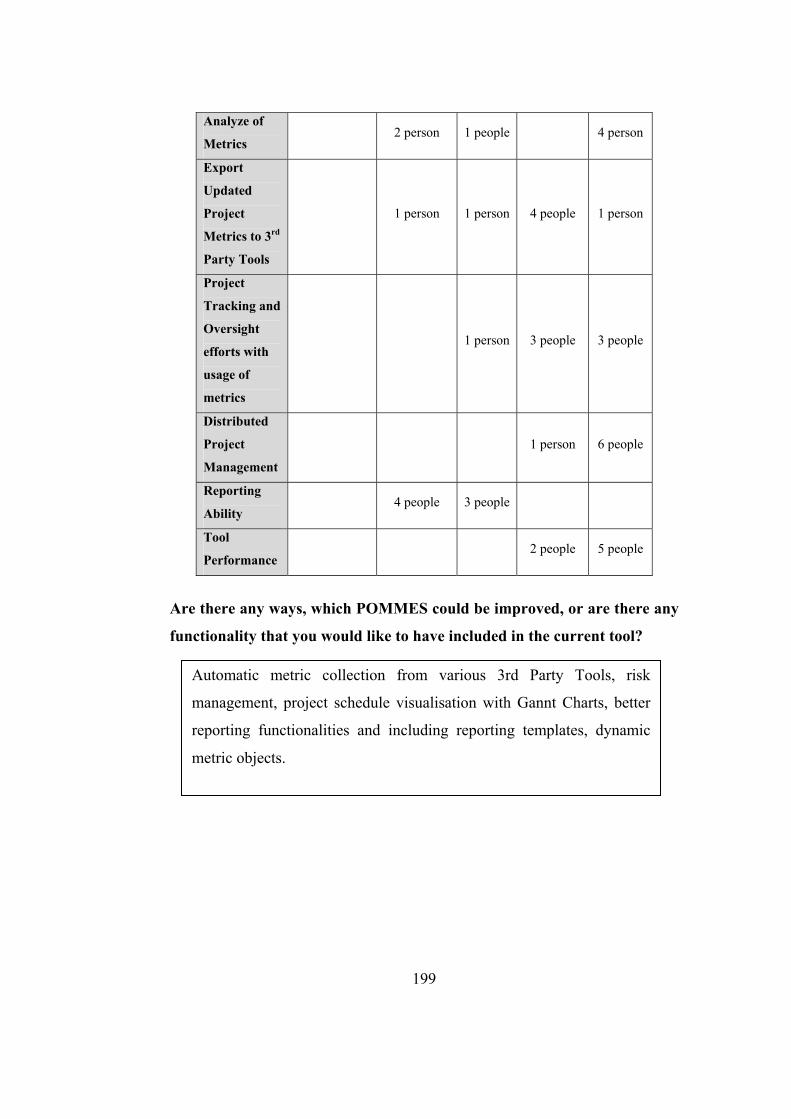
Analyze of
Metrics 2 person 1 people 4 person
Export
Updated
Project
Metrics to 3rd
Party Tools
1 person 1 person 4 people 1 person
Project
Tracking and
Oversight
efforts with
usage of
metrics
1 person 3 people 3 people
Distributed
Project
Management
1 person 6 people
Reporting
Ability 4 people 3 people
Tool
Performance 2 people 5 people
Are there any ways, which POMMES could be improved, or are there any
functionality that you would like to have included in the current tool?
Automatic metric collection from various 3rd Party Tools, risk
management, project schedule visualisation with Gannt Charts, better
reporting functionalities and including reporting templates, dynamic
metric objects.
199