Embed Size (px)
Citation preview
1
Population and administrative datasets for research &
evaluation
Carmen Ng, Epidemiologist
Decision Support Services
2
Objectives1. Have some knowledge of the types of
population and administrative data available in and outside of Fraser Health
2. Have a basic understanding of the use of population and administrative data in planning, evaluation, and research
3. Examples and case studies of using population and administrative data
4. Have knowledge of the policy and procedures for research related data requests in Fraser Health.
3
Outline1. Overview of administrative databases and
other health-related data2. Sources and types of data
ExternalInternalAvailabilityLinking and using multiple datasets
3. Case studies in Fraser Health4. Accessing health data and role of Decision
Support Services5. Question and answer period
4
Overview of administrative databasesand other health-related data
5
Background
What are administrative databases?Information routinely collected from compensation agencies, medical services plans, and hospitals for the purposes of billing and accounting
Commonly used in research settings to:1.Understand health and utilization trends2.Monitor patient outcomes3.Determine the efficacy of various treatments and
medical interventions
6
Characteristics of administrative data
Population-based- Majority of British Columbians are covered by
Medical Services PlanUnique identifiers- Personal identifiers (e.g. PHN, name, date of birth)
to link records/filesLongitudinal/follow-up- Track groups of individuals over time
Secondary data- Primary use is for billing and accounting purposes
Reliability and validity
7
Benefits of using administrative data
Readiness for useWide geographic coverageCost/time efficient Records contacts with health care systemLarge number of records allow study of rare eventsLong term follow-up
8
Limitations of using administrative dataPrimary purpose is not to study health- Lack of clinically relevant data- Lack of concurrent controls
Issues surrounding validity or accuracy- Quality is highest for items directly associated with
paymentIssues surrounding privacy/securityMay exclude certain types of information- (e.g. services not covered under provincial health
plan)Collected by multiple agencies/groups
9
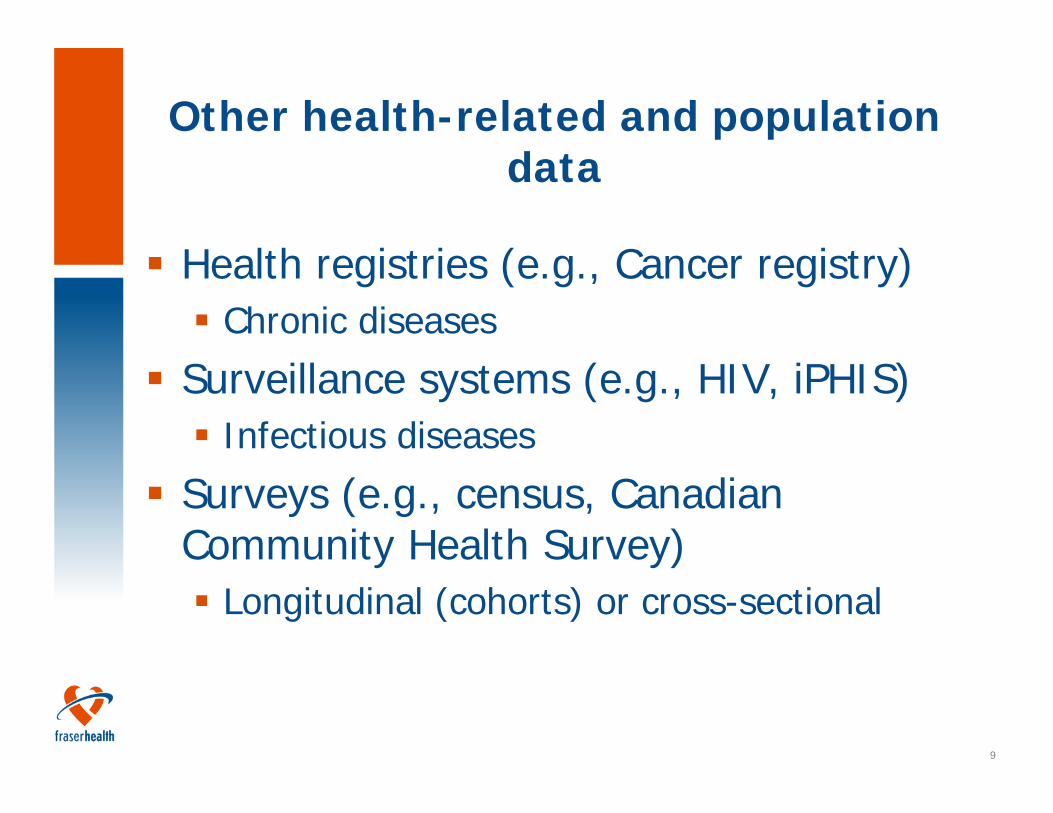
Other health-related and population data
Health registries (e.g., Cancer registry)Chronic diseases
Surveillance systems (e.g., HIV, iPHIS)Infectious diseases
Surveys (e.g., census, Canadian Community Health Survey)
Longitudinal (cohorts) or cross-sectional

10
Sources and types of data
11
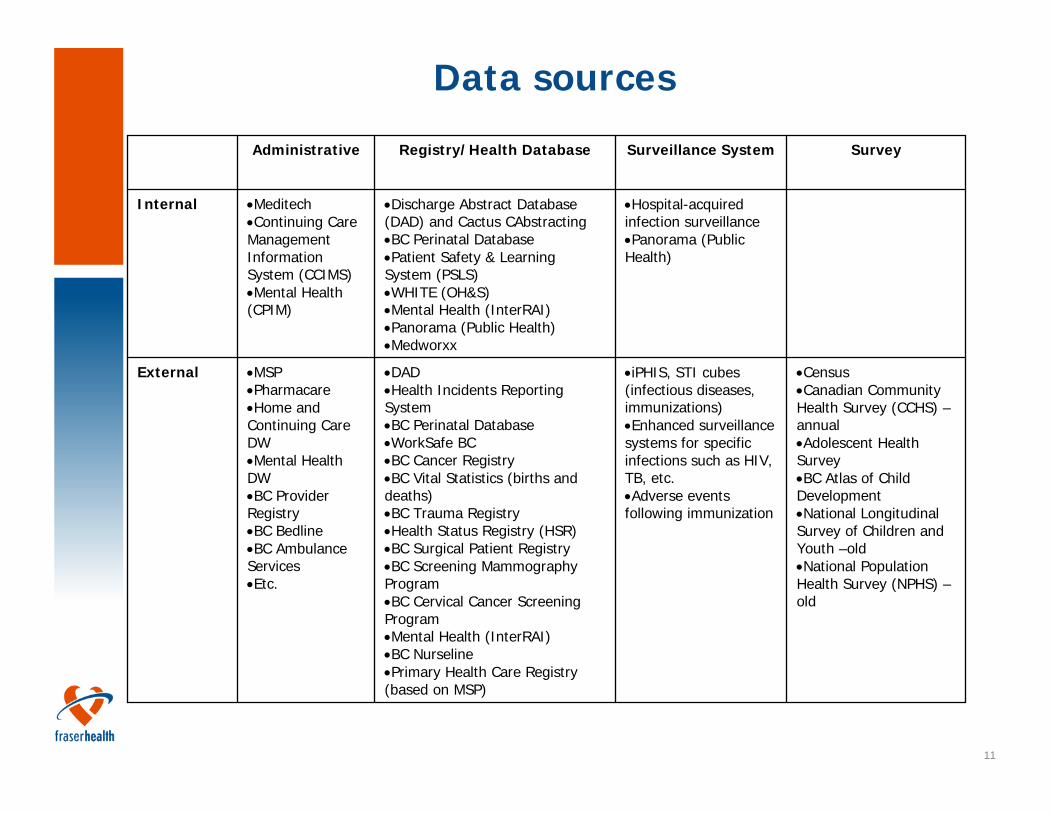
Data sources
•Census•Canadian Community Health Survey (CCHS) –annual•Adolescent Health Survey•BC Atlas of Child Development•National Longitudinal Survey of Children and Youth –old •National Population Health Survey (NPHS) –old
•iPHIS, STI cubes (infectious diseases, immunizations)•Enhanced surveillance systems for specific infections such as HIV, TB, etc.•Adverse events following immunization
•DAD•Health Incidents Reporting System•BC Perinatal Database•WorkSafe BC•BC Cancer Registry•BC Vital Statistics (births and deaths)•BC Trauma Registry•Health Status Registry (HSR)•BC Surgical Patient Registry•BC Screening Mammography Program•BC Cervical Cancer Screening Program•Mental Health (InterRAI)•BC Nurseline•Primary Health Care Registry (based on MSP)
•MSP•Pharmacare•Home and Continuing Care DW•Mental Health DW•BC Provider Registry•BC Bedline•BC Ambulance Services•Etc.
External
•Hospital-acquired infection surveillance•Panorama (Public Health)
•Discharge Abstract Database (DAD) and Cactus CAbstracting•BC Perinatal Database•Patient Safety & Learning System (PSLS)•WHITE (OH&S)•Mental Health (InterRAI)•Panorama (Public Health)•Medworxx
•Meditech•Continuing Care Management Information System (CCIMS)•Mental Health (CPIM)
Internal
SurveySurveillance SystemRegistry/Health DatabaseAdministrative

12
Fraser HealthIn
tern
al D
ata
Exte
rnal
Dat
a
OccHealth
(WHITE)
DischargeAbstract
(CAbstract)
Infectiousdisease,
immunization
Healthcareassociatedinfections
CIHI(DAD)
WorkSafeBC
PICnet iPHIS
PerinatalData
BCPerinatalDatabase
13
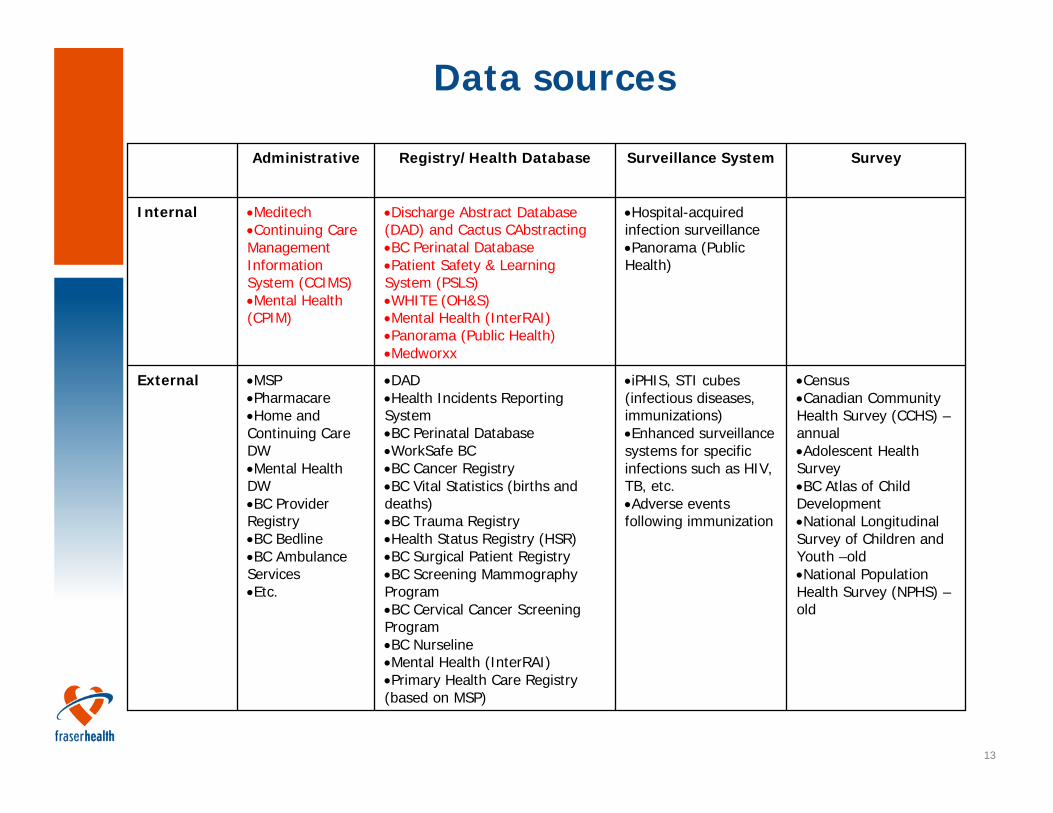
Data sources
•Census•Canadian Community Health Survey (CCHS) –annual•Adolescent Health Survey•BC Atlas of Child Development•National Longitudinal Survey of Children and Youth –old •National Population Health Survey (NPHS) –old
•iPHIS, STI cubes (infectious diseases, immunizations)•Enhanced surveillance systems for specific infections such as HIV, TB, etc.•Adverse events following immunization
•DAD•Health Incidents Reporting System•BC Perinatal Database•WorkSafe BC•BC Cancer Registry•BC Vital Statistics (births and deaths)•BC Trauma Registry•Health Status Registry (HSR)•BC Surgical Patient Registry•BC Screening Mammography Program•BC Cervical Cancer Screening Program•BC Nurseline•Mental Health (InterRAI)•Primary Health Care Registry (based on MSP)
•MSP•Pharmacare•Home and Continuing Care DW•Mental Health DW•BC Provider Registry•BC Bedline•BC Ambulance Services•Etc.
External
•Hospital-acquired infection surveillance•Panorama (Public Health)
•Discharge Abstract Database (DAD) and Cactus CAbstracting•BC Perinatal Database•Patient Safety & Learning System (PSLS)•WHITE (OH&S)•Mental Health (InterRAI)•Panorama (Public Health)•Medworxx
•Meditech•Continuing Care Management Information System (CCIMS)•Mental Health (CPIM)
Internal
SurveySurveillance SystemRegistry/Health DatabaseAdministrative
14
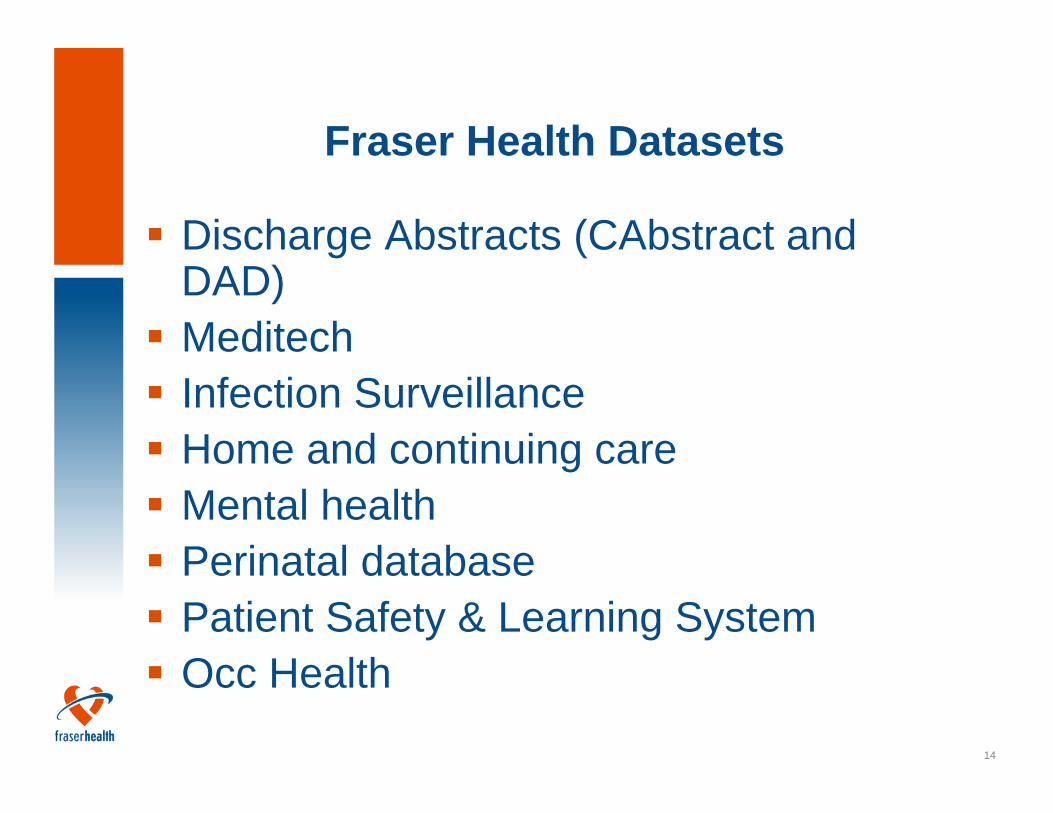
Fraser Health Datasets
Discharge Abstracts (CAbstract and DAD)MeditechInfection SurveillanceHome and continuing careMental healthPerinatal databasePatient Safety & Learning SystemOcc Health
15
Fraser Health Datasets
Discharge Abstract Database (DAD)- Contains hospital separations data- Data entered by coding teams in Health Information
Services- Each discharge and day surgery is entered- Data content is set nationally by Canadian Institute
of Health Information (CIHI)- Data is regularly submitted to CIHI
16
Fraser Health Datasets
Purpose of DAD- Collecting, processing and analysing summaries of
hospital discharges and day surgeries- Supporting management decision making at
hospital, authority and provincial level- Facilitates comparative reporting- Provides case grouping methods, length of stay and
resource utilization analysis
17
Fraser Health Datasets
Meditech- Various Modules, including emergency, admissions,
abstracting, etc.- DSS does not have access to other modules such
as financial, material management, human resources
- Data can be reported and extracted using canned or custom reports
- Data can be downloaded for analysis
18
Fraser Health Datasets
Data Extracts from Meditech- Ambulatory data- Emergency Department Data- Admissions- Etc.
19
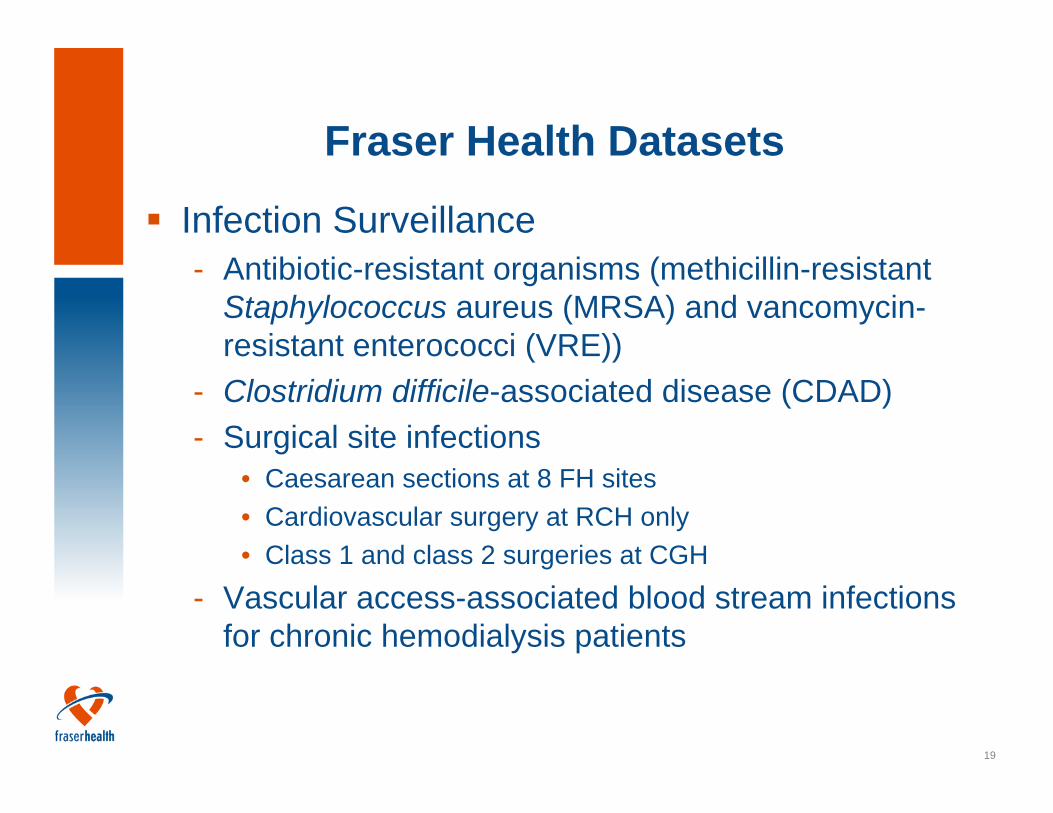
Fraser Health Datasets
Infection Surveillance- Antibiotic-resistant organisms (methicillin-resistant
Staphylococcus aureus (MRSA) and vancomycin-resistant enterococci (VRE))
- Clostridium difficile-associated disease (CDAD)- Surgical site infections
• Caesarean sections at 8 FH sites • Cardiovascular surgery at RCH only• Class 1 and class 2 surgeries at CGH
- Vascular access-associated blood stream infections for chronic hemodialysis patients
20
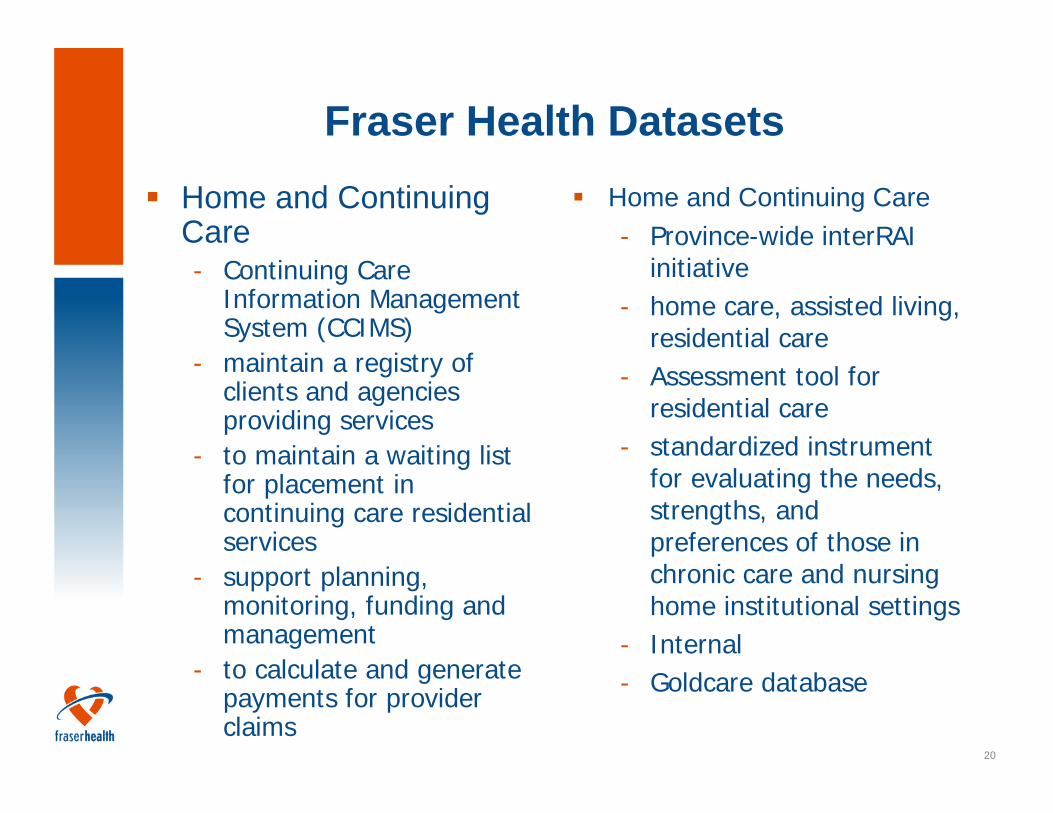
Fraser Health DatasetsHome and Continuing Care- Continuing Care
Information Management System (CCIMS)
- maintain a registry of clients and agencies providing services
- to maintain a waiting list for placement in continuing care residential services
- support planning, monitoring, funding and management
- to calculate and generate payments for provider claims
Home and Continuing Care- Province-wide interRAI
initiative- home care, assisted living,
residential care - Assessment tool for
residential care- standardized instrument
for evaluating the needs, strengths, and preferences of those in chronic care and nursing home institutional settings
- Internal- Goldcare database
21
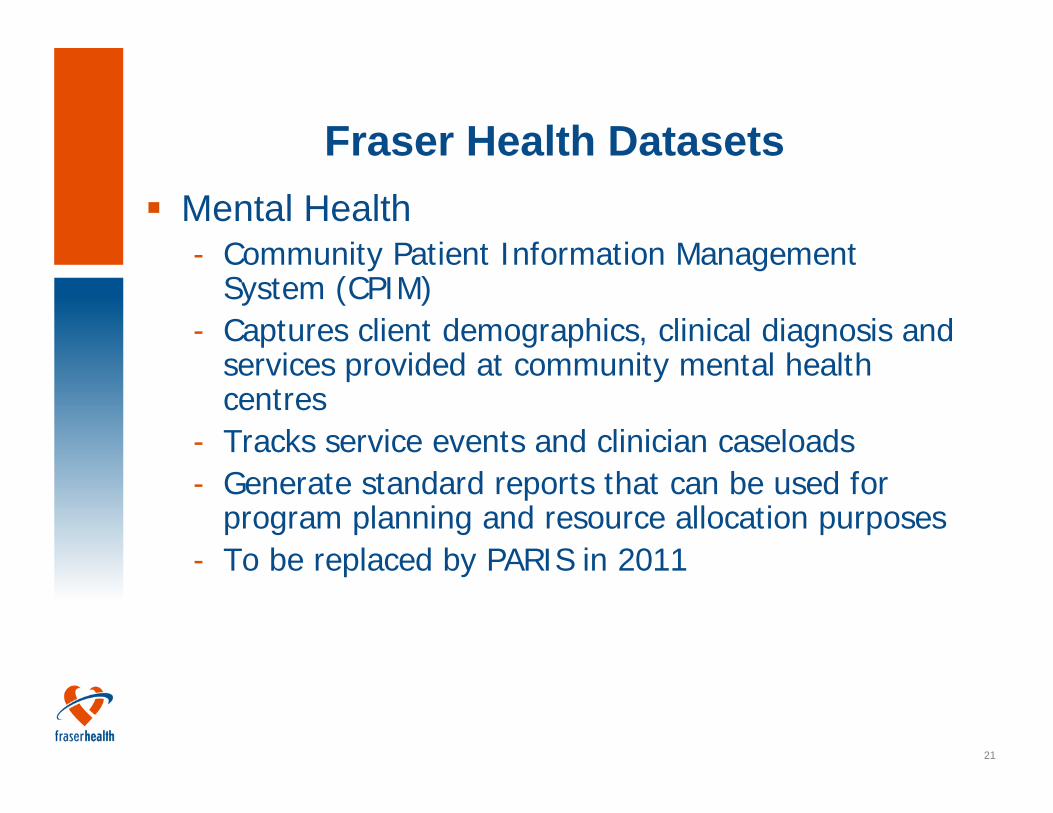
Fraser Health DatasetsMental Health- Community Patient Information Management
System (CPIM)- Captures client demographics, clinical diagnosis and
services provided at community mental health centres
- Tracks service events and clinician caseloads- Generate standard reports that can be used for
program planning and resource allocation purposes- To be replaced by PARIS in 2011
22
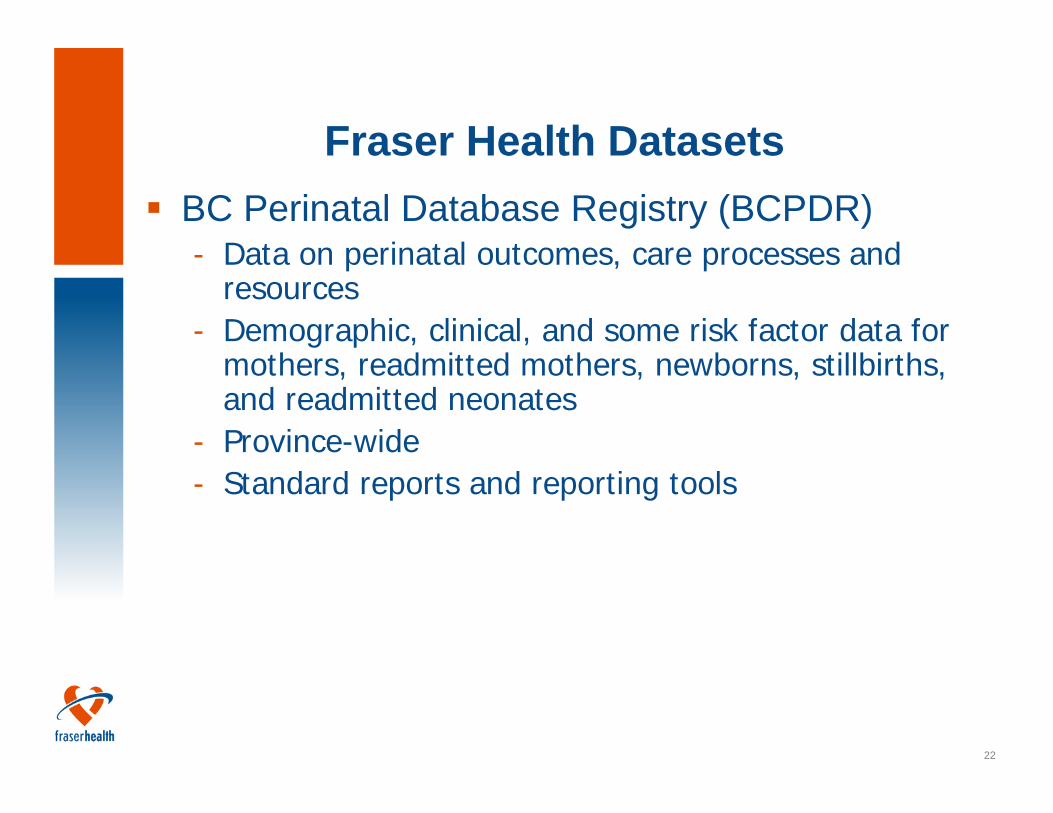
Fraser Health DatasetsBC Perinatal Database Registry (BCPDR)- Data on perinatal outcomes, care processes and
resources- Demographic, clinical, and some risk factor data for
mothers, readmitted mothers, newborns, stillbirths, and readmitted neonates
- Province-wide- Standard reports and reporting tools
23
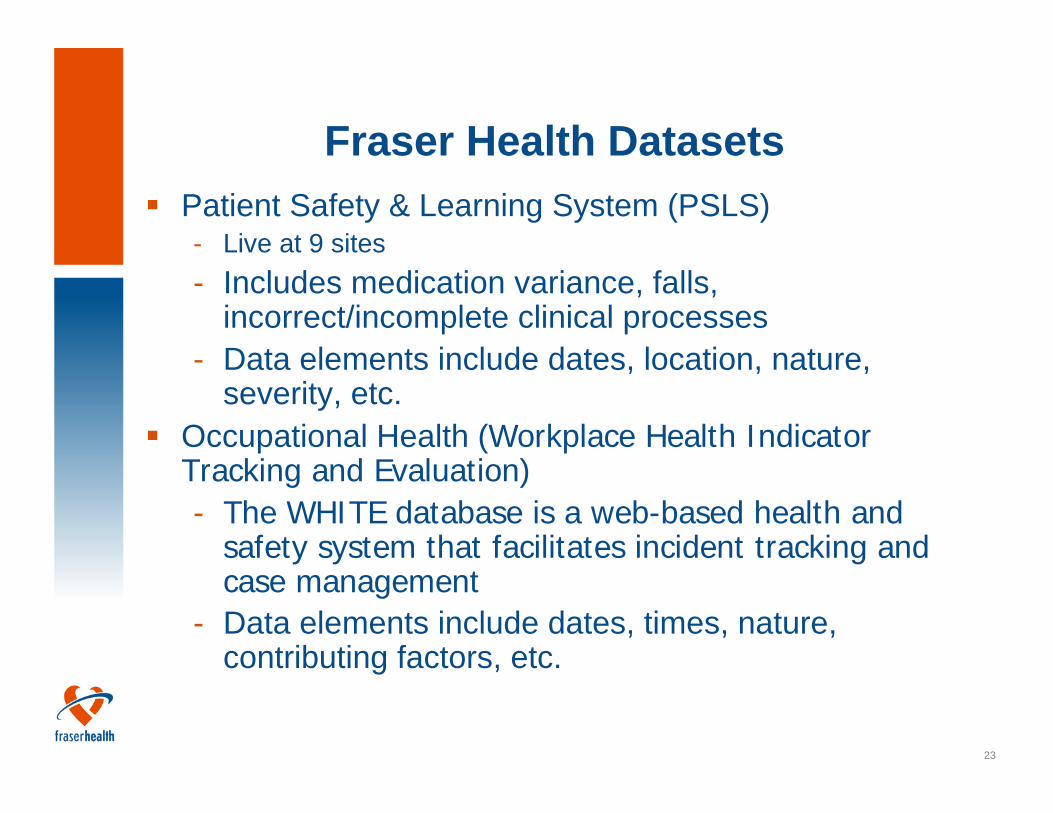
Fraser Health DatasetsPatient Safety & Learning System (PSLS)- Live at 9 sites- Includes medication variance, falls,
incorrect/incomplete clinical processes- Data elements include dates, location, nature,
severity, etc.Occupational Health (Workplace Health Indicator Tracking and Evaluation)- The WHITE database is a web-based health and
safety system that facilitates incident tracking and case management
- Data elements include dates, times, nature, contributing factors, etc.
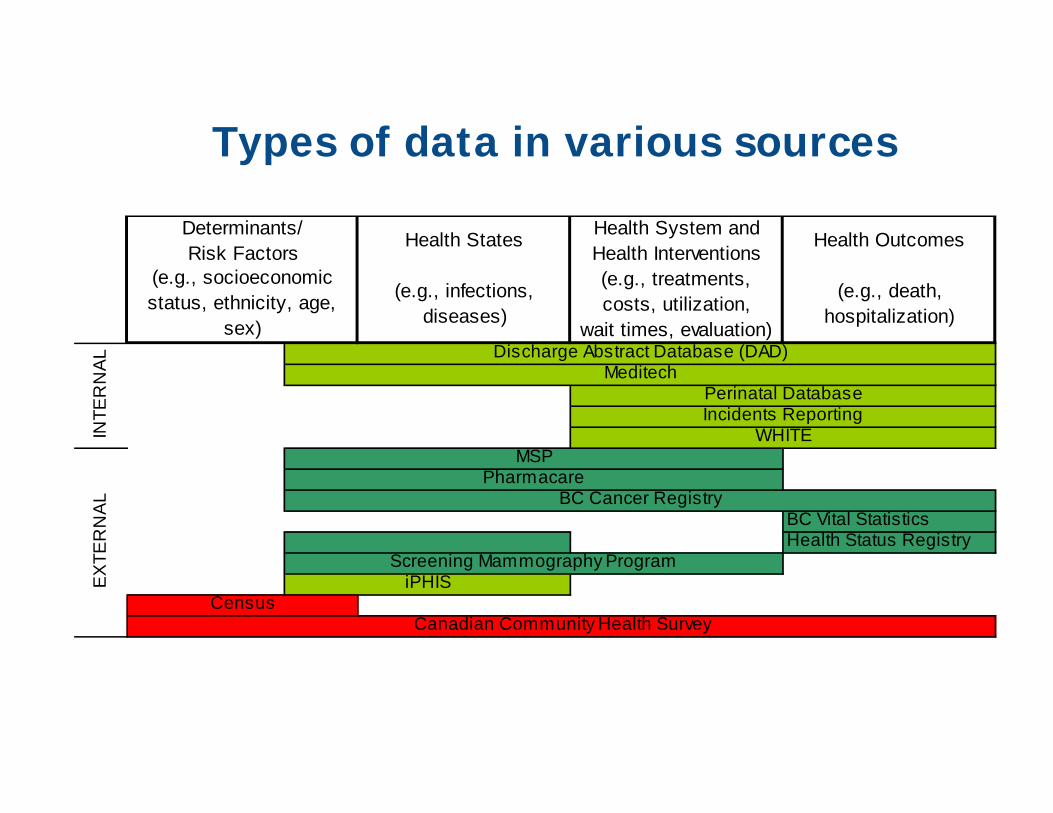
Types of data in various sources
Health States Health System andHealth Interventions
Health Outcomes
(e.g., infections,diseases)
(e.g., treatments, costs, utilization,
wait times, evaluation)
(e.g., death,hospitalization)
BC Vital StatisticsHealth Status Registry
WHITEINTE
RN
AL
Canadian Community Health Survey
EX
TER
NA
L
Census
PharmacareBC Cancer Registry
Screening Mammography Program
MSP
iPHIS
Determinants/Risk Factors
(e.g., socioeconomic status, ethnicity, age,
sex)Discharge Abstract Database (DAD)
MeditechPerinatal DatabaseIncidents Reporting
25
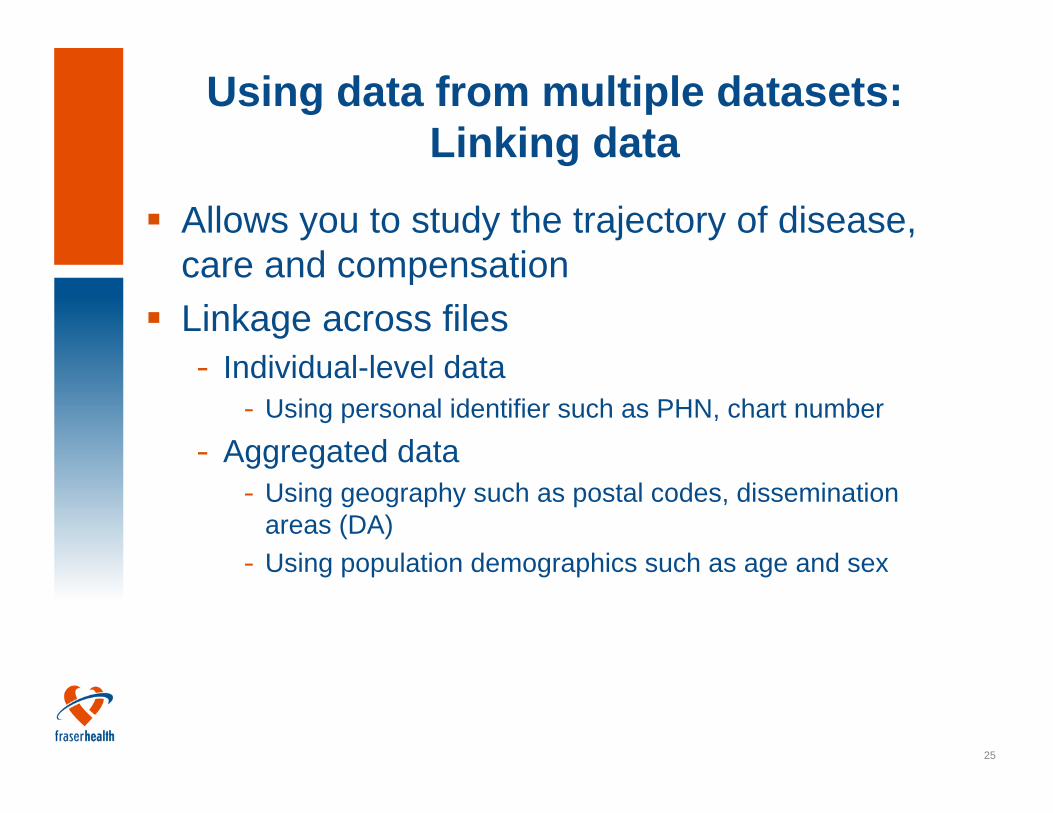
Using data from multiple datasets: Linking data
Allows you to study the trajectory of disease, care and compensationLinkage across files- Individual-level data
- Using personal identifier such as PHN, chart number
- Aggregated data- Using geography such as postal codes, dissemination
areas (DA)- Using population demographics such as age and sex
26
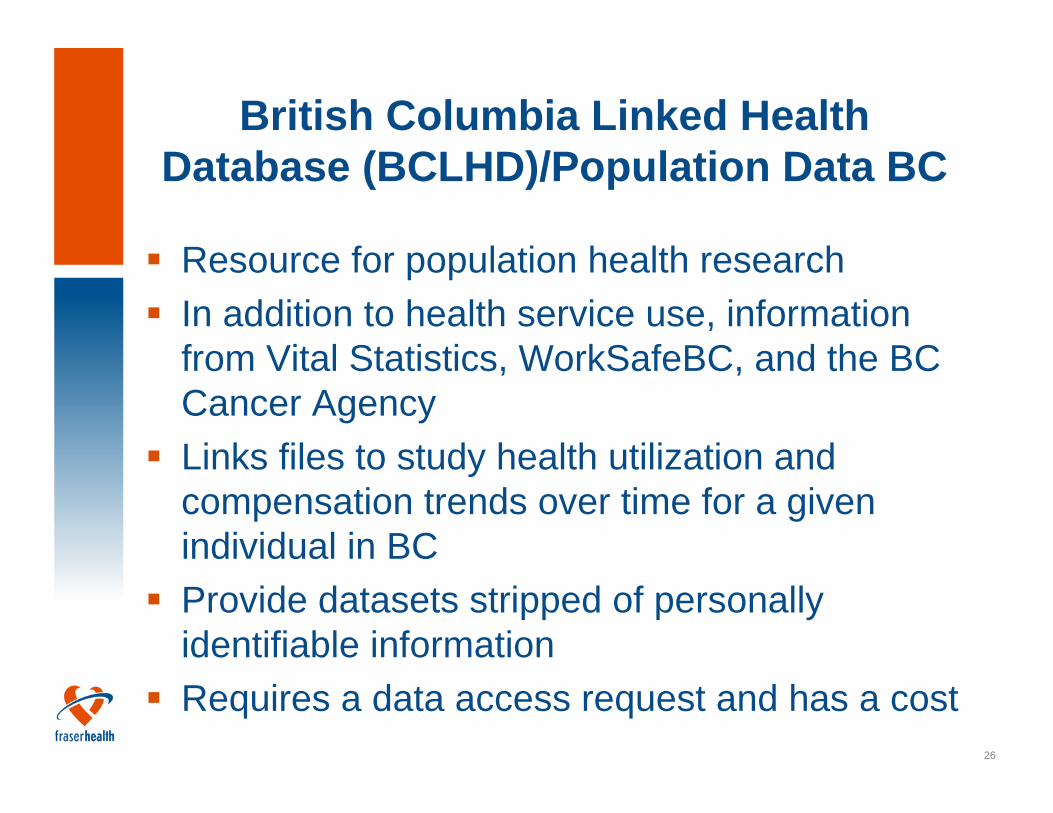
British Columbia Linked Health Database (BCLHD)/Population Data BC
Resource for population health researchIn addition to health service use, information from Vital Statistics, WorkSafeBC, and the BC Cancer AgencyLinks files to study health utilization and compensation trends over time for a given individual in BCProvide datasets stripped of personally identifiable information Requires a data access request and has a cost
27
Examples using population, health and administrative datasets
28
Case Study 1: Surveillance Systems for H1N1 and Olympics
29
Overview of Surveillance Systems
H1N1 system based on collected data as well as syndromic surveillanceOlympics system based solely on syndromic surveillance
30
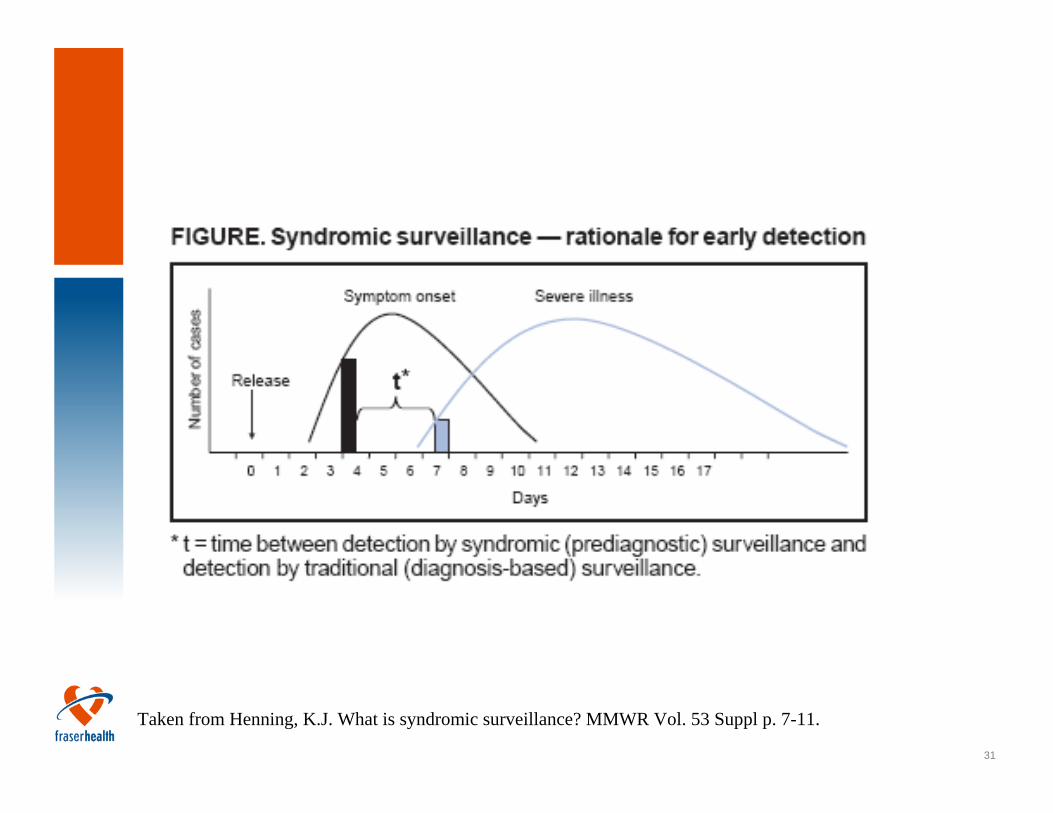
Syndromic Surveillance
Public health surveillance based on syndromes rather than actual diagnoses
Original form uses real-time dataEnhanced detection of emerging illness and infection, bioterrorismCommonly used in USField accelerated in US in 2001 after Anthrax incident
31
Taken from Henning, K.J. What is syndromic surveillance? MMWR Vol. 53 Suppl p. 7-11.
32
Uses of Surveillance Data
Outbreak detection (infectious diseases, emerging diseases, bioterrorism)Epidemiological information on affected population (age, sex, residence location)
33
Limitations
Proxy data, validity and reliabilityEvidence of effectiveness sparseMany different software availableMany different statistical methods in aberration detection
34
Data Sources for H1N1 Surveillance System
ED volumeED chief complaintAdmissions volumeAdmissions reason for visitICU admissionLaboratory testing for respiratory pathogens
Lab-confirmed H1N1 hospitalized casesResidential facility outbreaksSchool absenteeism
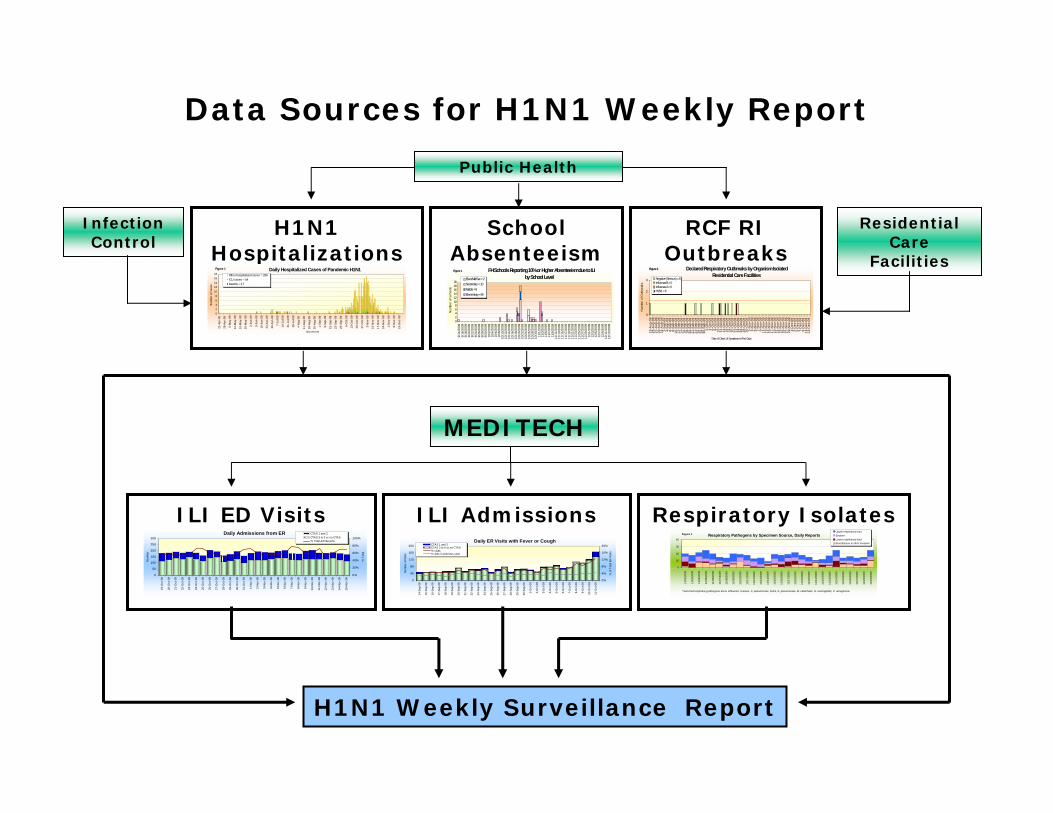
H1N1 Hospitalizations
RCF RI Outbreaks
H1N1 Weekly Surveillance Report
ILI ED Visits
0
50
100
150
200
250
300
19-O
ct-0
9
20-O
ct-0
9
21-O
ct-0
9
22-O
ct-0
9
23-O
ct-0
9
24-O
ct-0
9
25-O
ct-0
9
26-O
ct-0
9
27-O
ct-0
9
28-O
ct-0
9
29-O
ct-0
9
30-O
ct-0
9
31-O
ct-0
9
1-N
ov-0
9
2-N
ov-0
9
3-N
ov-0
9
4-N
ov-0
9
5-N
ov-0
9
6-N
ov-0
9
7-N
ov-0
9
8-N
ov-0
9
9-N
ov-0
9
10-N
ov-0
9
11-N
ov-0
9
12-N
ov-0
9
13-N
ov-0
9
14-N
ov-0
9
15-N
ov-0
9
Num
ber
0%
20%
40%
60%
80%
100%
% T
otal
CTAS 1 and 2CTAS 3 to 5 or no CTAS% Total Admissions
Daily Admissions from ER
ILI Admissions
0
40
80
120
160
200
14-S
ep-0
9
15-S
ep-0
9
16-S
ep-0
9
17-S
ep-0
9
18-S
ep-0
9
19-S
ep-0
9
20-S
ep-0
9
21-S
ep-0
9
22-S
ep-0
9
23-S
ep-0
9
24-S
ep-0
9
25-S
ep-0
9
26-S
ep-0
9
27-S
ep-0
9
28-S
ep-0
9
29-S
ep-0
9
30-S
ep-0
9
1-O
ct-0
9
2-O
ct-0
9
3-O
ct-0
9
4-O
ct-0
9
5-O
ct-0
9
6-O
ct-0
9
7-O
ct-0
9
8-O
ct-0
9
9-O
ct-0
9
10-O
ct-0
9
11-O
ct-0
9
Num
ber o
f Vis
its
0%
4%
8%
12%
16%
20%
% o
f Tot
al E
R V
isits
CTAS 1 and 2CTAS 3 to 5 or no CTAS% visits# visits in previous year
Daily ER Visits with Fever or Cough
MEDITECH
Respiratory Isolates
0
10
20
30
40
11/0
2/20
09
11/0
3/20
09
11/0
4/20
09
11/0
5/20
09
11/0
6/20
09
11/0
7/20
09
11/0
8/20
09
11/0
9/20
09
11/1
0/20
09
11/1
1/20
09
11/1
2/20
09
11/1
3/20
09
11/1
4/20
09
11/1
5/20
09
11/1
6/20
09
11/1
7/20
09
11/1
8/20
09
11/1
9/20
09
11/2
0/20
09
11/2
1/20
09
11/2
2/20
09
11/2
3/20
09
11/2
4/20
09
11/2
5/20
09
11/2
6/20
09
11/2
7/20
09
11/2
8/20
09
11/2
9/20
09
Upper respiratory tractSputumLower respiratory tractBlood/tissue & other invasive
*Selected respiratory pathogens are H. influenza, S.areus, S. pneumoniae, iGAS, K. pneumoniae, M. catarrhalis, N. meningitidis, P. aeruginosa.
Respiratory Pathogens by Specimen Source, Daily ReportsFigure 1
02468
1012141618
21-A
pr-0
9
28-A
pr-0
9
5-M
ay-0
9
12-M
ay-0
9
19-M
ay-0
9
26-M
ay-0
9
2-Ju
n-09
9-Ju
n-09
16-J
un-0
9
23-J
un-0
9
30-J
un-0
9
7-Ju
l-09
14-J
ul-0
9
21-J
ul-0
9
28-J
ul-0
9
4-Au
g-09
11-A
ug-0
9
18-A
ug-0
9
25-A
ug-0
9
1-Se
p-09
8-Se
p-09
15-S
ep-0
9
22-S
ep-0
9
29-S
ep-0
9
6-O
ct-0
9
13-O
ct-0
9
20-O
ct-0
9
27-O
ct-0
9
3-N
ov-0
9
10-N
ov-0
9
17-N
ov-0
9
24-N
ov-0
9
1-D
ec-0
9
8-D
ec-0
9
15-D
ec-0
9
Episode Date
Num
ber o
f cas
es
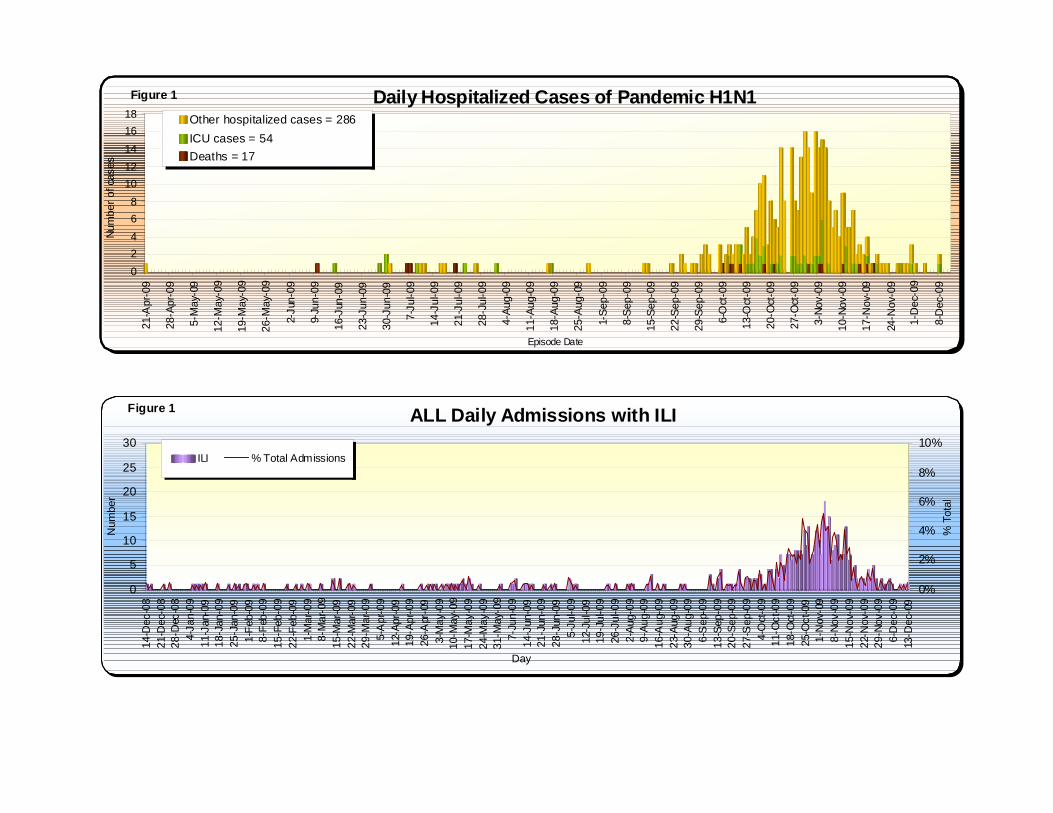
Other hospitalized cases = 286ICU cases = 54Deaths = 17
Daily Hospitalized Cases of Pandemic H1N1Figure 1
0
1
2
3
23-A
ug-0
925
-Aug
-09
27-A
ug-0
929
-Aug
-09
31-A
ug-0
92-
Sep
-09
4-S
ep-0
96-
Sep
-09
8-S
ep-0
910
-Sep
-09
12-S
ep-0
914
-Sep
-09
16-S
ep-0
918
-Sep
-09
20-S
ep-0
922
-Sep
-09
24-S
ep-0
926
-Sep
-09
28-S
ep-0
930
-Sep
-09
2-O
ct-0
94-
Oct
-09
6-O
ct-0
98-
Oct
-09
10-O
ct-0
912
-Oct
-09
14-O
ct-0
916
-Oct
-09
18-O
ct-0
920
-Oct
-09
22-O
ct-0
924
-Oct
-09
26-O
ct-0
928
-Oct
-09
30-O
ct-0
91-
Nov
-09
3-N
ov-0
95-
Nov
-09
7-N
ov-0
99-
Nov
-09
11-N
ov-0
913
-Nov
-09
15-N
ov-0
917
-Nov
-09
19-N
ov-0
921
-Nov
-09
23-N
ov-0
925
-Nov
-09
27-N
ov-0
929
-Nov
-09
1-D
ec-0
93-
Dec
-09
5-D
ec-0
97-
Dec
-09
9-D
ec-0
911
-Dec
-09
13-D
ec-0
9
Date of Onset of Symptoms in First Case
Num
ber o
f Out
brea
ks
Negative (Serious) = 6Influenza B = 0Influenza A = 0H1N1 = 6
Declared Respiratory Outbreaks by Organism Isolated Residential Care Facilities
Figure 1
Infection Control
Residential Care
Facilities
Data Sources for H1N1 Weekly Report
School Absenteeism
Public Health
02468
101214161820
9/14
/200
99/
16/2
009
9/18
/200
99/
20/2
009
9/22
/200
99/
24/2
009
9/26
/200
99/
28/2
009
9/30
/200
910
/2/2
009
10/4
/200
910
/6/2
009
10/8
/200
910
/10/
2009
10/1
2/20
0910
/14/
2009
10/1
6/20
0910
/18/
2009
10/2
0/20
0910
/22/
2009
10/2
4/20
0910
/26/
2009
10/2
8/20
0910
/30/
2009
11/1
/200
911
/3/2
009
11/5
/200
911
/7/2
009
11/9
/200
911
/11/
2009
11/1
3/20
0911
/15/
2009
11/1
7/20
0911
/19/
2009
11/2
1/20
0911
/23/
2009
11/2
5/20
0911
/27/
2009
11/2
9/20
0912
/1/2
009
12/3
/200
912
/5/2
009
12/7
/200
912
/9/2
009
12/1
1/20
0912
/13/
2009
Num
ber o
f sch
ools
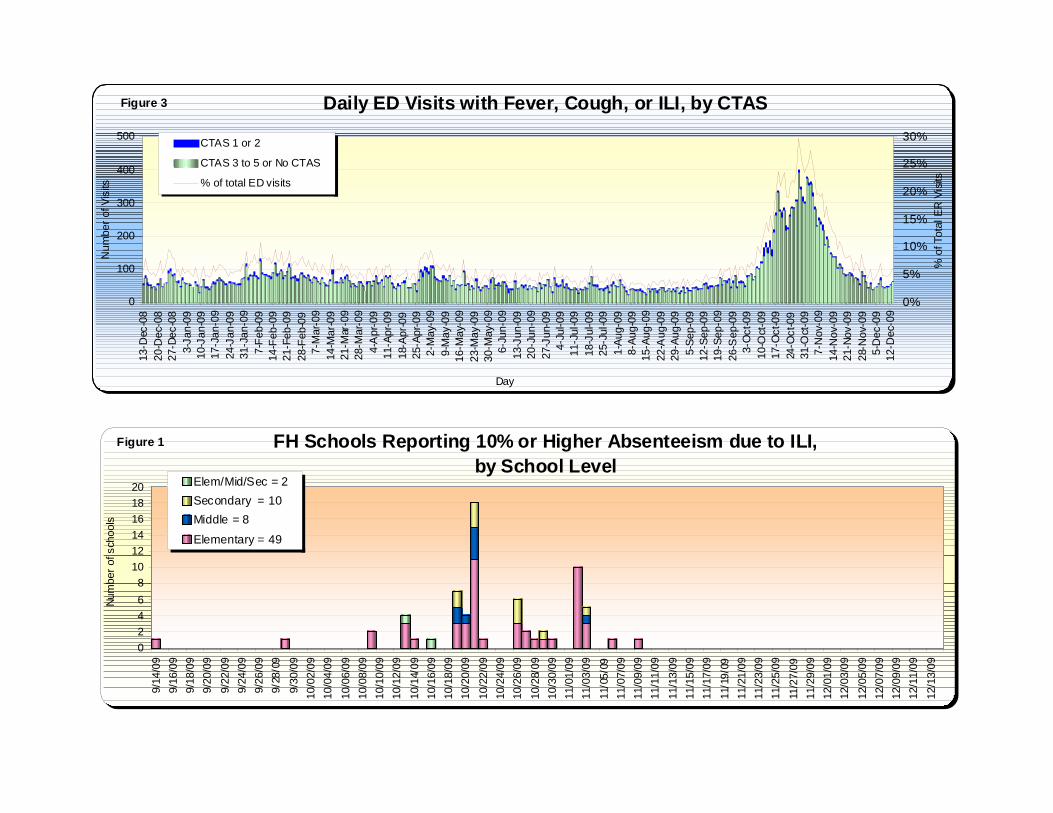
Elem/Mid/Sec = 2Secondary = 10Middle = 8Elementary = 49
Figure 1 FH Schools Reporting 10% or Higher Absenteeism due to ILI by School Level
02468
1012141618
21-A
pr-0
9
28-A
pr-0
9
5-M
ay-0
9
12-M
ay-0
9
19-M
ay-0
9
26-M
ay-0
9
2-Ju
n-09
9-Ju
n-09
16-J
un-0
9
23-J
un-0
9
30-J
un-0
9
7-Ju
l-09
14-J
ul-0
9
21-J
ul-0
9
28-J
ul-0
9
4-Au
g-09
11-A
ug-0
9
18-A
ug-0
9
25-A
ug-0
9
1-Se
p-09
8-Se
p-09
15-S
ep-0
9
22-S
ep-0
9
29-S
ep-0
9
6-O
ct-0
9
13-O
ct-0
9
20-O
ct-0
9
27-O
ct-0
9
3-No
v-09
10-N
ov-0
9
17-N
ov-0
9
24-N
ov-0
9
1-D
ec-0
9
8-D
ec-0
9
Episode Date
Num
ber o
f cas
esOther hospitalized cases = 286ICU cases = 54Deaths = 17
Daily Hospitalized Cases of Pandemic H1N1Figure 1
0
5
10
15
20
25
30
14-D
ec-0
821
-Dec
-08
28-D
ec-0
84-
Jan-
0911
-Jan
-09
18-J
an-0
925
-Jan
-09
1-Fe
b-09
8-Fe
b-09
15-F
eb-0
922
-Feb
-09
1-M
ar-0
98-
Mar
-09
15-M
ar-0
922
-Mar
-09
29-M
ar-0
95-
Apr
-09
12-A
pr-0
919
-Apr
-09
26-A
pr-0
93-
May
-09
10-M
ay-0
917
-May
-09
24-M
ay-0
931
-May
-09
7-Ju
n-09
14-J
un-0
921
-Jun
-09
28-J
un-0
95-
Jul-0
912
-Jul
-09
19-J
ul-0
926
-Jul
-09
2-Au
g-09
9-Au
g-09
16-A
ug-0
923
-Aug
-09
30-A
ug-0
96-
Sep
-09
13-S
ep-0
920
-Sep
-09
27-S
ep-0
94-
Oct
-09
11-O
ct-0
918
-Oct
-09
25-O
ct-0
91-
Nov
-09
8-No
v-09
15-N
ov-0
922
-Nov
-09
29-N
ov-0
96-
Dec
-09
13-D
ec-0
9
Day
Num
ber
0%
2%
4%
6%
8%
10%
% T
otal
ILI % Total Admissions
ALL Daily Admissions with ILIFigure 1
0
100
200
300
400
50013
-Dec
-08
20-D
ec-0
827
-Dec
-08
3-Ja
n-09
10-J
an-0
917
-Jan
-09
24-J
an-0
931
-Jan
-09
7-Fe
b-09
14-F
eb-0
921
-Feb
-09
28-F
eb-0
97-
Mar
-09
14-M
ar-0
921
-Mar
-09
28-M
ar-0
94-
Apr
-09
11-A
pr-0
918
-Apr
-09
25-A
pr-0
92-
May
-09
9-M
ay-0
916
-May
-09
23-M
ay-0
930
-May
-09
6-Ju
n-09
13-J
un-0
920
-Jun
-09
27-J
un-0
94-
Jul-0
911
-Jul
-09
18-J
ul-0
925
-Jul
-09
1-Au
g-09
8-Au
g-09
15-A
ug-0
922
-Aug
-09
29-A
ug-0
95-
Sep-
0912
-Sep
-09
19-S
ep-0
926
-Sep
-09
3-O
ct-0
910
-Oct
-09
17-O
ct-0
924
-Oct
-09
31-O
ct-0
97-
Nov
-09
14-N
ov-0
921
-Nov
-09
28-N
ov-0
95-
Dec
-09
12-D
ec-0
9
Day
Num
ber o
f Vis
its
0%
5%
10%
15%
20%
25%
30%
% o
f Tot
al E
R V
isits
CTAS 1 or 2
CTAS 3 to 5 or No CTAS
% of total ED visits
Daily ED Visits with Fever, Cough, or ILI, by CTASFigure 3
02468
101214161820
9/14
/09
9/16
/09
9/18
/09
9/20
/09
9/22
/09
9/24
/09
9/26
/09
9/28
/09
9/30
/09
10/0
2/09
10/0
4/09
10/0
6/09
10/0
8/09
10/1
0/09
10/1
2/09
10/1
4/09
10/1
6/09
10/1
8/09
10/2
0/09
10/2
2/09
10/2
4/09
10/2
6/09
10/2
8/09
10/3
0/09
11/0
1/09
11/0
3/09
11/0
5/09
11/0
7/09
11/0
9/09
11/1
1/09
11/1
3/09
11/1
5/09
11/1
7/09
11/1
9/09
11/2
1/09
11/2
3/09
11/2
5/09
11/2
7/09
11/2
9/09
12/0
1/09
12/0
3/09
12/0
5/09
12/0
7/09
12/0
9/09
12/1
1/09
12/1
3/09
Num
ber o
f sch
ools
Elem/Mid/Sec = 2Secondary = 10Middle = 8
Elementary = 49
FH Schools Reporting 10% or Higher Absenteeism due to ILI, by School Level
Figure 1
38
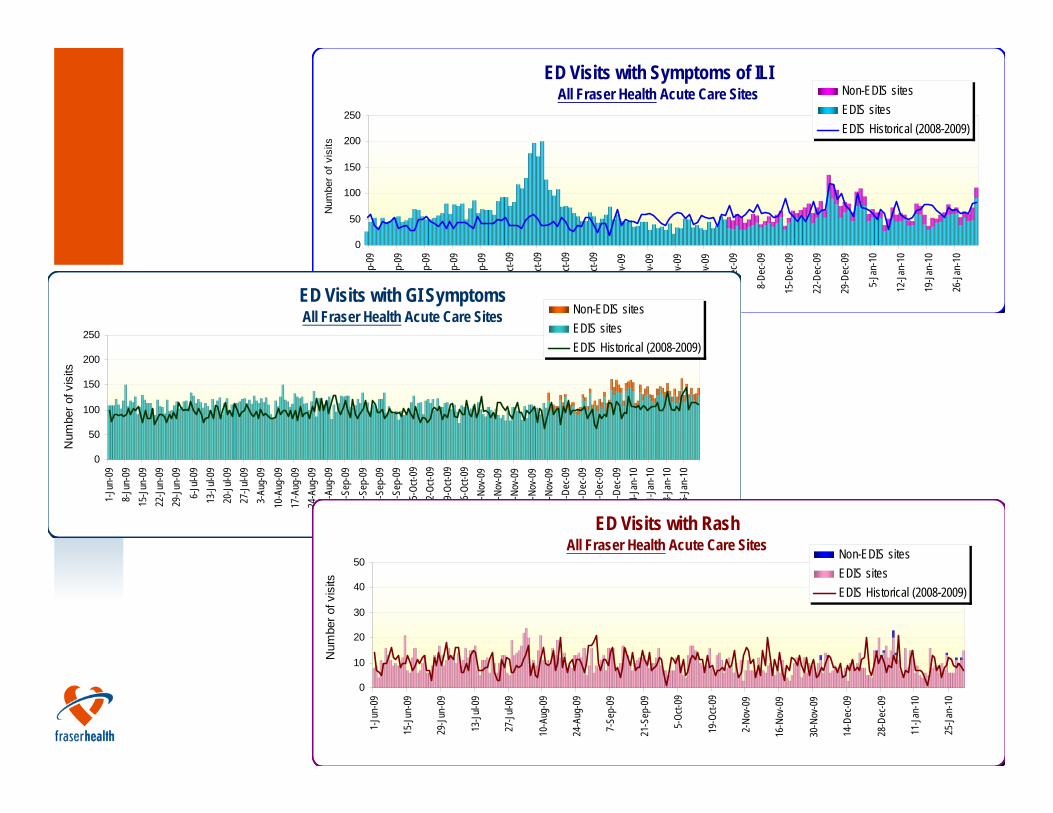
Olympic Surveillance
In collaboration with BCCDC and other HAsSyndromic surveillance of ED volume and chief complaintsSyndromes include:
ILIGIRash
39
ED Visits with Symptoms of ILIAll Fraser Health Acute Care Sites
0
50
100
150
200
250
1-Se
p-09
8-Se
p-09
15-S
ep-0
9
22-S
ep-0
9
29-S
ep-0
9
6-Oc
t-09
13-O
ct-09
20-O
ct-09
27-O
ct-09
3-No
v-09
10-N
ov-0
9
17-N
ov-0
9
24-N
ov-0
9
1-De
c-09
8-De
c-09
15-D
ec-0
9
22-D
ec-0
9
29-D
ec-0
9
5-Ja
n-10
12-Ja
n-10
19-Ja
n-10
26-Ja
n-10
Num
ber o
f vis
its
Non-EDIS sitesEDIS sitesEDIS Historical (2008-2009)
ED Visits with GI SymptomsAll Fraser Health Acute Care Sites
0
50
100
150
200
250
1-Ju
n-09
8-Ju
n-09
15-Ju
n-09
22-Ju
n-09
29-Ju
n-09
6-Ju
l-09
13-Ju
l-09
20-Ju
l-09
27-Ju
l-09
3-Au
g-09
10-A
ug-0
917
-Aug
-09
24-A
ug-0
931
-Aug
-09
7-Se
p-09
14-S
ep-0
921
-Sep
-09
28-S
ep-0
95-
Oct-0
912
-Oct-
0919
-Oct-
0926
-Oct-
092-
Nov-0
99-
Nov-0
916
-Nov
-09
23-N
ov-0
930
-Nov
-09
7-De
c-09
14-D
ec-0
921
-Dec
-09
28-D
ec-0
94-
Jan-
1011
-Jan-
1018
-Jan-
1025
-Jan-
10
Num
ber o
f vis
its
Non-EDIS sitesEDIS sitesEDIS Historical (2008-2009)
ED Visits with RashAll Fraser Health Acute Care Sites
0
10
20
30
40
50
1-Ju
n-09
15-Ju
n-09
29-Ju
n-09
13-Ju
l-09
27-Ju
l-09
10-A
ug-0
9
24-A
ug-0
9
7-Se
p-09
21-S
ep-0
9
5-Oc
t-09
19-O
ct-09
2-No
v-09
16-N
ov-0
9
30-N
ov-0
9
14-D
ec-0
9
28-D
ec-0
9
11-Ja
n-10
25-Ja
n-10
Num
ber o
f vis
its
Non-EDIS sitesEDIS sitesEDIS Historical (2008-2009)
40
Case study 2: Ecologic analyses by geography
41
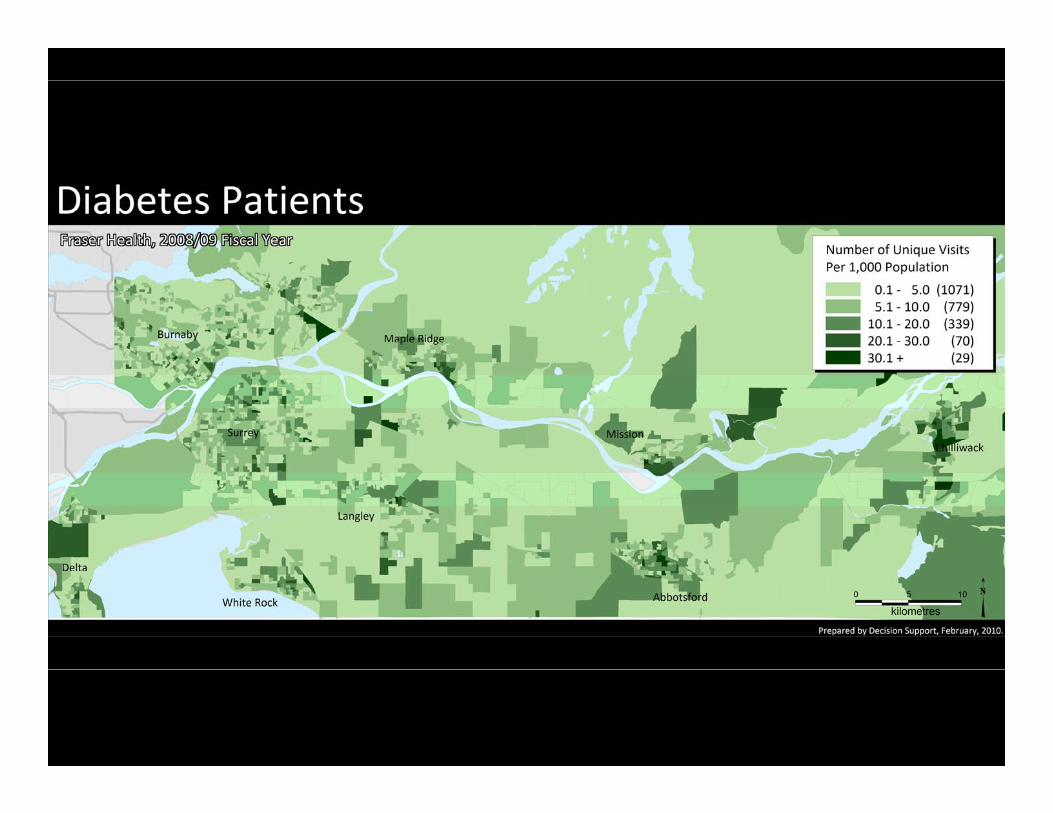
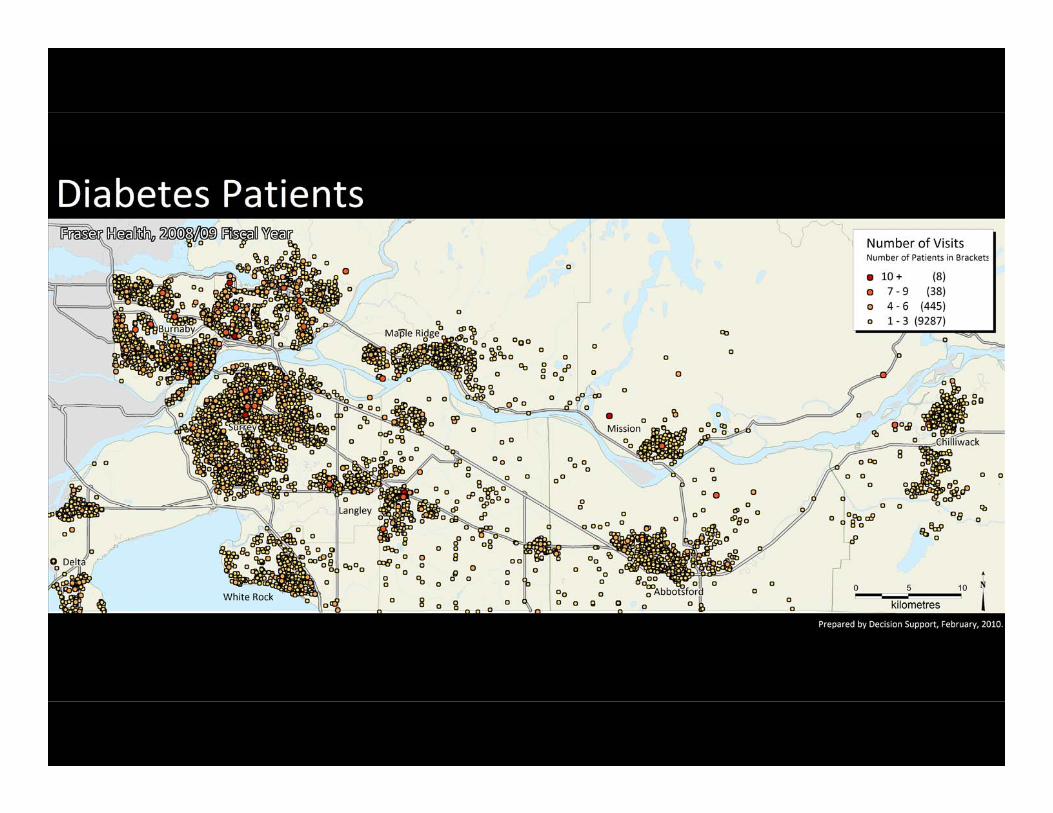
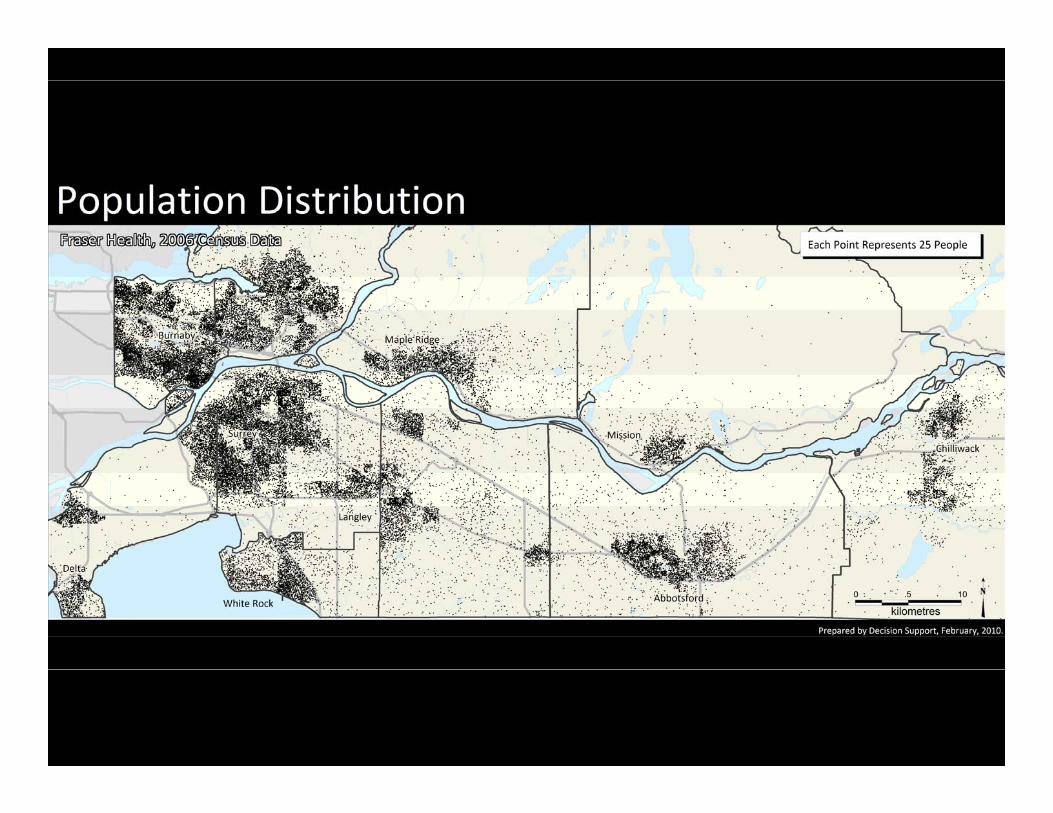
Linking Data by Geography:Ecologic Analysis
Not all data sources have patient identifiers for linking (e.g., Census, CCHS) but these are rich sources of data on risk factors and health determinants such as income and health behavioursAlmost all data sources can be linked by some level of geographyInvolves analyzing aggregate data for groups of individuals to make inferences about relationships at the individual levelThis type of analysis often preliminary in nature
42
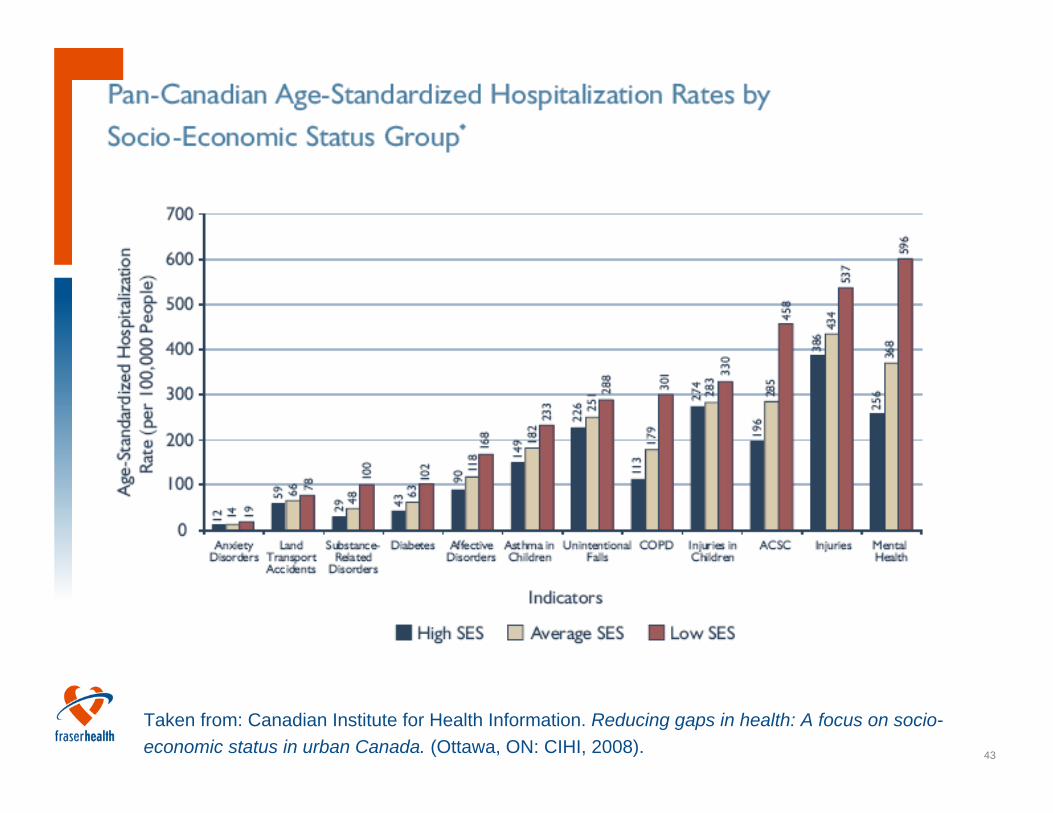
43
Taken from: Canadian Institute for Health Information. Reducing gaps in health: A focus on socio-economic status in urban Canada. (Ottawa, ON: CIHI, 2008).
44
45
46
47
Is income status related to diabetes hospitalization rates?
Analysis at the Dissemination Area levelOutcome = # people hospitalized with diabetes codeVariable of interest = median incomeControl variables = pop. size, urban/rural, age, ethnic breakdown, education level
48
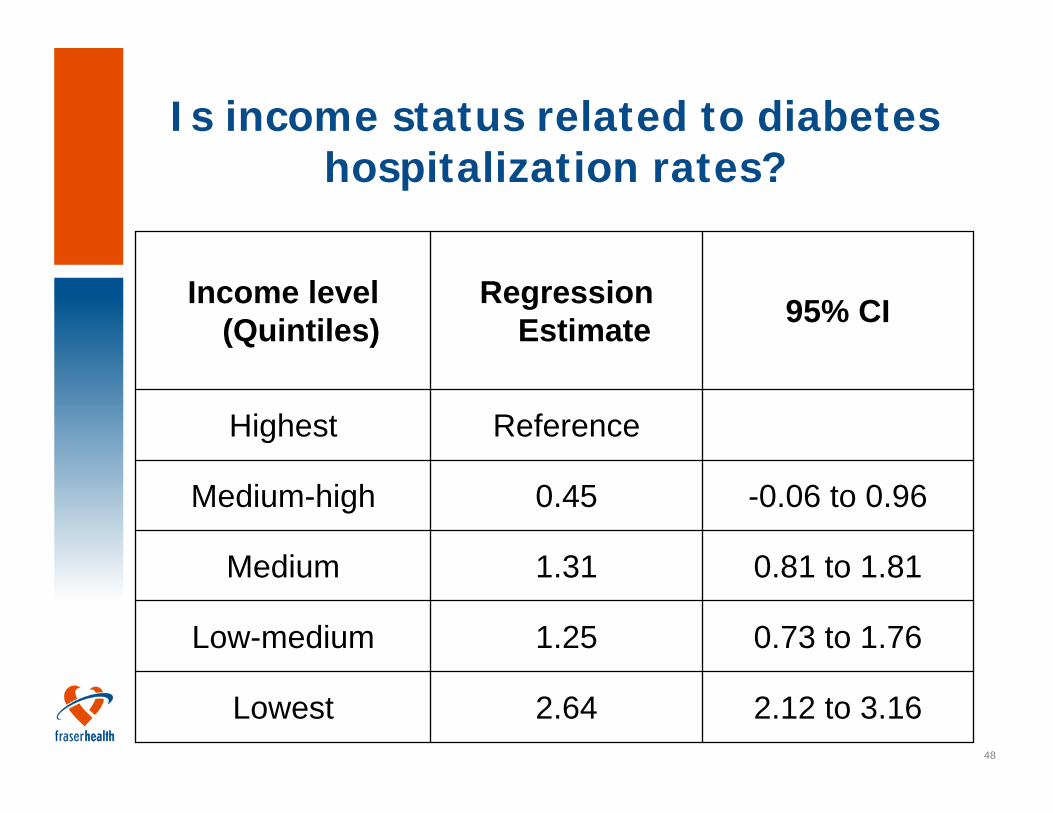
Is income status related to diabetes hospitalization rates?
2.12 to 3.162.64Lowest
0.73 to 1.761.25Low-medium
0.81 to 1.811.31Medium
-0.06 to 0.960.45Medium-high
ReferenceHighest
95% CIRegression Estimate
Income level (Quintiles)
49
Is income status related to the number of diabetes hospitalizations?
Analysis at the individual levelOutcome = binary; >2 visits vs. 1 visitVariable of interest = median income of their DAControl variables = age, sex, education level of DA, ethnic breakdown of DA, pop. Size of DA, urban/rural
50
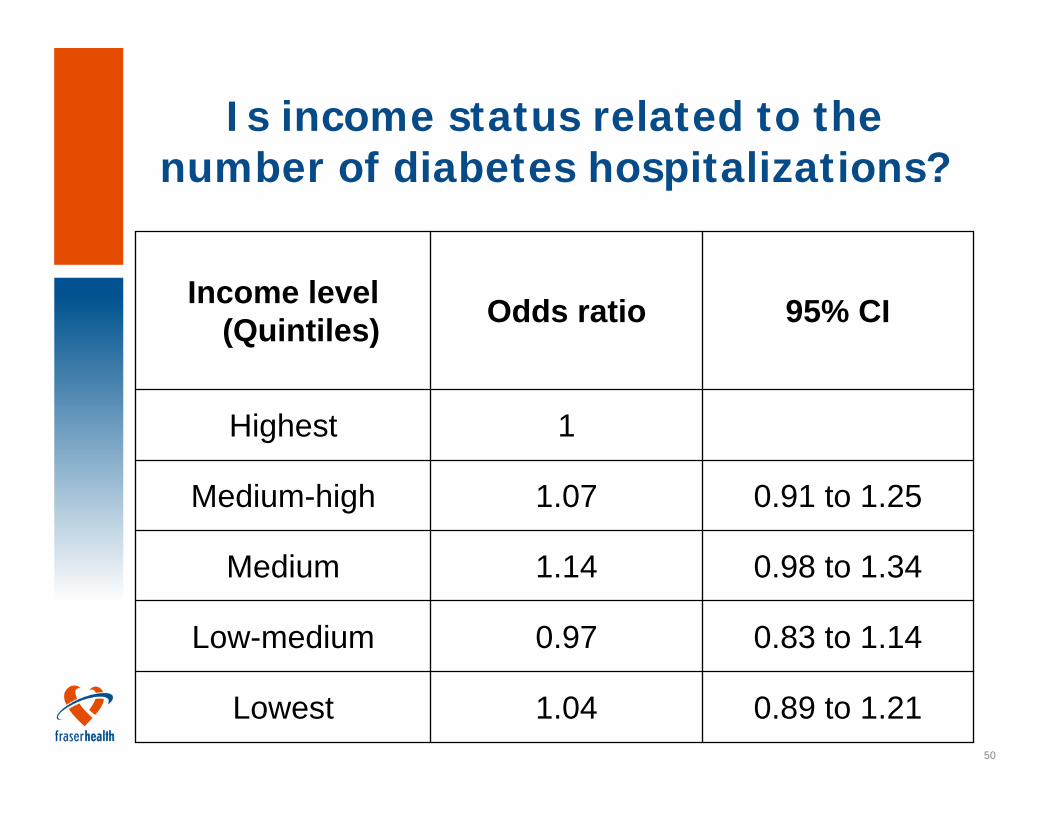
0.89 to 1.211.04Lowest
0.83 to 1.140.97Low-medium
0.98 to 1.341.14Medium
0.91 to 1.251.07Medium-high
1Highest
95% CIOdds ratioIncome level (Quintiles)
Is income status related to the number of diabetes hospitalizations?
51
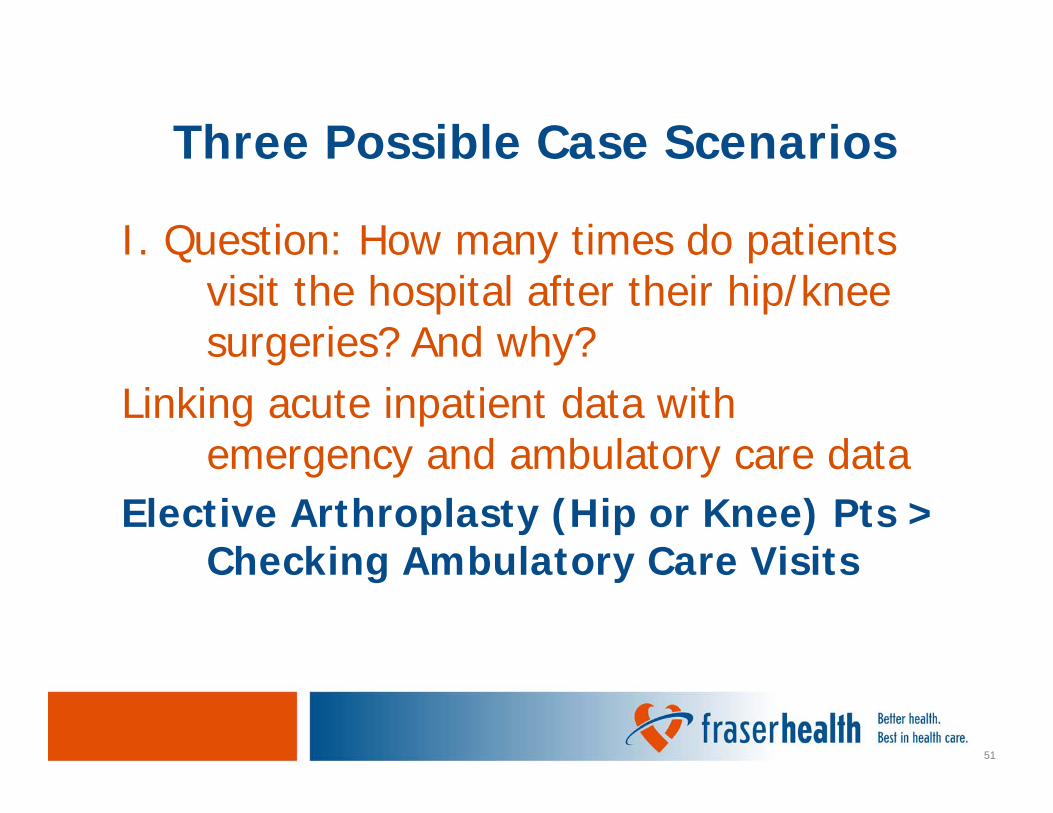
Three Possible Case Scenarios
I. Question: How many times do patients visit the hospital after their hip/knee surgeries? And why?
Linking acute inpatient data with emergency and ambulatory care data
Elective Arthroplasty (Hip or Knee) Pts > Checking Ambulatory Care Visits
52
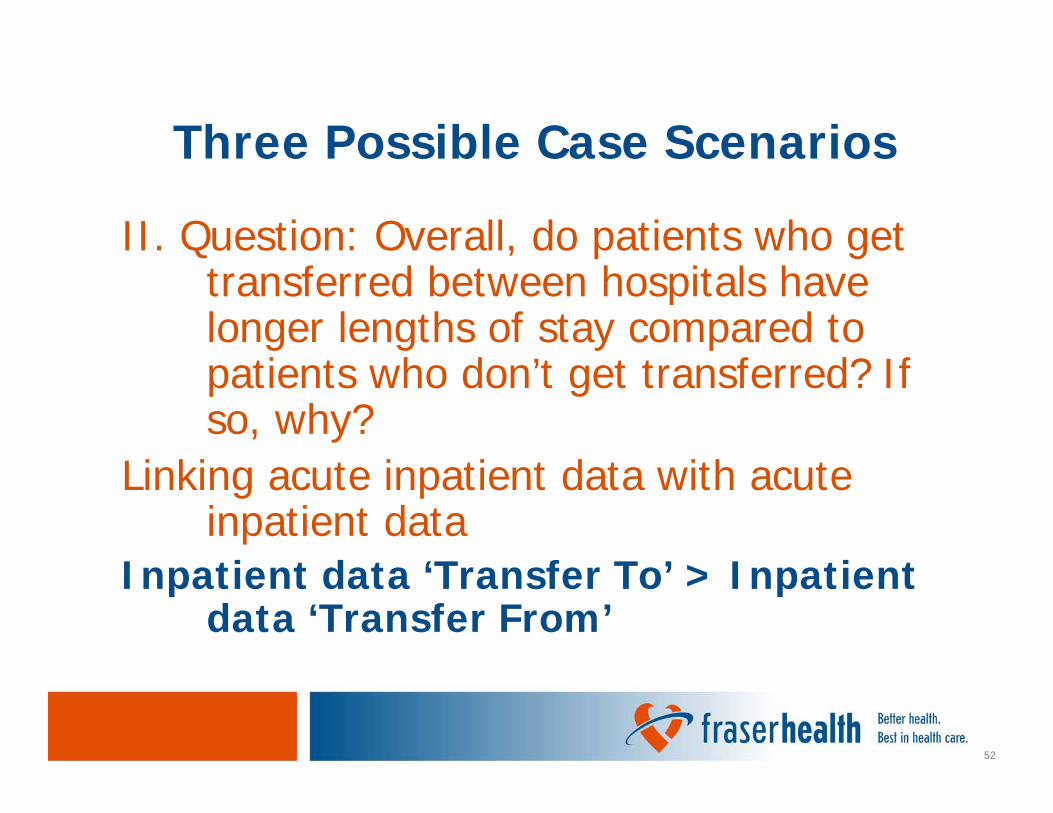
Three Possible Case Scenarios
II. Question: Overall, do patients who get transferred between hospitals have longer lengths of stay compared to patients who don’t get transferred? If so, why?
Linking acute inpatient data with acute inpatient data
Inpatient data ‘Transfer To’ > Inpatient data ‘Transfer From’
53
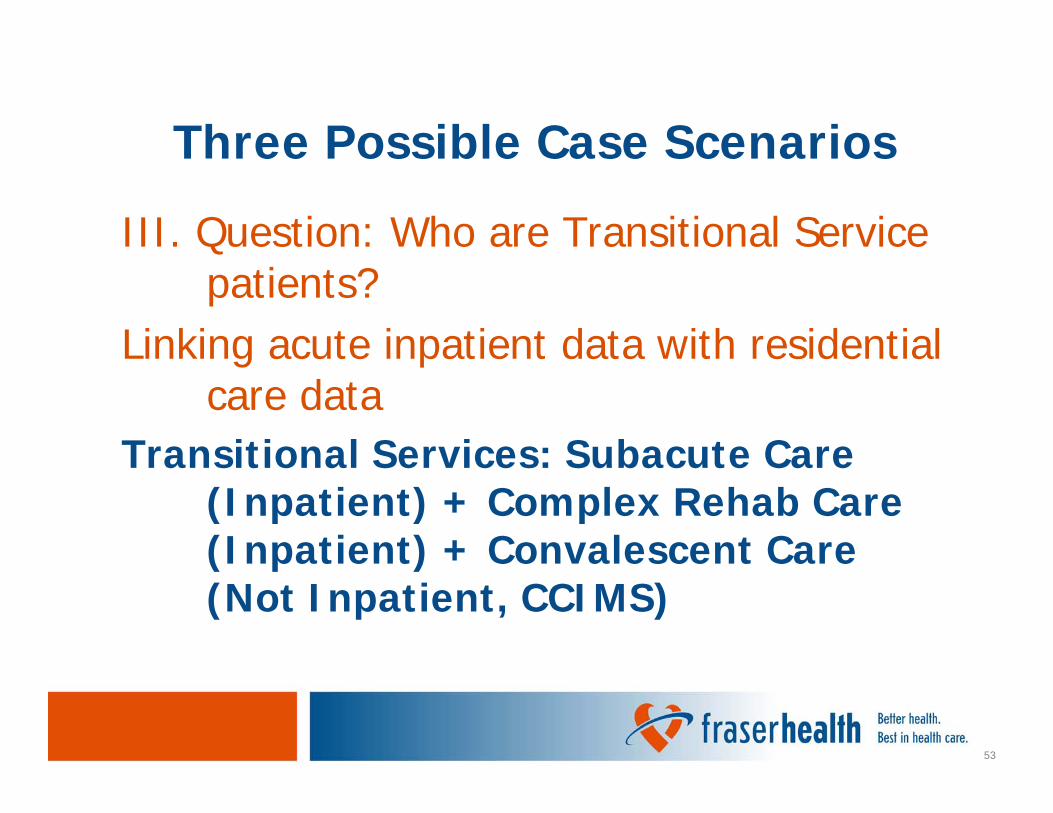
Three Possible Case Scenarios
III. Question: Who are Transitional Service patients?
Linking acute inpatient data with residential care data
Transitional Services: Subacute Care (Inpatient) + Complex Rehab Care (Inpatient) + Convalescent Care (Not Inpatient, CCIMS)
54
Accessing Health Data
55
What data do I needand how do I get it?
Formulate research questionExplore possible data sources and limitationsRefine research questionEBM framework (PICO):
P – PopulationI – InterventionC – ComparisonO - Outcomes
56
Health Reports Available
CIHI indicator reports - provide comparative information on
• the overall health of the population served • the major non-medical determinants of health in
the region • the health services received by the region's
residents • characteristics of the community or the health
system that provide useful contextual information- More information at secure.cihi.ca
57
Health Reports Available
Quantum Analyzer (Quantum Analytics Ltd.)
tool for displaying and analyzing summarized custom informationpopulation data , population health measures, health service volumes, financial data, labour hours information, workload statistics, efficiency measures, performance indicators, unit cost ratios
58
The role of Decision SupportProvide health information for the evaluation and planning of health services in FHSummarize and report data related to population demographics, health status and utilization of health servicesEndeavor to support research and evaluation related data needs
59
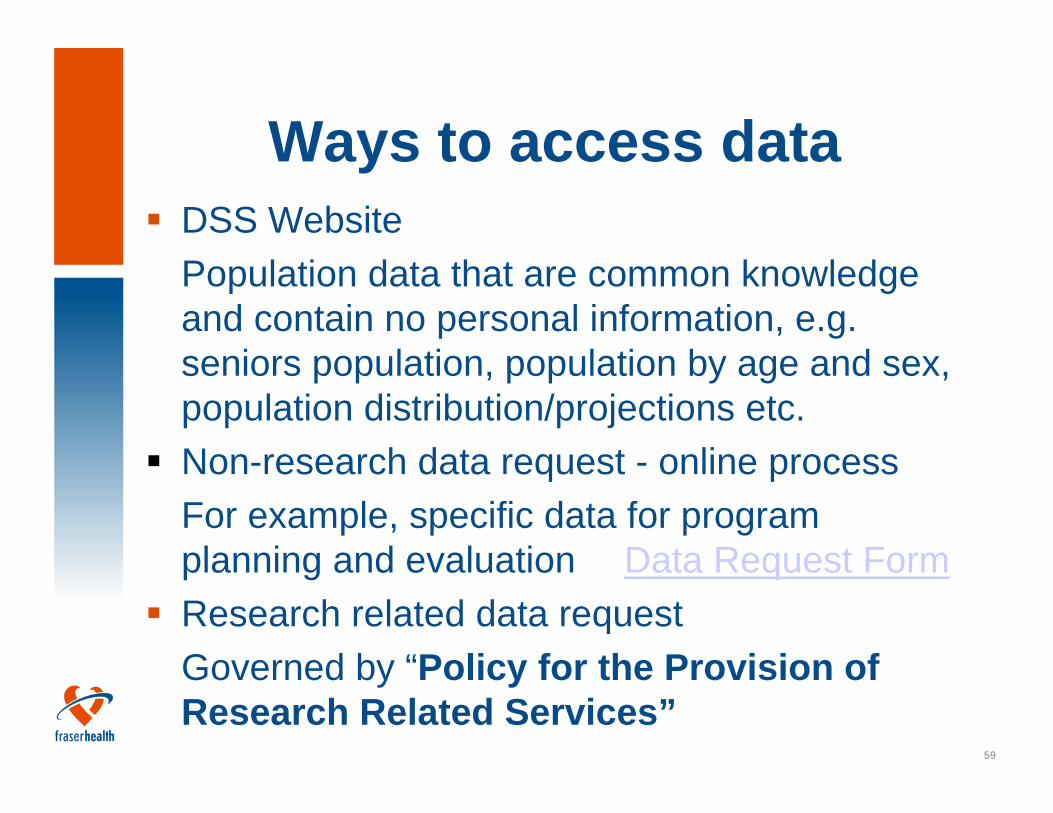
Ways to access dataDSS WebsitePopulation data that are common knowledge and contain no personal information, e.g. seniors population, population by age and sex, population distribution/projections etc. Non-research data request - online processFor example, specific data for program planning and evaluation Data Request FormResearch related data requestGoverned by “Policy for the Provision of Research Related Services”
60
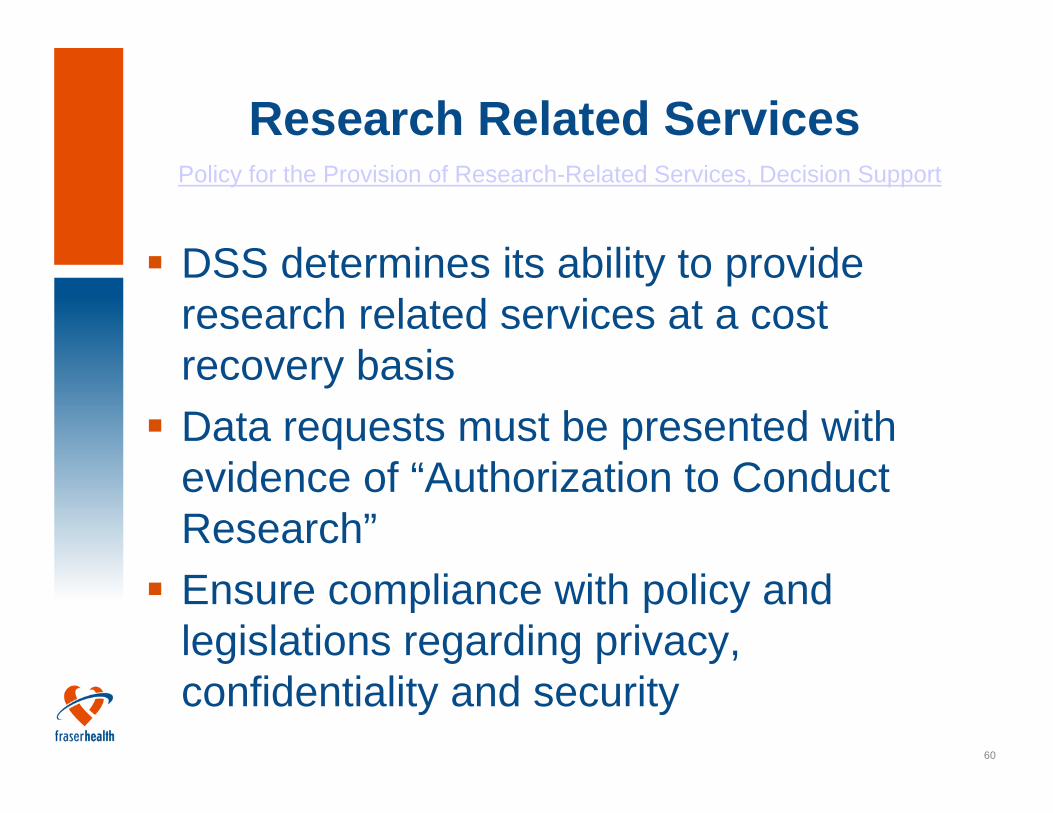
Research Related ServicesPolicy for the Provision of Research-Related Services, Decision Support
DSS determines its ability to provide research related services at a cost recovery basis Data requests must be presented with evidence of “Authorization to Conduct Research”Ensure compliance with policy and legislations regarding privacy, confidentiality and security
61
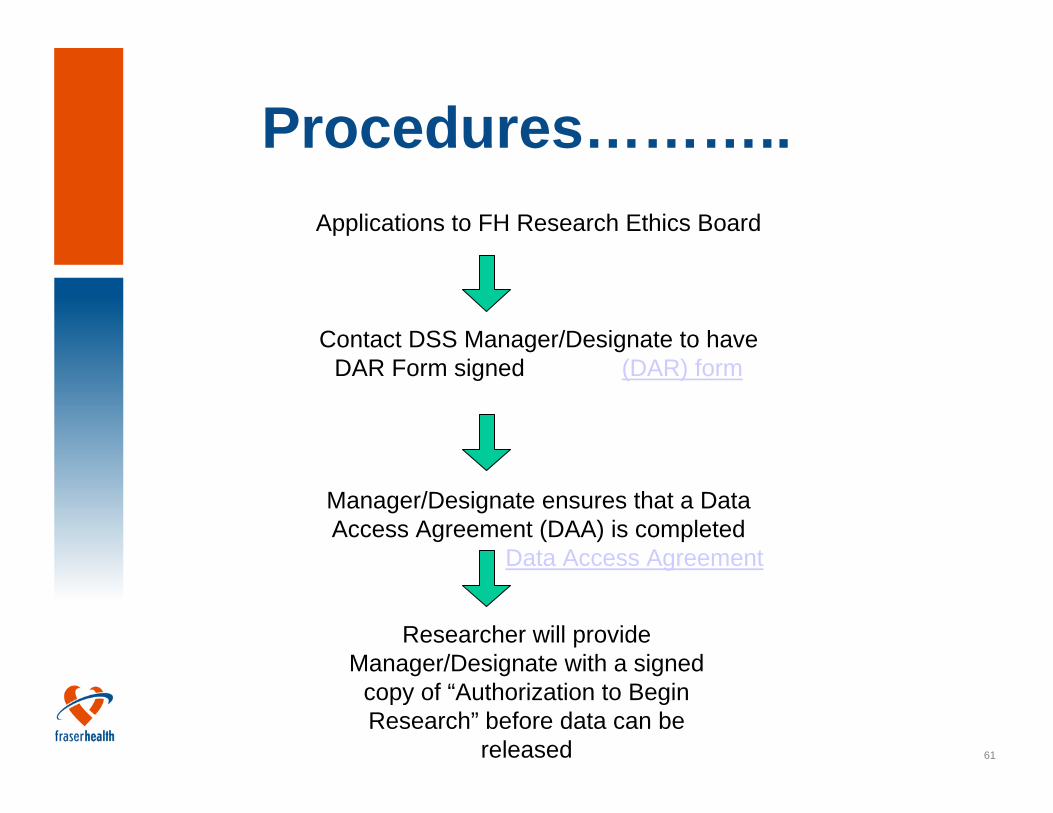
Procedures………..Applications to FH Research Ethics Board
Contact DSS Manager/Designate to have DAR Form signed (DAR) form
Manager/Designate ensures that a Data Access Agreement (DAA) is completed
Data Access Agreement
Researcher will provide Manager/Designate with a signed
copy of “Authorization to Begin Research” before data can be
released
62
Questions/Comments?