Embed Size (px)
Citation preview
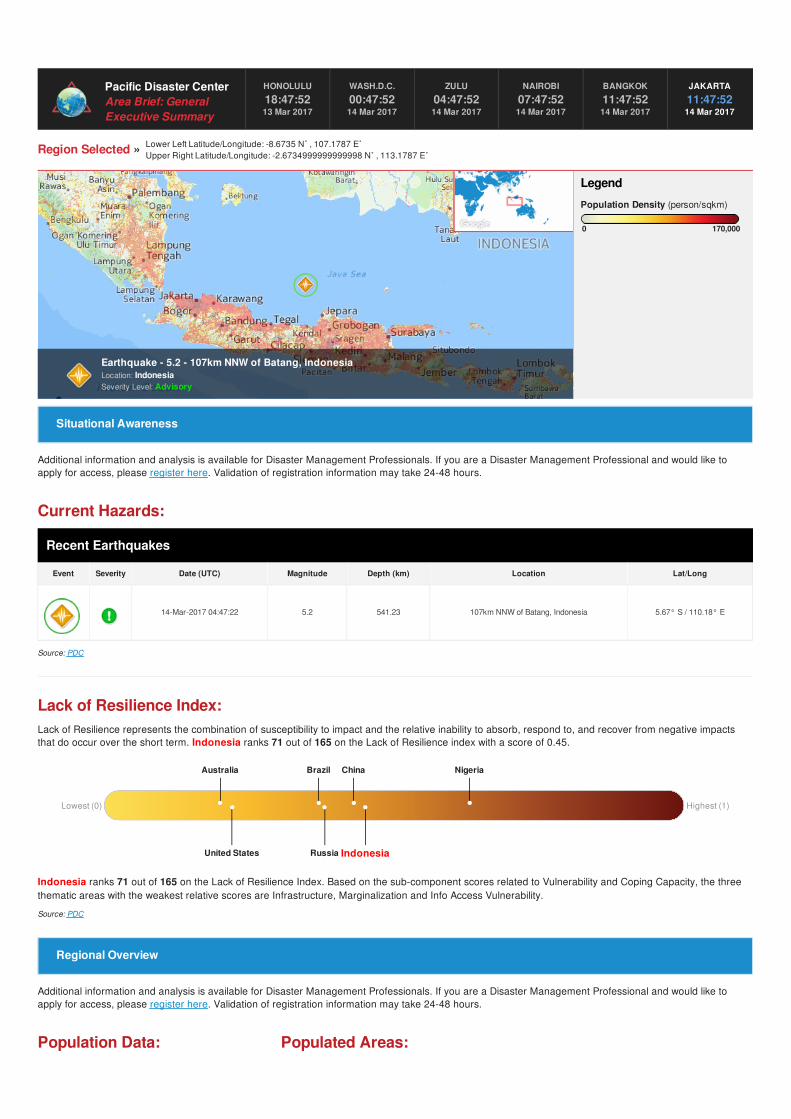
Pacific Disaster CenterArea Brief: GeneralExecutive Summary
HONOLULU
18:47:5213 Mar 2017
WASH.D.C.
00:47:5214 Mar 2017
ZULU
04:47:5214 Mar 2017
NAIROBI
07:47:5214 Mar 2017
BANGKOK
11:47:5214 Mar 2017
JAKARTA
11:47:5214 Mar 2017
Region Selected » Lower Left Latitude/Longitude: -8.6735 N˚ , 107.1787 E˚Upper Right Latitude/Longitude: -2.6734999999999998 N˚ , 113.1787 E˚
Current Hazards:
Recent Earthquakes
Event Severity Date (UTC) Magnitude Depth (km) Location Lat/Long
14-Mar-2017 04:47:22 5.2 541.23 107km NNW of Batang, Indonesia 5.67° S / 110.18° E
Source: PDC
Lack of Resilience Index:Lack of Resilience represents the combination of susceptibility to impact and the relative inability to absorb, respond to, and recover from negative impactsthat do occur over the short term. Indonesia ranks 71 out of 165 on the Lack of Resilience index with a score of 0.45.
Indonesia ranks 71 out of 165 on the Lack of Resilience Index. Based on the sub-component scores related to Vulnerability and Coping Capacity, the threethematic areas with the weakest relative scores are Infrastructure, Marginalization and Info Access Vulnerability.
Source: PDC
Population Data: Populated Areas:
170,000
Legend
Population Density (person/sqkm)
0
Additional information and analysis is available for Disaster Management Professionals. If you are a Disaster Management Professional and would like toapply for access, please register here. Validation of registration information may take 24-48 hours.
Additional information and analysis is available for Disaster Management Professionals. If you are a Disaster Management Professional and would like toapply for access, please register here. Validation of registration information may take 24-48 hours.
Earthquake - 5.2 - 107km NNW of Batang, IndonesiaLocation: IndonesiaSeverity Level: Advisory
Situational Awareness
Lowest (0) Highest (1)
Regional Overview
IndonesiaRussiaUnited States
Australia Brazil China Nigeria
2011
Total: 96, 879, 000Max Density: 93, 603(ppl/km2)
Source: iSciences
Surabaja - 1,000,000 to 4,999,999
Semarang - 1,000,000 to 4,999,999
Bandung - 1,000,000 to 4,999,999
Yogyakarta - 250,000 to 499,999
Multi Hazard Risk Index:Indonesia ranks 40 out of 165 on the Multi-Hazard Risk Index with a score of 0.56. Indonesia is estimated to have relatively high overall exposure, mediumvulnerability, and medium coping capacity.
Source: PDC
Lack of Resilience Index:Lack of Resilience represents the combination of susceptibility to impact and the relative inability to absorb, respond to, and recover from negative impactsthat do occur over the short term. Indonesia ranks 71 out of 165 on the Lack of Resilience index with a score of 0.45.
Indonesia ranks 71 out of 165 on the Lack of Resilience Index. Based on the sub-component scores related to Vulnerability and Coping Capacity, the threethematic areas with the weakest relative scores are Infrastructure, Marginalization and Info Access Vulnerability.
Source: PDC
Additional information and analysis is available for Disaster Management Professionals. If you are a Disaster Management Professional and would like toapply for access, please register here. Validation of registration information may take 24-48 hours.
Surabaja
Semar
ang
Bandung
Yogyaka
rta0
2 500 000
5 000 000
7 500 000
Risk & Vulnerability
LowestRisk (0)
HighestRisk (1)
Lowest (0) Highest (1)
Brazil ChinaUnited States
IndonesiaRussiaUnited States
IndonesiaAustralia Russia Nigeria
Australia Brazil China Nigeria
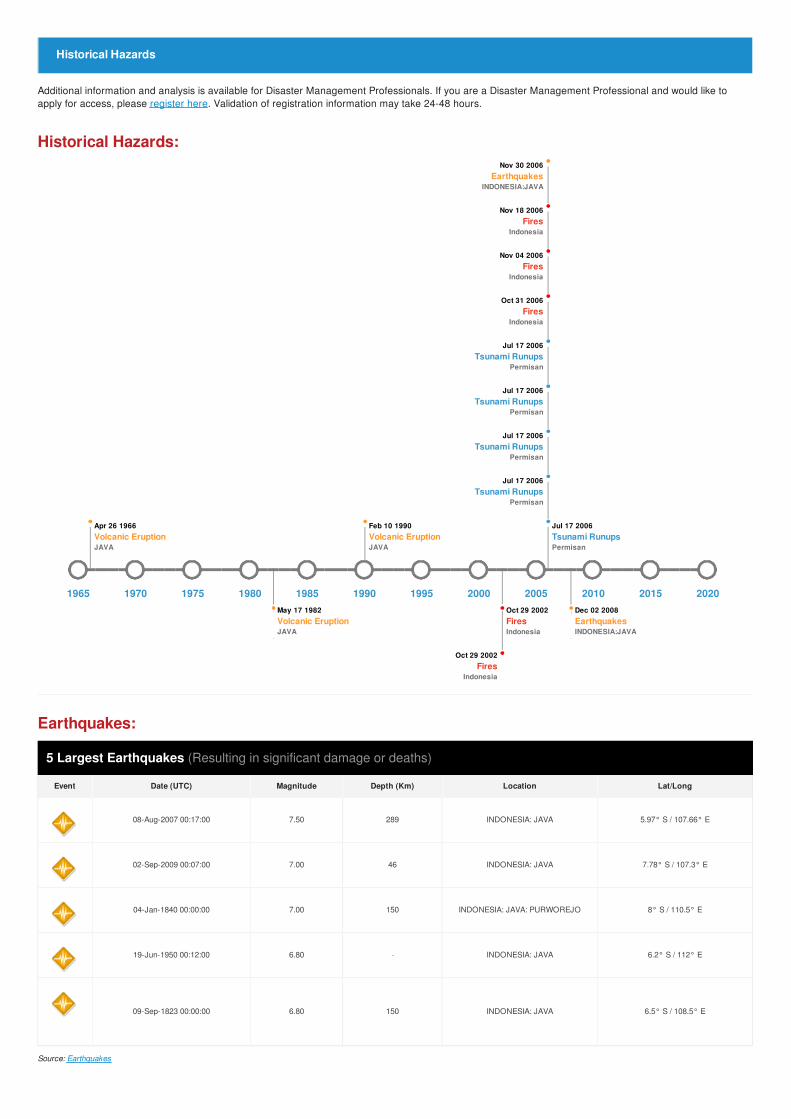
Historical Hazards:
Earthquakes:
5 Largest Earthquakes (Resulting in significant damage or deaths)
Event Date (UTC) Magnitude Depth (Km) Location Lat/Long
08-Aug-2007 00:17:00 7.50 289 INDONESIA: JAVA 5.97° S / 107.66° E
02-Sep-2009 00:07:00 7.00 46 INDONESIA: JAVA 7.78° S / 107.3° E
04-Jan-1840 00:00:00 7.00 150 INDONESIA: JAVA: PURWOREJO 8° S / 110.5° E
19-Jun-1950 00:12:00 6.80 - INDONESIA: JAVA 6.2° S / 112° E
09-Sep-1823 00:00:00 6.80 150 INDONESIA: JAVA 6.5° S / 108.5° E
Source: Earthquakes
Additional information and analysis is available for Disaster Management Professionals. If you are a Disaster Management Professional and would like toapply for access, please register here. Validation of registration information may take 24-48 hours.
Historical Hazards
Oct 29 2002Fires
Indonesia
May 17 1982Volcanic EruptionJAVA
Oct 29 2002FiresIndonesia
Dec 02 2008EarthquakesINDONESIA:JAVA
Nov 30 2006Earthquakes
INDONESIA:JAVA
Nov 18 2006Fires
Indonesia
Nov 04 2006Fires
Indonesia
Oct 31 2006Fires
Indonesia
Jul 17 2006Tsunami Runups
Permisan
Jul 17 2006Tsunami Runups
Permisan
Jul 17 2006Tsunami Runups
Permisan
Jul 17 2006Tsunami Runups
Permisan
Apr 26 1966Volcanic EruptionJAVA
Feb 10 1990Volcanic EruptionJAVA
Jul 17 2006Tsunami RunupsPermisan
1965 1970 1975 1980 1985 1990 1995 2000 2005 2010 2015 2020
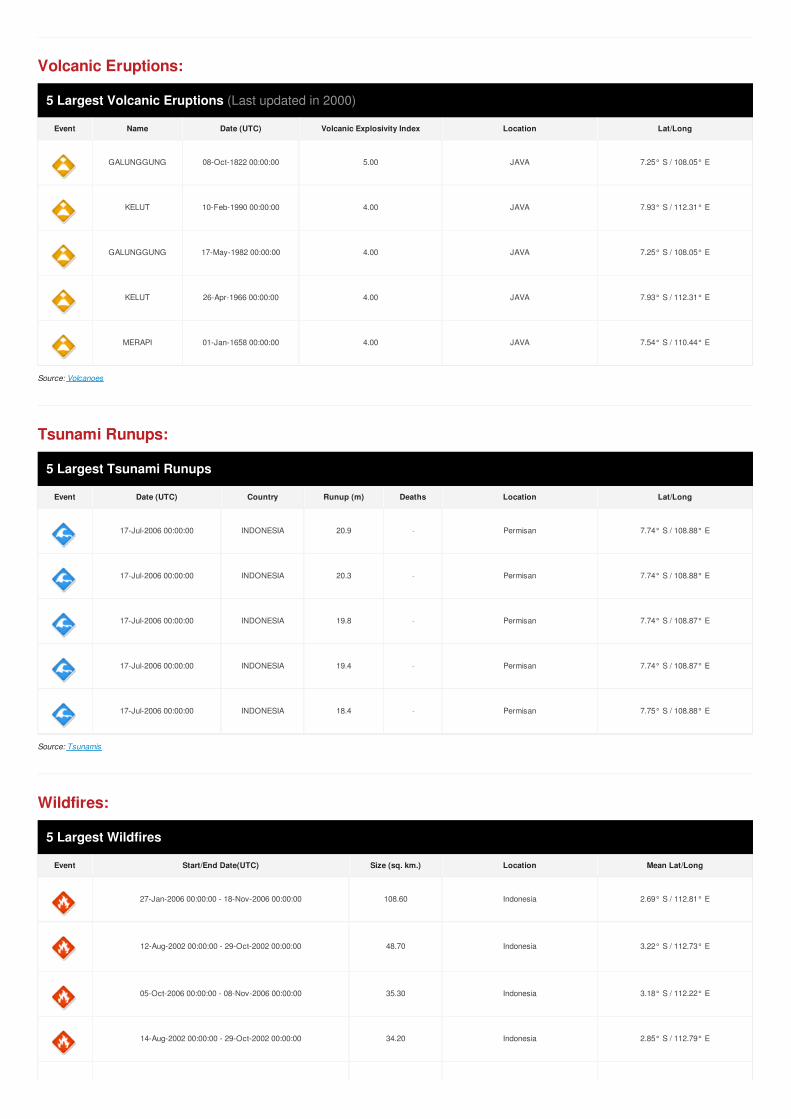
Volcanic Eruptions:
5 Largest Volcanic Eruptions (Last updated in 2000)
Event Name Date (UTC) Volcanic Explosivity Index Location Lat/Long
GALUNGGUNG 08-Oct-1822 00:00:00 5.00 JAVA 7.25° S / 108.05° E
KELUT 10-Feb-1990 00:00:00 4.00 JAVA 7.93° S / 112.31° E
GALUNGGUNG 17-May-1982 00:00:00 4.00 JAVA 7.25° S / 108.05° E
KELUT 26-Apr-1966 00:00:00 4.00 JAVA 7.93° S / 112.31° E
MERAPI 01-Jan-1658 00:00:00 4.00 JAVA 7.54° S / 110.44° E
Source: Volcanoes
Tsunami Runups:
5 Largest Tsunami Runups
Event Date (UTC) Country Runup (m) Deaths Location Lat/Long
17-Jul-2006 00:00:00 INDONESIA 20.9 - Permisan 7.74° S / 108.88° E
17-Jul-2006 00:00:00 INDONESIA 20.3 - Permisan 7.74° S / 108.88° E
17-Jul-2006 00:00:00 INDONESIA 19.8 - Permisan 7.74° S / 108.87° E
17-Jul-2006 00:00:00 INDONESIA 19.4 - Permisan 7.74° S / 108.87° E
17-Jul-2006 00:00:00 INDONESIA 18.4 - Permisan 7.75° S / 108.88° E
Source: Tsunamis
Wildfires:
5 Largest Wildfires
Event Start/End Date(UTC) Size (sq. km.) Location Mean Lat/Long
27-Jan-2006 00:00:00 - 18-Nov-2006 00:00:00 108.60 Indonesia 2.69° S / 112.81° E
12-Aug-2002 00:00:00 - 29-Oct-2002 00:00:00 48.70 Indonesia 3.22° S / 112.73° E
05-Oct-2006 00:00:00 - 08-Nov-2006 00:00:00 35.30 Indonesia 3.18° S / 112.22° E
14-Aug-2002 00:00:00 - 29-Oct-2002 00:00:00 34.20 Indonesia 2.85° S / 112.79° E

02-Aug-2006 00:00:00 - 04-Nov-2006 00:00:00 32.20 Indonesia 2.9° S / 112.41° EEvent Start/End Date(UTC) Size (sq. km.) Location Mean Lat/Long
Source: Wildfires
* As defined by the source (Dartmouth Flood Observatory, University of Colorado), Flood Magnitude = LOG(Duration x Severity x Affected Area). Severityclasses are based on estimated recurrence intervals and other criteria.
The information and data contained in this product are for reference only. Pacific Disaster Center (PDC) does not guarantee the accuracy of this data. Refer tooriginal sources for any legal restrictions. Please refer to PDC Terms of Use for PDC generated information and products. The names, boundaries, colors,denominations and any other information shown on the associated maps do not imply, on the part of PDC, any judgment on the legal status of any territory, orany endorsement or acceptance of such boundaries.
Disclosures