Embed Size (px)
Citation preview

Regina Official Community Plan
Working Paper
POPULATION, EMPLOYMENT AND ECONOMIC ANALYSIS OF
REGINA
Prepared for City of Regina Planning and Sustainability Department by Derek Murray Consulting and Associates
June 2010
Derek Murray Consulting and Associates i
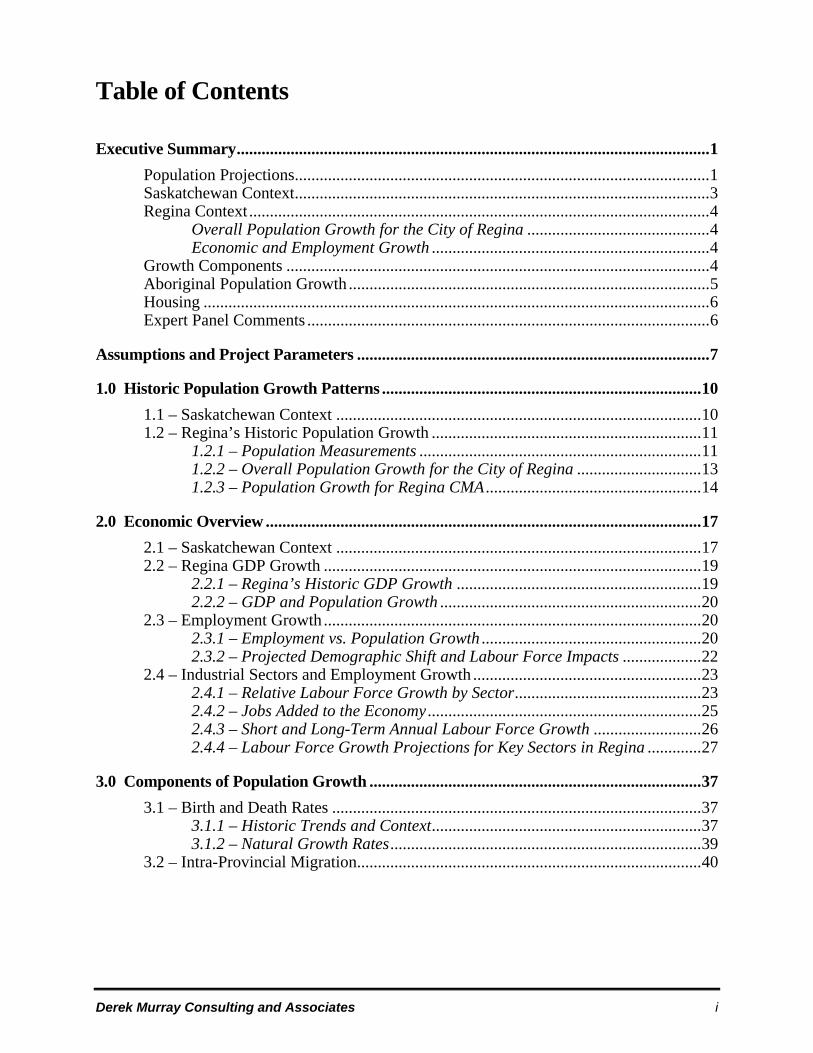
Table of Contents
Executive Summary..................................................................................................................1
Population Projections....................................................................................................1 Saskatchewan Context....................................................................................................3 Regina Context...............................................................................................................4
Overall Population Growth for the City of Regina ............................................4 Economic and Employment Growth ...................................................................4
Growth Components ......................................................................................................4 Aboriginal Population Growth .......................................................................................5 Housing ..........................................................................................................................6 Expert Panel Comments .................................................................................................6
Assumptions and Project Parameters .....................................................................................7
1.0 Historic Population Growth Patterns .............................................................................10
1.1 – Saskatchewan Context ........................................................................................10 1.2 – Regina’s Historic Population Growth .................................................................11
1.2.1 – Population Measurements ....................................................................11 1.2.2 – Overall Population Growth for the City of Regina ..............................13 1.2.3 – Population Growth for Regina CMA ....................................................14
2.0 Economic Overview .........................................................................................................17
2.1 – Saskatchewan Context ........................................................................................17 2.2 – Regina GDP Growth ...........................................................................................19
2.2.1 – Regina’s Historic GDP Growth ...........................................................19 2.2.2 – GDP and Population Growth ...............................................................20
2.3 – Employment Growth ...........................................................................................20 2.3.1 – Employment vs. Population Growth .....................................................20 2.3.2 – Projected Demographic Shift and Labour Force Impacts ...................22
2.4 – Industrial Sectors and Employment Growth .......................................................23 2.4.1 – Relative Labour Force Growth by Sector.............................................23 2.4.2 – Jobs Added to the Economy ..................................................................25 2.4.3 – Short and Long-Term Annual Labour Force Growth ..........................26 2.4.4 – Labour Force Growth Projections for Key Sectors in Regina .............27
3.0 Components of Population Growth ................................................................................37
3.1 – Birth and Death Rates .........................................................................................37 3.1.1 – Historic Trends and Context.................................................................37 3.1.2 – Natural Growth Rates...........................................................................39
3.2 – Intra-Provincial Migration...................................................................................40

Derek Murray Consulting and Associates ii
3.3 – Interprovincial Migration ....................................................................................42 3.3.1 – Net Interprovincial Migration ..............................................................42 3.3.2 – Sources of Interprovincial Migration ...................................................43 3.3.3 – Mobility of Interprovincial Migrants....................................................44
3.4 – Immigration.........................................................................................................45 3.4.1 – Immigration Trends and Policy ............................................................45 3.4.2 – Immigration Impacts.............................................................................46
3.5 – Aboriginal Population Growth............................................................................47
4.0 Population Forecasts........................................................................................................50
4.1 – Growth Projections..............................................................................................50 4.2 – Birth and Death Rates .........................................................................................50 4.3 – Intra-Provincial Migration...................................................................................51 4.4 – Inter-Provincial Migration...................................................................................52 4.5 – Immigration.........................................................................................................52 4.6 – Total Population Growth for Regina City ...........................................................54 4.7 – Externalities of Population Growth.....................................................................59
4.7.1 – Housing Demand ..................................................................................59 4.7.2 – Demand for Services.............................................................................61
4.8 – Regina CMA Growth ..........................................................................................61 4.9 – Regina’s Commuting Region Population Projections.........................................65 4.10 – Aboriginal Population Growth Projections.......................................................67
Appendix .................................................................................................................................69
List of Tables
Executive Summary
Table ES-1: Projected Population Growth for Regina City – 2010 to 2035 ............................... 1
Assumptions and Project Parameters
Economic Parameters for Population Growth ............................................................................... 7
1.0 – Historic Population Growth Patterns
Table 1-1: Breakdown of Respective Population Measures for Regina ................................. 11 Table 1-2: Regina Population Growth – 1996 to 2009 ........................................................... 13 Table 1-3: Regina Population Growth and Components (Census Data – 1996 to 2009) ........ 15 Table 1-4: Selected Growth Rates for Communities in Regina’s CMA – 1996 to 2006 ....... 15
2.0 – Economic Overview
Table 2-1: GDP Projections for Saskatchewan ..................................................................... 18 Table 2-2: Comparative Royalty Rates ................................................................................... 18 Table 2-3: Average Annual Labour Force Statistics and Annual Population Growth – Regina CMA ....................................................................... 21

Derek Murray Consulting and Associates iii
Table 2-4: Regina CMA Average Annual Population and Employment Growth 2000-2009 ................................................................................................ 22
Table 2-5: Regina CMA Labour Force Growth by Industrial Sector – 1987 to 2009 ............ 24 Table 2-6: Regina CMA Employment North American Industry Classification System ...... 26 Table 2-7: Regina CMA Labour Force Growth ..................................................................... 27 Table 2-8: Regina CMA Projected Labour Force Growth – Moderate
Economic Climate – 2010 to 2020 ....................................................................... 35 Table 2-9: Regina CMA Population Required to Support 2020 Labour Force ..................... 36
3.0 – Components of Population Growth
Table 3-1: Saskatchewan Total Fertility Rate (Births per Woman) ....................................... 37 Table 3-2: Regina CMA Migration – All Sources – 2003 to 2008 ........................................ 38 Table 3-3: Regina CMA – Natural Increase – Statistics Canada............................................. 40 Table 3-4: Saskatchewan Population Growth and Urbanization ............................................ 40 Table 3-5: Average Net Intraprovincial – Regina CMA ........................................................ 41 Table 3-6: Net Interprovincial Migration by Source – 2003 to 2008 ..................................... 43 Table 3-7: Regina CMA Capture Rate – Total In-migration form Other Provinces .............. 44 Table 3-8: Propensity to Return to Province of Origin – Interprovincial
Migrants Persons Aged 20 to 54) – 1991 to 2004.................................................. 44 Table 3-9: Saskatchewan Immigrant Nominees - Regina – 2000 to 2009 ............................. 45 Table 3-10: Landed Immigrants – Regina – 2000 to 2009 ....................................................... 46 Table 3-11: Regina, City Immigrants – 2006 ........................................................................... 47 Table 3-12: Regina City – Total Aboriginal Population .......................................................... 47 Table 3-13: Regina City – Aboriginal Population Growth – 1996 to 2006 ............................. 48 Table 3-14: Aboriginal Population Demographics ................................................................... 48 Table 3-15: Aboriginal Historical Growth Rates – Regina City 1951 to 2006 .........................49
4.0 – Population Forecasts
Table 4-1: Economic Parameters for Population Growth Projections .................................... 50 Table 4-2: Projected Immigrant Population of Regina City – 2010 to 2035 .......................... 54 Table 4-3: Population Growth Rates for Canadian Jurisdictions – 2001-2006....................... 56 Table 4-4: Growth Projections for Regina City – 2010-2035 ................................................ 58 Table 4-5: Projected Housing Demand – 2010 to 2035 ......................................................... 60 Table 4-6: Regina CMA – CMHC Rental Market Forecast – 2007 to 2010 .......................... 60 Table 4-7: Regina CMA – CMHC Housing Starts Forecast – 2008 to 2011 ......................... 61 Table 4-8: Projected Population Growth for Regina CMA – 2010 to 2035............................ 63 Table 4-9: Regina’s Urban Fringe as a Percentage of the CMA
Population – Population Growth – 1996 to 2006 .................................................. 64 Table 4-10: Components of Regina’s Community Region
Population Growth – 1996 to 2006 ....................................................................... 65 Table 4-11: Growth Projections for Regina’s Commuting Region – 2010 to 2035 ................. 67 Table 4-12: Aboriginal Population Growth Rates .................................................................... 67 Table 4-13: Forecast Aboriginal Population Growth ................................................................68

Derek Murray Consulting and Associates iv
Appendix
Regina CMA Urban Fringe Population Growth – 1996 to 2006 ................................................. 69 Growth Projections of CMA Urban Fringe – 2010 to 2035 ......................................................... 70 Regina Non-CMA Commuting Region – 1996 to 2006 ...............................................................71
List of Graphs
Executive Summary
Graph ES-1: Regina City Total Population Growth .................................................................... 2 Graph ES-2: Projected City Projected Annual Growth Rates ...................................................... 2
1.0 – Historic Population Growth Patterns
Graph 1-1: 25 Year Population Projections for Saskatchewan – Comparison Between Statistics Canada’s 2005 and 2010 Projections ....................................................... 9
Graph 1-2: Population Data for Regina ................................................................................... 12 Graph 1-3: Regina City Covered Population and Statistics Canada Annual Census
Population Estimates ............................................................................................. 13 Graph 1-4: Regina City Annual Growth – 1996 to 2009 ........................................................ 14
2.0 – Economic Overview
Graph 2-1: Comparative Percentage GDP Growth for Saskatchewan and Canada ............... 16 Graph 2-2: % Real GDP Growth for Regina CMA ................................................................. 18 Graph 2-3: Regina City Population vs. GDP Growth 1998 to 2009 ....................................... 19 Graph 2-4: Regina CMA – 1987 – 2009 -- Labour Force Growth and
Unemployment Rates ............................................................................................ 20 Graph 2-5: Regina CMA Population vs. Total Employed 1987 to 2009 ................................. 21 Graph 2-6: Impact of Interprovincial Immigration, Labour Force Participation and
International Migration on Saskatchewan Labour Force Growth ........................ 22 Graph 2-7: Regina CMA – Growth in Employment by Sector 1987-2009 ............................ 24
3.0 – Components of Population Growth
Graph 3-1: Regina CMA In-Migration 2005 to 2008 International, Interprovincial and Intraprovincial Net In-Migration .................... 38
Graph 3-2: Population Data for Regina ................................................................................... 39 Graph 3-3: Net Intraprovincial Migration – Regina CMA ...................................................... 41 Graph 3-4: Net Interprovincial Migration .............................................................................. 42 Graph 3-5: Employment vs. Interprovincial Migration ........................................................... 42 Graph 3-6: International Immigration to Regina CMA .......................................................... 46 Graph 3-7: Regina Aboriginal Population Growth Rate 1951-2006 ....................................... 49

Derek Murray Consulting and Associates v
4.0 – Population Forecasts
Graph 4-1: Natural Increase Projections for Regina City ....................................................... 51 Graph 4-2: Intra-provincial Migration Projections for Regina City ....................................... 51 Graph 4-3: Intra-provincial Migration Projections for Regina City ........................................ 52 Graph 4-4: Immigration Projections for Regina City ............................................................. 53 Graph 4-5: Annual Growth Projections for Regina City ......................................................... 55 Graph 4-6: Population Projections for Regina City ................................................................. 56 Graph 4-7: Components of High Growth Scenario ................................................................ 57 Graph 4-8: Components of Medium Growth Scenario ........................................................... 57 Graph 4-9: Components of Low Growth Scenario .................................................................. 58 Graph 4-10: Projected Population of 235,000 for Regina City ................................................ 59 Graph 4-11: Total Projected Regina CMA Population ............................................................. 62 Graph 4-12: Regina CMA Urban Fringe Growth Projections ................................................... 64 Graph 4-13: Regina Commuting Areas Population Projections ................................................. 66
Appendix
High Growth Scenario – Working Age Population and Dependency Ratio ................................ 72 High Growth Scenario – Population Projections by Age Group ................................................. 72 Medium Growth Scenario – Working Age Population and Dependency Ratio .......................... 73 Medium Growth Scenario – Population Projections by Age Group ............................................ 73 Low Growth Scenario – Working Age Population and Dependency Ratio ................................ 74 Low Growth Scenario – Population Projections by Age Group .................................................. 74
List of Maps
Map 4.1 Regina City Boundaries .............................................................................................. 54
Map 4.2 Regina Census Metropolitan Area ............................................................................. 61
Map 4.3 Regina Commuting Area ........................................................................................... 65
Population, Employment and Economic Analysis of Regina – Executive Summary
Derek Murray Consulting and Associates 1
Executive Summary This document is one of the supporting pieces in the development of the City of Regina Official Community Plan (OCP). The study identifies current economic trends and provides population and employment projections. This information will establish a common understanding with respect to prospects for future growth, opportunities, and challenges, based on the most current data available. The analysis and data in this study provide a comprehensive base of analysis regarding Regina’s economy, population, and employment in support of future studies and consultations to be undertaken as part of the OCP process.
The prime study area is the City of Regina as it is the area of focus for policy and other considerations. Analysis has also been completed at the Census Metropolitan Area (CMA) level as it is reflective of the service area for Regina in terms of the total population employed in Regina and served by Regina. The Regina commuting area and commuting patterns were examined, although the availability of this data is more limited.
Population Projections
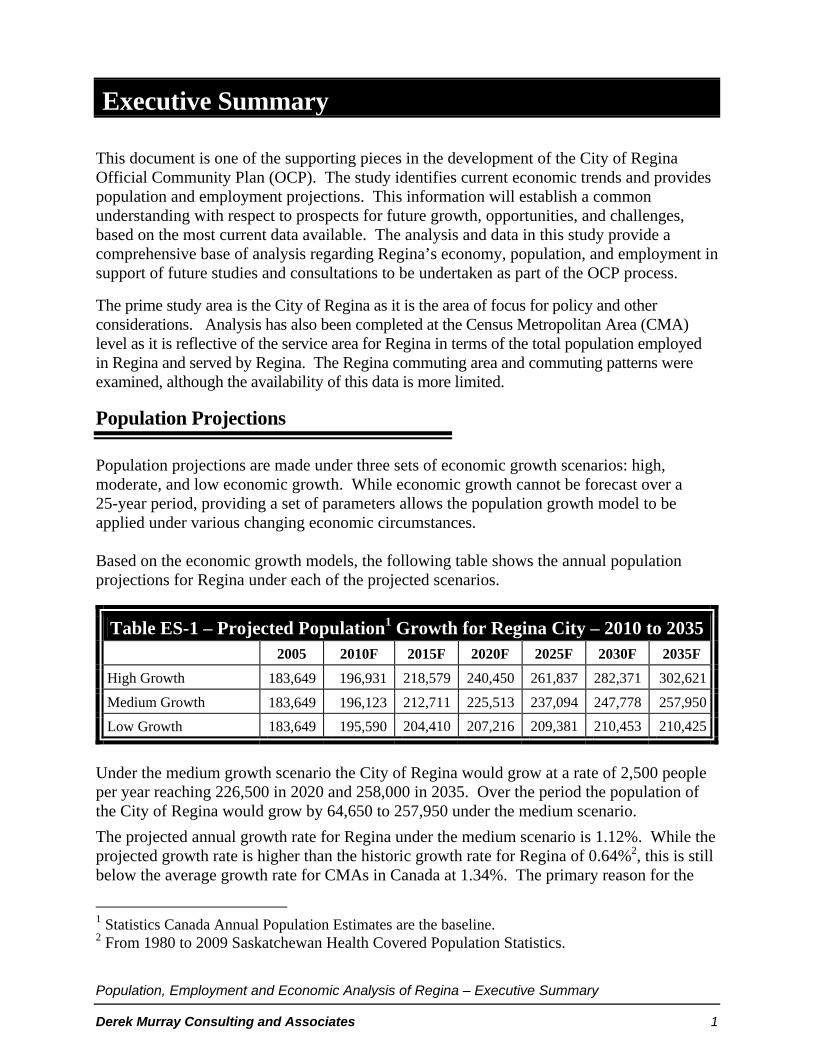
Population projections are made under three sets of economic growth scenarios: high, moderate, and low economic growth. While economic growth cannot be forecast over a 25-year period, providing a set of parameters allows the population growth model to be applied under various changing economic circumstances. Based on the economic growth models, the following table shows the annual population projections for Regina under each of the projected scenarios.
Table ES-1 – Projected Population1 Growth for Regina City – 2010 to 2035 2005 2010F 2015F 2020F 2025F 2030F 2035F
High Growth 183,649 196,931 218,579 240,450 261,837 282,371 302,621
Medium Growth 183,649 196,123 212,711 225,513 237,094 247,778 257,950
Low Growth 183,649 195,590 204,410 207,216 209,381 210,453 210,425
Under the medium growth scenario the City of Regina would grow at a rate of 2,500 people per year reaching 226,500 in 2020 and 258,000 in 2035. Over the period the population of the City of Regina would grow by 64,650 to 257,950 under the medium scenario.
The projected annual growth rate for Regina under the medium scenario is 1.12%. While the projected growth rate is higher than the historic growth rate for Regina of 0.64%2, this is still below the average growth rate for CMAs in Canada at 1.34%. The primary reason for the
1 Statistics Canada Annual Population Estimates are the baseline. 2 From 1980 to 2009 Saskatchewan Health Covered Population Statistics.

Population, Employment and Economic Analysis of Regina – Executive Summary
Derek Murray Consulting and Associates 2
increase is the projected level of international immigration for the city. The increase in immigration alone, driven by labour shortages and projected retirements, will add between .5% and 1.0% growth for Regina on an annual basis. The following graph shows the growth patterns for Regina city over the 25-year period.
Graph ES-1 – Regina City Total Population Growth
The following graph shows the projected annual total growth for Regina under each of the projection scenarios.
Graph ES-2 – Regina City Projected Annual Growth Rates

Population, Employment and Economic Analysis of Regina – Executive Summary
Derek Murray Consulting and Associates 3
Based on the above annual growth, the following growth patterns are projected under the respective economic circumstances:
Under a high growth scenario, Regina’s population would grow to 302,621 in 2035 at an average annual growth rate of 4,204 people per year or an average annual growth rate of 1.74%.
Under medium projections based on moderate economic growth, Regina would grow to a size of 257,950 in 2035 at a rate of 2,486 per year or a 1.12% annual growth rate.
Based on the low growth model, Regina would grow to a population of 210,246 by 2035 at an annual growth rate of 658 people per year or a 0.33% annual growth rate.
Regina CMA – Under the medium growth scenario Regina CMA would grow by 72,000 residents to 282,000 by 2035. Consistent high economic growth in the region would see the population growing to 328,000 by 2035. Under the low growth scenario Regina CMA would grow to 233,000 by 2035.
Regina Commuting Area – Under a medium growth scenario Regina CMA and the surrounding commuting area will grow from 224,000 in 2009 to 296,000 by 2035 (not including Moose Jaw). Under the high growth scenario the population would grow to 341,000. If Moose Jaw were included, the commuting region population would reach nearly 400,000 by 2035 under the high growth scenario. Under the low growth scenario, Regina’s commuting area would grow from 224,000 in 2009 to 247,000 in 2035.
Saskatchewan Context
Population Growth
Population growth patterns and population growth projections for Saskatchewan and its respective jurisdictions have changed significantly in the past four years. These changes include: Reversing the long-term trend of out-migration Strong economic growth has led to employment and population growth Labour shortages due to strong economic activity Migration towards areas of higher economic activity such as the major centres Statistics Canada population growth projections recently released show projected growth
for the province of 6,600 on an annual basis, contrasting with previous projections that identified population loss as a forecast.
Economic Growth
Saskatchewan led the country in terms of economic growth in 2007 and 2008 and has been far less impacted than other jurisdictions by the economic downturn in 2009. Major factors in the Saskatchewan economic context include:
The global recession has impacted key commodity prices for the province, however, prices are projected to rebound in 2010.
Population, Employment and Economic Analysis of Regina – Executive Summary
Derek Murray Consulting and Associates 4
Saskatchewan continued to add jobs in 2009 (up 1.5% vs. 0.9% nationally)
Saskatchewan has maintained low unemployment levels (4.7% in 2009 vs. 8.4% for Canada).
With the exception of 2009, Saskatchewan is projected to maintain positive GDP growth.
Projections for Saskatchewan indicate that Saskatchewan’s economy may not lead the country, as in years past, but will maintain solid economic growth.
Regina Context
Overall Population Growth for the City of Regina
Between 1996 and 2009 Regina’s population grew by 7,631, or an average annual rate of 540 people per year.
Regina’s population actually shrank by an average of 625 people between 1996 and 2002.
While Regina lost residents from 1996 to 2002 the city grew by 11,382 (6.3%) between 2003 and 2009 at an average of 1,626 between 2003 and 2009.
This was the most significant and sustained continuous population growth for the city since the early 1980s.
Economic and Employment Growth
Over the past ten years employment in the Regina CMA has grown by 1,438 annually while the population has only grown by 1,215. This level of job growth cannot be sustained without increased population. Additional employment will require additional working age people in Regina.
Based on moderate economic growth Regina’s economy will add an estimated 17,800 jobs growing to a labour force of 134,000 by 2020. To support the addition of 17,800 jobs, or 1,600 new jobs annually, the population of Regina must grow. With high participation rates and low unemployment, new job creation requires new entrants (immigration) to the labour market. Current population projections indicate that Regina will continue to face labour shortages given the recent economic growth and the declining working age population.
In terms of the number of jobs added to the economy over the past 24 years, the finance, insurance and real estate and professional, scientific and technical sectors led the way adding 5,800 jobs comprising over a quarter of all job growth. Health care, social assistance and construction also were growing sectors for Regina.
Growth Components
Natural Growth – Birth rates have been falling in North America since the mid 1980s. The decline in birth rates meant that, since the early 1980s, Regina’s population has not been replacing itself. This will eventually lead to a negative natural population growth. While birth rates have been generally declining, Regina has had a recent spike in fertility rates
Population, Employment and Economic Analysis of Regina – Executive Summary
Derek Murray Consulting and Associates 5
leading to a small ‘baby boom’. This is consistent with national trends, but is more pronounced in Regina with a 17% increase in births over six years. One explanation is that people in their prime years of fertility are also of the highest mobility. The strong economic conditions over the past several years have meant an increase in the number of people moving to Regina, as well as a greater retention of young people.
The rise in birth rates will be a short-term trend based on demographics. The aging population will eventually counteract the rise in fertility in segments of the population leading to a return in the overall decline in fertility rates.
Interprovincial Migration – Interprovincial migration has, on average, been a drain on Regina’s population. Recent economic strength in Regina’s economy has resulted in positive in-migration from other provinces. The most recent trend is quite positive, but does not overwhelmingly indicate that Regina has broken the long-term trend of interprovincial out-migration. Some other observations regarding interprovincial migration include:
Regina is not capturing a high share of interprovincial migrants.
Ontario and Alberta are the major sources of in-migrants.
Interprovincial migrants remain mobile after the primary move.
Intra-provincial Migration – The major source of this in-migration is urbanization as individuals move from rural areas to Regina. Given the level of urbanization to date, the capacity for rural Saskatchewan to continue to provide significant levels of in-migration is becoming strained. However, the net in-migration will remain positive as urbanization remains a force. This trend will continue at some level for the foreseeable future.
Immigration Trends and Policy – The Saskatchewan Ministry of Advanced Education, Employment and Labour has recently enhanced their Immigration Program, set new targets, and dramatically increased the attraction of immigrants to Saskatchewan. The 2010 target for Saskatchewan is 3,400 immigrant nominations. This target will result in over 10,000 new permanent residents when spouses and dependent children are added. The projected capture for Regina will be 3,300 immigrants annually.
Immigration has grown to become the largest component of population growth for Regina with over 2,000 immigrants in 2009 alone. Considering the current labour force shortages due to economic growth in the city and the projected labour force due to the aging population, international immigration is a key component in Regina’s long-term economic and population growth.
Aboriginal Population Growth
In 2006 the Census Aboriginal population of Regina was 16,535, an increase of 1,240 over 2001 or an annual growth rate of 250. From 2001 to 2006, Regina’s Aboriginal population grew at almost half the rate of the previous five years. Fertility rates were down slightly over the period. It is also likely that the broader out-migration trend in the community also had an impact on the city’s Aboriginal population. It is likely that recent higher in-migration patterns can be extended to the Aboriginal population.

Population, Employment and Economic Analysis of Regina – Executive Summary
Derek Murray Consulting and Associates 6
Aboriginal population growth will continue to outpace non-Aboriginal population growth. It is estimated that Regina’s Aboriginal population will grow by 2.4% annually under moderate conditions. In this scenario, the Regina’s Aboriginal population would reach 23,230 by 2021 and 29,140 by 2031. These numbers do not include the widely recognized undercount of the Aboriginal population in the Census, but they indicate the trend.
Housing
The analysis indicates that, over the next ten years there would be a demand for 1,100 to 1,500 units per year under the medium growth conditions. High growth conditions would result in a demand for 1,600 to 2,000 new housing units per year. Slow growth would result in a demand for 1,000 units per year falling to 500 units per year by 2016. These estimates are based on current average household size for the city.
Expert Panel Comments
An Expert Panel with academic, government and business backgrounds was asked to review a draft of the study. A summary is available on request. Some key observations were:
Projections can be greatly affected by unknown events such as the recent international financial crisis and must always be viewed with caution. Saskatchewan is especially subject to boom-bust cycles in its primary industries.
The Panel did not endorse a specific projection, but felt that the realistic scenario would be growth in the slow to medium range since the high growth projection would call for a series of positive events over a sustained period of time.
It should be recognized that the medium growth scenario, which is the focus of this report, is based on the assumption that the recent trend of positive growth will continue for a short period and will moderate, but remain positive over the long term. This is a change from the longer-term historic pattern of very slow growth. (The difference is primarily due to strong economic trends and the impact of the Province’s new immigration policy, which was first seen in 2008.)
The report indicates that immigration will be a key component of Regina’s population for some time. Retention of immigrants is currently quite high, but retention and patterns in the labour force need to be monitored to determine if the impact is sustained.
Housing sizes are subject to change and this could affect the number of housing units and land requirements.
Population growth in the rural fringe of the Regina CMA and the main commuting area could affect the growth of the City’s population. (The report takes these trends into consideration, but they are subject to change and impacts on the city should be monitored.)

Population, Employment and Economic Analysis of Regina – Executive Summary
Derek Murray Consulting and Associates 7
Assumptions and Project Parameters
To create the three population growth scenarios key assumptions have been made. These assumptions revolve primarily around the labour market, the economy, and immigration. First, the report is based on population projections, not predictions. The purpose of this report is to gain a greater understanding of how Regina’s population will grow over the next 25 years, not to predict population growth. The following outlines some of the key assumptions being made in this report.
Economic Parameters – Economic circumstances are the strongest driver of population growth in Regina. Changes in Regina’s economy can dramatically impact Regina’s population growth. To that end, the high, moderate, and low scenarios have been paired with the economic circumstances that would lead to that level of growth. The following three scenarios show the circumstances considered for each of the population growth components.
Economic Parameters for Population Growth Components Rates
GDP Growth 3.0% - 5.0% Unemployment Rate 4.0% - 5.0% High Economic Growth
Participation Rate 69% - 71% GDP Growth 1.5% - 3.0%
Unemployment Rate 5.0 % - 6.0% Moderate Economic Growth
Participation Rate 68% - 69% GDP Growth 0.0% – 1.5%
Unemployment Rate 6.0% - 8.0% Low Economic Growth
Participation Rate 66% - 67%
Should economic circumstances exceed or fall short of the above outlined circumstances for sustained periods, the projections would be impacted.
Demographic Parameters – It is assumed that, as the baby boom generation ages that the participation rate of people over the age of 15 will decline. As the larger than average cohort of baby boomers enters their retirement years the percentage of people in their working years will decline. It is also assumed that increased labour productivity will not compensate for the declining participation rate leading to increased demand for labour. While it is possible that increased labour productivity could reduce the impact of retiring baby boomers, there is no evidence to suggest that this will occur at this point.
Immigration Parameters – It is assumed that, under moderate economic circumstances, Saskatchewan’s immigration policy will remain largely unchanged in the short term. Based on increased demand for labour in Saskatchewan has led the Ministry of Advanced Education, Employment and Labour to enhance their Immigration Program, set new targets, and increase the attraction of immigrants to Saskatchewan. After reviewing labour force and

Population, Employment and Economic Analysis of Regina – Executive Summary
Derek Murray Consulting and Associates 8
demographic projections it is assumed that the demand for skilled labour will remain for some time. It is also projected that the demand to immigrate to Saskatchewan will remain strong based on the backlog of applicants at both the federal and provincial levels.
The Immigrant Nominee Program has been developed and expanded to facilitate the immigration of key skills, meet labour force shortages, and strengthen the labour market in preparation for the retirement of baby boomers. It is assumed that, under moderate economic circumstances that this program will remain in place for the foreseeable future and that targets will be only moderately reduced over time. Based on the current and projected labour force shortages it is assumed that the need for this program will remain and the projected 10,000 annual immigrants to Saskatchewan will remain in place.
Under moderate economic circumstances the total number of immigrants coming through the program would decline as some labour force shortages were addressed. Under low economic circumstances the program would be phased out as labour shortages subside and immigration would return to historic levels. Under a high economic growth scenario the program would continue to operate at 10,000 immigrants per year (to Saskatchewan) for the foreseeable future.
It is also assumed that Regina will continue to capture between 32% and 35% of the total immigration to Saskatchewan. This is based on historic data, the data relating to the intentions of future immigrants, and the tendency for immigrants to move to urban centres.
Fertility and Natural Growth Assumptions – It is assumed that fertility rates will continue to fall for Regina. While there has been a short term rise in fertility rates it is assumed that the rates will begin to fall again as the population ages and more people exit their prime fertility years. The aging population will counteract the rise in fertility in segments of the population leading to a return in the overall decline in fertility rates.
Interprovincial Migration – Under a moderate growth scenario interprovincial migration would continue to be negative. While Regina has had positive interprovincial migration for the past three years, a strengthening economy in other parts of Canada and a slowing of the fast paced economic growth in Regina will result in net interprovincial out-migration. Only under a high economic growth scenario would Regina continue to see positive interprovincial migration.
Intraprovincial Migration – Intraprovincial migration will continue to be positive as urbanization will continue as a driving force. However, given the level of urbanization to date, the capacity for rural Saskatchewan to continue to provide significant levels of in-migration is strained. The net in-migration will remain positive as urbanization remains a force, but not at the historic high levels seen in the past. This trend will continue at some level for the foreseeable future. Metro Adjacent Growth – It is assumed that metro adjacent population growth will not be a significant drain on municipal population growth.
Population, Employment and Economic Analysis of Regina – Executive Summary
Derek Murray Consulting and Associates 9
Population,
Employment and
Economic Analysis of Regina

Population, Employment and Economic Analysis of Regina
Derek Murray Consulting and Associates 10
1.0 Historic Population Growth Patterns
1.1 – Saskatchewan Context
Population growth patterns and population growth projections for Saskatchewan and its respective jurisdictions have changed significantly in the past four years. Reversing a long-term trend of out-migration, strong economic growth has led to employment and population growth within Saskatchewan. Labour shortages, due to strong economic activity, have led to in-migration from other regions of Canada and the world. Provincially, there has also been a migration towards areas of higher economic activity such as the major centres.
The most recent (May, 2010) provincial population projections released by Statistics Canada show a much different projection than similar projections made five years ago (2005). As the following table shows the most recent projections for Saskatchewan have been increased with the new low growth scenario exceeding the previous high growth scenario projections.
Graph 1.1 – 25 Year Population Projections for Saskatchewan – Comparison Between Statistics Canada’s 2005 and 2010 Projections
Total Growth Annual Growth Percentage Annual Growth
2010 Low-growth 84,800 3,260 0.32%
2010 Medium-growth 171,000 6,580 0.63%2010 High-growth 261,200 10,050 0.97%2005 Low-growth -54,700 -2,100 -0.21%2005 Medium-growth -18,000 -690 -0.07%2005 High-growth 26,700 1,030 0.10%
Projected – Statistics Canada – Population Projections 2005 Catalogue No. 91-520 2010 Projections - CANSIM 052-0005

Population, Employment and Economic Analysis of Regina
Derek Murray Consulting and Associates 11
While the economic outlook remains guardedly optimistic for both Saskatchewan and the Regina region, there remains some uncertainty with respect to global economic circumstances. Given the shifting population and demographics in Saskatchewan it is necessary to update population projections for jurisdictions within the province based on current demographic and economic data. With the continuing population shift to urban areas, Regina is likely to continue to be disproportionately impacted by changing provincial demographic growth patterns. There remains a need to revisit population projections for the city of Regina as changing circumstances will continue to alter the economic and population forecasts for Regina.
Most of the population growth modelling that has been done is based on historic trends that are based on the previous behaviour of the respective age cohorts. The model presented here, while based on historic trends and cohort based analysis, takes into account the most recent economic circumstances of the region and shifting patterns in population growth in order to create the most up to date population growth projection.
1.2 – Regina’s Historic Population Growth
1.2.1 – Population Measurements
There are several measures of Regina’s population, each with some margin of error. The two primary population tracking bodies for Regina’s population are Saskatchewan Health and Statistics Canada. Saskatchewan Health determines the population of Regina by health cardholders while Statistics Canada assesses the population through a five-year household census. The following is a breakdown of the respective population measures for Regina
Table 1.1 – Breakdown of Respective Population Measures for Regina
Area Source and Timing
Regina City Statistics Canada – 5 Year Census
Regina CMA Statistics Canada – 5 Year Census
Census data is only available every five years and systemically undercounts the population.
Regina City Population Estimates
Statistics Canada – Annual
Regina CMA Population Estimates
Statistics Canada – Annual
Is available every year, but is an estimate based on Census population data. The estimate does work to correct undercounting in the Census.
Regina City Covered Health Population – Renewal Year
Saskatchewan Health – Every third year
Is relatively precise, but only in the year following Health Card Renewal.
Regina City Covered Health Population – Non-Renewal Year
Saskatchewan Health – Non-renewal years
Is artificially inflated in non-renewal years.

Population, Employment and Economic Analysis of Regina
Derek Murray Consulting and Associates 12
The following graph shows the various population data sets available. It should be noted that Saskatchewan Health changed its methodology3 with reference to surveying and assigning residential location of First Nations people in 1997 resulting in a significant spike upwards. With the exception of 1997 the population estimates follow a generally similar pattern.
Graph 1.2 – Population Data for Regina
The Statistics Canada Census data (red and purple) for the CMA and city collected every five years does not show the steady population growth over the past seven years. Because the data is collected every five years, population changes in intercensal years are not evident. Statistics Canada annual population estimates, however, show steady population growth between 2003 and 2009. The annual population estimates for the CMA and city are based on the Census data collected every five years, but adjusted to reflect systemic undercounting and adjusted year-by-year based on population growth factors such as natural increase and in- and out-migration data.
Saskatchewan Health Covered Population is considered quite accurate in years in which there are health card renewals (every three years) as this is the year in which residents must indicate their home community in order to renew their Health Insurance. In the interim years, however, the data is not as accurate as individuals are added to the population, but not removed when they leave the city. The Covered Population closely matches that of the Statistics Canada population estimates as seen in the graph above, particularly in renewal years. The graph below shows only the similarity between the Statistics Canada Annual Population Estimates and the Covered Health Population card renewal year estimates.
3 First Nations were previously assigned primarily to the location of the respective reserve.

Population, Employment and Economic Analysis of Regina
Derek Murray Consulting and Associates 13
Graph 1.3 – Regina City Covered Population and Statistics Canada Annual Census Population Estimates
Saskatchewan Health Covered Population, Statistics Canada Annual Population Estimates Regina CSD Because of the consistency between the Covered Health Population data and the Statistics Canada Population Estimates and the availability of the data on an annual basis, these data sets have been used wherever possible. Any reference to the Regina growth rate or population in this report will be a reference to the Statistics Canada Population Estimates for the city of Regina. If the Covered Health Population or Census data is used for the CMA or city, it will be noted. 1.2.2 – Overall Population Growth for the City of Regina
Between 1996 and 2009 Regina’s population grew by 7,631, or an average annual rate of 587 people per year. However, it should be noted that the population actually shrank by an average of 625 people between 1996 and 2002 and grew at an average of 1,626 between 2003 and 2009. While the city showed growth of 7,631 over the 14 years, the majority of the growth occurred in the latter half of this period with the population growing by 11,382 (6.3%) between 2003 and 2009. This was the most significant and sustained continuous population growth for the city since the early 1980s.
Table 1.2 – Regina Population Growth – 1996 to 2009 Population
Growth Annual Growth
Total Growth
1996 – 2009 (14-year period) 7,631 587 4.1% 1996 – 2002 (7-year period) -3,751 -625 -2.0% 2003 – 2009 (7-year period) 11,382 1,626 6.3% Statistics Canada Annual Population Estimates Regina CSD
Population, Employment and Economic Analysis of Regina
Derek Murray Consulting and Associates 14
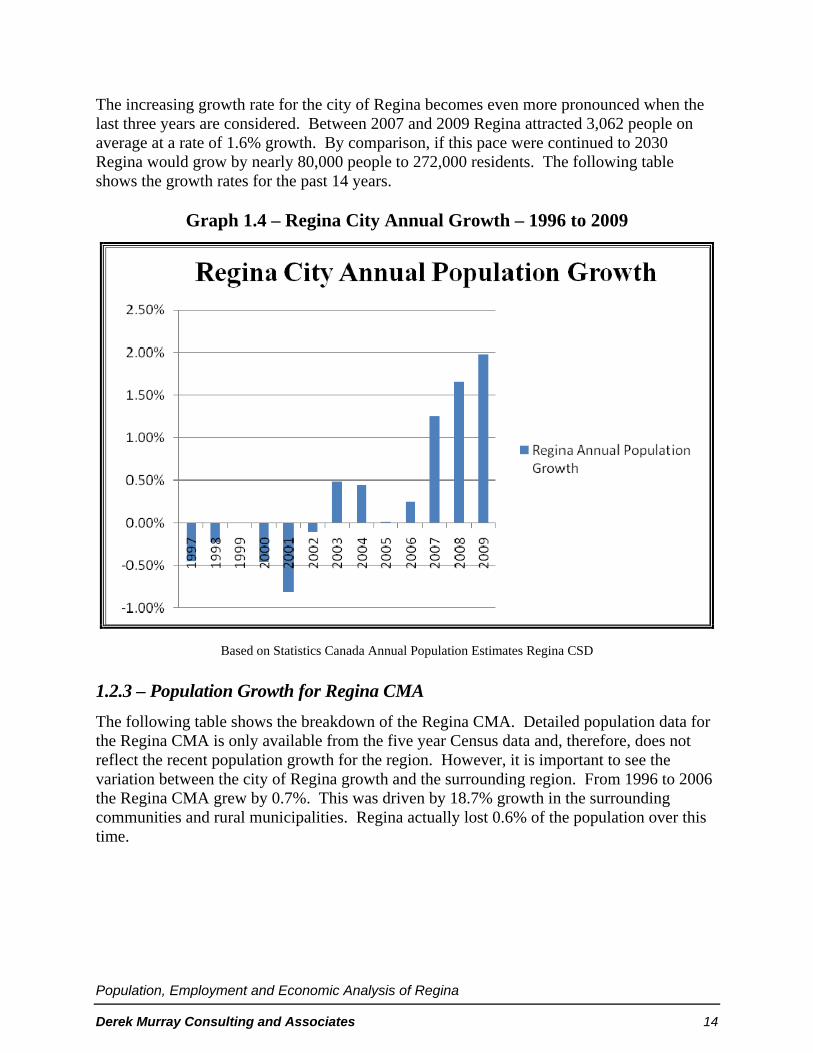
The increasing growth rate for the city of Regina becomes even more pronounced when the last three years are considered. Between 2007 and 2009 Regina attracted 3,062 people on average at a rate of 1.6% growth. By comparison, if this pace were continued to 2030 Regina would grow by nearly 80,000 people to 272,000 residents. The following table shows the growth rates for the past 14 years.
Graph 1.4 – Regina City Annual Growth – 1996 to 2009
Based on Statistics Canada Annual Population Estimates Regina CSD
1.2.3 – Population Growth for Regina CMA
The following table shows the breakdown of the Regina CMA. Detailed population data for the Regina CMA is only available from the five year Census data and, therefore, does not reflect the recent population growth for the region. However, it is important to see the variation between the city of Regina growth and the surrounding region. From 1996 to 2006 the Regina CMA grew by 0.7%. This was driven by 18.7% growth in the surrounding communities and rural municipalities. Regina actually lost 0.6% of the population over this time.

Population, Employment and Economic Analysis of Regina
Derek Murray Consulting and Associates 15
Table 1.3 – Regina Population Growth and Components (Census Data – 1996 to 2006)
1996
2001
2006
Percentage Change
Population Change
Regina CMA 193,652 192,800 194,971 0.7% 1,319
Regina City 180,404 178,225 179,246 -0.6% -1,158
Surrounding Communities 13,248 14,575 15,725 18.7% 2,477
Regina Proper % of CMA 6.8% 7.6% 8.1%
Source: Statistics Canada Census Data.
This issue is not unique to Regina. Many communities are faced with challenges by growing bedroom communities that utilize city services but do not fall within the taxable jurisdiction. Bedroom communities still consume leisure, infrastructure, and other resources provided by the city, but do not pay taxes. If the surrounding region is growing at a faster rate than the city’s population, the community faces growing demands for service based on revenue from a tax base that is not growing at the same rate. The ratio of citizens within the Regina CMA that fall outside the tax base has grown from 6.8% in 1996 to 8.1% in 2006. While this is actually a well studied issue described by economists as the “Free Rider” dilemma, there are no easy solutions. Fringe communities will always exist and grow around major centres, however, the issues become exaggerated when the fringe communities are growing at a faster rate than the major centre itself. The following table shows growth rates for communities surrounding Regina.
Table 1.4 Selected Growth Rates for Communities in Regina’s
CMA – 1996 to 2006
1996
2001
2006
% Change
Population Change
Edenwold No. 158 2,724 2,917 3,611 32.6% 887
Pilot Butte 1,481 1,850 1,867 26.1% 386
White City 1,376 1,631 1,627 18.2% 251
Balgonie 1,132 1,239 1,384 22.3% 252
Regina Beach 984 1,039 1,195 21.4% 211
Lumsden No. 189 907 1,101 1,113 22.7% 206
Total 8,604 9,777 10,797 25.5% 2,193
Source: Statistics Canada Census Data.

Population, Employment and Economic Analysis of Regina
Derek Murray Consulting and Associates 16
Saskatchewan Health Covered Population statistics indicate that growth in the urban fringe has continued from 2006 to 2009 at a similar rate. As well, interviews with selected communities indicated that growth is projected to continue as new subdivisions are developed.
It should also be noted that surrounding communities have both positive and negative impacts for cities. They are a source of labour, retail expenditures, and add to the vitality of a region. While growth in surrounding communities does create strain on infrastructure, there are also benefits to having well populated metro adjacent areas.

Population, Employment and Economic Analysis of Regina
Derek Murray Consulting and Associates 17
2.0 Economic Overview
2.1 – Saskatchewan Context
Saskatchewan led the country in terms of economic growth in 2007 and 2008 and has been far less impacted than other jurisdictions by the economic downturn in 2009. Saskatchewan has been recognized nationally and internationally as a hotspot for investment and economic growth. The global recession impacted key commodity prices for the province, however, prices are projected to rebound in 2010. Saskatchewan continued to add jobs in 2009 (up 1.5% vs. 0.9% nationally) and maintained low unemployment levels (4.7% in 2009 vs. 8.4% for Canada).
As the following graph shows, Canada was well into a significant downturn in 2008 while Saskatchewan and Regina were peaking in terms of GDP growth. In 2009 the global recession caught up with the Saskatchewan economy, but did not manage to push Regina into negative GDP growth.
Graph 2.1
Comparative Percentage GDP Growth for Saskatchewan and Canada
Conference Board of Canada, Saskatchewan Bureau of Statistics Because Saskatchewan has not been as impacted by the recession, there is not as much of a recovery that can be expected. Hard hit provinces such as Ontario will have to make significant recoveries as Saskatchewan will continue to build on past growth. With the exception of 2009, Saskatchewan is projected to maintain positive GDP growth.

Population, Employment and Economic Analysis of Regina
Derek Murray Consulting and Associates 18
Projections for Saskatchewan indicate that Saskatchewan’s economy may not lead the country as in years past, but will maintain solid economic growth. The following are projections made by various organizations regarding Saskatchewan GDP.
Table 2.1 – GDP Projections for Saskatchewan 2010 2011
CIBC 3.0% 4.1%
Scotiabank Group 3.0% 3.3%
Conference Board of Canada 2.5% 2.9%
Bank of Montreal 3.3% 3.9%
Royal Bank 3.9% 4.6%
Government of Saskatchewan 2.4%
Consensus 3.0% 3.8%
Reasons cited for the optimistic outlook for Saskatchewan’s economy include:
Oil prices, which had plunged by more than US $100 a barrel in late 2008, have rebounded from their lows of around US $40 and climbed steadily into the US $70-$80 range in recent months.
Petroleum Services Association of Canada had forecast a 10% increase in drilling, to 1,935 wells in Saskatchewan for 2010.
Rebounding activity globally is likely to lift grain prices. Potash prices are widely projected to rebound in 2010. The potash industry is spending billions on expansion projects. New potash mine development is projected for the region with new companies looking to
establish themselves in the Saskatchewan market. BHP Billiton Ltd. recently announced it was spending $240 million in “pre-feasibility”
work on a potash project near Saskatoon.
Another reason for optimism around oil recovery, technology/research, and drilling is the competitive nature of the royalty regime in Saskatchewan. A recent report titled Taxing Canada’s Cash Cow: Tax and Royalty Burdens on Oil and Gas Investments4 compared the Province’s royalty and tax regimes with similar jurisdictions.
Table 2.2 – Comparative Royalty Rates Medium Sized Oil Well at 80 Barrels per Day ($72/Barrel)
Saskatchewan 22%
British Columbia 23.85%
Alberta 40%
4 Jack Mintz and Duanjie Chen, University of Calgary.

Population, Employment and Economic Analysis of Regina
Derek Murray Consulting and Associates 19
This is quite significant for Saskatchewan as Saskatchewan is the country’s second largest producer of conventional crude oil and may soon become a major player in terms of oil sands and oil shale production. This is of particular importance to Regina given the city’s proximity to the Bakken formation and the presence of oil recovery research activity (Petroleum Technology Research Centre). The Bakken oil play has been termed the most important reserve in North America. Bakken has had, and will continue to have, a significant economic impact on Regina’s economy. 2.2 – Regina GDP Growth
Gross domestic product (GDP) is a widely used measurement to calculate the overall economic outputs of a region. The two factors impacting GDP are labour and productivity. Increased employment (more jobs) and increased activity per employee (brought about through investments in technology, equipment, and human capital) can all lead to increases in GDP. As such, it is a good measure of a region’s economic well being. While GDP is not tracked for jurisdictions the size of Regina, GDP can be inferred from provincial GDP numbers collected by Statistics Canada. 2.2.1 – Regina’s Historic GDP Growth
The following graph shows Regina’s real GDP growth over the past 24 years. Since 1997 Regina has had relatively steady GDP growth. Regina’s GDP growth has been far more stable than the provincial and national GDP growth levels over the past ten years. Anchored by a stable government sector and steady growth in the private sector Regina has enjoyed a steady year to year growth rate.
Graph 2.2
Conference Board of Canada – Regina GDP derived from Statistics Canada Input Output Data

Population, Employment and Economic Analysis of Regina
Derek Murray Consulting and Associates 20
2.2.2 – GDP and Population Growth
Population growth and GDP are closely correlated as sustained economic growth tends to create employment and attract labour. Slow economic growth, conversely, leads to slow job creation and a loss of population over time. As the following table shows, there has been a strong correlation between Regina’s GDP and population growth. Population growth is a lead indicator of GDP growth as the arrival and subsequent employment of new individuals allows for an increase in productivity.
Graph 2.3 – Regina City Population vs. GDP Growth 1998 to 2009
Conference Board of Canada – Regina GDP derived from Statistics Canada Input Output Data; Statistics Canada, Annual Population Estimates Regina CSD.
In 2009 GDP growth slows to .05%, but the population continues to grow. This is indicative of the tight labour market faced by employers in Regina. While there was slower economic growth in 2009 there was still significant in-migration as the labour markets struggled to meet growing demands from previous years. Low unemployment and high participation rates in Regina are an indication of the imbalanced labour market that has developed over the previous five years. Without a downturn in employment levels further in-migration will be necessary to balance the labour market, regardless of future economic growth.
2.3 – Employment Growth
2.3.1 – Employment vs. Population Growth
Regina’s labour force has been growing at a rate that has outpaced population growth resulting in high labour force participation rates, low unemployment rates, and labour shortages. While these issues have eased somewhat in 2009, economically driven labour force shortages remain. As the following table shows, participation rates have been rising and unemployment rates have been falling over the past ten years.
Population, Employment and Economic Analysis of Regina
Derek Murray Consulting and Associates 21
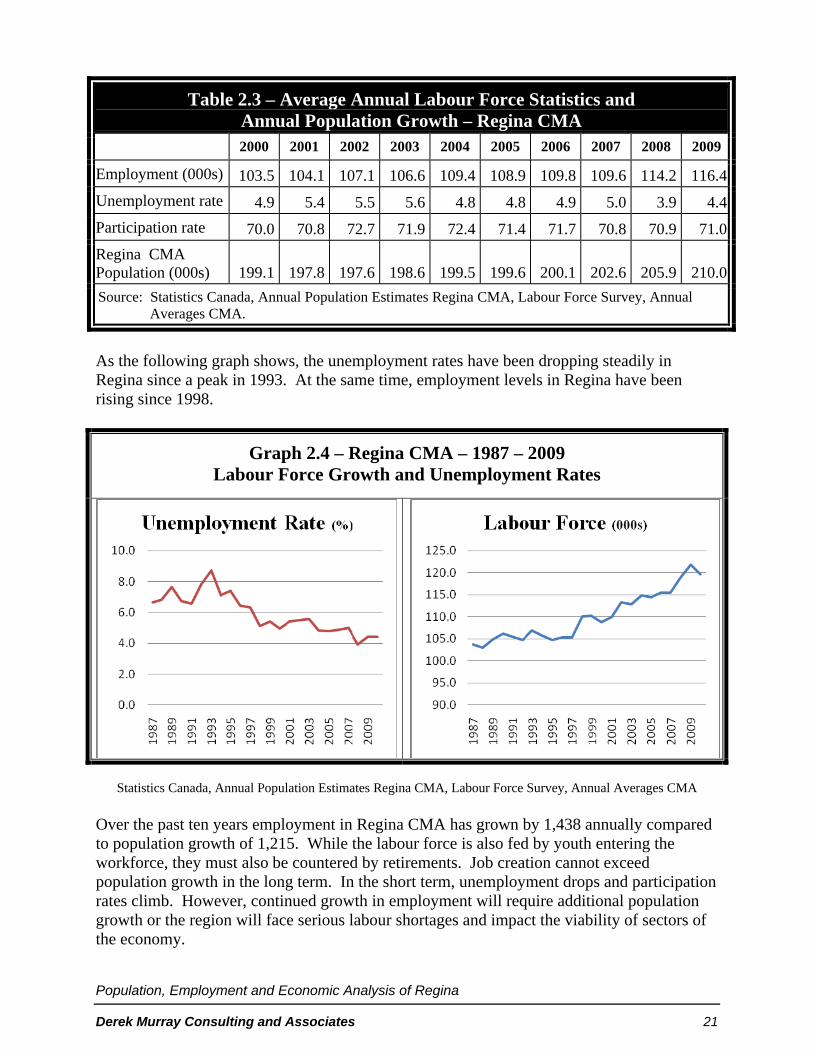
Table 2.3 – Average Annual Labour Force Statistics and Annual Population Growth – Regina CMA
2000 2001 2002 2003 2004 2005 2006 2007 2008 2009
Employment (000s) 103.5 104.1 107.1 106.6 109.4 108.9 109.8 109.6 114.2 116.4
Unemployment rate 4.9 5.4 5.5 5.6 4.8 4.8 4.9 5.0 3.9 4.4
Participation rate 70.0 70.8 72.7 71.9 72.4 71.4 71.7 70.8 70.9 71.0
Regina CMA Population (000s) 199.1 197.8 197.6 198.6 199.5 199.6 200.1 202.6 205.9 210.0
Source: Statistics Canada, Annual Population Estimates Regina CMA, Labour Force Survey, Annual Averages CMA.
As the following graph shows, the unemployment rates have been dropping steadily in Regina since a peak in 1993. At the same time, employment levels in Regina have been rising since 1998.
Graph 2.4 – Regina CMA – 1987 – 2009 Labour Force Growth and Unemployment Rates
Statistics Canada, Annual Population Estimates Regina CMA, Labour Force Survey, Annual Averages CMA
Over the past ten years employment in Regina CMA has grown by 1,438 annually compared to population growth of 1,215. While the labour force is also fed by youth entering the workforce, they must also be countered by retirements. Job creation cannot exceed population growth in the long term. In the short term, unemployment drops and participation rates climb. However, continued growth in employment will require additional population growth or the region will face serious labour shortages and impact the viability of sectors of the economy.

Population, Employment and Economic Analysis of Regina
Derek Murray Consulting and Associates 22
Table 2.4 – Regina CMA Average Annual Population and Employment Growth 2000-2009
2000
2009
Change
Average Annual Change
Employment 103,450 116,390 12,940 1,438
Regina Population 199,069 210,006 10,937 1,215
Source: Statistics Canada, Annual Population Estimates Regina CMA, Labour Force Survey, Annual Averages CMA
Employment growth has exceeded population growth, however, there has been a high level of correlation between the two growth patterns. Since 2001 both population and employment growth have remained positive or neutral.
Graph 2.5 – Regina CMA Population vs. Total Employed 1987 - 2009
Statistics Canada, Annual Population Estimates Regina CMA, Labour Force Survey, Annual Averages CMA
2.3.2 – Projected Demographic Shift and Labour Force Impacts
While current economically driven labour force shortages in the region are somewhat severe, systemic demographically-based labour force shortages are projected for the future. With the aging of the population the ratio of youth entering the labour market relative to retirements will shift dramatically resulting in a shrinking workforce and labour force shortages. As the balance of youth entering the labour force to retirees leaving the workforce becomes increasingly imbalanced, population growth will become an increasingly key factor in terms of maintaining economic momentum.
Population, Employment and Economic Analysis of Regina
Derek Murray Consulting and Associates 23
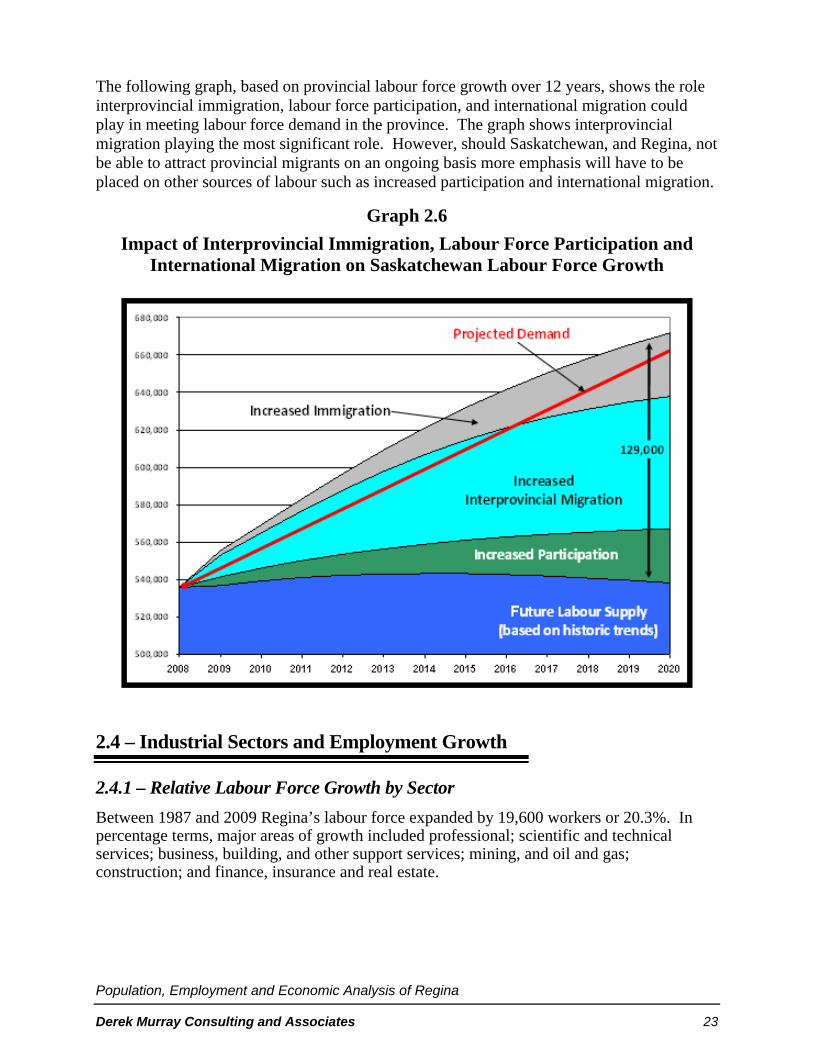
The following graph, based on provincial labour force growth over 12 years, shows the role interprovincial immigration, labour force participation, and international migration could play in meeting labour force demand in the province. The graph shows interprovincial migration playing the most significant role. However, should Saskatchewan, and Regina, not be able to attract provincial migrants on an ongoing basis more emphasis will have to be placed on other sources of labour such as increased participation and international migration.
Graph 2.6
Impact of Interprovincial Immigration, Labour Force Participation and International Migration on Saskatchewan Labour Force Growth
2.4 – Industrial Sectors and Employment Growth
2.4.1 – Relative Labour Force Growth by Sector
Between 1987 and 2009 Regina’s labour force expanded by 19,600 workers or 20.3%. In percentage terms, major areas of growth included professional; scientific and technical services; business, building, and other support services; mining, and oil and gas; construction; and finance, insurance and real estate.

Population, Employment and Economic Analysis of Regina
Derek Murray Consulting and Associates 24
Table 2.5
Regina CMA Labour Force Growth by Industrial Sector – 1987 to 2009
1987 2009
1987-09 Total
Change
1987-09 Percentage
Change
Total employed, all industries 96.6 116.2 19.6 20.3%
Goods-producing sector 15.7 19.0 3.3 21.0%
Agriculture 2.0 1.1 -0.9 -45.0%
Mining, oil and gas 0.5 0.7 0.2 40.0%
Utilities 1.6 2.0 0.4 25.0%
Construction 6.2 8.2 2.0 32.3%
Manufacturing 5.6 7.1 1.5 26.8%
Services-producing sector 80.9 97.2 16.3 20.1%
Trade 17.6 19.1 1.5 8.5%
Transportation and warehousing 5.0 4.9 -0.1 -2.0%
Finance, insurance, real estate and leasing 7.4 10.2 2.8 37.8%
Professional, scientific and technical services 3.1 6.1 3.0 96.8%
Business, building and waste management 2.4 4.2 1.8 75.0%
Educational services 5.8 7.6 1.8 31.0%
Health care and social assistance 10.9 13.1 2.2 20.2%
Information, culture and recreation 6.1 7.1 1.0 16.4%
Accommodation and food services 6.6 7.7 1.1 16.7%
Other services 5.5 5.3 -0.2 -3.6%
Public administration 10.4 11.8 1.4 13.5%
Table 282-0057 – Labour force survey estimates, Statistics Canada

Population, Employment and Economic Analysis of Regina
Derek Murray Consulting and Associates 25
2.4.2 – Jobs Added to the Economy
In terms of the number of jobs added to the economy over the past 24 years, the finance, insurance and real estate and professional, scientific and technical sectors led the way adding 5,800 jobs comprising over a quarter of all job growth. Health care and social assistance and construction also were fast growing sectors for Regina.
Graph 2.7 Regina CMA
Table 282-0057 – Labour force survey estimates, Statistics Canada for Regina CMA

Population, Employment and Economic Analysis of Regina
Derek Murray Consulting and Associates 26
2.4.3 – Short and Long-Term Annual Labour Force Growth
The following table compares the long-term industry growth rates with the rate of growth over the past five years to indicate which sectors are gaining momentum and which sectors are losing momentum.
Table 2.6 – Regina CMA Employment North American Industry Classification System
Employment
Annual Growth Rates
Short Term Momentum
2009 1987-09 2005-09
Total employed, all industries 116.2 0.9% 1.4%
Goods-producing sector 19 0.9% 5.0%
Agriculture 1.1 -2.0% 2.0%
Mining, oil and gas 0.7 1.7% 3.3%
Utilities 2 1.1% 8.6%
Construction 8.2 1.4% 8.3%
Manufacturing 7.1 1.2% 1.8%
Services-producing sector 97.2 0.9% 0.8%
Wholesale and Retail Trade 19.1 0.4% 1.3%
Transportation and warehousing 4.9 -0.1% -0.4%
Finance, insurance, real estate and leasing 10.2 1.6% 0.4%
Professional, scientific, technical services 6.1 4.2% 2.2%
Business, building and waste management 4.2 3.3% -2.5%
Educational services 7.6 1.3% -0.5%
Health care and social assistance 13.1 0.9% 1.1%
Information, culture and recreation 7.1 0.7% -1.1%
Accommodation and food services 7.7 0.7% -0.5%
Other services 5.3 -0.2% 2.1%
Public administration 11.8 0.6% 3.8%
The annual growth rate for the goods-producing sector has far exceeded the rate of growth for the service-producing sector over the past five years. Driven by growth in the construction and utility sectors, the goods-producing sector has been leading employment growth in Regina.

Population, Employment and Economic Analysis of Regina
Derek Murray Consulting and Associates 27
Table 2.7 – Regina CMA Labour Force Growth
1987-09 Annual Average Growth
2000-09 Annual Average Growth
2005-09 Annual Average Growth
Employment – Goods-Producing Sector 1.0% 3.0% 5.0%
Employment – Services-Producing Sector 0.9% 0.9% 0.8%
Employment – All Industries 0.9% 1.2% 1.4%
2.4.4 – Labour Force Growth Projections for Key Sectors in Regina
The following labour force growth projections will help establish the medium-term population projections. For each sector, current and past growth patterns are considered, as well as the economic outlook for that sector. Goods-Producing Sector
2009 Employment
1987-09 Growth Levels
2000-09 Growth Levels
2005-09 Growth Levels Agriculture Sector
1,100 -2.0% -4.8% 2.0%
Regina’s agriculture sector has contracted over the past 24 years from 2,000 to 1,100. While the decline has been significant, the rate of decline has lessened in the recent past with the sector even adding employment. Given the size of the sector it is unlikely that employment can be reduced any further. Global speculation around agricultural commodities prices do not have any indication of any long-term down trend with many expecting global food demand to keep prices at a reasonable level in the medium term. It is likely that this sector will not lose further employment and will continue to add jobs in the area of agricultural support services.
It should be noted that Regina is, in many ways, much more economically dependent on agriculture than the direct employment reflected here would indicate. Regina acts as a regional service centre serving a large rural area. The health of the rural agricultural economy has major impacts on Regina’s service sector from retail to healthcare.
Projected Growth Rate: 0.5%

Population, Employment and Economic Analysis of Regina
Derek Murray Consulting and Associates 28
2009 Employment
1987-09 Growth Levels
2000-09 Growth Levels
2005-09 Growth Levels Mining, Oil and Gas
700 1.7% 4.0% 3.3%
The mining and oil and gas sector has grown steadily over the past 24 years at a rate exceeding Regina’s average with growth accelerating over the past ten years. Given the strength in these areas, strong projections for the underlying commodity prices, regional mineral recovery investment initiatives, and the favourable exploration and development climate it is expected that this sector will continue to add jobs at a higher than average rate. Research and development support activities for the sector have also expanded over the past ten years with the PTRC and world leading enhanced oil recovery and carbon capture research taking place at the University of Regina.
While 2009 saw some reduction in employment in this sector, this can be directly attributed to temporary slowdowns in the potash sector as well as a temporary slowdown in the Bakken oilfield due to low oil prices.
Projected Growth Rate: 3.5%
2009 Employment
1987-09 Growth Levels
2000-09 Growth Levels
2005-09 Growth Levels Utilities
2,000 1.1% 3.3% 8.6%
There has been significant growth in this sector in the recent past, however, growth in this sector is not likely to continue to outpace population growth into the future. The basic driver of this sector is supplying heat and power to the existing residential and industrial base. Major pipeline developments in the region have likely contributed to the employment in this sector. It is likely that the sector will return to historic growth rates after a slight correction.
Projected Growth Rate: 1.0%

Population, Employment and Economic Analysis of Regina
Derek Murray Consulting and Associates 29
2009 Employment
1987-09 Growth Levels
2000-09 Growth Levels
2005-09 Growth Levels Construction
8,200 1.4% 7.4% 8.3%
Construction has been a major driver of labour force growth over the past ten years. Strong demand in this sector has led to extensive labour force shortages. Major projects, such as the $1.9 B Consumers Co-operative Refinery expansion, have scheduled projects over longer periods to reduce the impacts of labour shortages. Other projects have been delayed and prolonged based on the labour force shortages.
Major Regina construction projects include: Harbour Landing – Residential – $1.0 B – 2007-2017 Loblaw Companies Distribution Centre $350 M – 2009-2011 Global Transportation Hub Infrastructure $320 M – 2009-2012 Waste Water Upgrades – $100 m. Consumers Co-operative Refinery Ltd. – $1.9 B 2009-2014 Regina Qu’Appelle North Central Health and Education Facility –
$75 M Planned Regina Plains – Hilton Garden Inn Hotel and Condominium
Project Proposed Domed Stadium Development – $431 M
Major regional construction projects impacting Regina include: Active Potash mine expansions at Rocanville, Belle Plaine and Esterhazy Active Last mountain lake housing development – $200 M Proposed TransCanada Corporation Poly-Generation Plant – $6.0 B
Residential construction is forecast by CMHC to remain around the 2009 level for 2010 and 2011, however, early indications from City of Regina data indicate that housing starts for 2010 are likely going to be somewhat higher than projected. The Canadian Home Builders Association has also indicated that projections for the province are low based on early housing permit numbers.
Non-residential construction permits were at a record high in 2009 led by commercial permits for projects such as the plains site redevelopment and other major projects. The building permits obtained for the commercial sector should create a demand for construction employment, however, construction employment over 2009 was flat for Regina. Non-residential construction is more capital intensive as opposed to residential construction which is labour intensive.
Construction employment growth could vary greatly over the next five years as major projects could dramatically swing the demand for workers. Even though construction employment did not grow in 2009, there remains a 5-year average growth for the sector of 8.3%. While there is a continued demand for skilled trades in the construction sector, the shift from labour intensive residential to capital intensive commercial construction growth should be somewhat reduced.
The sector will continue to grow at rate well above the historic average of 1.4% but below the recent average of 8.3% growth. The medium growth projection of 3.0% over the next five years is contingent on continued strong housing demand and maintaining the level of non-residential construction activity. In the absence of other information, growth in this sector will fall to historic levels in 2015. Major projects such as a domed stadium or a poly-generation plant at Belle Plaine would have significant impacts on these projections.

Population, Employment and Economic Analysis of Regina
Derek Murray Consulting and Associates 30
Construction (Continued)
Building Permits 2001 - 2009 2001 2002 2003 2004 2005 2006 2007 2008 2009
Building Permits ($ 000s)
Total 187,744 161,459 265,356 241,591 277,741 371,511 398,743 456,669 556,104
Residential 61,612 72,626 108,741 127,300 127,398 164,824 192,077 259,354 210,455
Non-residential 126,132 88,833 156,615 114,291 150,343 206,687 206,666 197,315 345,649
Industrial 4,220 6,933 5,143 22,405 10,384 32,728 18,198 54,971 76,013
Commercial 61,068 70,678 92,239 65,459 97,533 71,413 159,578 86,924 229,544
Public Admin. and Non-Commercial
60,844 11,222 59,233 26,427 42,426 102,546 28,890 55,420 40,092
Source: Statistics Canada
2010-2014 2015-2020
Projected Growth Rate 3.0% 1.4%
2009 Employment
1987-09 Growth Levels
2000-09 Growth Levels
2005-09 Growth Levels Manufacturing
7,100 1.2% 2.2% 1.8%
The manufacturing sector has grown at a relatively consistent rate adding around 80 to 150 jobs annually to the economy. The sector has four major components: food, petroleum, steel, and agricultural machinery. The expansion at the Co-op refinery should expand employment in this sector. Increased activity in the oil sector could also trigger greater activity levels at Evraz Regina Steel. Overall growth over the next ten years should remain stable and slightly better than the historic average.
Projected Growth Rate: 1.8%

Population, Employment and Economic Analysis of Regina
Derek Murray Consulting and Associates 31
Services-Producing Sector
2009 Employment
1987-09 Growth Levels
2000-09 Growth Levels
2005-09 Growth Levels Trade
19,100 0.4% 1.9% 1.3%
Wholesale and retail trade are the single largest sector of Regina’s labour force. Employing over 19,000 people and dominated by retail trade (78%) this sector has experienced modest growth over the past 24 years with the majority of growth in the sector occurring in the past ten years.
This sector is really a function of the area serviced, based on consumer demand. However, the development of the Global Transportation Hub (GTH) west of Regina will increase employment in this area as the sector will service a much larger area. The GTH will primarily impact labour growth in the transportation and warehousing sector, but will also concentrate some regional trade employment in the Regina area.
Projected Growth Rate: 1.3%
2009 Employment
1987-09 Growth Levels
2000-09 Growth Levels
2005-09 Growth Levels Transportation and
Warehousing 4,900 -0.1% -1.8% 0.4%
Growth in the transportation and warehousing sector has been flat in Regina for the past 24 years hovering around 5,000 employees. The development of the Global Transportation Hub should, however, significantly increase employment in this sector. Loblaws, one of the major tenants of the GTH, will employ an estimated 1,500 people by 2015. While some of these jobs will be transferred from other locations in Saskatchewan, the centralization of operations in Regina will lead to an increase in employment for Regina. As well, having a highly developed transportation infrastructure will work to attract additional transportation and warehousing industries to the region.
Based on employment projections made by the Global Transportation Hub Authority the annual growth rate for this sector will exceed both historic and recent trends in the industry. Employment growth for transportation and warehousing is estimated at 5.0% over the next five years and 2.5% for the following five years.
2010-2014 2015-2020
Projected Growth Rate 5.0% 2.5%

Population, Employment and Economic Analysis of Regina
Derek Murray Consulting and Associates 32
2009 Employment
1987-09 Growth Levels
2000-09 Growth Levels
2005-09 Growth Levels
Finance, Insurance, Real Estate and
Leasing 10,200 1.6% 0.6% 0.4%
Growth in this sector is primarily dependent on servicing the existing industry and population base. Once recent employment losses in the banking and insurance areas have been absorbed normal growth should return to the sector. Growth in this sector will return to the 10-year average of 0.6%.
Projected Growth Rate: 0.6%
2009 Employment
1987-09 Growth Levels
2000-09 Growth Levels
2005-09 Growth Levels
Professional, Scientific and
Technical Services 6,100 4.2% 0.9% 2.2%
This sector has added the most jobs to Regina’s economy relative to any other sector over the past 24 years. While growth in the sector has somewhat declined in recent years, the most recent 5-year annual growth rate is still quite significant at 2.2%. Architecture/engineering as well as computer systems design have been the most significant growth components of this sector. While this sector holds great potential it is likely that growth will remain below the historic average but above the 10-year average at 1.5%.
Projected Growth Rate: 1.5%
2009 Employment
1987-09 Growth Levels
2000-09 Growth Levels
2005-09 Growth Levels
Business, Building and Waste
Management 4,200 3.3% 5.0% -2.5%
Reductions in business support services as well as some real estate based employment have reduced the 5-year average significantly. However, it should be noted that in 2009 the industry grew by 13.5%. This sector will perform better than the most recent 5-year average, but will not return to the historic 24-year average of 3.3%. Based on strength in the waste management sector as well as a growing need for services supporting the business community the growth is projected at 1.5%.
Projected Growth Rate: 1.5%

Population, Employment and Economic Analysis of Regina
Derek Murray Consulting and Associates 33
2009 Employment
1987-09 Growth Levels
2000-09 Growth Levels
2005-09 Growth Levels Education Services
7,600 1.3% 1.2% -0.5%
This sector will remain flat over the next five years but return to a growth rate of 0.5% in 2015.
2010-2014 2015-2020
Projected Growth Rate 0.0% 0.5%
2009 Employment
1987-09 Growth Levels
2000-09 Growth Levels
2005-09 Growth Levels Health Care and
Social Assistance 13,100 0.9% 0.0% 1.1%
Based on recent pronouncements by the provincial government to reduce health care budgets and reduce overall spending it is likely that growth in this sector will be less than the 5-year average, but greater than the 10-year average. Growth will be 0.5% for the next five years and 1.5% starting in 2016.
2010-2014 2015-2020
Projected Growth Rate 0.5% 1.5%
2009 Employment
1987-09 Growth Levels
2000-09 Growth Levels
2005-09 Growth Levels
Information, Culture, and Recreation 7,100 0.7% 0.0% -1.1%
Population growth will increase the demand for information, culture and recreation services. Growth levels will return to the historic average of 0.7%.
Projected Growth Rate: 0.7%

Population, Employment and Economic Analysis of Regina
Derek Murray Consulting and Associates 34
2009 Employment
1987-09 Growth Levels
2000-09 Growth Levels
2005-09 Growth Levels Accommodation and
Food Services 7,700 0.7% 1.5% -0.5%
Strong economic growth in the region has forced an employment decline in this sector. Strong demand in higher paying sectors has caused labour force shortages in the hospitality sector. As the labour market gets to a more balanced state, employment growth in this sector will return to historic levels.
Projected Growth Rate: 0.7%
2009 Employment
1987-09 Growth Levels
2000-09 Growth Levels
2005-09 Growth Levels Other Services
5,300 -0.2% 0.8% 2.1%
This collection of services excluded from other sectors is highly contingent on the existing population and industrial sectors. Growth will be between the 10-year and 5-year historic growth levels.
Projected Growth Rate: 1.5%
2009 Employment
1987-09 Growth Levels
2000-09 Growth Levels
2005-09 Growth Levels Public
Administration 11,800 0.6% 1.8% 3.8%
Given the provincial government’s current budget constraints, it is likely that the growth levels in this sector will fall back to historic levels, even if the municipal and federal hiring practices remain relatively unchanged. The growth levels will likely stay at historic levels for the next three years, but rise to the 10-year average after the third year.
2010-2014 2015-2020
Projected Growth Rate 0.6% 1.8%

Population, Employment and Economic Analysis of Regina
Derek Murray Consulting and Associates 35
Total Projected Labour Force The following table shows the projected labour force growth for Regina, based on moderate economic growth described in the previous section.
Table 2.8 – Regina CMA Projected Labour Force Growth – Moderate Economic Climate – 2010 to 2020
2009 Actual
2015
2020
Total Growth
% Change
Annual Growth
Total employed, all industries (000s) 116.2 125.4 134.0 17.8 15.3% 1.3% Goods-producing sector 19.0 21.7 23.4 4.4 23.1% 1.9% Agriculture 1.1 1.1 1.2 0.1 5.6% 0.5% Mining, Oil and Gas 0.7 0.9 1.0 0.3 46.0% 3.5% Utilities 2.0 2.1 2.2 0.2 11.6% 1.0% Construction 8.2 9.6 10.3 2.1 26.0% 3.0/1.4% Manufacturing 7.1 7.9 8.6 1.5 21.7% 1.8% Services-Producing Sector 97.2 103.8 110.6 13.4 13.8% 1.2% Trade 19.1 20.6 22.0 2.9 15.3% 1.3% Transportation and Warehousing 4.9 6.4 7.3 2.4 48.0% 5.0/2.5% Finance, Insurance, Real Estate and Leasing 10.2 10.6 10.9 0.7 6.8% 0.6% Professional, Scientific and Technical Services 6.1 6.7 7.2 1.1 17.8% 1.5% Business, Building and Waste management 4.2 4.6 4.9 0.7 17.8% 1.5% Educational Services 7.6 7.6 7.8 0.2 3.0% 0.0/0.5% Health Care and Social Assistance 13.1 13.6 14.7 1.6 12.1% 0.5/1.5% Information, Culture and Recreation 7.1 7.4 7.7 0.6 8.0% 0.7% Accommodation and Food Services 7.7 8.0 8.3 0.6 8.0% 0.7% Other Services 5.3 5.8 6.2 0.9 17.8% 1.5%
Public Administration 11.8 12.4 13.5 1.7 14.7% 0.6/1.8%
Actual 2009 employment from Statistics Canada Labour Force Survey, 2009.
To support the addition of 17,800 jobs by 2020, or 1,600 jobs annually, the population of Regina must grow. With high participation rates and low unemployment new job creation requires new entrants to the labour market. As the labour force ages, however, the participation rates will decline. The following table shows the population that would be required to support 134,000 jobs, under the projected circumstances. Those currently headed towards retirement will lower the participation rates as they enter retirement. As it is unclear at what rate baby boomers will actually retire, two separate participation rates are used.

Population, Employment and Economic Analysis of Regina
Derek Murray Consulting and Associates 36
If you remove those not in the labour force (not actively looking for work) and those who are unemployed it would take between 204,500 and 210,500 working age people to support an employed workforce of 134,000. If those under 15 are included the total population required is between 251,250 and 259,500. The following table shows the population that would be required to support a labour force of 134,000, under the projected circumstances.
Table 2.9
Regina CMA
Population Required to Support 2020 Labour Force
Participation Rate 69.0% 67.0%
Under 15 Ratio 19.0% 19.0%
Unemployment 5.0% 5.0%
Employment Rate 65.6% 63.7%
2020 Projected Employment (000s) 134,000 134,000
Total Workforce Required 204,500 210,500
Total Population Required 251,250 259,500
Population Growth Required (From 2009 Regina CMA level) 41,250 49,500
It should be noted that only under the high growth scenario does Regina reach this level of population by 2020. Under the medium case scenario the Regina CMA reaches a population of 246,000 in 2020. The projected total population shortfall would be between 5,250 and 13,500 people to meet the labour force demands in 2020. While the labour force can compensate through other means (increase productivity, recruit more aggressively, or attempt to increase participation rates) this is an indication that labour force challenges will continue. To meet labour force requirements for Regina, at moderate economic growth levels, Regina’s population will have to grow at between 3,750 and 4,500 residents per year for the next 10 years. For comparison, this is on par with the population growth that has been experienced over the past three years (2007 – 2009). This is significant considering that the population growth for Regina over the past three years has been very high, relative to historic growth patterns.

Population, Employment and Economic Analysis of Regina
Derek Murray Consulting and Associates 37
3.0 Components of Population Growth
3.1 – Birth and Death Rates
3.1.1 – Historic Trends and Context
Natural population increase, the net population growth due to birth and death rates in a community, has been declining throughout North America for over 20 years. This decline has been largely attributed to the aging of the baby boom generation beyond prime child bearing years combined with an emerging tendency for child rearing later in life and shrinking family size. However, within the last five years some jurisdictions have experienced a reversal of this trend. Canadian cities, particularly western cities, have experienced a baby boom over the past five years. Data is just beginning to emerge identifying this trend.
At a national level one of the key drivers behind increasing birth rates is the increasing fertility of women between the ages of 30 and 34. In 2007 it was the first time the highest fertility rate belonged to women aged 30 to 34 nudging out the 25 to 29 age group. This is an important shift as it supports the notion that fertility rates were dropping in previous years due, in part, to a preference to start families later in life.
In Regina, however, there are also demographic considerations. Regina has a younger population. Of the 35 CMAs in Canada, Regina has the fifth youngest average age at 37.45. This is due, in part, to a growing Aboriginal population in Regina. However, fertility rates amongst Aboriginal people have also been declining over time as the following table shows.
Table 3.1 – Saskatchewan Total Fertility Rate (Births per Woman)
1986 1996 2006 Projected
Non-Aboriginal 2.0 1.9 1.8 1.8
Aboriginal 3.0 2.8 2.6 2.6
Also of significant impact to Regina’s birth rates is the city’s net in-migration. As the following table shows, the majority of the net in-migration to Regina from 2003 to 2008 was individuals under the age of 44. The 45-65 age group has the lowest net in-migration with more individuals moving away from than moving to Regina in every year.
5 Statistics Canada Catalogue No. 91-214-X, Annual Population Estimates.

Population, Employment and Economic Analysis of Regina
Derek Murray Consulting and Associates 38
Graph 3.1 – Regina CMA In-Migration 2003 to 2008 International, Interprovincial, and Intraprovincial Net In-Migration
Statistics Canada, Small Area and Administrative Data Division – Tax Filer Data Product 91C0025
From 2003 to 2008, 93% of the net in-migration to Regina was people under the age of 45. Individuals under the age of 45 had the highest migration activity, however, the out-migration was balanced by greater levels of in-migration for this age group. The 45-64 age group has had low levels of out-migration, but lower levels of in-migration. While Regina retains a greater portion of this age group, the city also does not seem to attract many people from this age group.
Table 3.2 – Regina CMA Migration – All Sources – 2003 to 2008 Age Group Total In-Migration Total Out-Migration Net Migration
0-17 years 10,463 8,960 1,503
18-24 years 7,841 6,970 871
25-44 years 14,316 13,015 1,301
45-64 years 4,735 5,198 -463
65+ years 2,627 1,891 736
Total 39,982 36,034 3,948
Statistics Canada, Small Area and Administrative Data Division – Tax Filer Data Product 91C0025

Population, Employment and Economic Analysis of Regina
Derek Murray Consulting and Associates 39
Contrary to the long-held notion that out-migration is a challenge in terms of losing youth, it is actually the pre-retirement age group that is leaving Regina and not being replaced. This has impacts on fertility rates as the migration patterns from the city lead to a growing contingent of people with higher fertility rates. While the youth of Regina’s Aboriginal population contributes to the city’s young average age, migration is also a major factor in the low average age and growing fertility rates.
3.1.2 – Natural Growth Rates
The following graph shows the natural increase for Regina. As projected, based on an aging population, death rates have been rising since the mid 1980s while birth rates have been falling. The decline in birth rates meant that, since the early 1980s, Regina’s population has not been replacing itself. This will eventually lead to a negative natural population growth. The following table shows natural population growth for Regina. It is interesting to note that, beginning in 2004, there is an unanticipated rise in birth rates.
Chart 3.2 – Regina CMA Birth and Death Rates – 1978 to 2009
Statistics Canada CANSIM – 051-0047, 051-0051, 051-0023
There is a recent birth rate trend at the national level towards increased fertility, however, Regina’s 17% increase in births over six years is more pronounced. One explanation is that people in their prime years of fertility are also of the highest mobility. The strong economic conditions over the past several years have meant an increase in the number of people moving to Regina, as well as a greater retention of young people.
The rise in birth rates will be a short-term trend based on demographics. The aging population will eventually counteract the rise in fertility in segments of the population leading to a return in the overall decline in fertility rates.
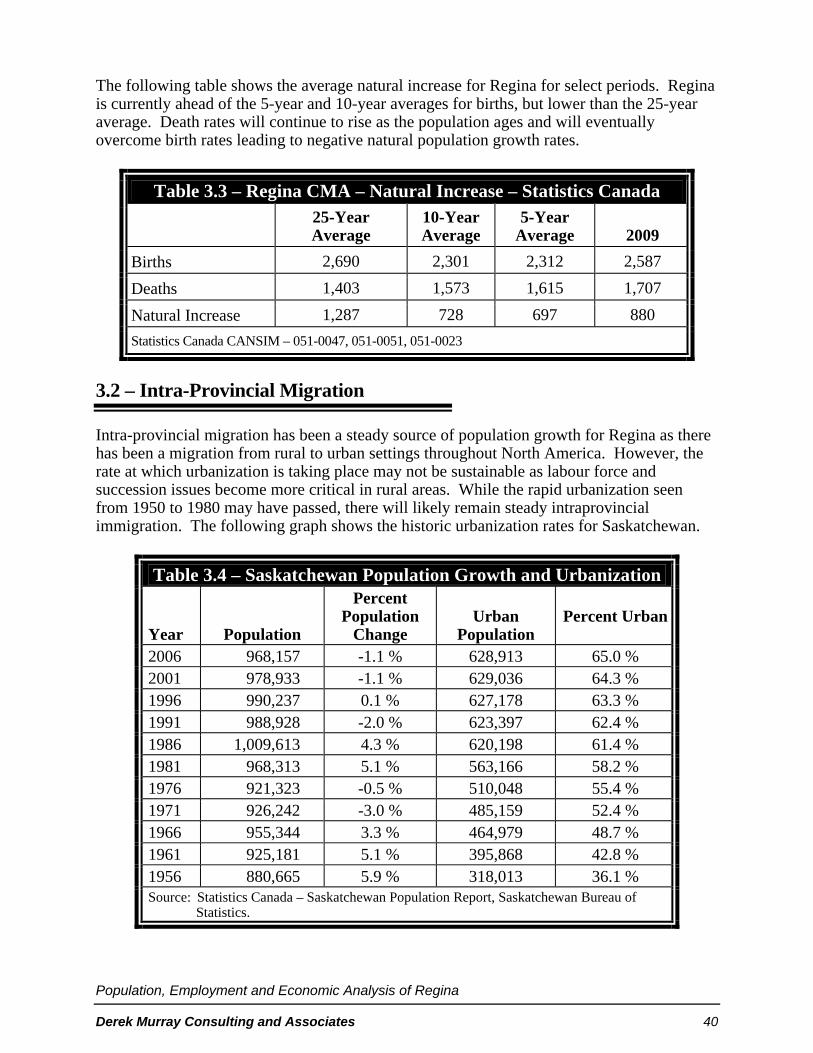
Population, Employment and Economic Analysis of Regina
Derek Murray Consulting and Associates 40
The following table shows the average natural increase for Regina for select periods. Regina is currently ahead of the 5-year and 10-year averages for births, but lower than the 25-year average. Death rates will continue to rise as the population ages and will eventually overcome birth rates leading to negative natural population growth rates.
Table 3.3 – Regina CMA – Natural Increase – Statistics Canada 25-Year
Average 10-Year Average
5-Year Average
2009
Births 2,690 2,301 2,312 2,587
Deaths 1,403 1,573 1,615 1,707
Natural Increase 1,287 728 697 880
Statistics Canada CANSIM – 051-0047, 051-0051, 051-0023
3.2 – Intra-Provincial Migration
Intra-provincial migration has been a steady source of population growth for Regina as there has been a migration from rural to urban settings throughout North America. However, the rate at which urbanization is taking place may not be sustainable as labour force and succession issues become more critical in rural areas. While the rapid urbanization seen from 1950 to 1980 may have passed, there will likely remain steady intraprovincial immigration. The following graph shows the historic urbanization rates for Saskatchewan.
Table 3.4 – Saskatchewan Population Growth and Urbanization Year
Population
Percent Population
Change
Urban
Population
Percent Urban
2006 968,157 -1.1 % 628,913 65.0 % 2001 978,933 -1.1 % 629,036 64.3 % 1996 990,237 0.1 % 627,178 63.3 % 1991 988,928 -2.0 % 623,397 62.4 % 1986 1,009,613 4.3 % 620,198 61.4 % 1981 968,313 5.1 % 563,166 58.2 % 1976 921,323 -0.5 % 510,048 55.4 % 1971 926,242 -3.0 % 485,159 52.4 % 1966 955,344 3.3 % 464,979 48.7 % 1961 925,181 5.1 % 395,868 42.8 % 1956 880,665 5.9 % 318,013 36.1 % Source: Statistics Canada – Saskatchewan Population Report, Saskatchewan Bureau of
Statistics.

Population, Employment and Economic Analysis of Regina
Derek Murray Consulting and Associates 41
While the rate of urbanization may be declining, intraprovincial migration has remained a constant source of in-migration for Regina. The following graph shows the historic intraprovincial migration trends.
Graph 3.3
Statistics Canada CANSIM – 051-0047, 051-0051, 051-0023
Intraprovincial population growth for Regina has been constant over the past ten years. The following table shows the average net in-migration from intraprovincial sources for selected years. Over the past ten years Regina has been above the average intraprovincial in-migration rates. Weakness in the agricultural economy coupled with strength in Regina’s economy has led to strong in-migration.
During the periods from 1977 to 1985 and 1991 to 1998 intraprovincial in-migration was limited. For the periods from 1986 to 1990 and 1999 to 2009 there has been significant immigration. Depopulation in rural Saskatchewan likely means that the spikes in in-migration seen in the late 1980s will not likely happen again, however, more recent trends of in-migration may be sustainable.
Table 3.5 – Average Net Intraprovincial – Regina CMA
Years Average
Population Growth
1977/1985 148 1986/1990 879 1991/1998 349 1999/2009 596 1977/2009 456
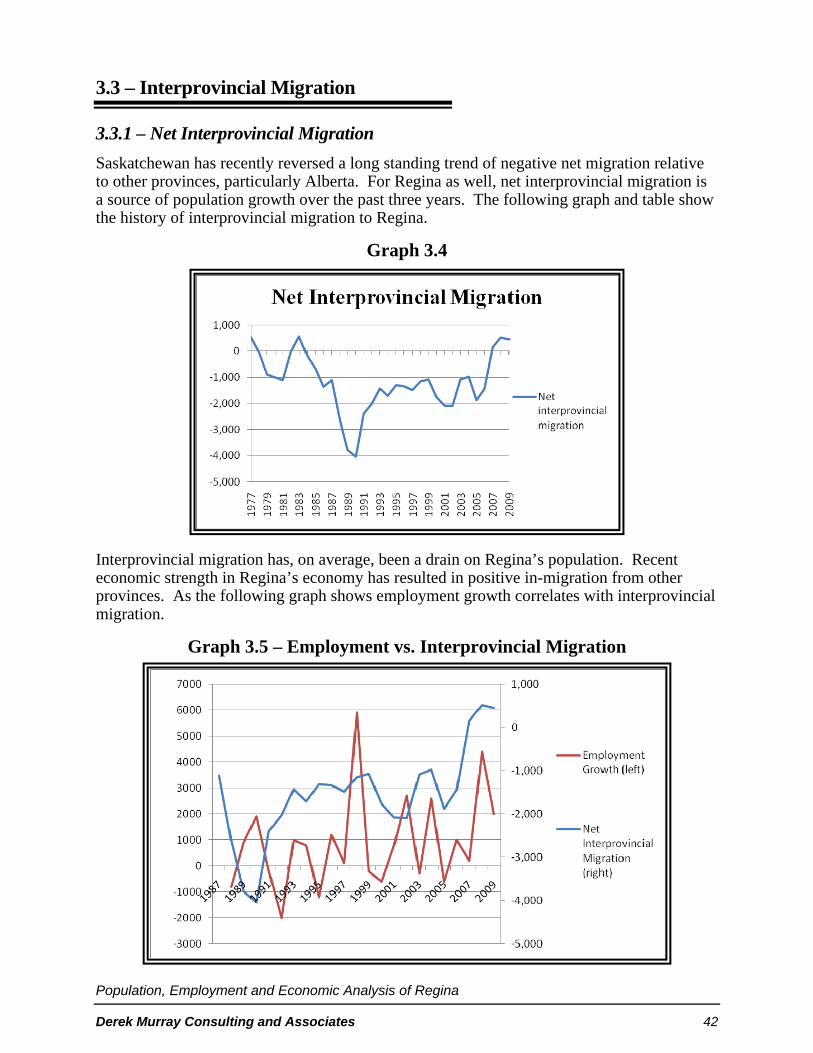
Population, Employment and Economic Analysis of Regina
Derek Murray Consulting and Associates 42
3.3 – Interprovincial Migration
3.3.1 – Net Interprovincial Migration
Saskatchewan has recently reversed a long standing trend of negative net migration relative to other provinces, particularly Alberta. For Regina as well, net interprovincial migration is a source of population growth over the past three years. The following graph and table show the history of interprovincial migration to Regina.
Graph 3.4
Interprovincial migration has, on average, been a drain on Regina’s population. Recent economic strength in Regina’s economy has resulted in positive in-migration from other provinces. As the following graph shows employment growth correlates with interprovincial migration.
Graph 3.5 – Employment vs. Interprovincial Migration
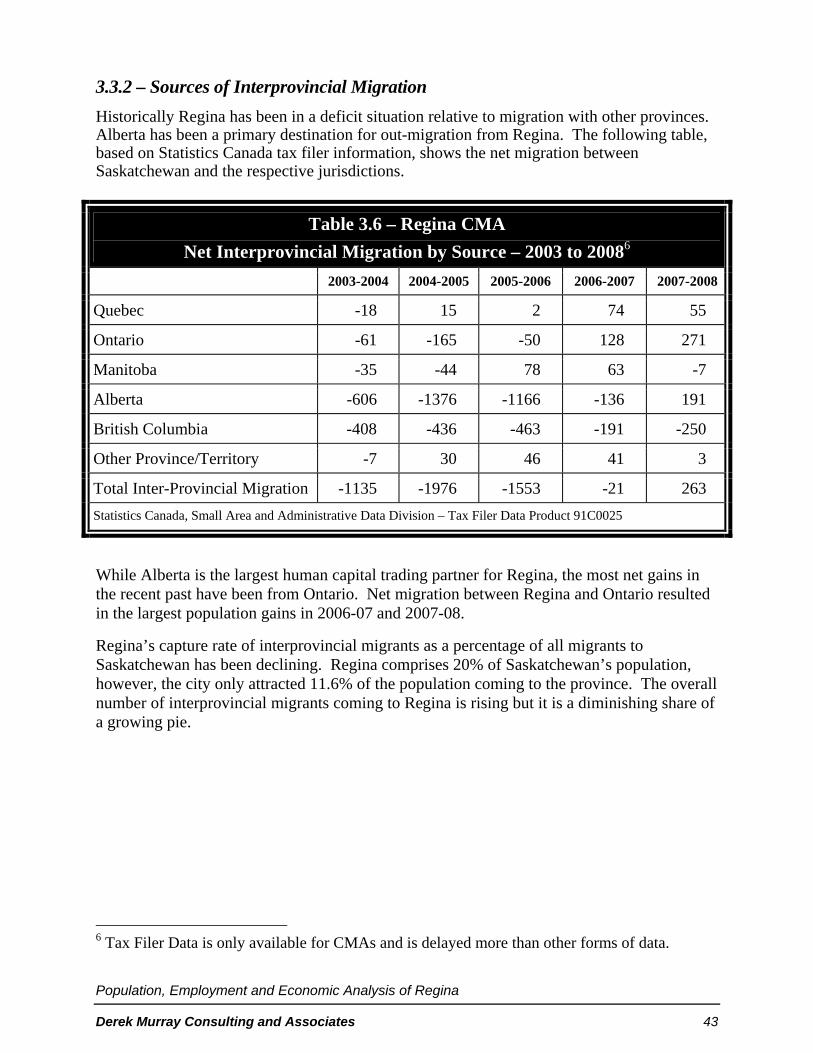
Population, Employment and Economic Analysis of Regina
Derek Murray Consulting and Associates 43
3.3.2 – Sources of Interprovincial Migration
Historically Regina has been in a deficit situation relative to migration with other provinces. Alberta has been a primary destination for out-migration from Regina. The following table, based on Statistics Canada tax filer information, shows the net migration between Saskatchewan and the respective jurisdictions.
Table 3.6 – Regina CMA
Net Interprovincial Migration by Source – 2003 to 20086
2003-2004 2004-2005 2005-2006 2006-2007 2007-2008
Quebec -18 15 2 74 55
Ontario -61 -165 -50 128 271
Manitoba -35 -44 78 63 -7
Alberta -606 -1376 -1166 -136 191
British Columbia -408 -436 -463 -191 -250
Other Province/Territory -7 30 46 41 3
Total Inter-Provincial Migration -1135 -1976 -1553 -21 263
Statistics Canada, Small Area and Administrative Data Division – Tax Filer Data Product 91C0025
While Alberta is the largest human capital trading partner for Regina, the most net gains in the recent past have been from Ontario. Net migration between Regina and Ontario resulted in the largest population gains in 2006-07 and 2007-08.
Regina’s capture rate of interprovincial migrants as a percentage of all migrants to Saskatchewan has been declining. Regina comprises 20% of Saskatchewan’s population, however, the city only attracted 11.6% of the population coming to the province. The overall number of interprovincial migrants coming to Regina is rising but it is a diminishing share of a growing pie.
6 Tax Filer Data is only available for CMAs and is delayed more than other forms of data.
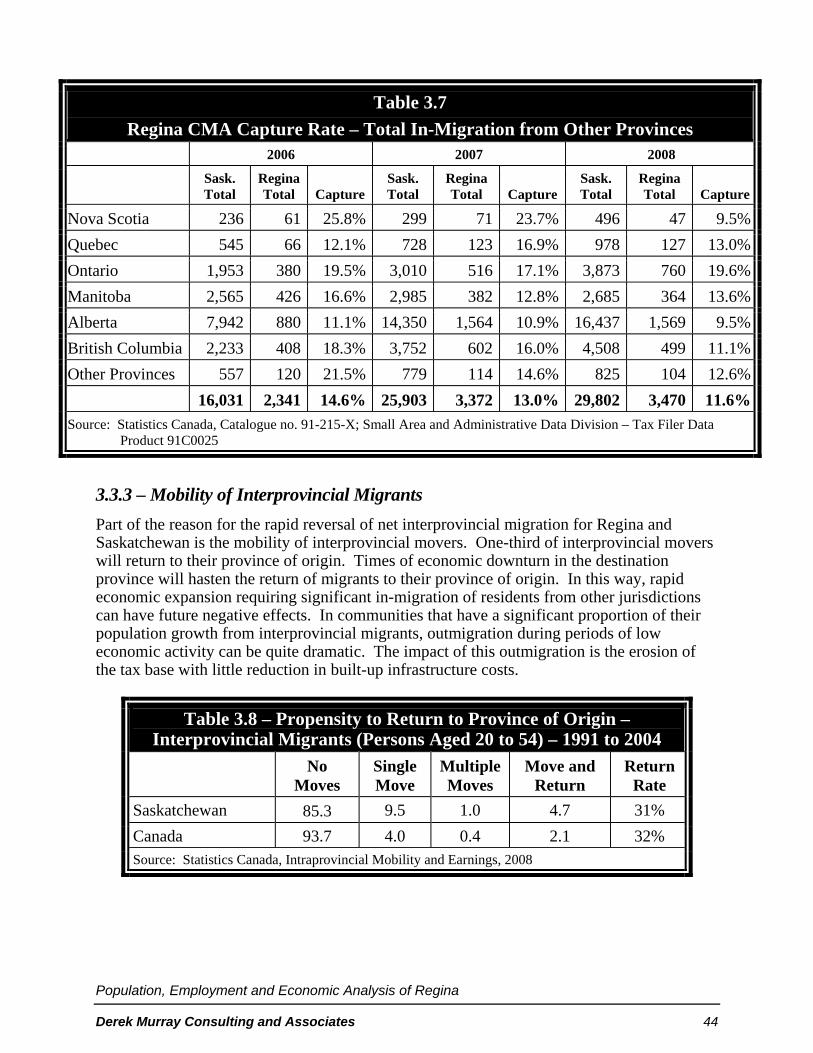
Population, Employment and Economic Analysis of Regina
Derek Murray Consulting and Associates 44
Table 3.7
Regina CMA Capture Rate – Total In-Migration from Other Provinces 2006 2007 2008
Sask. Total
Regina Total
Capture
Sask. Total
Regina Total
Capture
Sask. Total
Regina Total
Capture
Nova Scotia 236 61 25.8% 299 71 23.7% 496 47 9.5%
Quebec 545 66 12.1% 728 123 16.9% 978 127 13.0%
Ontario 1,953 380 19.5% 3,010 516 17.1% 3,873 760 19.6%
Manitoba 2,565 426 16.6% 2,985 382 12.8% 2,685 364 13.6%
Alberta 7,942 880 11.1% 14,350 1,564 10.9% 16,437 1,569 9.5%
British Columbia 2,233 408 18.3% 3,752 602 16.0% 4,508 499 11.1%
Other Provinces 557 120 21.5% 779 114 14.6% 825 104 12.6%
16,031 2,341 14.6% 25,903 3,372 13.0% 29,802 3,470 11.6%
Source: Statistics Canada, Catalogue no. 91-215-X; Small Area and Administrative Data Division – Tax Filer Data Product 91C0025
3.3.3 – Mobility of Interprovincial Migrants
Part of the reason for the rapid reversal of net interprovincial migration for Regina and Saskatchewan is the mobility of interprovincial movers. One-third of interprovincial movers will return to their province of origin. Times of economic downturn in the destination province will hasten the return of migrants to their province of origin. In this way, rapid economic expansion requiring significant in-migration of residents from other jurisdictions can have future negative effects. In communities that have a significant proportion of their population growth from interprovincial migrants, outmigration during periods of low economic activity can be quite dramatic. The impact of this outmigration is the erosion of the tax base with little reduction in built-up infrastructure costs.
Table 3.8 – Propensity to Return to Province of Origin – Interprovincial Migrants (Persons Aged 20 to 54) – 1991 to 2004
No Moves
Single Move
Multiple Moves
Move and Return
Return Rate
Saskatchewan 85.3 9.5 1.0 4.7 31%
Canada 93.7 4.0 0.4 2.1 32% Source: Statistics Canada, Intraprovincial Mobility and Earnings, 2008
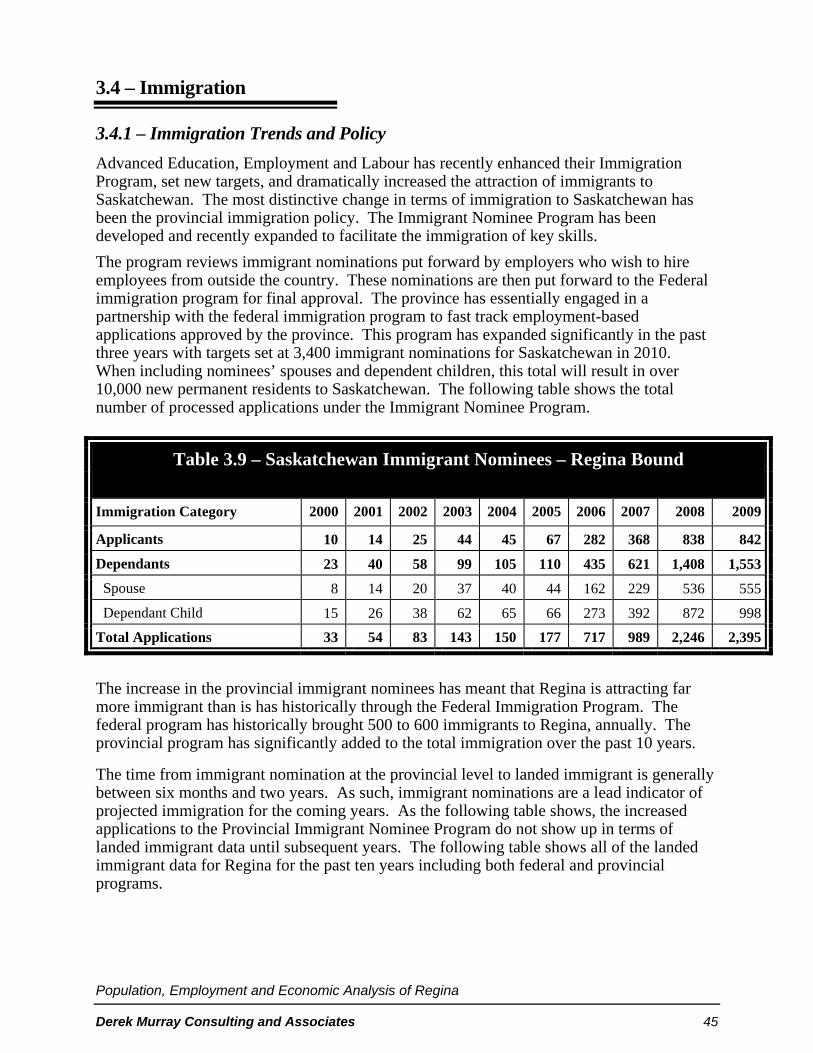
Population, Employment and Economic Analysis of Regina
Derek Murray Consulting and Associates 45
3.4 – Immigration
3.4.1 – Immigration Trends and Policy
Advanced Education, Employment and Labour has recently enhanced their Immigration Program, set new targets, and dramatically increased the attraction of immigrants to Saskatchewan. The most distinctive change in terms of immigration to Saskatchewan has been the provincial immigration policy. The Immigrant Nominee Program has been developed and recently expanded to facilitate the immigration of key skills.
The program reviews immigrant nominations put forward by employers who wish to hire employees from outside the country. These nominations are then put forward to the Federal immigration program for final approval. The province has essentially engaged in a partnership with the federal immigration program to fast track employment-based applications approved by the province. This program has expanded significantly in the past three years with targets set at 3,400 immigrant nominations for Saskatchewan in 2010. When including nominees’ spouses and dependent children, this total will result in over 10,000 new permanent residents to Saskatchewan. The following table shows the total number of processed applications under the Immigrant Nominee Program.
Table 3.9 – Saskatchewan Immigrant Nominees – Regina Bound
Immigration Category 2000 2001 2002 2003 2004 2005 2006 2007 2008 2009
Applicants 10 14 25 44 45 67 282 368 838 842
Dependants 23 40 58 99 105 110 435 621 1,408 1,553
Spouse 8 14 20 37 40 44 162 229 536 555
Dependant Child 15 26 38 62 65 66 273 392 872 998
Total Applications 33 54 83 143 150 177 717 989 2,246 2,395
The increase in the provincial immigrant nominees has meant that Regina is attracting far more immigrant than is has historically through the Federal Immigration Program. The federal program has historically brought 500 to 600 immigrants to Regina, annually. The provincial program has significantly added to the total immigration over the past 10 years.
The time from immigrant nomination at the provincial level to landed immigrant is generally between six months and two years. As such, immigrant nominations are a lead indicator of projected immigration for the coming years. As the following table shows, the increased applications to the Provincial Immigrant Nominee Program do not show up in terms of landed immigrant data until subsequent years. The following table shows all of the landed immigrant data for Regina for the past ten years including both federal and provincial programs.
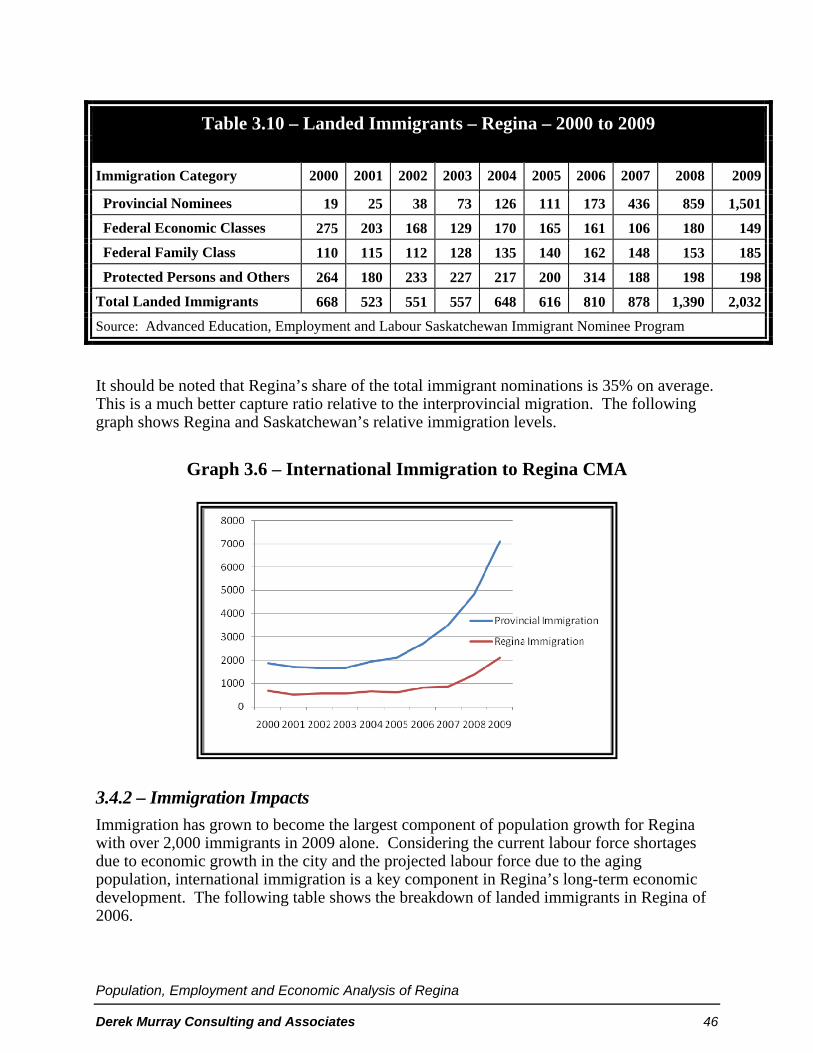
Population, Employment and Economic Analysis of Regina
Derek Murray Consulting and Associates 46
Table 3.10 – Landed Immigrants – Regina – 2000 to 2009
Immigration Category 2000 2001 2002 2003 2004 2005 2006 2007 2008 2009
Provincial Nominees 19 25 38 73 126 111 173 436 859 1,501
Federal Economic Classes 275 203 168 129 170 165 161 106 180 149
Federal Family Class 110 115 112 128 135 140 162 148 153 185
Protected Persons and Others 264 180 233 227 217 200 314 188 198 198
Total Landed Immigrants 668 523 551 557 648 616 810 878 1,390 2,032
Source: Advanced Education, Employment and Labour Saskatchewan Immigrant Nominee Program
It should be noted that Regina’s share of the total immigrant nominations is 35% on average. This is a much better capture ratio relative to the interprovincial migration. The following graph shows Regina and Saskatchewan’s relative immigration levels.
Graph 3.6 – International Immigration to Regina CMA
3.4.2 – Immigration Impacts
Immigration has grown to become the largest component of population growth for Regina with over 2,000 immigrants in 2009 alone. Considering the current labour force shortages due to economic growth in the city and the projected labour force due to the aging population, international immigration is a key component in Regina’s long-term economic development. The following table shows the breakdown of landed immigrants in Regina of 2006.

Population, Employment and Economic Analysis of Regina
Derek Murray Consulting and Associates 47
Table 3.11 Regina, City Immigrants – 2006
Total Population 176,915 Non-Immigrants 161,540 Immigrants 14,130
Before 1991 8,540 1991 to 2000 3,110 2001 to 2006 2,485
Non-Permanent Residents 1,240
As of 2006 there were 2,500 recent immigrants living in Regina that had arrived in Regina in the previous five years. According to landed immigrant data detailed previously 3,180 arrived in Regina over that period. This would indicate a retention ratio of around 80% for the immigrants that come to Regina.
Given the 14,000 immigrants in Regina as of 2006 and the 3,800 immigrants that have arrived since 2006 the immigrant population in Regina would be approximately 17,100 in 2009, after considering the immigrant retention ratio calculated previously.
AEEL targets for immigration are 10,000 nominees annually, projected to translate into 3,300 immigrants moving to Regina. At this rate, and considering an 80% retention ratio, the 2009 immigrant population of 17,100 will more than double by 2026 to 35,580. This would equate to between 14% and 17% of the population of Regina in 2026.
3.5 – Aboriginal Population Growth
In 2006 the Aboriginal population of Regina was 16,535, an increase of 1,240 over 2001 or and annual growth rate of 250. While the growth seems small, it was likely impacted by out-migration. Over the same period Regina’s population as a whole lost 600 residents.
Table 3.12 – Regina City – Total Aboriginal Population Total Population 176,915
Aboriginal Population 16,535
Non-Aboriginal Population 160,380
Percentage of the Provincial Aboriginal Population 11.7% Source: Statistics Canada Aboriginal Profiles
Regina’s Aboriginal population grew at almost half the rate of the previous five years. While fertility rates were down slightly over the period, this could not account for the total reduction in growth. It is likely that the broader out-migration trend in the community also

Population, Employment and Economic Analysis of Regina
Derek Murray Consulting and Associates 48
had an impact on Aboriginal population growth. A stronger economy will likely have a positive impact on Aboriginal population growth through both in-migration and a reduction in out-migration.
Table 3.13 Regina City – Aboriginal Population Growth – 1996 to 2006
2001 - 2006 1996 – 2001 Aboriginal Population 16,535 15,300 Total Growth 1,240 1,965 Growth Rate 8.1% 14.7% Annual Growth Rate 1.6% 2.9% Fertility Rates 2.6 (2006) 2.8 (1996) Source: Statistics Canada Aboriginal Profiles
Growth in Regina’s First Nations population from 2001 to 2006 was negligible. The bulk (94%) of growth in the Aboriginal population was due to the increase in the number of Métis people.
Table 3.14 – Aboriginal Population Demographics
2001
2006 Change in Population
Percentage Change
North American Indian single response 9,110 9,265 155 1.7%
Métis single response 5,700 6,855 1,155 20.3%
Inuit single response 30 20 -10 -33.3%
Multiple Aboriginal 110 200 90 81.8%
Other Aboriginal 355 180 -175 -49.3%
Aboriginal identity population 15,300 16,535 1,235 8.1%
Aboriginal population growth rates for Regina have declined over the past 55 years. This is due in part to the size of the Aboriginal population in Regina and the relative impact population numbers have as the base population grows. However, both in real and relative terms, Aboriginal population growth rates have been declining in Regina since a peak annual growth rate of 463 annually from 1991 to 1996.

Population, Employment and Economic Analysis of Regina
Derek Murray Consulting and Associates 49
Table 3.15 – Aboriginal Historical Growth Rates – Regina City 1951 to 2006
Year
Total Population
Total Growth
Average Growth Per Year
Average Annual Growth
2006 16,535 8.1% 1.6% 247
2001 15,300 14.7% 2.9% 393
1996 13,335 17.4% 3.5% 463
1991 11,020 40.3% 4.0% 445
1981 6,575 56.5% 5.7% 372
1971 2,860 81.2% 8.1% 232
1961 539 70.3% 7.0% 38
1951 160
Source: Statistics Canada Aboriginal Profiles, Socio-Demographic Study of Aboriginal People in Saskatoon, Alan B Anderson, 2005
Graph 3.7
While Aboriginal population growth rates have declined over time, the population growth rate will remain higher than for non-Aboriginal people. As detailed information on Aboriginal populations is only available through Statistics Canada five-year Census data, it is difficult to analyze how the recent upturn in the economy has impacted Aboriginal population growth. However, it is safe to assume that higher in-migration patterns can be extended to the Aboriginal population.

Population, Employment and Economic Analysis of Regina
Derek Murray Consulting and Associates 50
4.0 Population Forecasts
4.1 – Growth Projections
The following establishes the parameters for growth in Regina. While economic growth cannot be forecast over a 25-year period, providing a set of parameters allows the population growth model to be applied under various changing economic circumstances. The following three scenarios show the circumstances considered for each of the population growth components.
Table 4.1 – Economic Parameters for Population Growth
Projections
Components Rates
GDP Growth 3.0% - 5.0%
Unemployment Rate 4.0% - 5.0% High Economic Growth
Participation Rate 69% - 71%
GDP Growth 1.5% - 3.0%
Unemployment Rate 5.0 % - 6.0% Moderate Economic Growth
Participation Rate 68% - 69%
GDP Growth 0.0% – 1.5%
Unemployment Rate 6.0% - 8.0% Low Economic Growth
Participation Rate 66% - 67%
4.2 – Birth and Death Rates
There has been a recent uptrend in fertility rates, however, this trend will quickly succumb to greater demographic factors around an aging population and fertility rates that stopped replacing the population in the 1980s. As the population ages, death rates will continue to climb and birth rates will continue to drop. As the following graph shows, the natural increase in the population will become nearly negative by 2035 under the low birth and death rate projection. Based on provincial cohort analysis, predicting birth and death rates for 5-year age ranges, as well as the most recent birth and death statistics for Regina, the following graph shows the projected natural increase for Regina.

Population, Employment and Economic Analysis of Regina
Derek Murray Consulting and Associates 51
Graph 4.1 – Natural Increase Projections for Regina City
4.3 – Intra-Provincial Migration
As shown in the previous chapter, intraprovincial migration has been a steady source of in-migration to Regina over time. The major source of this in-migration is urbanization as individuals move from rural areas to Regina. Given the level of urbanization to date, the capacity for rural Saskatchewan to continue to provide significant levels of in-migration is becoming strained. However, the net in-migration will remain positive as urbanization remains a force. This trend will continue at some level for the foreseeable future. As the following table shows, the level of in-migration is a relatively narrow band with urbanization trends providing a floor supporting constant in-migration and the capacity of rural Saskatchewan to support further out-migration forming a ceiling.
Graph 4.2 – Intra-provincial Migration Projections for Regina City
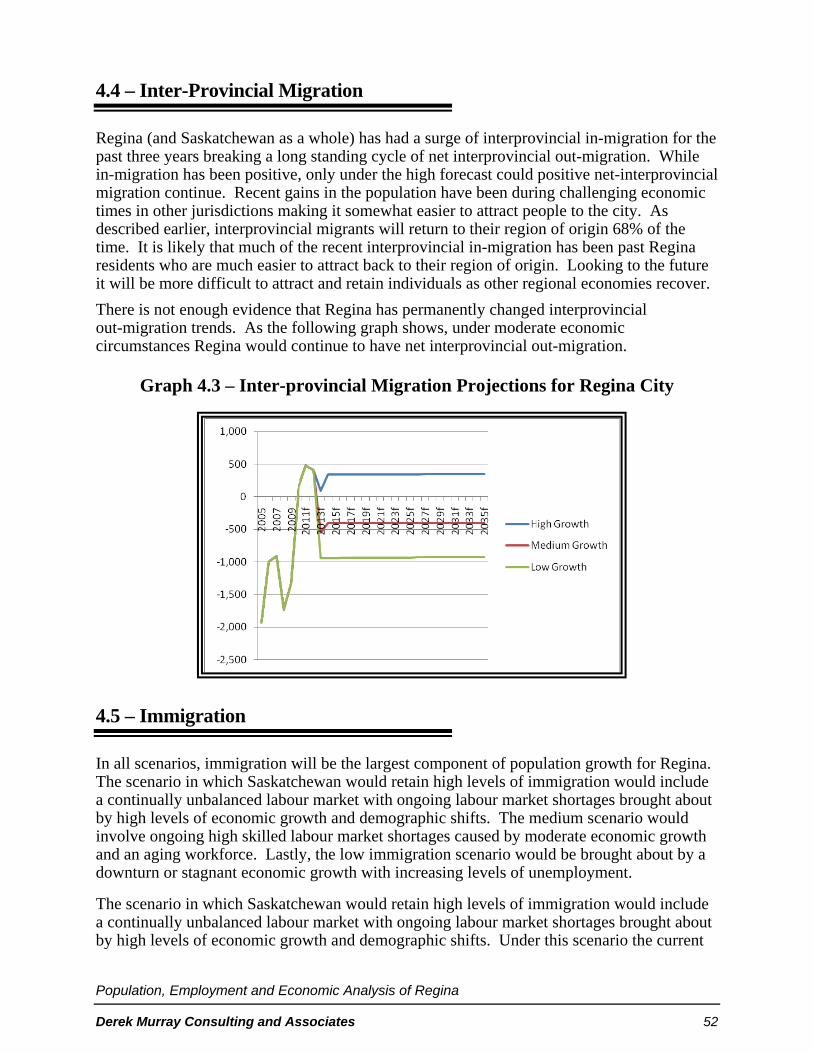
Population, Employment and Economic Analysis of Regina
Derek Murray Consulting and Associates 52
4.4 – Inter-Provincial Migration
Regina (and Saskatchewan as a whole) has had a surge of interprovincial in-migration for the past three years breaking a long standing cycle of net interprovincial out-migration. While in-migration has been positive, only under the high forecast could positive net-interprovincial migration continue. Recent gains in the population have been during challenging economic times in other jurisdictions making it somewhat easier to attract people to the city. As described earlier, interprovincial migrants will return to their region of origin 68% of the time. It is likely that much of the recent interprovincial in-migration has been past Regina residents who are much easier to attract back to their region of origin. Looking to the future it will be more difficult to attract and retain individuals as other regional economies recover.
There is not enough evidence that Regina has permanently changed interprovincial out-migration trends. As the following graph shows, under moderate economic circumstances Regina would continue to have net interprovincial out-migration.
Graph 4.3 – Inter-provincial Migration Projections for Regina City
4.5 – Immigration
In all scenarios, immigration will be the largest component of population growth for Regina. The scenario in which Saskatchewan would retain high levels of immigration would include a continually unbalanced labour market with ongoing labour market shortages brought about by high levels of economic growth and demographic shifts. The medium scenario would involve ongoing high skilled labour market shortages caused by moderate economic growth and an aging workforce. Lastly, the low immigration scenario would be brought about by a downturn or stagnant economic growth with increasing levels of unemployment.
The scenario in which Saskatchewan would retain high levels of immigration would include a continually unbalanced labour market with ongoing labour market shortages brought about by high levels of economic growth and demographic shifts. Under this scenario the current
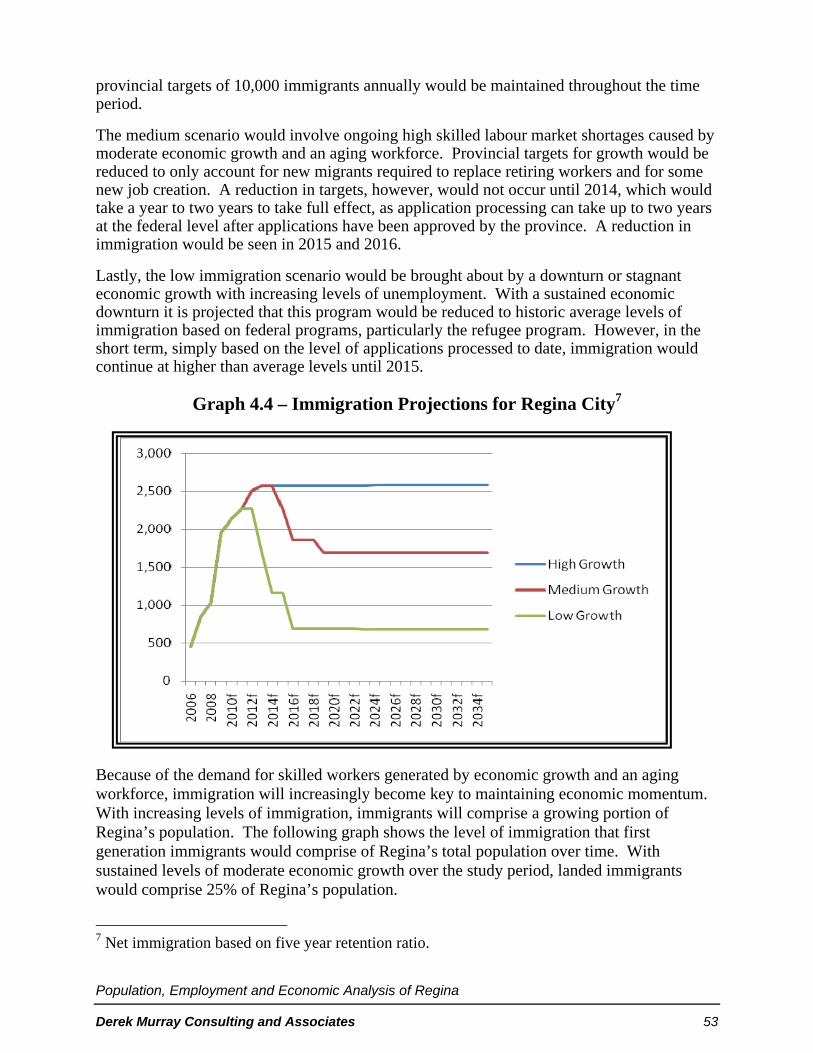
Population, Employment and Economic Analysis of Regina
Derek Murray Consulting and Associates 53
provincial targets of 10,000 immigrants annually would be maintained throughout the time period.
The medium scenario would involve ongoing high skilled labour market shortages caused by moderate economic growth and an aging workforce. Provincial targets for growth would be reduced to only account for new migrants required to replace retiring workers and for some new job creation. A reduction in targets, however, would not occur until 2014, which would take a year to two years to take full effect, as application processing can take up to two years at the federal level after applications have been approved by the province. A reduction in immigration would be seen in 2015 and 2016.
Lastly, the low immigration scenario would be brought about by a downturn or stagnant economic growth with increasing levels of unemployment. With a sustained economic downturn it is projected that this program would be reduced to historic average levels of immigration based on federal programs, particularly the refugee program. However, in the short term, simply based on the level of applications processed to date, immigration would continue at higher than average levels until 2015.
Graph 4.4 – Immigration Projections for Regina City7
Because of the demand for skilled workers generated by economic growth and an aging workforce, immigration will increasingly become key to maintaining economic momentum. With increasing levels of immigration, immigrants will comprise a growing portion of Regina’s population. The following graph shows the level of immigration that first generation immigrants would comprise of Regina’s total population over time. With sustained levels of moderate economic growth over the study period, landed immigrants would comprise 25% of Regina’s population.
7 Net immigration based on five year retention ratio.
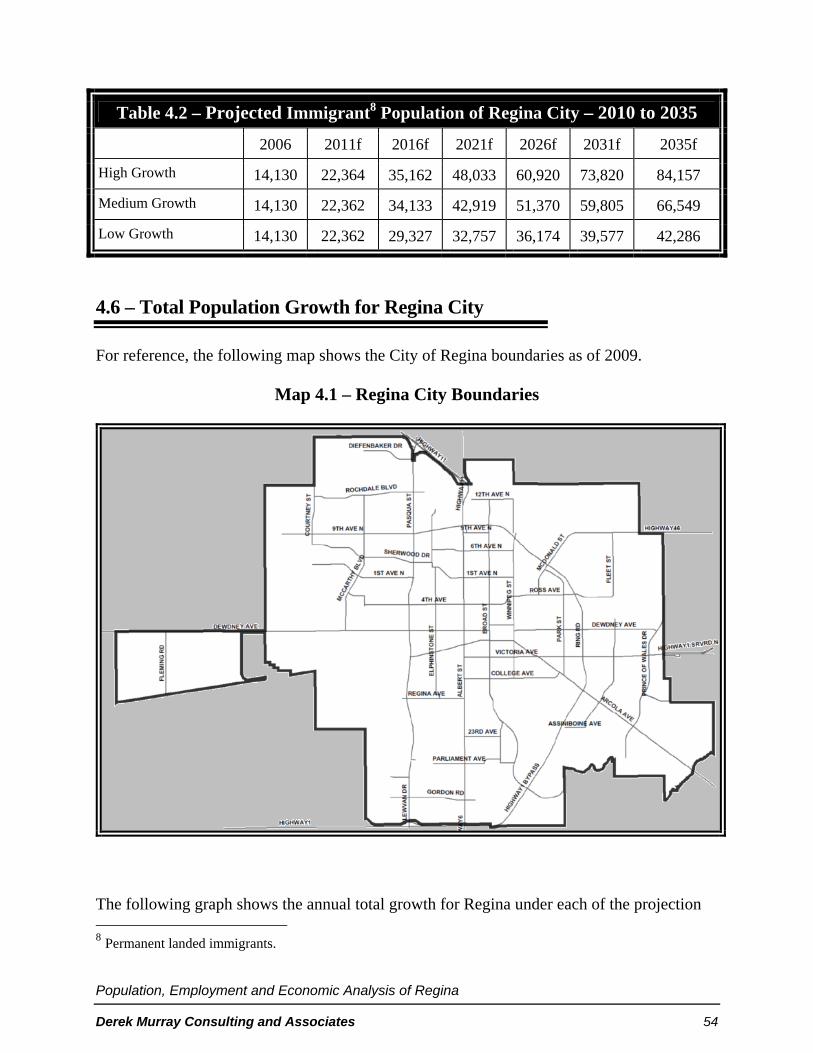
Population, Employment and Economic Analysis of Regina
Derek Murray Consulting and Associates 54
Table 4.2 – Projected Immigrant8 Population of Regina City – 2010 to 2035
2006 2011f 2016f 2021f 2026f 2031f 2035f
High Growth 14,130 22,364 35,162 48,033 60,920 73,820 84,157
Medium Growth 14,130 22,362 34,133 42,919 51,370 59,805 66,549
Low Growth 14,130 22,362 29,327 32,757 36,174 39,577 42,286
4.6 – Total Population Growth for Regina City
For reference, the following map shows the City of Regina boundaries as of 2009.
Map 4.1 – Regina City Boundaries
The following graph shows the annual total growth for Regina under each of the projection 8 Permanent landed immigrants.

Population, Employment and Economic Analysis of Regina
Derek Murray Consulting and Associates 55
scenarios.
Graph 4.5 – Annual Growth Projections for Regina City
Based on the above annual growth, the following growth patterns are projected under the respective economic circumstances:
Under a high growth scenario, Regina’s population would grow to 302,621 in 2035 at an average annual growth rate of 4,204 people per year or an average annual growth rate of 1.74%.
Under medium projections based on moderate economic growth, Regina would grow to a size of 257,950 in 2035 at a rate of 2,486 per year or a 1.12% annual growth rate.
Based on the low growth model, Regina would grow to a population of 210,246 by 2035 at an annual growth rate of 658 people per year or a 0.33% annual growth rate.
The projected 1.12% growth rate for Regina under the medium scenario is less than the 1.34% average growth rate for Canadian CMAs in the last census. CMAs, driven by urbanization, are the fastest growing form of community in Canada. Under the low growth rate Regina would grow at an average rate just better than the Canadian small town and rural area rate of growth. Only under the high growth scenario (1.74%) Regina would exceed the average growth of Canadian CMAs (1.34%). The following table shows the growth rates for rural and urban Canadian communities.
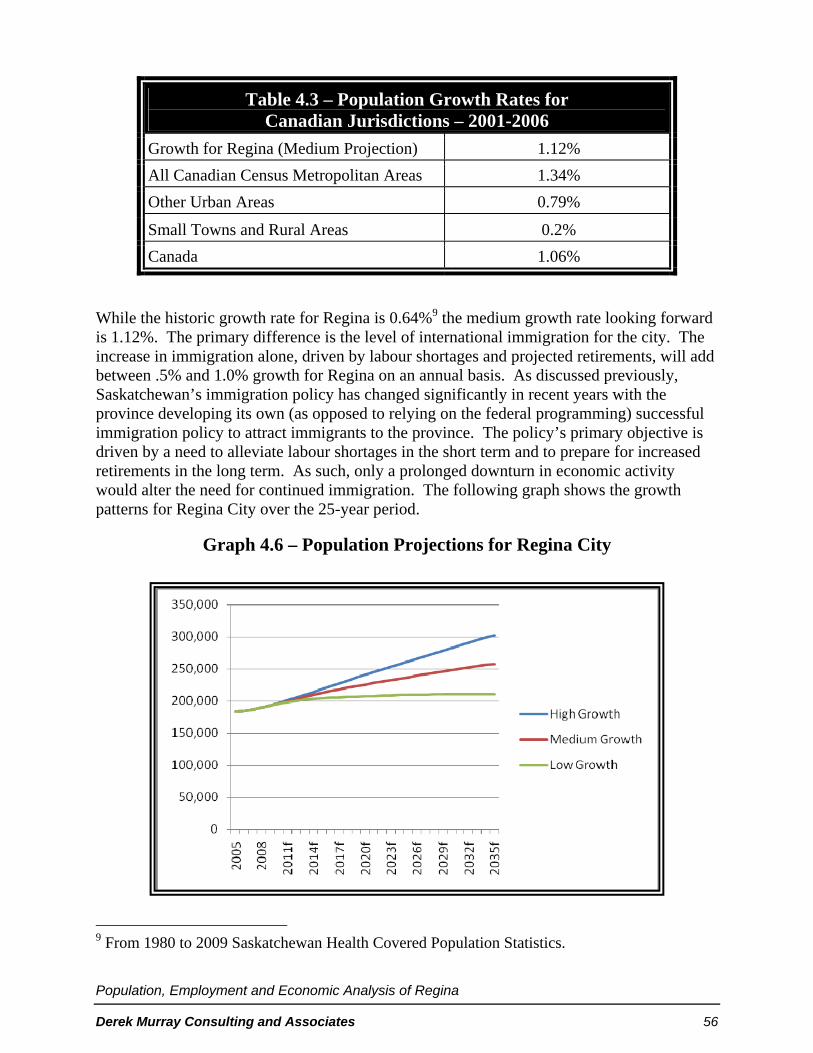
Population, Employment and Economic Analysis of Regina
Derek Murray Consulting and Associates 56
Table 4.3 – Population Growth Rates for Canadian Jurisdictions – 2001-2006
Growth for Regina (Medium Projection) 1.12%
All Canadian Census Metropolitan Areas 1.34%
Other Urban Areas 0.79%
Small Towns and Rural Areas 0.2%
Canada 1.06%
While the historic growth rate for Regina is 0.64%9 the medium growth rate looking forward is 1.12%. The primary difference is the level of international immigration for the city. The increase in immigration alone, driven by labour shortages and projected retirements, will add between .5% and 1.0% growth for Regina on an annual basis. As discussed previously, Saskatchewan’s immigration policy has changed significantly in recent years with the province developing its own (as opposed to relying on the federal programming) successful immigration policy to attract immigrants to the province. The policy’s primary objective is driven by a need to alleviate labour shortages in the short term and to prepare for increased retirements in the long term. As such, only a prolonged downturn in economic activity would alter the need for continued immigration. The following graph shows the growth patterns for Regina City over the 25-year period.
Graph 4.6 – Population Projections for Regina City
9 From 1980 to 2009 Saskatchewan Health Covered Population Statistics.

Population, Employment and Economic Analysis of Regina
Derek Murray Consulting and Associates 57
The following graphs show the components of growth under each of the scenarios. Immigration plays the most dominant role in each of the scenarios while interprovincial migration is negative in both the medium and low growth scenarios. It should also be noted that natural increase is reduced to nearly zero in the low growth scenario.
Graph 4.7 – Components of High Growth Scenario
Graph 4.8 – Components of Medium Growth Scenario

Population, Employment and Economic Analysis of Regina
Derek Murray Consulting and Associates 58
Graph 4.9 – Components of Low Growth Scenario
Table 4.4 – Growth Projections for Regina City – 2010-2035
Regina Commuting Area 2005 2006 2007 2008 2009 2010f 2011f
High Growth 183,649 184,114 186,432 189,540 193,299 196,931 200,983
Medium Growth 183,649 184,114 186,432 189,540 193,299 196,123 199,254
Low Growth 183,649 184,114 186,432 189,540 193,299 195,590 198,003
2012f 2013f 2014f 2015f 2016f 2017f 2018f
High Growth 205,333 209,741 214,163 218,579 222,988 227,391 231,786
Medium Growth 202,644 206,114 209,579 212,711 215,370 218,023 220,650
Low Growth 200,389 202,149 203,305 204,410 204,994 205,571 206,121
2019f 2020f 2021f 2022f 2023f 2024f 2025f
High Growth 236,132 240,450 244,799 249,123 253,400 257,631 261,837
Medium Growth 223,075 225,513 227,904 230,250 232,570 234,865 237,094
Low Growth 206,683 207,216 207,725 208,208 208,644 209,036 209,381
2026f 2027f 2028f 2029f 2030f 2031f 2032f
High Growth 265,994 270,107 274,195 278,238 282,371 286,465 290,537
Medium Growth 239,277 241,435 243,548 245,638 247,778 249,897 251,974
Low Growth 209,700 209,953 210,163 210,329 210,453 210,533 210,571
2033f 2034f 2035f
High Growth 294,587 298,615 302,621
Medium Growth 254,008 256,000 257,950
Low Growth 210,565 210,516 210,425

Population, Employment and Economic Analysis of Regina
Derek Murray Consulting and Associates 59
Regina will reach a population size of 235,000 during the year 2024 under the medium growth scenario. The following graph shows the point at which Regina will hit this milestone.
Graph 4.10 – Projected Population of 235,000 for Regina City
4.7 – Externalities of Population Growth
Population has a great deal of external impacts on communities. Additional residents require housing, services, and other support services. While population growth is core to Regina’s economic and social success over the long term, support services will be required to facilitate this growth.
4.7.1 – Housing Demand
Based on the previous population forecasts, the following graph shows the annual housing demand that would be generated. This is based on the current housing density of 2.2410 people per household. This forecast does not include other types of demand generated by declining housing density or the replacement of aging housing stock.
10 Based on the population in private households and the total private dwellings in Regina city.

Population, Employment and Economic Analysis of Regina
Derek Murray Consulting and Associates 60
Table 4.5 – Projected Housing Demand – 2010 to 2035 2010f 2011f 2012f 2013f 2014f 2015f 2016f High Growth 1,623 1,798 1,924 1,951 1,960 1,961 1,962Medium Growth 1,277 1,405 1,514 1,549 1,549 1,415 1,222Low Growth 1,044 1,096 1,086 830 583 564 500 2017f 2018f 2019f 2020f 2021f 2022f 2023f High Growth 1,962 1,962 1,945 1,936 1,919 1,911 1,894Medium Growth 1,222 1,213 1,131 1,122 1,105 1,088 1,079Low Growth 500 500 500 500 500 500 500 2024f 2025f 2026f 2027f 2028f 2029f 2030f High Growth 1,878 1,870 1,852 1,836 1,828 1,812 1,804Medium Growth 1,070 1,044 1,028 1,019 1,002 994 970Low Growth 500 500 500 500 500 500 500 2031f 2032f 2033f 2034f 2035f High Growth 1,789 1,782 1,774 1,767 1,759 Medium Growth 962 945 929 912 896 Low Growth 500 500 500 500 500
Given the projected ongoing demand for housing, both rental and owned, and the tight housing market already faced in Regina, issues arise surrounding the capacity of Regina to absorb new residents. As many new migrants to communities will require rental accommodations, the rental market becomes a critical issue. While CMHC is projecting an easing in the rental market in 2010, this appears somewhat optimistic given the population projections.
Table 4.6 – Regina CMA – CMHC Rental Market Forecast – 2007 to 2010
2007 2008 2009 2010
Vacancy Rates 1.7% 0.5% 0.6% 2.0%
Average Rent $661 $756 $832 $840 – $860
In terms of housing starts, there will be significant ongoing demand based on moderate economic performance. Demand will remain high, and will become a barrier to population growth if supply is not met. The following shows the housing start forecast from CMHC. While the projections show significant housing start activity, this forecast still falls short of the forecast supply required based on population projections. This may continue to place upward pressure on housing prices impacting the ability of Regina to attract and retain new residents.
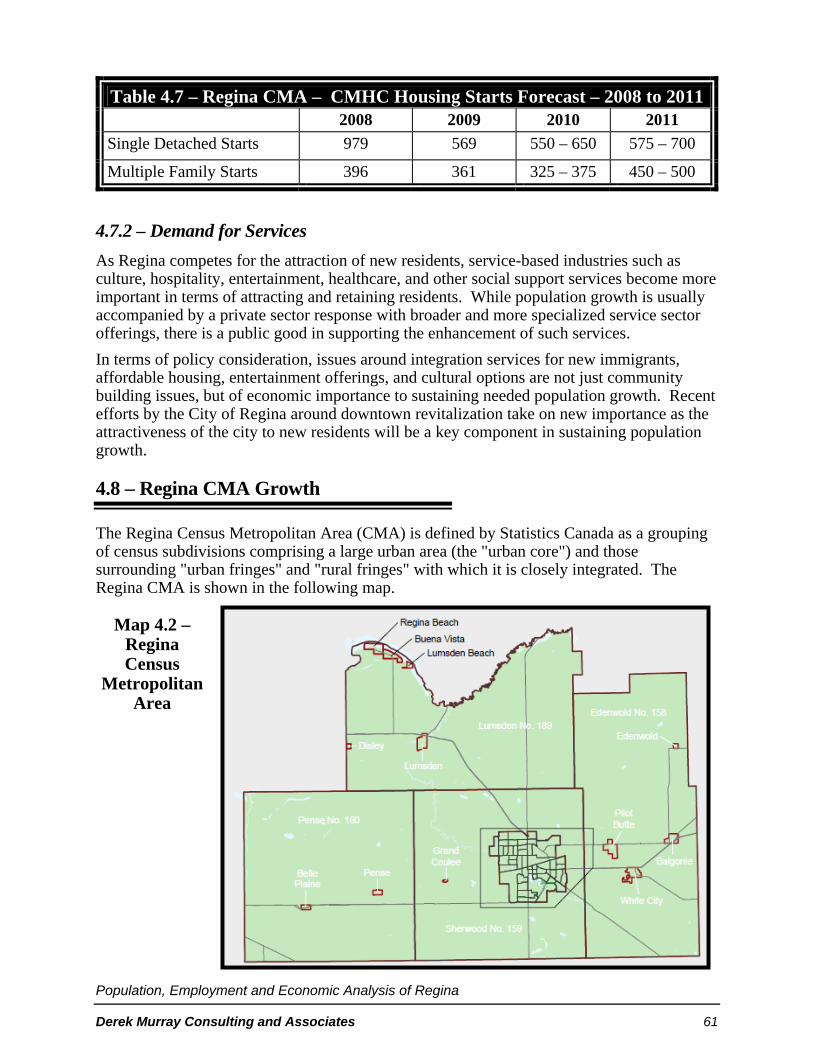
Population, Employment and Economic Analysis of Regina
Derek Murray Consulting and Associates 61
Table 4.7 – Regina CMA – CMHC Housing Starts Forecast – 2008 to 2011 2008 2009 2010 2011
Single Detached Starts 979 569 550 – 650 575 – 700
Multiple Family Starts 396 361 325 – 375 450 – 500
4.7.2 – Demand for Services
As Regina competes for the attraction of new residents, service-based industries such as culture, hospitality, entertainment, healthcare, and other social support services become more important in terms of attracting and retaining residents. While population growth is usually accompanied by a private sector response with broader and more specialized service sector offerings, there is a public good in supporting the enhancement of such services.
In terms of policy consideration, issues around integration services for new immigrants, affordable housing, entertainment offerings, and cultural options are not just community building issues, but of economic importance to sustaining needed population growth. Recent efforts by the City of Regina around downtown revitalization take on new importance as the attractiveness of the city to new residents will be a key component in sustaining population growth. 4.8 – Regina CMA Growth
The Regina Census Metropolitan Area (CMA) is defined by Statistics Canada as a grouping of census subdivisions comprising a large urban area (the "urban core") and those surrounding "urban fringes" and "rural fringes" with which it is closely integrated. The Regina CMA is shown in the following map.
Map 4.2 – Regina Census
Metropolitan Area
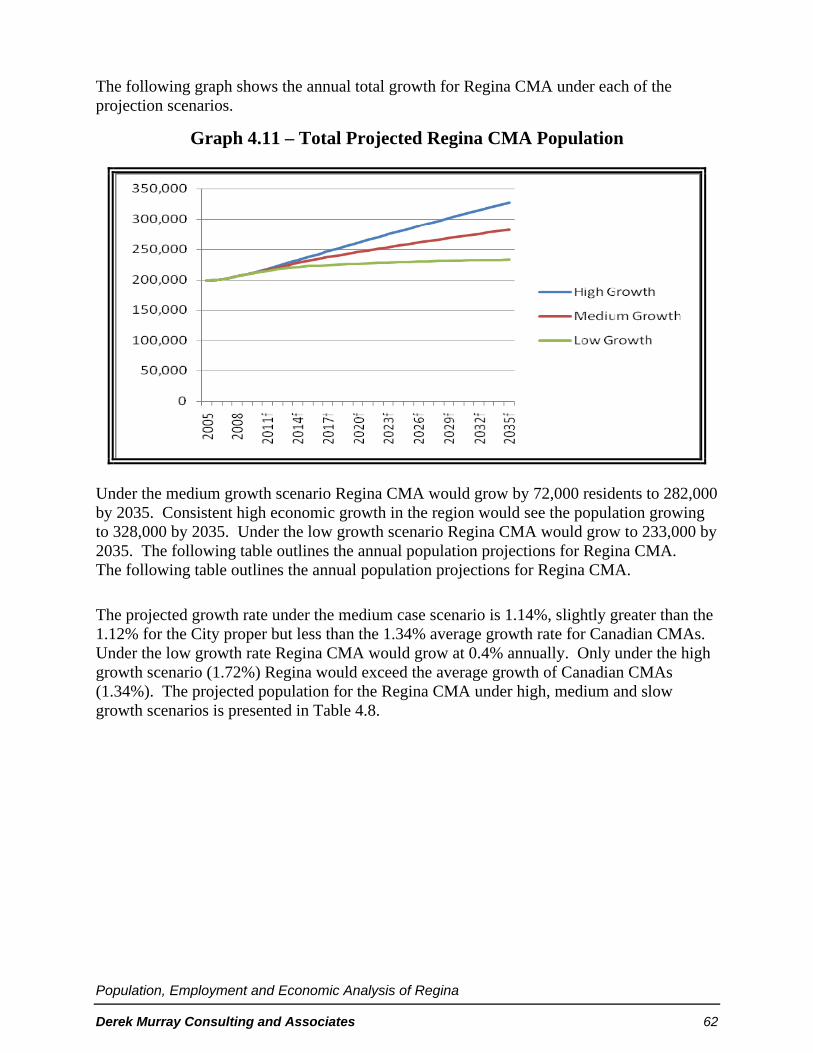
Population, Employment and Economic Analysis of Regina
Derek Murray Consulting and Associates 62
The following graph shows the annual total growth for Regina CMA under each of the projection scenarios.
Graph 4.11 – Total Projected Regina CMA Population
Under the medium growth scenario Regina CMA would grow by 72,000 residents to 282,000 by 2035. Consistent high economic growth in the region would see the population growing to 328,000 by 2035. Under the low growth scenario Regina CMA would grow to 233,000 by 2035. The following table outlines the annual population projections for Regina CMA. The following table outlines the annual population projections for Regina CMA.
The projected growth rate under the medium case scenario is 1.14%, slightly greater than the 1.12% for the City proper but less than the 1.34% average growth rate for Canadian CMAs. Under the low growth rate Regina CMA would grow at 0.4% annually. Only under the high growth scenario (1.72%) Regina would exceed the average growth of Canadian CMAs (1.34%). The projected population for the Regina CMA under high, medium and slow growth scenarios is presented in Table 4.8.

Population, Employment and Economic Analysis of Regina
Derek Murray Consulting and Associates 63
Table 4.8 – Projected Population Growth for Regina CMA – 2010 to 2035
2005 2006 2007 2008 2009 2010f 2011f
High Growth 199,593 200,065 202,611 205,943 210,006 213,956 218,331
Medium Growth 199,593 200,065 202,611 205,943 210,006 213,114 216,534
Low Growth 199,593 200,065 202,611 205,943 210,006 212,548 215,215
2012f 2013f 2014f 2015f 2016f 2017f 2018f
High Growth 223,011 227,754 232,519 237,284 242,048 246,813 251,577
Medium Growth 220,217 223,986 227,755 231,196 234,169 237,142 240,094
Low Growth 217,859 219,881 221,303 222,678 223,518 224,335 225,130
2019f 2020f 2021f 2022f 2023f 2024f 2025f
High Growth 256,299 261,000 265,658 270,295 274,889 279,442 283,975
Medium Growth 242,850 245,584 248,276 250,928 253,558 256,168 258,716
Low Growth 225,920 226,645 227,348 228,028 228,662 229,254 229,801
2026f 2027f 2028f 2029f 2030f 2031f 2032f
High Growth 288,465 292,914 297,345 301,734 306,103 310,434 314,746
Medium Growth 261,224 263,711 266,158 268,587 270,956 273,307 275,618
Low Growth 230,324 230,783 231,202 231,579 231,915 232,210 232,464
2033f 2034f 2035f
High Growth 319,038 323,311 327,564
Medium Growth 277,889 280,120 282,311
Low Growth 232,677 232,850 232,981

Population, Employment and Economic Analysis of Regina
Derek Murray Consulting and Associates 64
The following graph shows the population growth for the Regina CMA population outside the administrative boundaries for the city.
Graph 4.12 – Regina CMA Urban Fringe11 Growth Projections
The following table shows the relative percentage the urban fringe (non-city CMA population) comprises of the total CMA population.
Table 4.9 – Regina’s Urban Fringe as a Percentage of the CMA Population – Population Growth – 1996 to 2006
2006 2011f 2016f 2021f 2026f 2031f 2035f
High Growth 7.97% 7.95% 7.87% 7.85% 7.79% 7.72% 7.61%
Medium Growth 7.97% 7.98% 8.03% 8.21% 8.40% 8.57% 8.63%
Low Growth 7.97% 8.00% 8.29% 8.63% 8.95% 9.33% 9.68%
11 The area surrounding Regina that is included in the Regina CMA area, but not within the Regina City
Jurisdictional Boundaries.

Population, Employment and Economic Analysis of Regina
Derek Murray Consulting and Associates 65
4.9 – Regina’s Commuting Region Population Projections
Regina’s commuting areas is comprised of Regina CMA as well as the surrounding region with a high proportion of residents commuting to Regina for employment on a regular basis. The following is a reference map for this commuting region.
Map 4.3 – Regina Commuting Area
The following table shows the breakdown of the components12 of the Regina commuting area based on Statistics Canada Census data.
Table 4.10 – Components of Regina’s Commuting Region Population Growth – 1996 to 2006
Location 1996 2001 2006 Change % Change
Non CMA Commuting Communities 14,469 14,168 13,915 -554 -3.8%
Urban Fringe (Non-City CMA) 13,248 14,575 15,725 2,477 18.7%
City, Regina 180,400 178,225 179,246 -1,154 -0.6%
208,117 206,968 208,886 769 0.4%
12 See the Appendix for a complete breakdown of each component.

Population, Employment and Economic Analysis of Regina
Derek Murray Consulting and Associates 66
Because the non-CMA component of the region is actually declining in population, the growth projections are slightly less aggressive than the Regina City or Regina CMA projections. The population of the Regina Commuting area in 2009 was 223,921. The following graph shows the projected growth for the Regina Commuting area.
Graph 4.13 – Regina Commuting Areas Population Projections13
Under a medium growth scenario Regina CMA and the surrounding commuting area will grow to 296,000 by 2035. Under the high growth scenario the population would grow to 341,000, not including Moose Jaw. If Moose Jaw were included, the commuting region population would reach nearly 400,000 by 2035 under the high growth scenario. Under the low growth scenario, Regina’s commuting area would grow from 224,000 in 2009 to 247,000 in 2035.
The Regina commuting area is projected to grow at 1.08% annually, less than the 1.12% growth rate for the city proper and less than the average for CMA growth in Canada (1.34%). The growth rate for the commuting area under the low growth scenario is 0.38%. Only under the high growth scenario (1.64%) Regina would exceed the average growth of Canadian CMAs.
13 Does not include Moose Jaw.

Population, Employment and Economic Analysis of Regina
Derek Murray Consulting and Associates 67
Table 4.11 – Growth Projections for Regina’s Commuting Region – 2010 to 203514
Regina Commuting Area 2005 2006 2007 2008 2009 2010f 2011f
High Growth 213,508 213,980 216,526 219,858 223,921 227,816 232,191
Medium Growth 213,508 213,980 216,526 219,858 223,921 226,974 230,394
Low Growth 213,508 213,980 216,526 219,858 223,921 226,408 229,075
2012f 2013f 2014f 2015f 2016f 2017f 2018f
High Growth 236,871 241,614 246,379 251,144 255,908 260,673 265,437
Medium Growth 234,077 237,846 241,615 245,056 248,030 251,002 253,955
Low Growth 231,719 233,741 235,162 236,537 237,378 238,195 238,989
2019f 2020f 2021f 2022f 2023f 2024f 2025f
High Growth 270,159 274,860 279,518 284,155 288,749 293,302 297,835
Medium Growth 256,710 259,444 262,136 264,787 267,418 270,027 272,576
Low Growth 239,779 240,505 241,208 241,888 242,521 243,114 243,660
2026f 2027f 2028f 2029f 2030f 2031f 2032f
High Growth 302,325 306,774 311,205 315,594 319,963 324,294 328,606
Medium Growth 275,084 277,572 280,018 282,446 284,816 287,167 289,478
Low Growth 244,184 244,643 245,061 245,438 245,774 246,069 246,324
2033f 2034f 2035f
High Growth 332,898 337,171 341,424
Medium Growth 291,749 293,980 296,171
Low Growth 246,537 246,709 246,841
4.10 – Aboriginal Population Growth Projections
Based on the previous analysis the following are the growth projections for Regina’s Aboriginal population. While the 2001 to 2006 growth rate was 8.1%, this rate was abnormally low, likely due to out-migration issues. The low end of the projections is 10.0%. Under high growth, the population would grow at a rate of 3.0% annually.
Table 4.12 – Aboriginal Population Growth Rates Year 5-Year Growth Rate Annual Growth Rate
High Growth 15.0% 3.0%
Medium Growth 12.0% 2.4%
Low Growth 10.0% 2.0%
14 Based on Statistics Canada Population Estimates

Population, Employment and Economic Analysis of Regina
Derek Murray Consulting and Associates 68
Under the above assumptions Regina’s Aboriginal population would grow to between 11.2% and 12.7% of Regina’s population by 2031. The following table details the growth.
Table 4.13 – Forecast Aboriginal Population Growth Total
Population Aboriginal Population %
Total Population
Aboriginal Population %
Total Population
Aboriginal Population %
2006 2011f 2016f High Growth 184,114 16,535 8.98% 200,983 19,015 9.46% 222,988 21,868 9.81%Medium Growth 184,114 16,535 8.98% 199,254 18,519 9.29% 215,370 20,742 9.63%Low Growth 184,114 16,535 8.98% 198,003 18,189 9.19% 204,994 20,007 9.76% 2021f 2026f 2031f High Growth 244,799 25,148 10.27% 265,994 28,920 10.87% 286,465 33,258 11.61%Medium Growth 227,904 23,230 10.19% 239,277 26,018 10.87% 249,897 29,140 11.66%Low Growth 207,725 22,008 10.59% 209,700 24,209 11.54% 210,533 26,630 12.65%
It should be noted that, while the percentage of the overall population that is Aboriginal will be between 9% and 13% over the projected timeframe, certain segments of the Aboriginal population will be much higher. The average age of the Aboriginal population is much younger than the general population and birth rates are higher. The impact of this is a concentration of the Aboriginal population in the city’s younger age groups. Because of the relative youth of the Aboriginal population the percentage of the Aboriginal population entering the education and workforce will be much higher than the overall percentage of the population would indicate. As an example, while Aboriginal population may be 10% of the overall population, the percentage within segments of the youth population could be twice that. This has significant impacts for school enrollment as well as labour force planning.

Population, Employment and Economic Analysis of Regina
Derek Murray Consulting and Associates 69
Appendix
Regina CMA Urban Fringe Population Growth – 1996 to 2006
1996
2001
2006 Percentage
Change Population
Change
Edenwold No. 158 2,724 2,917 3,611 32.6% 887
Pilot Butte 1,481 1,850 1,867 26.1% 386
Lumsden No. 189 1,376 1,631 1,627 18.2% 251
Lumsden 1,530 1,596 1,523 -0.5% -7
Balgonie 1,132 1,239 1,384 22.3% 252
Regina Beach 984 1,039 1,195 21.4% 211
White City 907 1,101 1,113 22.7% 206
Sherwood No. 159 1,052 1,054 1,075 2.2% 23
Pense 534 533 507 -5.1% -27
Buena Vista 343 397 490 42.9% 147
Pense No. 160 536 494 490 -8.6% -46
Grand Coulee 336 366 435 29.5% 99
Edenwold 198 226 242 22.2% 44
Belle Plaine 64 70 64 0.0% 0
Disley 51 62 62 21.6% 11
Lumsden Beach 0 0 40 - 40
Surrounding Communities 13,248 14,575 15,725 18.7% 2,477
Regina Proper % of CMA 6.80% 7.60% 8.10%

Population, Employment and Economic Analysis of Regina
Derek Murray Consulting and Associates 70
Growth Projections – Growth Projections of CMA Urban Fringe – 2010 to 2035
Urban Fringe 2,005 2,006 2,007 2,008 2,009 2010F 2011F
High Growth 15,944 15,951 16,179 16,403 16,707 17,024 17,348
Medium Growth 15,944 15,951 16,179 16,403 16,707 16,991 17,280
Low Growth 15,944 15,951 16,179 16,403 16,707 16,958 17,212
2012F 2013F 2014F 2015F 2016F 2017F 2018F
High Growth 17,678 18,013 18,356 18,704 19,060 19,422 19,791
Medium Growth 17,574 17,872 18,176 18,485 18,799 19,119 19,444
Low Growth 17,470 17,732 17,998 18,268 18,542 18,820 19,103
2019F 2020F 2021F 2022F 2023F 2024F 2025F
High Growth 20,167 20,550 20,858 21,171 21,489 21,811 22,138
Medium Growth 19,775 20,071 20,372 20,678 20,988 21,303 21,622
Low Growth 19,389 19,583 19,779 19,977 20,176 20,378 20,582
2026F 2027F 2028F 2029F 2030F 2031F 2032F
High Growth 22,470 22,807 23,150 23,497 23,732 23,969 24,209
Medium Growth 21,947 22,276 22,610 22,949 23,179 23,411 23,645
Low Growth 20,788 20,996 21,206 21,418 21,632 21,848 22,067
2033F 2034F 2035F
High Growth 24,451 24,695 24,942
Medium Growth 23,881 24,120 24,361
Low Growth 22,287 22,510 22,735

Population, Employment and Economic Analysis of Regina
Derek Murray Consulting and Associates 71
Regina Non-CMA Commuting Region – 1996 to 2006
Location 1996 2,001 2006
Rural Municipality, Bratt’s Lake No. 129 371 374 362 -9
Rural Municipality, McKillop No. 220 545 517 566 21
Rural Municipality, Lajord No. 128 1,034 1,036 977 -57
Rural Municipality, North Qu’Appelle No. 187 828 838 852 24
Rural Municipality, Sarnia No. 221 327 284 254 -73
Village, Bethune 375 380 369 -6
Village, Disley 51 62 62 11
First Nations Reserve, Muscowpetung First Nation 80 243 215 290 47
Rural Municipality, Dufferin No. 190 582 563 540 -42
Village, Silton 86 94 91 5
Rural Municipality, South Qu`Appelle No. 157 1,135 1,098 1,066 -69
Town, Southey 679 693 711 32
Village, Craven 278 264 274 -4
Village, Drinkwater 87 80 65 -22
Village, Penzance 46 41 30 -16
Rural Municipality, Longlaketon No. 219 973 940 899 -74
Village, Earl Grey 268 292 264 -4
Village, Findlater 57 62 49 -8
Village, Markinch 72 67 59 -13
Town, Rouleau 449 434 400 -49
Village, Dilke 85 70 80 -5
Village, Holdfast 216 190 173 -43
Rural Municipality, Redburn No. 130 313 279 245 -68
Town, Cupar 592 602 738 146
Rural Municipality, Cupar No. 218 576 550 502 -74
Chamberlain 114 89 108 -6
Wilcox 311 322 222 -89
Briercrest 125 113 117 -8
Fort Qu’Appelle 1,997 1,940 1,919 -78
Qu'Appelle 632 648 624 -8
Mclean 262 271 275 13
Strasbourg 760 760 732 -28
Commuting Communities 14,469 14,168 13,915 -554

Population, Employment and Economic Analysis of Regina
Derek Murray Consulting and Associates 72
High Growth Scenario – Working Age Population and Dependency Ratio
2006 2011 2016 2021 2026 2031 2036 Dependency Ratio 44.6% 44.4% 47.2% 50.5% 51.7% 52.1% 51.7%
High Growth Scenario – Population Projections by Age Group

Population, Employment and Economic Analysis of Regina
Derek Murray Consulting and Associates 73
Medium Growth Scenario – Working Age Population and Dependency Ratio
2006 2011 2016 2021 2026 2031 2036Dependency Ratio 44.6% 44.6% 47.9% 52.3% 54.8% 56.1% 55.8%
Medium Growth Scenario –
Population Projections by Age Group

Population, Employment and Economic Analysis of Regina
Derek Murray Consulting and Associates 74
Low Growth Scenario – Working Age Population and Dependency Ratio
2006 2011 2016 2021 2026 2031 2036Dependency Ratio 44.6% 44.9% 48.8% 54.1% 57.7% 60.4% 58.6%
Low Growth Scenario –
Population Projections by Age Group