Embed Size (px)
Citation preview

Population &Employment
Forecasts:2003-2030
City of Edmonton
Summary Report
Prepared by:
May 2005

Table of Contents
Executive Summary 1Scenarios 1
Economic Context 1
Population Growth 1
Geographic Allocation of Growth 2
Occupation 3
Employment 3
Employment by Industry 5
Work at Home Employment 5
Purpose and Scope of the Study 6Purpose of the Study 6
Scenarios 7
Summary & Technical Reports 7
Region Reports 7
Study Area 8The City of Edmonton 8
Economic Overview 10Provincial Outlook 10
Economic Growth and Migration 12
Employment Participation Rate 12
Population Forecasts & Allocation 13
Population & Employment Forecasts: 2003 to 2030 - City of Edmonton - Summary Report
Applications Management Consulting Ltd. - May 2005
Population Forecasts 13
Aging of the Population 14
Inner City and Suburban Areas 16
Inner City vs Suburban Population Growth 16
Inner City Population Growth 17
Suburban Population Growth 19
Neighbourhood Growth Cycles 26
Occupation 27
Employment Forecasts & Allocation 31Employment Forecasts 31
Employment Growth Areas 32
Change in Industry Employment 33
Work At Home Employment 34
AppendicesAppendix A: Base Case Population by Age Cohort 36
Appendix B: Base Case Population by Traffic District 37
Appendix C: Base Case Population by Aggregate Age Category and Traffic District 38
Appendix D: Base Case Occupation by Traffic District 39
Appendix E: Base Case Employment Allocation by Traffic District 42
Appendix F: Base Case Employment Allocation by Traffic District and Industry Sector 43
Appendix G: Base Case Employment by Traffic District and Industry 46
Appendix H: High Scenario Population by Age Cohort 49
Appendix I: High Scenario Population by Traffic District 50
Appendix J: High Scenario Population by Aggregate Age Category and Traffic District 51
Appendix K: High Scenario Occupation by Traffic District 52
Appendix L: High Scenario Employment Allocation by Traffic District 55
Appendix M: High Scenario Employment Allocation by Traffic District and Industry Sector 56
Appendix N: High Scenario Employment by Traffic District and Industry 59
Acknowledgments 62
Population & Employment Forecasts: 2003 to 2030 - City of Edmonton - Summary Report
Applications Management Consulting Ltd. - May 2005
Executive Summary
Executive Summary
Population and employment forecasts are an im-portant tool for social and economic planning. This study provides detailed projections for the City of Edmonton to the year 2030 for various population and employment categories and geo-graphic allocations.
ScenariosThe forecasts have been prepared for each of two scenarios:• Base Case: Economic and population growth
consistent with a conservative extrapolation of recent growth of the Edmonton CMA.
• High Scenario: More optimistic assumptions projecting stronger economic and population growth than the Base Case.
Economic ContextThe aggregate population and employment pro-jections have been developed in consideration of the provincial and regional factors that will be important in affecting the rate of economic growth in the Edmonton Region.
There is a strong relationship between the eco-nomic growth of a region and population growth. In a fast growing economy, net migration is re-quired to fuel economic growth.
To 2008, the City of Edmonton’s SocioEconomic Outlook has been used as the basis of the fore-casts for the Base Case and High Scenario. After 2008, the Base Case assumes an average annual net migration of 7,900 to the Edmonton CMA. In
the High Scenario, net migration is assumed to average 14,280 per year. These rates of net mi-gration are consistent with projected average an-nual GDP growth rates of 2.1 percent and 2.5 per-cent for the Base Case and High Scenario respec-tively.
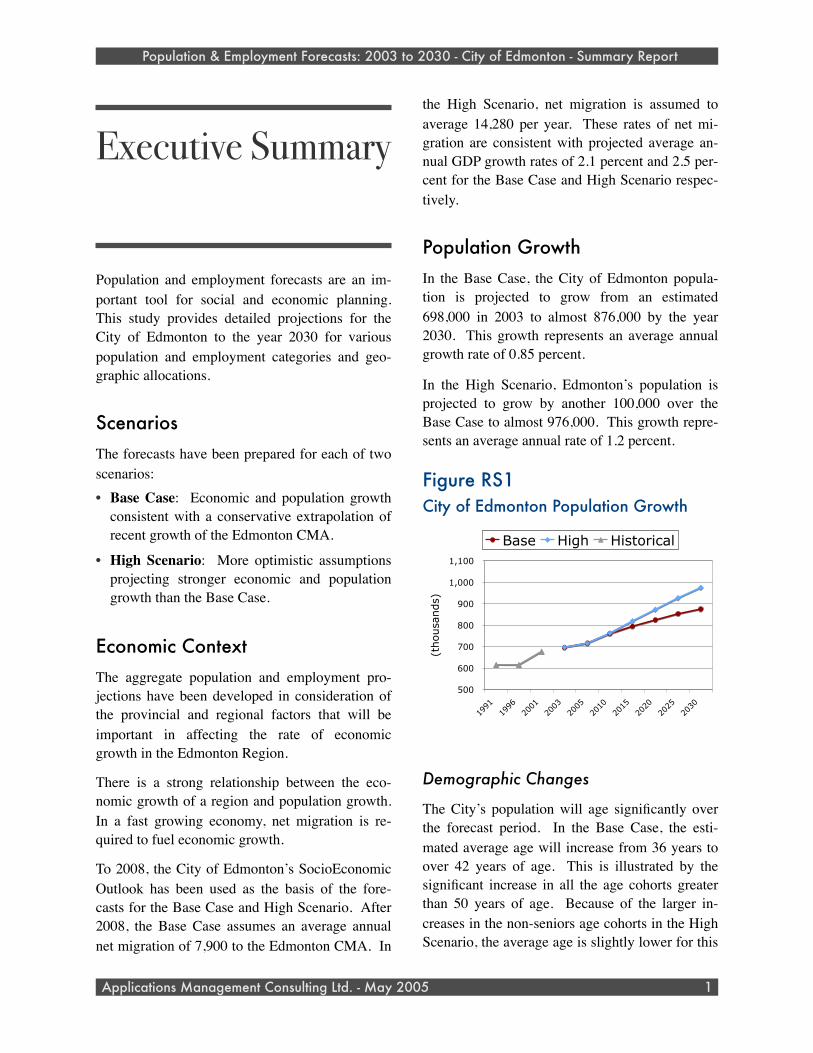
Population GrowthIn the Base Case, the City of Edmonton popula-tion is projected to grow from an estimated 698,000 in 2003 to almost 876,000 by the year 2030. This growth represents an average annual growth rate of 0.85 percent.
In the High Scenario, Edmonton’s population is projected to grow by another 100,000 over the Base Case to almost 976,000. This growth repre-sents an average annual rate of 1.2 percent.
Figure RS1City of Edmonton Population Growth
500
600
700
800
900
1,000
1,100
1991
1996
2001
2003
2005
2010
2015
2020
2025
2030
(thousands)
Base High Historical
Demographic Changes
The City’s population will age significantly over the forecast period. In the Base Case, the esti-mated average age will increase from 36 years to over 42 years of age. This is illustrated by the significant increase in all the age cohorts greater than 50 years of age. Because of the larger in-creases in the non-seniors age cohorts in the High Scenario, the average age is slightly lower for this
Population & Employment Forecasts: 2003 to 2030 - City of Edmonton - Summary Report
Applications Management Consulting Ltd. - May 2005 1
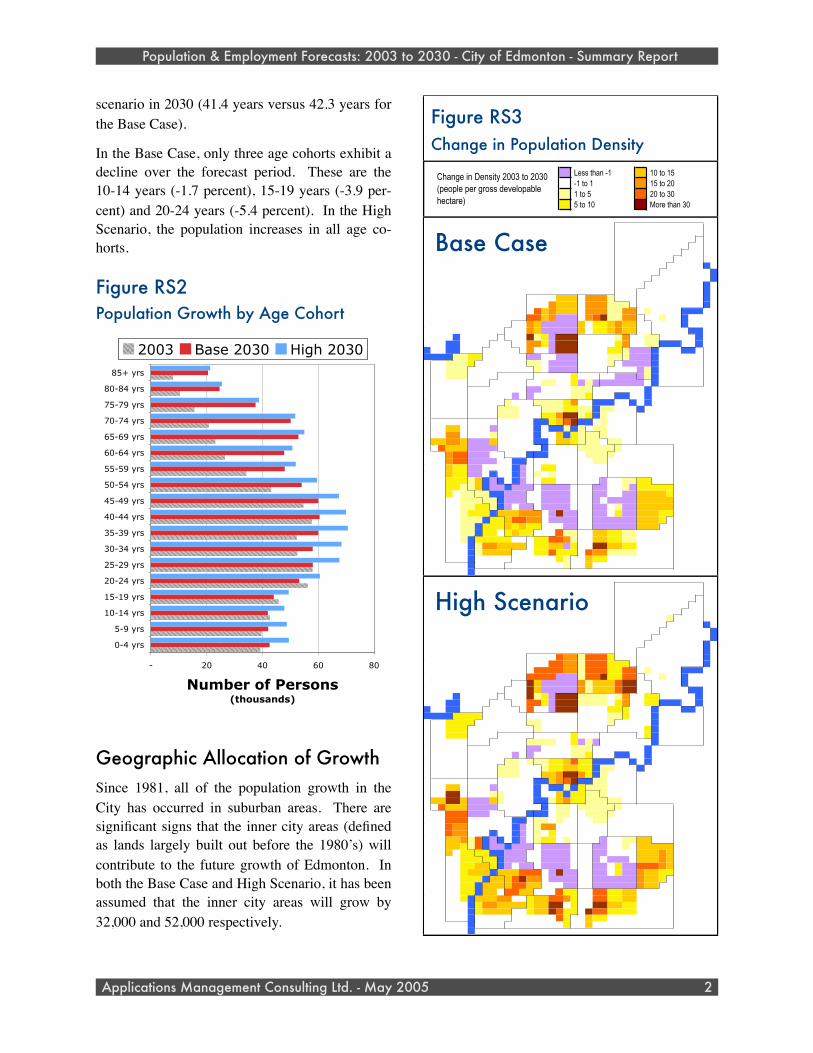
scenario in 2030 (41.4 years versus 42.3 years for the Base Case).
In the Base Case, only three age cohorts exhibit a decline over the forecast period. These are the 10-14 years (-1.7 percent), 15-19 years (-3.9 per-cent) and 20-24 years (-5.4 percent). In the High Scenario, the population increases in all age co-horts.
Figure RS2Population Growth by Age Cohort
- 20 40 60 80
0-4 yrs
5-9 yrs
10-14 yrs
15-19 yrs
20-24 yrs
25-29 yrs
30-34 yrs
35-39 yrs
40-44 yrs
45-49 yrs
50-54 yrs
55-59 yrs
60-64 yrs
65-69 yrs
70-74 yrs
75-79 yrs
80-84 yrs
85+ yrs
Number of Persons(thousands)
2003 Base 2030 High 2030
Geographic Allocation of GrowthSince 1981, all of the population growth in the City has occurred in suburban areas. There are significant signs that the inner city areas (defined as lands largely built out before the 1980’s) will contribute to the future growth of Edmonton. In both the Base Case and High Scenario, it has been assumed that the inner city areas will grow by 32,000 and 52,000 respectively.
Population & Employment Forecasts: 2003 to 2030 - City of Edmonton - Summary Report
Applications Management Consulting Ltd. - May 2005 2
Figure RS3Change in Population Density
Less than -1 10 to 15 -1 to 1 15 to 20 1 to 5 20 to 30 5 to 10 More than 30
Change in Density 2003 to 2030 (people per gross developable hectare)
0 0 0 0 0 0 0 0 0 0 0 0 0 0 0 0 0 0 0 0 0 0 0 0 0 0 0 0 0 0 0 0 0 0 0 0 0 0 0 0
0 0 0 0 0 0 0 0 0 0 0 0 0 0 0 0 0 0 0 0 0 0 0 0 0 0 -0.01 -0.01 -0.01 -0 -0 -0.02 -0.02 0 0 -0.02 -0.02 -0.02 0 0
0 0 0 0 0 0 0 0 0 0 0 0 0 0 0 0 0 0 0 0 0 0 0 0 0 0 -0.01 -0.02 -0.02 -0.02 -0.02 -0.02 -0.02 -0 -0 -0.04 -0.04 -0.04 0 0
0 0 0 0 0 0 0 0 0 0 0 0 0 0 0 0 0 0 0 0 0 0 0 0 0 0 0 -0.01 -0.01 -0.04 -0.04 -0.02 -0.02 -0.01 -0.01 -0.01 -0.01 -0.01 0 0
0 0 0 0 0 0 0 0 0 0 0 0 0 0 0 0 0 0 0 0 0 0 0 0 0 0 0 -0.02 -0.02 -0.01 -0.01 -0.01 -0.01 -0.02 -0.02 -0.01 -0.01 -0.01 0 0
0 0 0 0 0 0 0 0 0 0 0 0 0 0 0 0 0 0 0 0 0 0 0 0 0 0 0 0.003 0.003 -0 -0 0.001 0.001 -0 -0 -0.01 -0.01 -0.01 0 0
0 0 0 0 0 0 0 0 0 0 0 0 0 0 0 0 0 0 0 0 0 0 0 0 0 0 0 0.002 0.002 -0 -0 -0.01 -0.01 0.75 -0.02 -0 -0 -0 0 0
0 0 0 0 0 0 0 0 0 0 0 0 0 0 0 0 0 0 0 0 0 0 0 0 0 0 -0 -0.02 -0.02 -0.03 -0.03 6E-04 6E-04 -0.02 -0.01 -0 -0 -0 0
0 0 0 0 0 0 0 0 0 0 0 0 0 0 0 0 0 0 0 0 0 0 0 0 0 0 -0 -0 -0 -0.06 -0.06 6E-04 -0.04 -0.02 -0.01 -0.06 -0.06 -0.02 -0.02
0 0 0 0 0 0 0 0 0 0 0 0 0 0 0 0 0 0 0 0 0 0 0 0 0 0 -0 -0 -0 -0.06 -0.06 -0.04 -0.04 -0.01 -0.01 -0.06 -0.06 -0.02 -0.02
0 0 0 0 0 0 0 0 0 0 0 0 0 0 0 0 0 0 0 0 0 0 0 0 0 0 -0.02 -0.02 -0.01 -0.01 0 -0.01 -0.01 -0.05 -0.01 -0.01 -0.02 -0.02 0
0 0 0 0 0 0 0 0 0 0 0 0 0 0 0 0 0 0 0 0 0 0 0 0 0 0 -0.02 -0.02 -0.01 0 0 -0.01 -0.01 -0.05 -0.01 -0.02 -0.02 -0.02 0
0 0 0 0 0 0 0 0 0 0 0 0 0 0 7E-04 7E-04 0.098 0.098 10.96 11.64 11.64 0.864 18.35 16.62 18.9 4.473 -0.02 -0.01 -0.01 0 0 -0.01 0.002 -0.05 -0.02 -0.02 -0.02 -0.02 0
0 0 0 0 0 0 0 0 0 0 0 0 0 0 7E-04 7E-04 0.098 18.04 10.96 11.64 11.64 0.864 18.35 16.62 18.9 4.473 4.473 4.473 -0.01 0 0 0.002 0.002 -0.05 -0.02 -0.02 -0.02 -0.02 0
0 0 0 0 0 0 0 0 0 0 0 0 0 0 7E-04 24.76 11.37 18.04 10.96 11.64 11.64 0.864 18.35 16.62 18.9 4.473 4.473 17.23 17.23 0 2.424 -0.02 -0.05 -0.05 -0.02 0 0
0 0 0 0 0 0 0 0 0 0 0 0 0 0 24.76 24.76 11.37 18.04 -4.98 -4.98 -4.98 0.864 18.35 27.54 31.25 4.473 4.473 17.23 17.23 -0.05 0 -0.02 1.05 -0.01 -0.02 0 0 0 0
0 0 0 0 0 0 0 0 0 0 0 0 -0 -0 15.33 12.44 -3.72 -3.72 -5.39 -5.39 -5.39 14.76 0.479 5.795 9.949 11.17 17.74 11.15 11.15 -0.05 -0.05 -0 -0 -0.01 -0.01 0 0 0 0
0 0 0 0 0 0 0 0 0 0 0 -0 -0 -0 15.33 12.44 -3.72 -3.72 -1.73 -1.73 -1.73 14.76 0.479 5.795 9.949 11.17 17.74 11.15 11.15 -0.05 0 -0 -0 -0.01 -0.01 -0.01 0 0
0 0 0 0 0 0 0 0 0 -0 -0 -0.01 -0.01 53.64 1.895 8.037 -5.35 46.83 46.83 46.83 0.467 0.467 0.636 0.636 -0.11 3.984 15.28 0 -0.86 2.194 2.194 -0 -0.01 -0.01 -0.01 -0.01 0 0
0 0 0 0 0 0 0 -0 -0 -0.02 -0.01 -0.01 15.92 15.92 8.037 -5.32 35.05 35.05 35.05 0.467 0.467 0.636 0.636 -0.11 5.249 15.28 0 -0.86 2.194 2.194 -0.01 -0.01 0 0
0 0 0 0 0 -0 -0 -0 -0.02 -0.02 -0.01 15.92 0 0 -5.32 35.05 35.05 35.05 -0.39 -0.39 -0.42 0 5.249 5.249 4.26 -1.26 -1.12 -1.12 -0.01 -0.01 0 0 0 0
3.677 3.677 7.144 7.144 -0 -0 -0 -0.01 -0.01 0 -1.46 -1.46 -0.98 -0.98 -1.52 -1.52 -1.52 0 -0.55 -0.48 -0.48 3.723 3.723 4.26 -1.43 -1.43 -2.35 -0.01 -0.01 0 0 0 0 0 0
0 -0 0 3.677 3.677 3.677 7.144 -0 -0 -0 -0 -0.01 -0.01 0 2.804 2.804 0.141 -2.63 -2.63 -1.82 -1.82 -0.55 -0.55 -0.48 -0.48 3.723 0 -1.16 -1.43 -1.43 -2.35 -0.01 -0.01 0 0 0 0 0 0
0 -0 0 3.396 3.396 3.396 -0.08 -0.08 -0.08 0 0 -0.01 -0.01 0 0 2.804 0.141 -2.63 -2.63 -1.82 -1.82 -0.12 -0.12 -0.09 -0.09 -0.08 -0.08 -0.92 -0.92 -1.65 3.761 -0.01 -0.01 0 0 0 0 0 0
0 0.012 0.012 3.396 3.396 3.396 -0.08 -0.08 -0.08 0 0 0 0 -0.07 -0.07 -0.17 -0.17 -0.17 -0.07 -0.07 5.015 -0.11 -0.07 -0.07 -0.14 -0.14 -3.21 -2.2 -2.2 -1.65 3.761 -0.01 -0.01 0 0 0 0 0 0
0 0 -0.01 -0.02 -0.02 -0.02 -0.08 -0.08 -0.08 0.111 0 0 0 0 0.689 0.689 1.123 1.226 0 0 5.015 -3.35 2.291 -2.04 -3.08 -3.08 -3.21 -3.02 -3.02 -2.55 0.17 -0.01 -0.01 0 0 0 0 0 0
0 0 -0.01 -0.02 -0.02 -0.02 0 -0 0 0.111 0 0 0 0 -4.46 -4.46 -0.04 -0.04 0 0 2.118 1.215 2.291 0.006 0.055 0.347 -0.1 -0.2 -0.2 0.17 0 0 0 0 0 0 0 0 0
0 0 -0.01 -0.02 -0 -0 -0 -0 0 0.111 0 0 -1.72 0 -4.46 0 -0.04 -0.04 -0.14 0 2.118 1.215 5.301 0.891 0.055 0.347 -0.2 0.17 0 0 0 0 0 0 0 0 0
0 -0.12 -0.11 -0 -0 -0 -0 -0 -0.02 0 0 1.323 -0.37 0.037 0.417 3.529 3.529 3.913 3.913 6.316 19.46 0.608 0.608 -0.1 -0.1 0.17 0 0 0 0 0 0 0 0 0
0 -0.12 -0.11 -0.04 -0.04 -0.04 -0.03 -0.03 -0.02 0 1.673 1.673 2.038 0.751 0.03 0.03 3.529 3.913 3.913 6.316 6.316 2.295 2.295 1.287 1.287 -0.1 -0.1 -0.1 0 0 0 0 0 0 0 0 0 0
0 -0.11 -0.11 -0.04 -0.04 -0.04 0 0 0 0 1.673 1.673 2.038 0.751 0.03 0.03 5.226 5.226 18.11 94.54 162 4.881 6.032 1.287 0.041 -0.1 -0.06 -0.06 0 0 0 0 0 0 0 0 0 0 0
0 -0.04 -0.04 -0.05 -0.05 -0.05 0 0 0 0 0.124 0.124 0.51 -0.13 -0.13 5.226 11.92 26.5 75.39 0.957 1.11 -0.96 -0.96 0 0 0 0 0 0 0 0 0 0 0 0 0
0 0.044 0.044 11.74 11.74 -0.05 -0.68 -0.68 -0.68 -2.08 0.124 0.124 0.51 -0.13 -0.13 -0.09 1.962 4.625 0.957 1.537 1.11 -0.96 -0.96 0 0 0 0 0 0 0 0 0 0 0 0 0
0 0.044 0.044 17.93 17.93 -0.05 0.098 0.098 0.098 1.552 0.771 0.081 -0.22 -0.16 -0.16 -0.09 -0.05 12.94 7.798 4.625 1.085 1.085 1.11 -0.96 -0.96 0 0 0 0 0 0 0 0 0 0 0 0 0
0 14.02 14.02 17.93 17.93 14.57 -4.71 -4.71 -4.71 11.32 0.771 0.081 0.771 -0.16 -0.16 0.774 12.94 12.3 7.798 4.625 1.085 1.085 -0.24 1.065 1.065 0 0 0 0 0 0 0 0 0 0 0 0 0
0 0 23.43 10.79 14.57 14.57 -4.71 -4.71 -4.71 -1.38 0.797 0.797 -0.08 -0.08 -0.1 -0.1 0 0 0.802 -0.08 2.281 2.281 2.524 2.524 2.524 3.755 -0.15 -0.15 0 0 0 -0.01 -0.01 0 0 0 0 0 0
0 0 0 18.48 20.03 20.03 -1.28 -1.28 -1.28 -0.15 -0.04 0 0.07 0.876 0 0 0.802 -0.06 -0.01 2.281 1.232 1.232 3.755 0 -0.15 -0.15 0 0 0 -0.01 -0.01 0 0 0 0 0 0
0 0 0 18.48 20.03 20.03 -3.41 -3.41 -3.41 -1.78 -0.04 -0.04 -0.08 0.181 0.181 0 -0.12 0 -0.06 -0.01 0.073 2.813 1.232 0 0 -0 -0 0 0 0 -0.05 -0.01 0 0 0 0 0 0
0 0 0 13.42 6.386 6.386 -2.68 -2.68 0.462 -0.21 0.466 0.466 -2.15 -0.08 0.181 9.994 9.994 0.734 0.734 0.003 -0.02 -0.02 0 0 0 0 0 0 0 0 0 -0.01 -0.01 0 0 0 0 0 0
0 0 0 13.42 6.386 6.386 -2.68 -2.68 0.462 0.466 0.466 -2.15 -0.08 3.108 0 4.822 0.734 0.734 0.003 0 0 0 0 0 0 0 0 0 0 0 -0.01 -0.01 0 0 0 0 0 0
0 0 0 7.298 7.298 6.386 2.06 10.65 -2.23 0.466 -4.03 -0.08 0.005 5.324 5.324 0 0.293 0.006 0 0 0 -1.49 0 0 1.687 1.687 9.409 9.409 0 0 -0.01 0 0 0 0 0 0
0 0 0 7.298 7.298 4.141 2.06 10.65 -2.23 -2.23 -4.03 -1.45 -1.45 0.044 -2.96 -2.96 -2.36 -2.36 0 -0.01 -0.01 -1.41 -1.49 0 0 1.687 -1.44 9.409 9.409 9.409 7.435 7.435 0 0 0 0 0 0
0 0 0 7.298 -0 4.141 4.141 4.701 4.701 -2.23 -2.23 -1.45 0.044 0.044 -2.96 -4.84 -4.64 -4.64 0 0 0 -1.41 -1.41 0 0 -1.44 -1.44 11.83 11.83 11.83 11.61 7.435 0 0 0 0 0 0
0 0 0 -0 -0 4.141 4.141 4.141 4.701 4.701 -1.51 -1.45 -1.45 -0.13 -0.13 -4.84 -4.84 -4.64 -2.88 0.85 -0.02 -0.02 -2.64 0 -2.69 -2.69 -2.16 -1.44 11.83 11.83 11.83 11.61 12.95 0 0 0 0 0 0
0 0 0 -0 0 4.141 4.141 7.291 7.291 4.701 -1.51 -0.76 -1.54 -2.58 -0.13 -2.7 -2.7 -2.88 -2.88 0.85 -0 -0 -2.56 -2.56 0 3.551 -3.52 -2.51 12.31 12.31 12.31 11.61 12.95 0 0 0 0 0 0
0 0 0 0 0 4.141 7.291 7.291 7.291 12.64 12.64 12.64 19.74 19.74 18.62 0.214 -6.61 88.2 -4.58 -2.95 0 0 -2.58 -2.58 0 7.682 -3.25 -2.72 12.51 12.24 12.24 7.264 7.264 0 0 0 0 0 0
0 0 0 -0 -0 1.889 1.889 1.889 7.814 7.814 12.64 29.33 29.58 15.96 15.96 -0.8 -2.46 -2.95 -2.54 -2.54 0 0 -1.17 -2.48 -2.48 -2.31 -3.25 -2.72 12.51 12.24 12.24 7.264 -0 0 0 0 0 0 0
0 0 0 0 0 1.889 1.889 7.814 7.814 7.814 12.64 7.484 12.78 6.296 6.296 -0.8 -0.8 -0.8 -2.54 -2.54 0 0 -1.17 -1.65 -1.9 -1.9 -1.64 -1.64 12.51 12.24 12.24 -0 -0 0 0 0 0 0 0
0 0 0 0.01 0.01 1.889 1.889 6.418 6.418 0 7.484 12.78 6.296 6.296 -0.8 -0.8 -0.8 21.28 4.908 4.908 0 0 10.15 10.15 6.103 6.103 4.347 4.347 0 0 0 -0 -0 0 0 0 0 0 0
0 0 0 0.01 0.01 1.889 6.418 6.418 6.418 7.278 7.278 0 0 0 8.995 8.995 21.28 21.28 15.84 4.908 0 0 10.15 10.15 6.103 6.103 4.347 4.347 0 0 0 -0 -0 0 0 0 0 0 0
0 0 0 0.007 0.007 0.007 2.22 17.34 17.34 10.4 10.4 10.4 10.4 0 8.995 8.995 13.23 13.23 -1.44 7.422 0 0 34 34 12.72 12.72 5.925 5.925 4E-04 4E-04 4E-04 -0 -0 0 0 0 0 0 0
0 0 0 0.007 0.007 0.007 2.22 12.69 12.69 10.94 10.94 1E-04 0 0 8.995 8.995 26.21 8.83 7.422 7.422 0 29.25 17.85 17.85 1.257 1.257 1.278 1.278 4E-04 4E-04 4E-04 0 0 0 0 0 0 0 0
0 0 0 0.007 0.007 0.007 0 7E-05 7E-05 0.025 0.025 1E-04 0 4E-04 0 0 -0.02 8.83 2.662 0 0 12.54 5.753 5.753 5E-04 5E-04 -0 -0 0.001 0.001 0.001 6E-04 6E-04 0 0 0 0 0 0
0 0 0 0 0 0 0 6E-05 6E-05 0.025 1E-04 1E-04 0 4E-04 7E-04 7E-04 0.002 -0 2.662 0 0 12.54 5E-04 5E-04 0 0 0 0 0 0 0 4E-04 4E-04 0 0 0 0 0 0
0 0 0 0 0 0 0 0 0 0 0 0 0 0 0 0 0 0 0 0 0 0 0 0 0 0 0 0 0 0 0 0 0 0 0 0 0 0 0 0 0 0 0 0 0 0 0 0 0 0 0 0 0 0 0 0 0 0 0 0 0 0 0 0 0 0 0 0 0 0 0 0 0 0 0 0 0 0 0
0 0 0 0 0 0 0 0 0 0 0 0 0 0 0 0 0 0 0 0 0 0 0 0 0 0 -0 -0.01 -0.01 -0 -0 -0.02 -0.02 0 0 -0.02 -0.02 -0.02 0 0
0 0 0 0 0 0 0 0 0 0 0 0 0 0 0 0 0 0 0 0 0 0 0 0 0 0 -0 -0.02 -0.02 -0.01 -0.01 -0.02 -0.02 0.001 0.001 -0.03 -0.03 -0.03 0 0
0 0 0 0 0 0 0 0 0 0 0 0 0 0 0 0 0 0 0 0 0 0 0 0 0 0 0 -0 -0 -0.03 -0.03 -0.02 -0.02 -0 -0 -0 -0 -0.01 0 0
0 0 0 0 0 0 0 0 0 0 0 0 0 0 0 0 0 0 0 0 0 0 0 0 0 0 0 -0.02 -0.02 -0.01 -0.01 -0.01 -0.01 -0.02 -0.02 -0 -0.01 -0.01 0 0
0 0 0 0 0 0 0 0 0 0 0 0 0 0 0 0 0 0 0 0 0 0 0 0 0 0 0 0.007 0.007 -0 -0 0.003 0.003 0.002 0.002 -0.01 -0.01 -0.01 0 0
0 0 0 0 0 0 0 0 0 0 0 0 0 0 0 0 0 0 0 0 0 0 0 0 0 0 0 0.007 0.007 0.001 0.001 -0.01 -0.01 1.398 -0.01 -0 -0 -0 0 0
0 0 0 0 0 0 0 0 0 0 0 0 0 0 0 0 0 0 0 0 0 0 0 0 0 0 -0 -0.02 -0.02 -0.02 -0.02 0.003 0.003 -0.01 -0.01 -0 -0 -0 0
0 0 0 0 0 0 0 0 0 0 0 0 0 0 0 0 0 0 0 0 0 0 0 0 0 0 -0 -0 -0 -0.05 -0.05 0.003 -0.03 -0.01 -0.01 -0.06 -0.06 -0.01 -0.01
0 0 0 0 0 0 0 0 0 0 0 0 0 0 0 0 0 0 0 0 0 0 0 0 0 0 -0 -0 -0 -0.05 -0.05 -0.03 -0.03 -0.01 -0.01 -0.06 -0.06 -0.01 -0.01
0 0 0 0 0 0 0 0 0 0 0 0 0 0 0 0 0 0 0 0 0 0 0 0 0 0 -0.02 -0.02 -0.01 -0.01 0 -0.01 -0.01 -0.04 -0.01 -0.01 -0.01 -0.01 0
0 0 0 0 0 0 0 0 0 0 0 0 0 0 0 0 0 0 0 0 0 0 0 0 0 0 -0.02 -0.02 -0.01 0 0 -0.01 -0.01 -0.04 -0.01 -0.01 -0.01 -0.01 0
0 0 0 0 0 0 0 0 0 0 0 0 0 0 -0 -0 0.187 0.187 24.43 15.07 15.07 1.785 21.18 23.36 26.32 8.987 -0.02 -0.01 -0.01 0 0 -0.01 0.005 -0.04 -0.01 -0.01 -0.01 -0.01 0
0 0 0 0 0 0 0 0 0 0 0 0 0 0 -0 -0 0.187 20.49 24.43 15.07 15.07 1.785 21.18 23.36 26.32 8.987 8.987 8.987 -0.01 0 0 0.005 0.005 -0.03 -0.01 -0.01 -0.01 -0.01 0
0 0 0 0 0 0 0 0 0 0 0 0 0 0 -0 25.01 26.92 20.49 24.43 15.07 15.07 1.785 21.18 23.36 26.32 8.987 8.987 23.95 23.95 0 3.376 -0.02 -0.03 -0.03 -0.01 0 0
0 0 0 0 0 0 0 0 0 0 0 0 0 0 25.01 25.01 26.92 20.49 -3.38 -3.38 -3.38 1.785 21.18 29.15 33.66 8.987 8.987 23.95 23.95 -0.03 0 -0.02 1.586 -0.01 -0.01 0 0 0 0
0 0 0 0 0 0 0 0 0 0 0 0 -0 -0 31.79 12.05 -2.31 -2.31 -3.71 -3.71 -3.71 18.87 3.159 11.64 11.91 13.99 20.52 32.21 32.21 -0.03 -0.03 -0 -0 -0.01 -0.01 0 0 0 0
0 0 0 0 0 0 0 0 0 0 0 -0 -0 -0 31.79 12.05 -2.31 -2.31 -1.15 -1.15 -1.15 18.87 3.159 11.64 11.91 13.99 20.52 32.21 32.21 -0.03 0 -0 -0 -0.01 -0.01 -0.01 0 0
0 0 0 0 0 0 0 0 0 -0 -0 -0 -0 53.06 4.911 9.141 -3.74 51.89 51.89 51.89 1.448 1.448 1.396 1.396 -0.11 3.941 17.53 0 -0.12 5.351 5.351 -0 -0.01 -0.01 -0.01 -0.01 0 0
0 0 0 0 0 0 0 -0 -0 -0.01 -0 -0 25.36 25.36 9.141 -3.53 40.76 40.76 40.76 1.448 1.448 1.396 1.396 -0.11 5.189 17.53 0 -0.12 5.351 5.351 -0.01 -0.01 0 0
0 0 0 0 0 -0 -0 -0 -0.01 -0.01 -0 25.36 0 0 -3.53 40.76 40.76 40.76 -0.39 -0.39 -0.42 0 5.189 5.189 6.344 -0.26 -0.21 -0.21 -0.01 -0.01 0 0 0 0
6.189 6.189 7.062 7.062 -0 -0 -0 -0 -0 0 -0.26 -0.26 -0.8 -0.8 -0.05 -0.05 -0.05 0 -0.08 -0.08 -0.08 3.88 3.88 6.344 -0.68 -0.68 -0.99 -0.01 -0.01 0 0 0 0 0 0
0 -0 0 6.189 6.189 6.189 7.062 -0 -0 -0 -0 -0 -0 0 4.204 4.204 0.771 -0.15 -0.15 -0.1 -0.1 -0.08 -0.08 -0.08 -0.08 3.88 0 -0.17 -0.68 -0.68 -0.99 -0.01 -0.01 0 0 0 0 0 0
0 -0 0 6.873 6.873 6.873 -0.06 -0.06 -0.06 0 0 -0 -0 0 0 4.204 0.771 -0.15 -0.15 -0.1 -0.1 0.906 0.906 0.461 0.461 -0.04 -0.04 -0.26 -0.26 -0.65 5.318 -0.01 -0.01 0 0 0 0 0 0
0 0.012 0.012 6.873 6.873 6.873 -0.06 -0.06 -0.06 0 0 0 0 -0.07 -0.07 -0.16 -0.16 -0.16 -0.05 -0.05 7.238 -0.08 -0.05 -0.05 -0.11 -0.11 -0.36 0.302 0.302 -0.65 5.318 -0.01 -0.01 0 0 0 0 0 0
0 0 -0 -0.01 -0.01 -0.01 -0.06 -0.06 -0.06 0.208 0 0 0 0 1.14 1.14 1.726 1.595 0 0 7.238 -1.95 3.25 -1.41 0.141 0.141 -0.36 -0.28 -0.28 0 0.816 -0.01 -0.01 0 0 0 0 0 0
0 0 -0 -0.01 -0.01 -0.01 0 -0 0 0.208 0 0 0 0 -4.09 -4.09 -0.04 -0.04 0 0 2.018 2.378 3.25 0.015 0.055 0.347 0.277 0.196 0.196 0.816 0 0 0 0 0 0 0 0 0
0 0 -0 -0.01 -0 -0 -0 -0 0 0.208 0 0 -1.58 0 -4.09 0 -0.04 -0.04 -0.1 0 2.018 2.378 6.7 0.891 0.055 0.347 0.196 0.816 0 0 0 0 0 0 0 0 0
0 -0.09 -0.11 -0 -0 -0 -0 -0 -0.02 0 0 1.599 1.041 0.282 1.856 3.621 3.621 6.023 6.023 11.94 23.2 6.597 6.597 -0.1 -0.1 0.816 0 0 0 0 0 0 0 0 0
0 -0.09 -0.11 -0.03 -0.03 -0.03 -0.03 -0.03 -0.02 0 1.556 1.556 4.672 0.709 0.494 0.494 3.621 6.023 6.023 11.94 11.94 9.705 9.705 1.214 1.214 -0.1 -0.1 -0.1 0 0 0 0 0 0 0 0 0 0
0 -0.09 -0.09 -0.03 -0.03 -0.03 0 0 0 0 1.556 1.556 4.672 0.709 0.494 0.494 12.83 12.83 18.29 133.3 295.9 16.37 9.96 1.214 0.041 -0.1 -0.06 -0.06 0 0 0 0 0 0 0 0 0 0 0
0 -0.03 -0.03 -0.04 -0.04 -0.04 0 0 0 0 0.124 0.124 0.51 -0.13 -0.13 12.83 18.9 26.36 125 1.007 1.012 0.538 0.538 0 0 0 0 0 0 0 0 0 0 0 0 0
0 0.044 0.044 12.6 12.6 -0.04 -0.58 -0.58 -0.58 -1.31 0.124 0.124 0.51 -0.13 -0.13 -0.09 4.263 6.727 1.007 1.724 1.012 0.538 0.538 0 0 0 0 0 0 0 0 0 0 0 0 0
0 0.044 0.044 37.41 37.41 -0.04 0.098 0.098 0.098 1.552 1.094 0.798 -0.22 -0.16 -0.16 -0.09 -0.05 14.37 9.975 6.727 3.503 3.503 1.012 0.538 0.538 0 0 0 0 0 0 0 0 0 0 0 0 0
0 13.87 13.87 37.41 37.41 14.26 -2.58 -2.58 -2.58 11.63 1.094 0.798 0.734 -0.16 -0.16 1.322 14.37 15.7 9.975 6.727 3.503 3.503 3.098 1.077 1.077 0 0 0 0 0 0 0 0 0 0 0 0 0
0 0 24.53 11.09 14.26 14.26 -2.58 -2.58 -2.58 -1.26 0.802 0.802 0.999 0.999 -0.1 -0.1 0 3.769 1.767 -0.04 3.785 3.785 3.661 3.661 3.661 3.751 -0.1 -0.1 0 0 0 -0.01 -0.01 0 0 0 0 0 0
0 0 0 20.2 20.47 20.47 -1.17 -1.17 -1.17 -0.06 -0.04 0 0.07 0.876 0 3.769 1.767 -0.03 -0.01 3.785 2.238 2.238 3.751 0 -0.1 -0.1 0 0 0 -0.01 -0.01 0 0 0 0 0 0
0 0 0 20.2 20.47 20.47 -0.71 -0.71 -0.71 0.002 -0.04 -0.04 -0.08 1.638 1.638 0 2.957 0 -0.03 -0.01 0.222 4.48 2.238 0 0 -0 -0 0 0 0 -0.05 -0.01 0 0 0 0 0 0
0 0 0 20.5 19.48 19.48 -1 -1 0.462 -0.21 0.494 0.494 -1.38 -0.08 1.638 19.49 19.49 0.985 0.985 0.009 -0.02 -0.02 0 0 0 0 0 0 0 0 0 -0.01 -0.01 0 0 0 0 0 0
0 0 0 20.5 19.48 19.48 -1 -1 0.462 0.494 0.494 -1.38 -0.08 3.507 0 6.064 0.985 0.985 0.009 0 0 0 0 0 0 0 0 0 0 0 -0.01 -0.01 0 0 0 0 0 0
0 0 0 11.96 11.96 19.48 2.775 23.14 -1.75 0.494 -2.7 -0.08 1.793 8.741 8.741 0 1.568 0.018 0 0 0 -1.4 0 0 3.16 3.16 11.94 11.94 0 0 -0.01 0 0 0 0 0 0
0 0 0 11.96 11.96 6.689 2.775 23.14 -1.75 -1.75 -2.7 -1.13 -1.13 0.044 -2.35 -2.35 -2.17 -2.17 0 -0.01 -0.01 -1.33 -1.4 0 0 3.16 0.148 11.94 11.94 11.94 12.2 12.2 0 0 0 0 0 0
0 0 0 11.96 -0 6.689 6.689 9.843 9.843 -1.75 -1.75 -1.13 0.044 0.044 -2.35 -3.14 -3.9 -3.9 0 0 0 -1.33 -1.33 0 0 0.148 0.148 14.8 14.8 14.8 17.42 12.2 0 0 0 0 0 0
0 0 0 -0 -0 6.689 6.689 6.689 9.843 9.843 -1.19 -1.13 -1.13 0.293 0.293 -3.14 -3.14 -3.9 -2.42 0.85 -0.01 -0.01 -1.82 0 -1.91 -1.91 -1.3 0.148 14.8 14.8 14.8 17.42 12.8 0 0 0 0 0 0
0 0 0 -0 0 6.689 6.689 11.95 11.95 9.843 -1.19 -0.68 -1.44 -2.52 0.293 -2.03 -2.03 -2.42 -2.42 0.85 -0 -0 -1.67 -1.67 0 7.72 -2.68 -1.6 21.64 21.64 21.64 17.42 12.8 0 0 0 0 0 0
0 0 0 0 0 6.689 11.95 11.95 11.95 12.92 12.92 12.92 23.86 23.86 29.45 0.214 -3.12 99.36 -3.29 -2.54 0 0 -1.8 -1.8 0 9.707 -2.22 -1.78 19.31 12.76 12.76 7.81 7.81 0 0 0 0 0 0
0 0 0 -0 -0 5.653 5.653 5.653 13.16 13.16 12.92 29.58 34.71 15.98 15.98 -0.08 -1.63 -2.54 -2.24 -2.24 0 0 -1.1 -1.74 -1.74 -1.56 -2.22 -1.78 19.31 12.76 12.76 7.81 -0 0 0 0 0 0 0
0 0 0 0 0 5.653 5.653 13.16 13.16 13.16 12.92 21.86 26.75 11.09 11.09 -0.08 -0.08 -0.08 -2.24 -2.24 0 0 -1.1 -1.11 -1.3 -1.3 -1.03 -1.03 19.31 12.76 12.76 -0 -0 0 0 0 0 0 0
0 0 0 0.01 0.01 5.653 5.653 10.25 10.25 0 21.86 26.75 11.09 11.09 -0.08 -0.08 -0.08 28.08 5.769 5.769 0 0 21.14 21.14 9.67 9.67 12.74 12.74 0 0 0 -0 -0 0 0 0 0 0 0
0 0 0 0.01 0.01 5.653 10.25 10.25 10.25 16.94 16.94 0 0 5.952 11.1 11.1 28.08 28.08 16.71 5.769 0 0 21.14 21.14 9.67 9.67 12.74 12.74 0 0 0 -0 -0 0 0 0 0 0 0
0 0 0 0.007 0.007 0.007 8.571 17.22 17.22 11.19 11.19 11.19 11.19 5.952 11.1 11.1 37.91 37.91 0.154 7.822 0 0 42.83 42.83 13.68 13.68 6.142 6.142 4E-04 4E-04 4E-04 -0 -0 0 0 0 0 0 0
0 0 0 0.007 0.007 0.007 8.571 12.65 12.65 14.9 14.9 1E-04 0 5.952 11.1 11.1 37.01 24.04 7.822 7.822 0 32.43 26.75 26.75 5.68 5.68 5.774 5.774 4E-04 4E-04 4E-04 0 0 0 0 0 0 0 0
0 0 0 0.007 0.007 0.007 0 7E-05 7E-05 0.025 0.025 1E-04 0 4E-04 0 0 -0.02 24.04 8.046 0 0 13.49 5.942 5.942 5E-04 5E-04 -0 -0 0.001 0.001 0.001 6E-04 6E-04 0 0 0 0 0 0
0 0 0 0 0 0 0 6E-05 6E-05 0.025 1E-04 1E-04 0 4E-04 7E-04 7E-04 0.002 -0 8.046 0 0 13.49 5E-04 5E-04 0 0 0 0 0 0 0 4E-04 4E-04 0 0 0 0 0 0
0 0 0 0 0 0 0 0 0 0 0 0 0 0 0 0 0 0 0 0 0 0 0 0 0 0 0 0 0 0 0 0 0 0 0 0 0 0 0
Base Case
High Scenario
In spite of this significant growth projected for the inner city, the total population of suburban areas will exceed that of the inner city by 2010 in both the Base Case and High Scenario.
Suburban residential development will drive most of the growth in the City of Edmonton over the forecast period. In the both the Base Case and High Scenario, over 80 percent of the total popu-lation growth is projected to occur in suburban areas. Most of this growth will be the result of new subdivisions and associated housing devel-opment. As evident from the change in popula-tion density, this suburban growth is projected to occur in all the major suburban areas in the City.
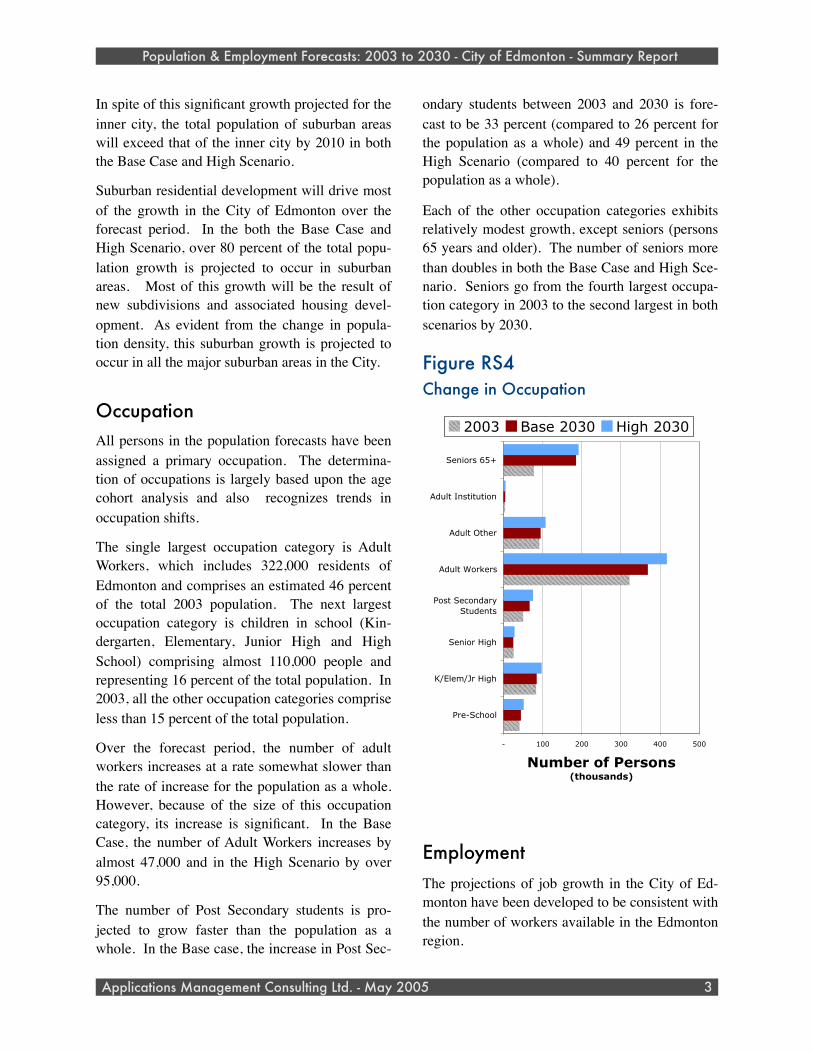
OccupationAll persons in the population forecasts have been assigned a primary occupation. The determina-tion of occupations is largely based upon the age cohort analysis and also recognizes trends in occupation shifts.
The single largest occupation category is Adult Workers, which includes 322,000 residents of Edmonton and comprises an estimated 46 percent of the total 2003 population. The next largest occupation category is children in school (Kin-dergarten, Elementary, Junior High and High School) comprising almost 110,000 people and representing 16 percent of the total population. In 2003, all the other occupation categories comprise less than 15 percent of the total population.
Over the forecast period, the number of adult workers increases at a rate somewhat slower than the rate of increase for the population as a whole. However, because of the size of this occupation category, its increase is significant. In the Base Case, the number of Adult Workers increases by almost 47,000 and in the High Scenario by over 95,000.
The number of Post Secondary students is pro-jected to grow faster than the population as a whole. In the Base case, the increase in Post Sec-
ondary students between 2003 and 2030 is fore-cast to be 33 percent (compared to 26 percent for the population as a whole) and 49 percent in the High Scenario (compared to 40 percent for the population as a whole).
Each of the other occupation categories exhibits relatively modest growth, except seniors (persons 65 years and older). The number of seniors more than doubles in both the Base Case and High Sce-nario. Seniors go from the fourth largest occupa-tion category in 2003 to the second largest in both scenarios by 2030.
Figure RS4Change in Occupation
- 100 200 300 400 500
Pre-School
K/Elem/Jr High
Senior High
Post SecondaryStudents
Adult Workers
Adult Other
Adult Institution
Seniors 65+
Number of Persons(thousands)
2003 Base 2030 High 2030
EmploymentThe projections of job growth in the City of Ed-monton have been developed to be consistent with the number of workers available in the Edmonton region.
Population & Employment Forecasts: 2003 to 2030 - City of Edmonton - Summary Report
Applications Management Consulting Ltd. - May 2005 3
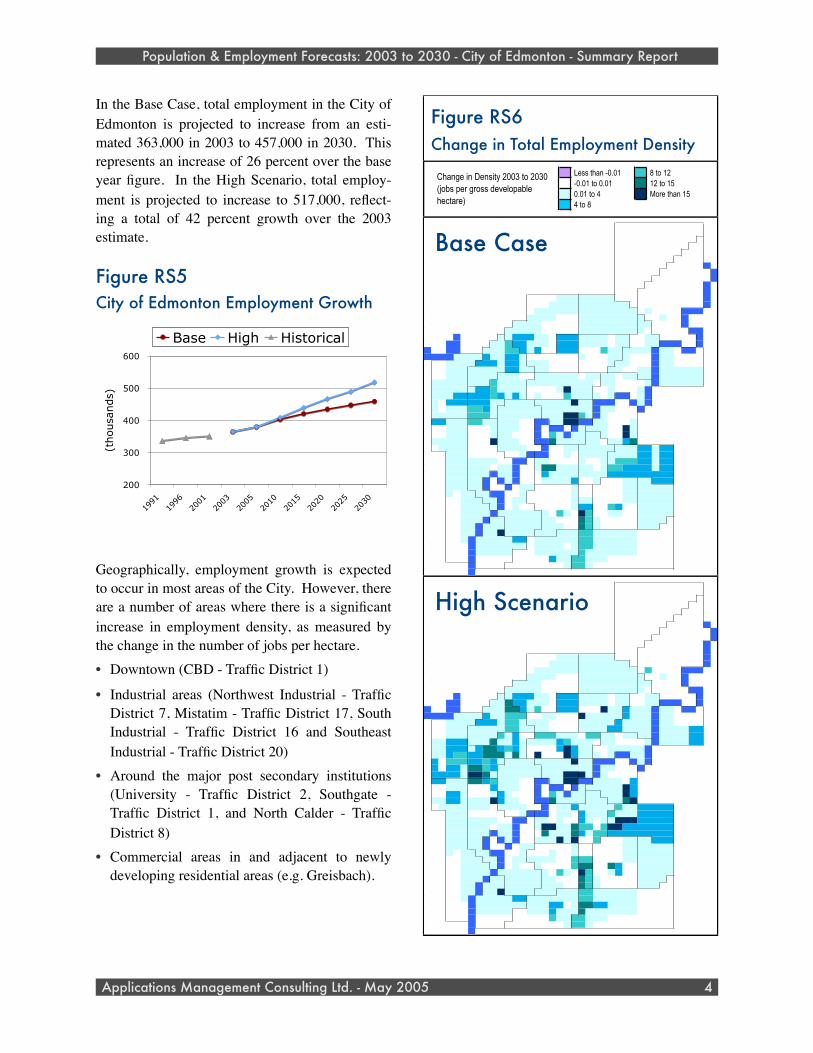
In the Base Case, total employment in the City of Edmonton is projected to increase from an esti-mated 363,000 in 2003 to 457,000 in 2030. This represents an increase of 26 percent over the base year figure. In the High Scenario, total employ-ment is projected to increase to 517,000, reflect-ing a total of 42 percent growth over the 2003 estimate.
Figure RS5City of Edmonton Employment Growth
200
300
400
500
600
1991
1996
2001
2003
2005
2010
2015
2020
2025
2030
(thousands)
Base High Historical
Geographically, employment growth is expected to occur in most areas of the City. However, there are a number of areas where there is a significant increase in employment density, as measured by the change in the number of jobs per hectare.• Downtown (CBD - Traffic District 1)
• Industrial areas (Northwest Industrial - Traffic District 7, Mistatim - Traffic District 17, South Industrial - Traffic District 16 and Southeast Industrial - Traffic District 20)
• Around the major post secondary institutions (University - Traffic District 2, Southgate - Traffic District 1, and North Calder - Traffic District 8)
• Commercial areas in and adjacent to newly developing residential areas (e.g. Greisbach).
Population & Employment Forecasts: 2003 to 2030 - City of Edmonton - Summary Report
Applications Management Consulting Ltd. - May 2005 4
Figure RS6Change in Total Employment Density
Less than -0.01 8 to 12 -0.01 to 0.01 12 to 15 0.01 to 4 More than 15 4 to 8
Change in Density 2003 to 2030 (jobs per gross developable hectare)
0 0 0 0 0 0 0 0 0 0 0 0 0 0 0 0 0 0 0 0 0 0 0 0 0 0 0 0 0 0 0 0 0 0 0 0 0 0 0 0
0 0 0 0 0 0 0 0 0 0 0 0 0 0 0 0 0 0 0 0 0 0 0 0 0 0 8E-05 0 0 2E-05 2E-05 0 0 0 0 1E-06 1E-06 1E-06 0 0
0 0 0 0 0 0 0 0 0 0 0 0 0 0 0 0 0 0 0 0 0 0 0 0 0 0 8E-05 0 0 5E-05 5E-05 0 0 4E-05 4E-05 0 0 0 0 0
0 0 0 0 0 0 0 0 0 0 0 0 0 0 0 0 0 0 0 0 0 0 0 0 0 0 0 2E-05 2E-05 0 0 0 0 2E-05 2E-05 0 0 0 0 0
0 0 0 0 0 0 0 0 0 0 0 0 0 0 0 0 0 0 0 0 0 0 0 0 0 0 0 0 0 0 0 1E-05 1E-05 0 0 0 0 0 0 0
0 0 0 0 0 0 0 0 0 0 0 0 0 0 0 0 0 0 0 0 0 0 0 0 0 0 0 3E-04 3E-04 2E-05 2E-05 2E-04 2E-04 0 0 0 0 0 0 0
0 0 0 0 0 0 0 0 0 0 0 0 0 0 0 0 0 0 0 0 0 0 0 0 0 0 0 2E-04 2E-04 4E-05 4E-05 0 0 0 0 1E-05 1E-05 1E-05 0 0
0 0 0 0 0 0 0 0 0 0 0 0 0 0 0 0 0 0 0 0 0 0 0 0 0 0 0 0 0 -0 -0 0 0 0 0 1E-05 1E-05 1E-05 0
0 0 0 0 0 0 0 0 0 0 0 0 0 0 0 0 0 0 0 0 0 0 0 0 0 0 0 2E-06 2E-06 0 0 0 0 0 0 0 0 0 0
0 0 0 0 0 0 0 0 0 0 0 0 0 0 0 0 0 0 0 0 0 0 0 0 0 0 0 2E-06 2E-06 0 0 0 0 0 0 0 0 0 0
0 0 0 0 0 0 0 0 0 0 0 0 0 0 0 0 0 0 0 0 0 0 0 0 0 0 0 0 0 0 0 -0 -0 0.002 1E-16 1E-16 0 0 0
0 0 0 0 0 0 0 0 0 0 0 0 0 0 0 0 0 0 0 0 0 0 0 0 0 0 0 0 0 0 0 -0 -0 0.002 1E-16 0 0 0 0
0 0 0 0 0 0 0 0 0 0 0 0 0 0 0 0 0 0 1.206 1.291 1.291 0.237 1.982 2.04 2.356 0.576 0 0 0 0 0 -0 4E-04 0.002 0 0 0 0 0
0 0 0 0 0 0 0 0 0 0 0 0 0 0 0 0 0 1.971 1.206 1.291 1.291 0.237 1.982 2.04 2.356 0.576 0.576 0.576 0 0 0 4E-04 4E-04 0 0 0 0 0 0
0 0 0 0 0 0 0 0 0 0 0 0 0 0 0 3.023 1.292 1.971 1.206 1.291 1.291 0.237 1.982 2.04 2.356 0.576 0.576 2.147 2.147 0 3.85 0 0 0 0 0 0
0 0 0 0 0 0 0 0 0 0 0 0 0 0 3.023 3.023 1.292 1.971 0 0 0 0.237 1.982 3.43 3.669 0.576 0.576 2.147 2.147 3.226 0 0 0.111 0 0 0 0 0 0
0 0 0 0 0 0 0 0 0 0 0 0 2.327 2.327 1.687 1.565 -0 -0 0 0 0 1.665 0.226 0.786 1.724 1.721 1.977 1.26 1.26 3.226 3.226 5E-18 5E-18 0 0 0 0 0 0
0 0 0 0 0 0 0 0 0 0 0 2.327 2.327 2.327 1.687 1.565 -0 -0 0.001 0.001 0.001 1.665 0.226 0.786 1.724 1.721 1.977 1.26 1.26 3.226 0 5E-18 5E-18 0 0 0 0 0
0 0 0 0 0 0 0 0 0 1.303 2.327 4.654 4.654 5.969 0.411 0.246 0 5.182 5.182 5.182 0.067 0.067 0.072 0.072 0 0.49 1.599 0 -0.03 0.345 0.345 5E-18 0 0 0 0 0 0
0 0 0 0 0 0 0 1.303 1.303 9.829 4.654 4.654 1.753 1.753 0.246 0 4.116 4.116 4.116 0.067 0.067 0.072 0.072 0 0.623 1.599 0 -0.03 0.345 0.345 0 0 0 0
0 0 0 0 0 1.303 1.303 1.303 9.829 9.829 4.654 1.753 4.689 0 0 4.116 4.116 4.116 0 0 0 8.084 0.623 0.623 1.739 0.013 0.012 0.012 0.077 0.077 0 0 0 0
0.518 0.518 0.92 0.92 4.336 1.592 1.592 4.269 4.269 2.905 0 0 0.008 0.008 0 0 0 3.335 0 0 0 0.438 0.438 1.739 -0 -0 0.006 0.077 0.077 0 0 0 0 0 0
0 0 0 0.518 0.518 0.518 0.92 4.336 4.336 4.336 1.592 4.269 4.269 2.668 0.424 0.424 0.062 0 0 0 0 0 0 0 0 0.438 1.46 0.013 -0 -0 0.006 0.077 0.077 0 0 0 0 0 0
0 0 0 0.394 0.394 0.394 0.69 0.69 0.69 0.808 0.808 4.269 4.269 2.668 2.668 0.424 0.062 0 0 0 0 0 0 0 0 1.546 1.546 -0 -0 0.028 0.375 0.077 0.077 1.778 1.778 2.801 2.801 0 0
0 0.001 0.001 0.394 0.394 0.394 0.69 0.69 0.69 0.808 3.758 0.683 1.45 0 0 2.008 2.008 2.008 0.234 0.234 0.537 0 1.936 1.936 0.407 0.407 0 0.03 0.03 0.028 0.375 0.077 0.077 1.778 1.778 2.801 2.801 0 0
0 3.232 3.191 2.901 2.901 2.901 0.69 0.69 0.69 10.36 0.683 0.683 1.45 0.676 0.206 0.206 0.25 0.119 2.149 1.594 0.537 0.058 0.25 0 0.012 0.012 0 1E-15 1E-15 -0 0.016 0.077 0.077 1.778 1.778 2.801 2.801 0 0
0 3.232 3.191 2.901 2.901 2.901 2.108 4.849 6.662 10.36 2.447 2.763 2.296 1.432 0 0 0 0 2.149 39.05 2.731 0.132 0.25 0 0.006 0.035 0 0 0 0.016 0 0 0 0 0 0 0 0 0
0 3.232 3.191 2.901 5.4 5.4 4.849 4.849 6.662 10.36 4.23 1.297 4.087 1.432 0 3.748 0 0 0.003 9.1 2.731 0.132 0.529 0.077 0.006 0.035 0 0.016 0 0 0 0 0 0 0 0 0
0 3.781 0 5.4 5.4 5.4 4.849 4.849 7.54 2.158 1.015 0.153 0.013 0.038 0.046 0.338 0.338 0.415 0.415 0.718 89.02 0.063 0.063 0 0 0.016 0 0 0 0 0 0 0 0 0
0 3.781 0 2.402 2.402 1.84 9.124 9.124 7.54 2.158 0.184 0.184 0.225 0.083 0.018 0.018 0.338 0.415 0.415 0.718 0.718 0.252 0.252 0.153 0.153 0 0 0 0 0 0 0 0 0 0 0 0 0
0 3.82 3.82 2.402 2.402 1.84 11.94 11.94 10.32 0.935 0.184 0.184 0.225 0.083 0.018 0.018 0.564 0.564 2.002 107.8 249 10.84 0.573 0.153 0.005 0 0 0 0 0 0 0 0 0 0 0 0 0 0
0 4.569 4.569 2.912 2.912 2.912 9.706 9.706 2.447 2.283 0.013 0.013 0.044 0 0 0.564 1.234 204.3 87.5 0.077 0.127 0 0 0 2.709 0 0 0 0 0 0 0 0 0 0 0
0 0.004 0.004 1.331 1.331 2.912 0 0 0 2.912 0.013 0.013 0.044 0 0 0 0 0.491 0.077 0.224 0.127 0 0 18.28 2.709 0 0 0 0 0 0 0 0 0 0 0
0 0.004 0.004 1.995 1.995 2.912 0.009 0.009 0.009 0.651 3.85 0.03 1E-15 0 0 0 10.25 1.29 0.775 0.491 0.122 0.122 0.127 0 0 18.28 2.709 0 0 0 0 0 0 0 0 0 0 0
0 1.802 1.802 1.995 1.995 1.607 0 0 0 20.04 3.85 0.03 0.107 0 0 13.6 1.29 1.315 0.775 0.491 0.122 0.122 0 0.134 0.134 4.796 12.75 0 0 0 0 0 0 0 0 0 0 0
0 0 2.92 1.482 1.607 1.607 0 0 0 0.004 0.09 0.09 0.016 0.016 0 0 0 0 0.067 1.381 0.234 0.234 0.27 0.27 0.27 1.549 1.307 1.307 4.302 4.302 2.213 4.657 4.657 0 0 0 0 0 0
0 0 0 2.071 2.064 2.064 0 0 0 -0.02 0 0 0.008 0.085 0 0 0.067 0 1.388 0.234 0.141 0.141 1.549 0.51 1.307 1.307 4.302 4.302 2.213 4.657 4.657 0 0 0 0 0 0
0 0 0 2.071 2.064 2.064 0.056 0.056 0.056 0.099 0 0 0 0.02 0.02 0 0 -0 0 1.388 0.008 0 0.141 0.51 10.43 11.7 11.7 4.302 4.302 2.213 4.432 4.657 0 0 0 0 0 0
0 0 0 1.517 0.719 0.719 0.063 0.063 0.04 0 0.051 0.051 0 0 0.02 12.46 12.46 0.109 0.109 2.764 1.865 1.865 0 1.774 10.43 10.43 5.748 5.748 5.775 5.775 3.853 7.056 7.056 0 0 0 0 0 0
0 0 0 1.517 0.719 0.719 0.063 0.063 0.04 0.051 0.051 0 0 0 7.5 0.616 0.109 0.109 2.764 2.523 2.393 1.774 1.979 4.752 4.752 5.748 5.748 5.775 5.775 5.775 7.056 7.056 0 0 0 0 0 0
0 0 0 0.827 0.827 0.719 0.356 1.183 0 0.051 0 0 -0 0.666 0.666 3.595 0.032 4.35 0 0 1.979 0 -0 -0 0.392 0.392 1.422 1.422 5.775 5.775 7.056 0 0 0 0 0 0
0 0 0 0.827 0.827 0.469 0.356 1.183 0 0 0 0.011 0.011 0.005 0 0 0 0 1.078 0 0 0 0 -0 -0 0.392 0.158 1.422 1.422 1.422 0.844 0.844 0 0 0 0 0 0
0 0 0 0.827 0 0.469 0.469 0.531 0.531 0 0 0.011 0.005 0.005 0 0 0 0 1.078 0 0 0 0 -0 -0 0.158 0.158 1.556 1.556 1.556 1.301 0.844 0 0 0 0 0 0
0 0 0 0 0 0.469 0.469 0.469 0.531 0.531 -0 0.011 0.011 0.003 0.003 0 0 0 0 3.721 2.843 2.843 0 0 0 0 0.011 0.158 1.556 1.556 1.556 1.301 1.669 0 0 0 0 0 0
0 0 0 0 0 0.469 0.469 0.827 0.827 0.531 -0 0.084 0 0 0.003 0.002 0.002 0 0 3.721 7.854 7.854 -0.01 -0.01 9.75 5.861 0 -0 1.387 1.387 1.387 1.301 1.669 0 0 0 0 0 0
0 0 0 0 0 0.469 0.827 0.827 0.827 1.43 1.43 1.43 2.157 2.157 2.018 0.017 -0 9.842 0.071 0 15.16 8.256 -0 -0 0.419 2.721 -0 -0 1.403 1.372 1.372 0.826 0.826 0 0 0 0 0 0
0 0 0 0 0 0.219 0.219 0.219 0.874 0.874 1.43 3.37 3.145 2.008 2.008 0.097 0.069 0 0.001 0.001 13.96 8.256 0.011 -0 -0 0.002 -0 -0 1.403 1.372 1.372 0.826 -0 0 0 0 0 0 0
0 0 0 0 0 0.219 0.219 0.874 0.874 0.874 1.43 0.871 1.443 0.714 0.714 0.097 0.097 0.097 0.001 0.001 13.96 8.256 0.011 0 0 0 0.003 0.003 1.403 1.372 1.372 -0 -0 0 0 0 0 0 0
0 0 0 8E-04 8E-04 0.219 0.219 0.719 0.719 17.25 0.871 1.443 0.714 0.714 0.097 0.097 0.097 2.214 0.851 0.851 8.165 8.165 1.099 1.099 0.698 0.698 0.506 0.506 0 0 0 -0 -0 0 0 0 0 0 0
0 0 0 8E-04 8E-04 0.219 0.719 0.719 0.719 0.827 0.827 5.752 5.752 0 1.098 1.098 2.214 2.214 1.82 0.851 8.165 8.165 1.099 1.099 0.698 0.698 0.506 0.506 0 0 0 -0 -0 0 0 0 0 0 0
0 0 0 6E-04 6E-04 6E-04 0.274 2.162 2.162 1.167 1.167 1.167 1.167 0 1.098 1.098 1.495 1.495 -0.04 0.791 10.21 10.21 3.694 3.694 1.437 1.437 0.689 0.689 2E-05 2E-05 2E-05 -0 -0 0 0 0 0 0 0
0 0 0 6E-04 6E-04 6E-04 0.274 1.634 1.634 1.24 1.24 1E-05 0 0 1.098 1.098 2.938 1.025 0.791 0.791 10.21 3.184 2 2 0.177 0.177 0.18 0.18 2E-05 2E-05 2E-05 0 0 0 0 0 0 0 0
0 0 0 6E-04 6E-04 6E-04 0 7E-06 7E-06 0.002 0.002 1E-05 0 4E-05 0 0 7.33 1.025 0.043 9.087 9.087 1.417 0.666 0.666 2E-05 2E-05 -0 -0 8E-05 8E-05 8E-05 4E-05 4E-05 0 0 0 0 0 0
0 0 0 0 0 0 0 7E-06 7E-06 0.002 1E-05 1E-05 0 4E-05 6E-05 6E-05 2E-04 2E-17 0.043 9.087 9.087 1.417 4E-05 4E-05 0 0 0 0 0 0 0 3E-05 3E-05 0 0 0 0 0 0
0 0 0 0 0 0 0 0 0 0 0 0 0 0 0 0 0 0 0 0 0 0 0 0 0 0 0 0 0 0 0 0 0 0 0 0 0 0 0 0 0 0 0 0 0 0 0 0 0 0 0 0 0 0 0 0 0 0 0 0 0 0 0 0 0 0 0 0 0 0 0 0 0 0 0 0 0 0 0
0 0 0 0 0 0 0 0 0 0 0 0 0 0 0 0 0 0 0 0 0 0 0 0 0 0 1E-04 0 0 5E-05 5E-05 0 0 0 0 1E-06 1E-06 1E-06 0 0
0 0 0 0 0 0 0 0 0 0 0 0 0 0 0 0 0 0 0 0 0 0 0 0 0 0 1E-04 0 0 5E-05 5E-05 0 0 1E-04 1E-04 0 0 0 0 0
0 0 0 0 0 0 0 0 0 0 0 0 0 0 0 0 0 0 0 0 0 0 0 0 0 0 0 2E-05 2E-05 0 0 0 0 2E-05 2E-05 0 0 0 0 0
0 0 0 0 0 0 0 0 0 0 0 0 0 0 0 0 0 0 0 0 0 0 0 0 0 0 0 0 0 0 0 1E-05 1E-05 0 0 0 0 0 0 0
0 0 0 0 0 0 0 0 0 0 0 0 0 0 0 0 0 0 0 0 0 0 0 0 0 0 0 7E-04 7E-04 5E-05 5E-05 4E-04 4E-04 0 0 0 0 0 0 0
0 0 0 0 0 0 0 0 0 0 0 0 0 0 0 0 0 0 0 0 0 0 0 0 0 0 0 7E-04 7E-04 1E-04 1E-04 0 0 0 0 4E-05 4E-05 4E-05 0 0
0 0 0 0 0 0 0 0 0 0 0 0 0 0 0 0 0 0 0 0 0 0 0 0 0 0 0 0 0 -0 -0 0 0 0 0 4E-05 4E-05 4E-05 0
0 0 0 0 0 0 0 0 0 0 0 0 0 0 0 0 0 0 0 0 0 0 0 0 0 0 0 2E-06 2E-06 0 0 0 0 0 0 0 0 0 0
0 0 0 0 0 0 0 0 0 0 0 0 0 0 0 0 0 0 0 0 0 0 0 0 0 0 0 2E-06 2E-06 0 0 0 0 0 0 0 0 0 0
0 0 0 0 0 0 0 0 0 0 0 0 0 0 0 0 0 0 0 0 0 0 0 0 0 0 0 0 0 0 0 -0 -0 0.002 0 0 0 0 0
0 0 0 0 0 0 0 0 0 0 0 0 0 0 0 0 0 0 0 0 0 0 0 0 0 0 0 0 0 0 0 -0 -0 0.002 0 0 0 0 0
0 0 0 0 0 0 0 0 0 0 0 0 0 0 0 0 0 0 2.701 1.907 1.907 0.291 2.315 2.813 3.204 1.094 0 0 0 0 0 -0 6E-04 0.002 0 0 0 0 0
0 0 0 0 0 0 0 0 0 0 0 0 0 0 0 0 0 2.259 2.701 1.907 1.907 0.291 2.315 2.813 3.204 1.094 1.094 1.094 0 0 0 6E-04 6E-04 0 0 0 0 0 0
0 0 0 0 0 0 0 0 0 0 0 0 0 0 0 3.045 3.277 2.259 2.701 1.907 1.907 0.291 2.315 2.813 3.204 1.094 1.094 2.916 2.916 0 11.71 0 0 0 0 0 0
0 0 0 0 0 0 0 0 0 0 0 0 0 0 3.045 3.045 3.277 2.259 0 0 0 0.291 2.315 3.31 3.831 1.094 1.094 2.916 2.916 3.693 0 0 0.17 0 0 0 0 0 0
0 0 0 0 0 0 0 0 0 0 0 0 2.782 2.782 3.514 1.571 -0 -0 0 0 0 2.179 0.434 1.228 1.745 1.782 2.305 3.86 3.86 3.693 3.693 2E-17 2E-17 0 0 0 0 0 0
0 0 0 0 0 0 0 0 0 0 0 2.782 2.782 2.782 3.514 1.571 -0 -0 0.001 0.001 0.001 2.179 0.434 1.228 1.745 1.782 2.305 3.86 3.86 3.693 0 2E-17 2E-17 0 0 0 0 0
0 0 0 0 0 0 0 0 0 1.825 2.782 5.564 5.564 5.954 0.411 1.277 0 5.784 5.784 5.784 0.205 0.205 0.156 0.156 0 0.496 1.78 0 -0.03 0.574 0.574 2E-17 0 0 0 0 0 0
0 0 0 0 0 0 0 1.825 1.825 12.71 5.564 5.564 2.787 2.787 1.277 0 4.862 4.862 4.862 0.205 0.205 0.156 0.156 0 0.642 1.78 0 -0.03 0.574 0.574 0 0 0 0
0 0 0 0 0 1.825 1.825 1.825 12.71 12.71 5.564 2.787 9.734 0 0 4.862 4.862 4.862 0 0 0 15.61 0.642 0.642 4.666 0.085 0.082 0.082 0.291 0.291 0 0 0 0
0.798 0.798 0.901 0.901 5.795 3.701 3.701 8.34 8.34 8.599 0 0 0.022 0.022 0 0 0 17.33 0.066 0.057 0.057 0.496 0.496 4.666 0.036 0.036 0.015 0.291 0.291 0 0 0 0 0 0
0 0 0 0.798 0.798 0.798 0.901 5.795 5.795 5.795 3.701 8.34 8.34 3.511 0.423 0.423 0.062 0 0 0 0 0.066 0.066 0.057 0.057 0.496 7.588 0.084 0.036 0.036 0.015 0.291 0.291 0 0 0 0 0 0
0 0 0 0.877 0.877 0.877 1.412 1.412 1.412 1.347 1.347 8.34 8.34 3.511 3.511 0.423 0.062 0 0 0 0 0.113 0.113 0.064 0.064 5.827 5.827 0.044 0.044 0.055 0.546 0.291 0.291 2.468 2.468 5.001 5.001 0 0
0 0.001 0.001 0.877 0.877 0.877 1.412 1.412 1.412 1.347 11.83 0.683 7.533 0 0 10.43 10.43 10.43 0.452 0.452 0.782 0 10.06 10.06 2.112 2.112 0 0.03 0.03 0.055 0.546 0.291 0.291 2.468 2.468 5.001 5.001 0 0
0 3.705 3.501 4.417 4.417 4.417 1.412 1.412 1.412 14.01 0.683 0.683 7.533 3.512 0.206 0.206 0.252 0.159 5.738 8.284 0.782 0.037 0.355 0 0.012 0.012 0 5E-16 5E-16 -0 0.107 0.291 0.291 2.468 2.468 5.001 5.001 0 0
0 3.705 3.501 4.417 4.417 4.417 3.568 7.537 12.98 14.01 4.725 8.059 4.433 1.41 0 0 0 0 5.738 65.24 7.812 0.26 0.355 0 0.006 0.035 0.042 0.056 0.056 0.107 0 0 0 0 0 0 0 0 0
0 3.705 3.501 4.417 8.277 8.277 7.537 7.537 12.98 14.01 13.61 1.297 13.07 1.41 0 19.47 0 0 0.007 34.04 7.812 0.26 0.683 0.077 0.006 0.035 0.056 0.107 0 0 0 0 0 0 0 0 0
0 4.946 0 8.277 8.277 8.277 7.537 7.537 8.492 4.165 1.015 0.179 0.126 0.04 0.222 0.354 0.354 0.692 0.692 1.386 188.3 0.791 0.791 0 0 0.107 0 0 0 0 0 0 0 0 0
0 4.946 0 4.184 4.184 3.064 12.25 12.25 8.492 4.165 0.164 0.164 0.548 0.089 0.059 0.059 0.354 0.692 0.692 1.386 1.386 1.204 1.204 0.167 0.167 0 0 0 0 0 0 0 0 0 0 0 0 0
0 5.094 5.094 4.184 4.184 3.064 15.64 15.64 14.25 0.935 0.164 0.164 0.548 0.089 0.059 0.059 1.467 1.467 1.941 194.8 500.4 32.64 1.071 0.167 0.005 0 0 0 0 0 0 0 0 0 0 0 0 0 0
0 5.285 5.285 3.32 3.32 3.32 12.58 12.58 7.367 11.86 0.013 0.013 0.044 0 0 1.467 2.03 250.4 181.1 0.077 0.146 0.112 0.112 0 7.856 0 0 0 0 0 0 0 0 0 0 0
0 0.004 0.004 1.43 1.43 3.32 0 0 0 4.191 0.013 0.013 0.044 0 0 0 0 0.722 0.077 0.207 0.146 0.112 0.112 24.84 7.856 0 0 0 0 0 0 0 0 0 0 0
0 0.004 0.004 4.156 4.156 3.32 0.009 0.009 0.009 3.38 7.138 0.081 0 0 0 0 10.25 1.446 1.014 0.722 0.421 0.421 0.146 0.112 0.112 24.84 7.856 0 0 0 0 0 0 0 0 0 0 0
0 1.767 1.767 4.156 4.156 1.642 0.011 0.011 0.011 34.86 7.138 0.081 0.113 0 0 13.6 1.446 1.689 1.014 0.722 0.421 0.421 0.4 0.123 0.123 12.58 18.13 0 0 0 0 0 0 0 0 0 0 0
0 0 3.032 1.355 1.642 1.642 0.011 0.011 0.011 0.004 0.107 0.107 0.174 0.174 0 0 0 0.472 0.221 7.177 0.4 0.4 0.396 0.396 0.396 8.047 2.524 2.524 6.357 6.357 6.238 5.847 5.847 0 0 0 0 0 0
0 0 0 2.271 2.213 2.213 0 0 0 -0.02 0 0 0.008 0.085 0 0.472 0.221 0 7.209 0.4 0.252 0.252 8.047 2.651 2.524 2.524 6.357 6.357 6.238 5.847 5.847 0 0 0 0 0 0
0 0 0 2.271 2.213 2.213 0.093 0.093 0.093 0.099 0 0 0 0.211 0.211 0 0.338 -0 0 7.209 0.025 0 0.252 2.651 16.27 16.63 16.63 6.357 6.357 6.238 4.727 5.847 0 0 0 0 0 0
0 0 0 2.304 2.168 2.168 0.063 0.063 0.04 0 0.054 0.054 0 0 0.211 21.56 21.56 0.178 0.178 14.36 9.691 9.691 0 9.217 16.27 16.27 7.127 7.127 7.209 7.209 5.055 7.385 7.385 0 0 0 0 0 0
0 0 0 2.304 2.168 2.168 0.063 0.063 0.04 0.054 0.054 0 0 0 13.5 0.766 0.178 0.178 14.36 7.596 2.328 9.217 10.28 7.796 7.796 7.127 7.127 7.209 7.209 7.209 7.385 7.385 0 0 0 0 0 0
0 0 0 1.484 1.484 2.168 0.393 2.707 0 0.054 0 0 0.208 1.075 1.075 18.68 0.212 22.6 0 0 10.28 0 -0 -0 0.48 0.48 1.528 1.528 7.209 7.209 7.385 0 0 0 0 0 0
0 0 0 1.484 1.484 0.752 0.393 2.707 0 0 0 0.011 0.011 0.005 0 0 0 0 1.078 0 0 0 0 -0 -0 0.48 0.172 1.528 1.528 1.528 1.516 1.516 0 0 0 0 0 0
0 0 0 1.484 4E-18 0.752 0.752 1.101 1.101 0 0 0.011 0.005 0.005 0 0.071 0 0 1.078 0 0 0 0 -0 -0 0.172 0.172 1.734 1.734 1.734 1.949 1.516 0 0 0 0 0 0
0 0 0 4E-18 4E-18 0.752 0.752 0.752 1.101 1.101 -0 0.011 0.011 0.05 0.05 0.071 0.071 0 0 11.69 8.364 8.364 0 0 0 0 0.011 0.172 1.734 1.734 1.734 1.949 1.635 0 0 0 0 0 0
0 0 0 4E-18 0 0.752 0.752 1.484 1.484 1.101 -0 0.084 0 0 0.05 0.002 0.002 0 0 11.69 13.63 13.63 -0.01 -0.01 13.5 5.861 0 -0 2.338 2.338 2.338 1.949 1.635 0 0 0 0 0 0
0 0 0 0 0 0.752 1.484 1.484 1.484 1.414 1.414 1.414 2.626 2.626 3.224 0.017 -0 11.15 0.084 0 21.32 10.62 -0 -0 2.179 5.253 -0 -0 2.351 1.436 1.436 0.888 0.888 0 0 0 0 0 0
0 0 0 0 0 0.701 0.701 0.701 1.47 1.47 1.414 3.413 3.734 1.998 1.998 0.127 0.069 0 0.001 0.001 13.96 10.62 0.011 -0 -0 0.002 -0 -0 2.351 1.436 1.436 0.888 -0 0 0 0 0 0 0
0 0 0 0 0 0.701 0.701 1.47 1.47 1.47 1.414 2.715 2.992 1.371 1.371 0.127 0.127 0.127 0.001 0.001 13.96 10.62 0.011 0 0 0 0.003 0.003 2.351 1.436 1.436 -0 -0 0 0 0 0 0 0
0 0 0 8E-04 8E-04 0.701 0.701 1.134 1.134 21.41 2.715 2.992 1.371 1.371 0.127 0.127 0.127 2.985 0.859 0.859 11 11 2.32 2.32 1.094 1.094 1.582 1.582 0 0 0 -0 -0 0 0 0 0 0 0
0 0 0 8E-04 8E-04 0.701 1.134 1.134 1.134 2.022 2.022 7.14 7.14 0.839 1.34 1.34 2.985 2.985 1.848 0.859 11 11 2.32 2.32 1.094 1.094 1.582 1.582 0 0 0 -0 -0 0 0 0 0 0 0
0 0 0 6E-04 6E-04 6E-04 1.103 2.136 2.136 1.259 1.259 1.259 1.259 0.839 1.34 1.34 4.469 4.469 -0.04 1.119 13.75 13.75 4.87 4.87 1.548 1.548 0.711 0.711 2E-05 2E-05 2E-05 -0 -0 0 0 0 0 0 0
0 0 0 6E-04 6E-04 6E-04 1.103 1.624 1.624 1.78 1.78 1E-05 0 0.839 1.34 1.34 4.074 2.996 1.119 1.119 13.75 3.556 2.992 2.992 0.8 0.8 0.813 0.813 2E-05 2E-05 2E-05 0 0 0 0 0 0 0 0
0 0 0 6E-04 6E-04 6E-04 0 7E-06 7E-06 0.002 0.002 1E-05 0 4E-05 0 0 8.515 2.996 0.222 10.51 10.51 1.526 0.686 0.686 2E-05 2E-05 -0 -0 8E-05 8E-05 8E-05 4E-05 4E-05 0 0 0 0 0 0
0 0 0 0 0 0 0 7E-06 7E-06 0.002 1E-05 1E-05 0 4E-05 6E-05 6E-05 2E-04 2E-17 0.222 10.51 10.51 1.526 4E-05 4E-05 0 0 0 0 0 0 0 3E-05 3E-05 0 0 0 0 0 0
0 0 0 0 0 0 0 0 0 0 0 0 0 0 0 0 0 0 0 0 0 0 0 0 0 0 0 0 0 0 0 0 0 0 0 0 0 0 0
Base Case
High Scenario
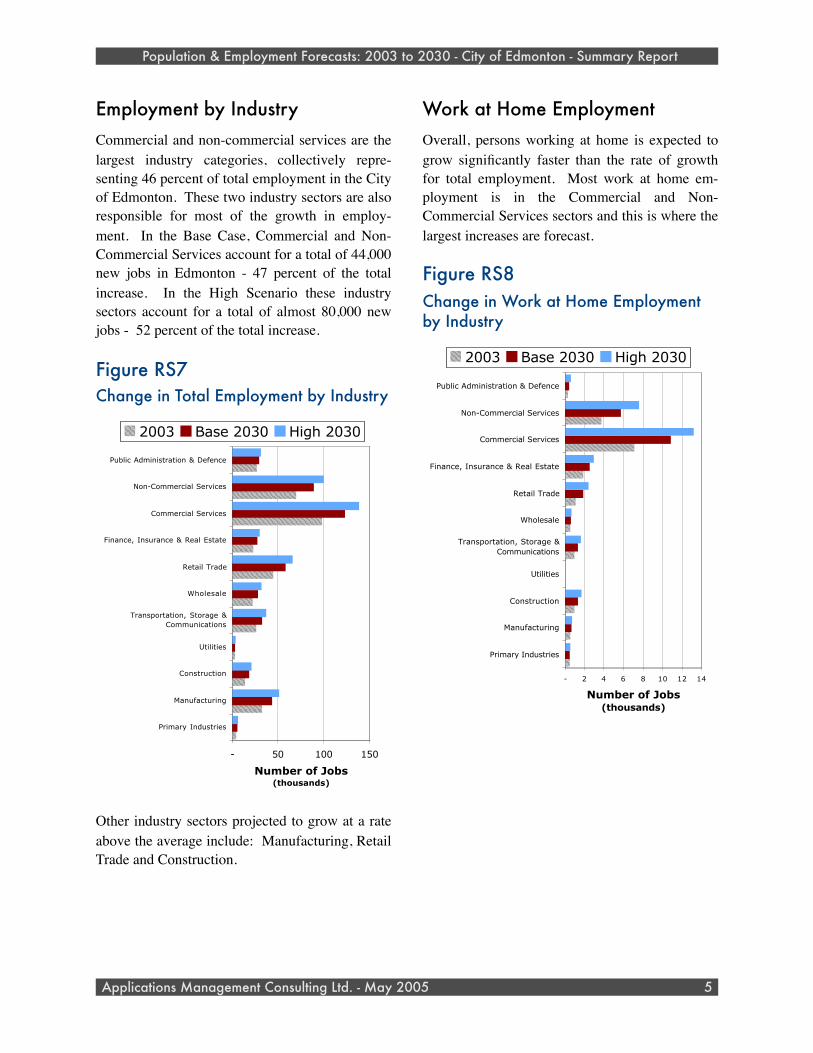
Employment by IndustryCommercial and non-commercial services are the largest industry categories, collectively repre-senting 46 percent of total employment in the City of Edmonton. These two industry sectors are also responsible for most of the growth in employ-ment. In the Base Case, Commercial and Non-Commercial Services account for a total of 44,000 new jobs in Edmonton - 47 percent of the total increase. In the High Scenario these industry sectors account for a total of almost 80,000 new jobs - 52 percent of the total increase.
Figure RS7Change in Total Employment by Industry
- 50 100 150
Primary Industries
Manufacturing
Construction
Utilities
Transportation, Storage &Communications
Wholesale
Retail Trade
Finance, Insurance & Real Estate
Commercial Services
Non-Commercial Services
Public Administration & Defence
Number of Jobs(thousands)
2003 Base 2030 High 2030
Other industry sectors projected to grow at a rate above the average include: Manufacturing, Retail Trade and Construction.
Work at Home EmploymentOverall, persons working at home is expected to grow significantly faster than the rate of growth for total employment. Most work at home em-ployment is in the Commercial and Non-Commercial Services sectors and this is where the largest increases are forecast.
Figure RS8Change in Work at Home Employment by Industry
- 2 4 6 8 10 12 14
Primary Industries
Manufacturing
Construction
Utilities
Transportation, Storage &Communications
Wholesale
Retail Trade
Finance, Insurance & Real Estate
Commercial Services
Non-Commercial Services
Public Administration & Defence
Number of Jobs(thousands)
2003 Base 2030 High 2030
Population & Employment Forecasts: 2003 to 2030 - City of Edmonton - Summary Report
Applications Management Consulting Ltd. - May 2005 5

Chapter 1
Purpose and Scope of the Study
Population and employment forecasts are an im-portant tool for social and economic planning. Growth affects the spatial distribution of people and jobs, which in turn affects the demand for services provided by all levels of government.
Edmonton City Hall
Purpose of the StudyThe purpose of the study is to develop projections of population and employment for various geo-graphic areas in the Edmonton CMA as follows:
• Aggregate population and employment projec-tions for the Edmonton CMA, City of Edmon-ton and Edmonton Region.
• Population projections by 5 year age cohorts.
• Projections of occupation (8 categories).• Projections of employment by industry (11
categories).• Projections of work at home employment.
Each of these data sets are provided for two dif-ferent geographies: Traffic Zones (557 zones in the City of Edmonton and 491 in the Edmonton Region); and larger areas called Traffic Districts (which are aggregations of Traffic Zones).
In addition, because it is expected that this analy-sis will be updated in the future, the sources of information, assumptions made in the analysis and the analytical techniques have been docu-mented (see the discussion of Summary & Tech-nical Reports below). This will facilitate the im-provement of the forecasting techniques and use-fulness of the results of any future analysis.
Uses of the Data
These population and employment forecasts have been developed to guide the City of Edmonton in the planning and provision of services and infra-structure. This unique information is valuable in any context that depends on the type, magnitude and geographic location of future development:• Planning public facilities: schools, recreation
facilities, seniors centres, etc.• Planning municipal infrastructure: roads, wa-
ter, sewer, etc.
• Defining future demand for community serv-ices.
• Financial planning related to service delivery.1
Population & Employment Forecasts: 2003 to 2030 - City of Edmonton - Summary Report
Applications Management Consulting Ltd. - May 2005 6
1 These forecasts are currently used by the City of Edmonton Drainage Branch as the basis for projecting short and long term revenues that will be available for the Strategic Sanitary Sewer Fund (SSSF).
ScenariosThe forecasts have been prepared for each of two scenarios:• Base Case: This scenario represents projec-
tions of healthy economic and population growth consistent with a conservative extrapo-lation of the growth the Edmonton CMA has experienced over the past 5 years. The Base Case is considered to be the most likely or re-alistic scenario over the long term.
• High Scenario: This scenario represents pro-jections of stronger economic and population growth, higher than what has been experienced by the Edmonton CMA over the past 5 years.
Because of the difficulties inherent in making long term projections, especially at fine area geo-graphies, such as the “neighbourhood” level, it is unlikely that either the Base Case or High Sce-nario will be an accurate predictor of activity for each detailed geography in the City. However, having two scenarios of growth provides a range within which growth in each geography and for each group of variables can reasonably be ex-pected to vary.
Base Year - 2003
The base information used in this analysis is pri-marily from the 2001 Federal Census. This data has been adjusted as necessary to meet the pa-rameters of this study. In presenting the results of this analysis, 2003 has been used as the base year, which is the starting point for the forecasts.
Summary & Technical ReportsIn addition to this Summary Report, full docu-mentation of the project is provided in a com-
panion Technical Report.2 This Technical Report includes the following:• A description of the base year information used
in the developing the forecasts, including the necessary adjustments made to this data.
• The methodology and analytical approach used to make the projections and allocations.
• The final results of the analysis, including ta-bles at the traffic zone level.
Region ReportsAs the analysis was completed for the Edmonton CMA, which includes both the City of Edmonton and the Edmonton Region, two companion re-ports3 have been prepared that discuss the results, methodologies and data used to arrive at the re-sults for the Edmonton Region.
These reports provide a similar level of detail and information as that provided in the City of Ed-monton reports.
Population & Employment Forecasts: 2003 to 2030 - City of Edmonton - Summary Report
Applications Management Consulting Ltd. - May 2005 7
2 The Technical Report includes a more detailed treatment of the topics contained in the Summary Report, as well as a number of methodological issues and results which are not covered in the Summary Report.
3 Summary and Technical Reports have been prepared for the analysis and results for the Edmonton Region.
Chapter 2
Study Area
A unique feature of the forecasts developed in this analysis is the fine level of geographic detail for which the results are provided.
The entire study area for the population and em-ployment forecasts is the Edmonton CMA. These forecasts have been prepared and presented sepa-rately for the two geographic regions:
• The City of Edmonton• Edmonton Region (includes all areas in the
CMA outside the City of Edmonton including
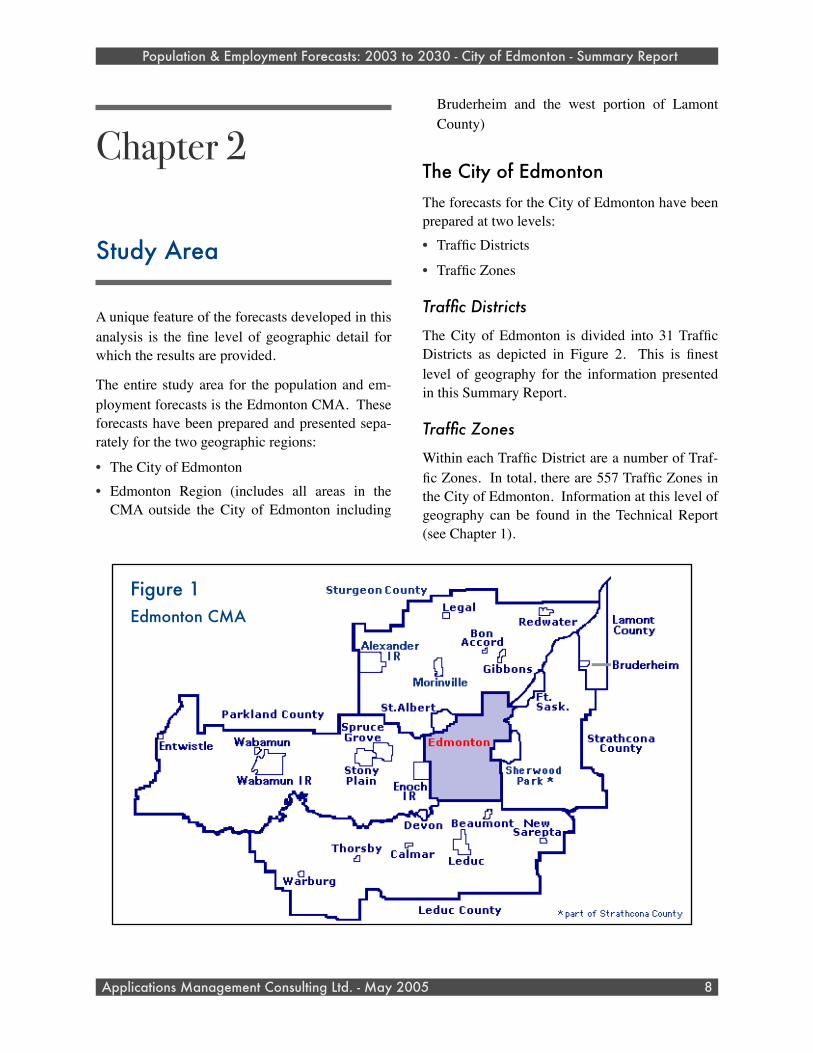
Bruderheim and the west portion of Lamont County)
The City of EdmontonThe forecasts for the City of Edmonton have been prepared at two levels:• Traffic Districts
• Traffic Zones
Traffic Districts
The City of Edmonton is divided into 31 Traffic Districts as depicted in Figure 2. This is finest level of geography for the information presented in this Summary Report.
Traffic Zones
Within each Traffic District are a number of Traf-fic Zones. In total, there are 557 Traffic Zones in the City of Edmonton. Information at this level of geography can be found in the Technical Report (see Chapter 1).
Population & Employment Forecasts: 2003 to 2030 - City of Edmonton - Summary Report
Applications Management Consulting Ltd. - May 2005 8
Figure 1Edmonton CMA
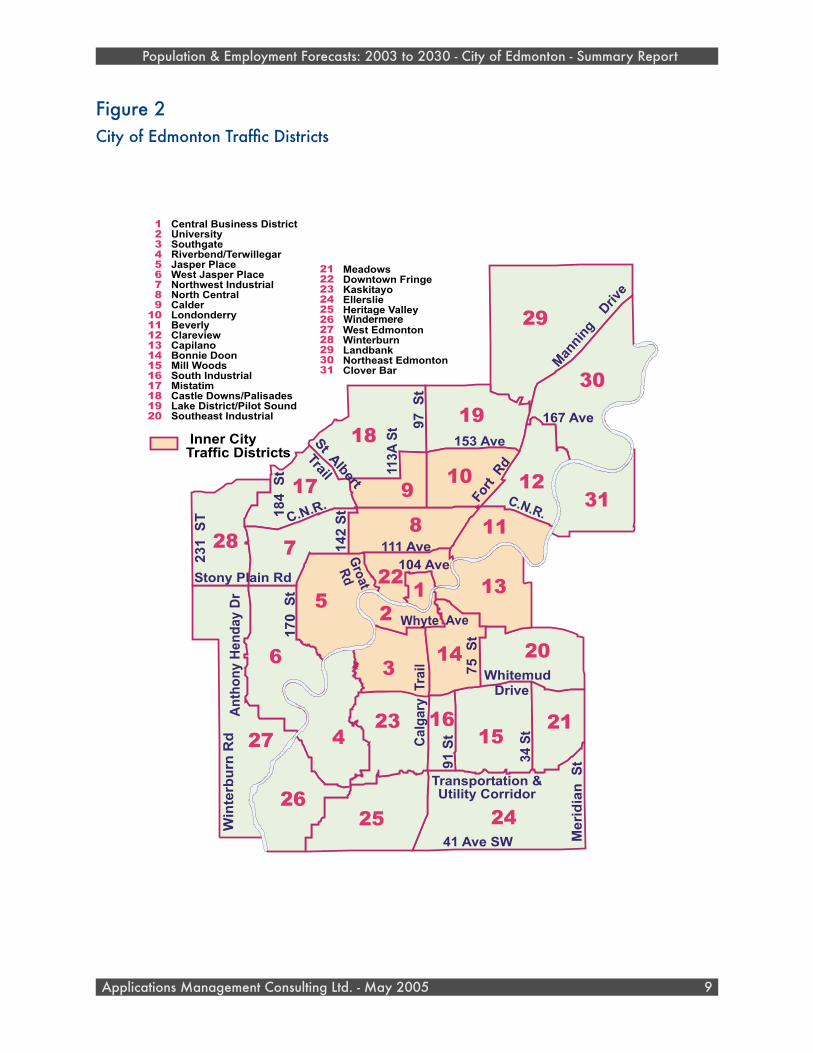
Figure 2City of Edmonton Traffic Districts
Population & Employment Forecasts: 2003 to 2030 - City of Edmonton - Summary Report
Applications Management Consulting Ltd. - May 2005 9
!"#$$%&'(%)*"%&*)!"#$$%&'(%)*"%&*)!"#$%&'()
!*!!!"!#!$!%!&!'!(!)"*
!"#$%&'()*+,#"++(-,+$%,.$/#,0"%+,$123*$45&$"6,0"%7"#89:"%;,''"5&%<&+="%(>'&."?"+$(<&+="%(>'&."@3%$4;"+$(A#8*+$%,&'@3%$4(!"#$%&'!&'8"%B3#83#8"%%1)"0"%'1!'&%"0,";!&=,')3##,"(-33#C,''(?338+23*$4(A#8*+$%,&'C,+$&$,D!&+$'"(-3;#+9>&',+&8"+B&E"(-,+$%,.$9>,'3$(23*#823*$4"&+$(A#8*+$%,&'
"!"""#"$"%"&"'"(")#*#!
C"&83;+-3;#$3;#(F%,#5"G&+E,$&13H''"%+',"I"%,$&5"(J&''"1(H&+$I"%,$&5"(J&''"1(?"+$?"+$(H8D3#$3#?,#$"%7*%#BW&#E@3%$4"&+$(H8D3#$3#!'30"%()&%
(A##"%(!,$1:%&KK,.(-,+$%,.$+
")
#*
!)
!"#!
!*
!!
!(
)!'
("( '
&
"' $"#
#
% !""
!$ "*
"!#
!&!%
"!
"$"&
"%
!"#$%
&'()*)+,##$%
-./%'##01'
23##$%
45(%##6*
789868
":;#$%
"2<##$%
;="##$> "?
:##$%
!2##$%
&+,,),@####A()1'
$%##0BC'(%
"D2#01'
"3=#01'
""=0
#$%
"""#01'"<:#01'
=:#$%
$%5,/#EB+),#6*
789868
>(+,FG5(%+%)5,#HI%)B)%/#75(()*5(
7+B@+(/##>(+)B
>(+)B
:"#01'#$-
-),%'(CJ(,#6*
-.)%'KJ*A()1'
0,%.5,/#L',*+/#A(
M(5+%
##6*
Windermere
Chapter 3
Economic Overview
The Edmonton CMA operates as an integrated economic unit. As a result, any analysis of the location and magnitude of growth must take into account the broader economic forces that will have a significant impact on the economy of the Edmonton region.
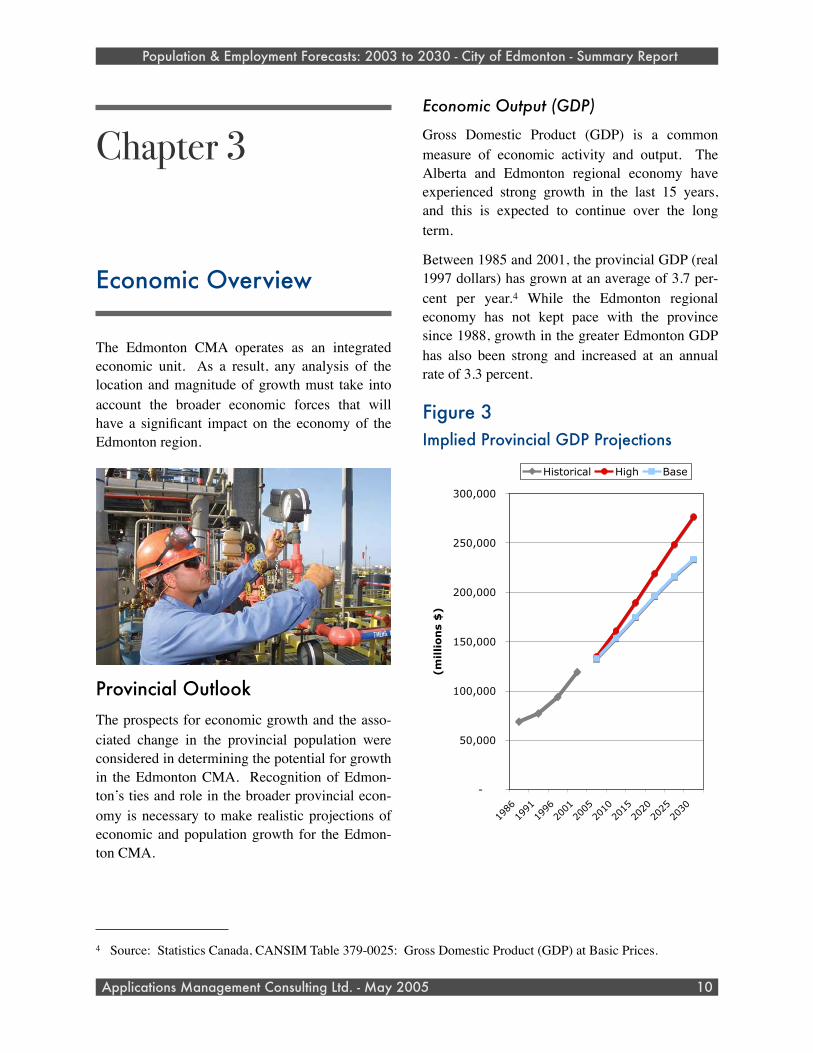
Provincial OutlookThe prospects for economic growth and the asso-ciated change in the provincial population were considered in determining the potential for growth in the Edmonton CMA. Recognition of Edmon-ton’s ties and role in the broader provincial econ-omy is necessary to make realistic projections of economic and population growth for the Edmon-ton CMA.
Economic Output (GDP)
Gross Domestic Product (GDP) is a common measure of economic activity and output. The Alberta and Edmonton regional economy have experienced strong growth in the last 15 years, and this is expected to continue over the long term.
Between 1985 and 2001, the provincial GDP (real 1997 dollars) has grown at an average of 3.7 per-cent per year.4 While the Edmonton regional economy has not kept pace with the province since 1988, growth in the greater Edmonton GDP has also been strong and increased at an annual rate of 3.3 percent.
Figure 3Implied Provincial GDP Projections
-
50,000
100,000
150,000
200,000
250,000
300,000
1986199119962001200520102015202020252030
(millio
ns
$)
Historical High Base
Population & Employment Forecasts: 2003 to 2030 - City of Edmonton - Summary Report
Applications Management Consulting Ltd. - May 2005 10
4 Source: Statistics Canada, CANSIM Table 379-0025: Gross Domestic Product (GDP) at Basic Prices.
The implied rate of growth for the Alberta econ-omy in the Base Case is 2.1 percent over the fore-cast period to the end of 2030. This represents a dampening of the recent historic rate of growth for the province, reflecting the likelihood of some downward cycles in Alberta’s economic growth over the forecast period.5
The High Scenario is more optimistic about growth and projects an increase in the average annual rate of real GDP growth of 2.5 percent. This rate is also lower than the recent historical rate of growth reflecting the long time frame for the forecast.
Regional Context
The Edmonton regional economy is strongly in-fluenced by economic activity and growth that occurs elsewhere in the province, in particular northern Alberta.6 While the economy has diver-sified, historic and future growth is expected to be largely tied to the fortunes of the oil and gas sector.7
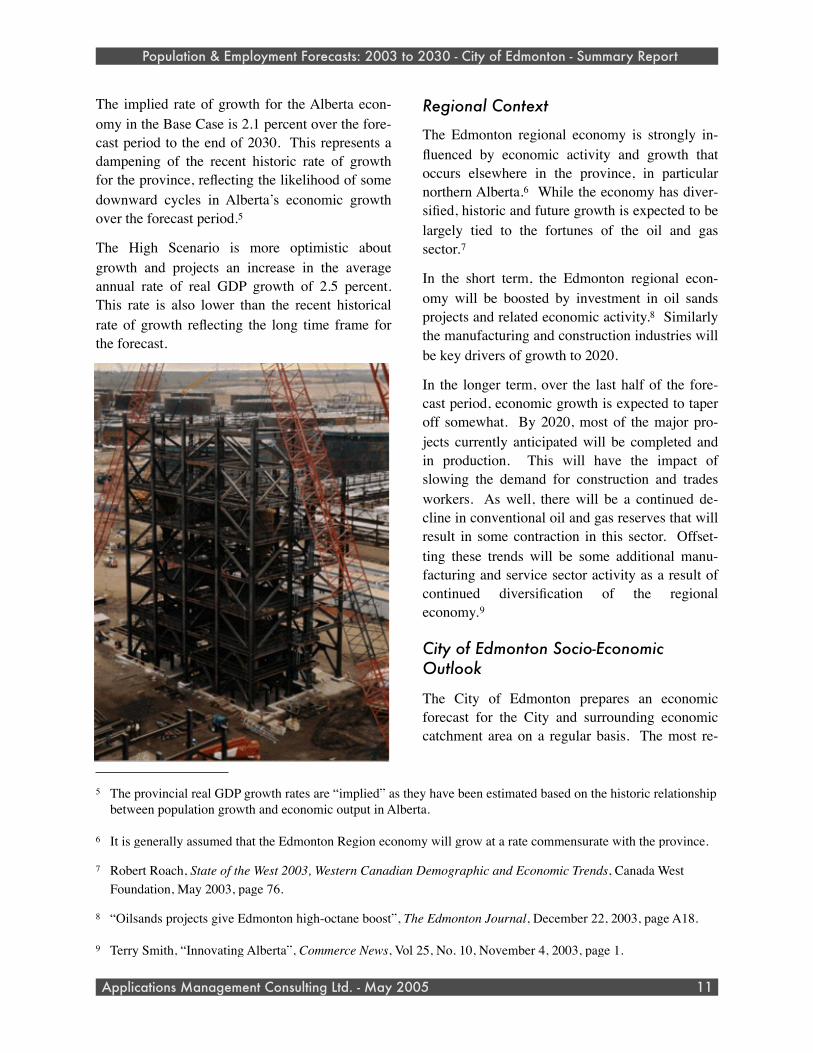
In the short term, the Edmonton regional econ-omy will be boosted by investment in oil sands projects and related economic activity.8 Similarly the manufacturing and construction industries will be key drivers of growth to 2020.
In the longer term, over the last half of the fore-cast period, economic growth is expected to taper off somewhat. By 2020, most of the major pro-jects currently anticipated will be completed and in production. This will have the impact of slowing the demand for construction and trades workers. As well, there will be a continued de-cline in conventional oil and gas reserves that will result in some contraction in this sector. Offset-ting these trends will be some additional manu-facturing and service sector activity as a result of continued diversification of the regional economy.9
City of Edmonton Socio-Economic Outlook
The City of Edmonton prepares an economic forecast for the City and surrounding economic catchment area on a regular basis. The most re-
Population & Employment Forecasts: 2003 to 2030 - City of Edmonton - Summary Report
Applications Management Consulting Ltd. - May 2005 11
5 The provincial real GDP growth rates are “implied” as they have been estimated based on the historic relationship between population growth and economic output in Alberta.
6 It is generally assumed that the Edmonton Region economy will grow at a rate commensurate with the province.
7 Robert Roach, State of the West 2003, Western Canadian Demographic and Economic Trends, Canada West Foundation, May 2003, page 76.
8 “Oilsands projects give Edmonton high-octane boost”, The Edmonton Journal, December 22, 2003, page A18.
9 Terry Smith, “Innovating Alberta”, Commerce News, Vol 25, No. 10, November 4, 2003, page 1.
cent forecast available at the time of preparing the analysis used in this study was 2003-2008 and has been used as the basis for the projections in both the Base Case and High Scenario to 2008.
Economic Growth and MigrationThere is a strong relationship between the eco-nomic growth of a region and population growth. Economic growth can only be facilitated by a sufficient supply of qualified labour to meet the needs of business growth and expansion. In a fast growing economy, this is largely accomplished through in-migration of workers and their fami-lies.
In the development of the population and em-ployment projections for the Edmonton CMA, explicit consideration has been given to the fol-lowing factors:• The provincial population growth required to
meet the economic output targets.
• The required net migration necessary to provide a sufficient supply of labour to meet the needs of this growth.
• The Edmonton CMA’s share of provincial population captured as a result of expected economic activity in the region.
• Explicit assumptions regarding the net migra-tion to the Edmonton CMA to facilitate the anticipated economic growth of the region.
For the period after 2008, the Base Case popula-tion projections incorporate an average annual net migration of people to the Edmonton CMA of 7,900. In the High Scenario, annual net migration
to the Edmonton CMA is assumed to be 14,280 after 2008.10
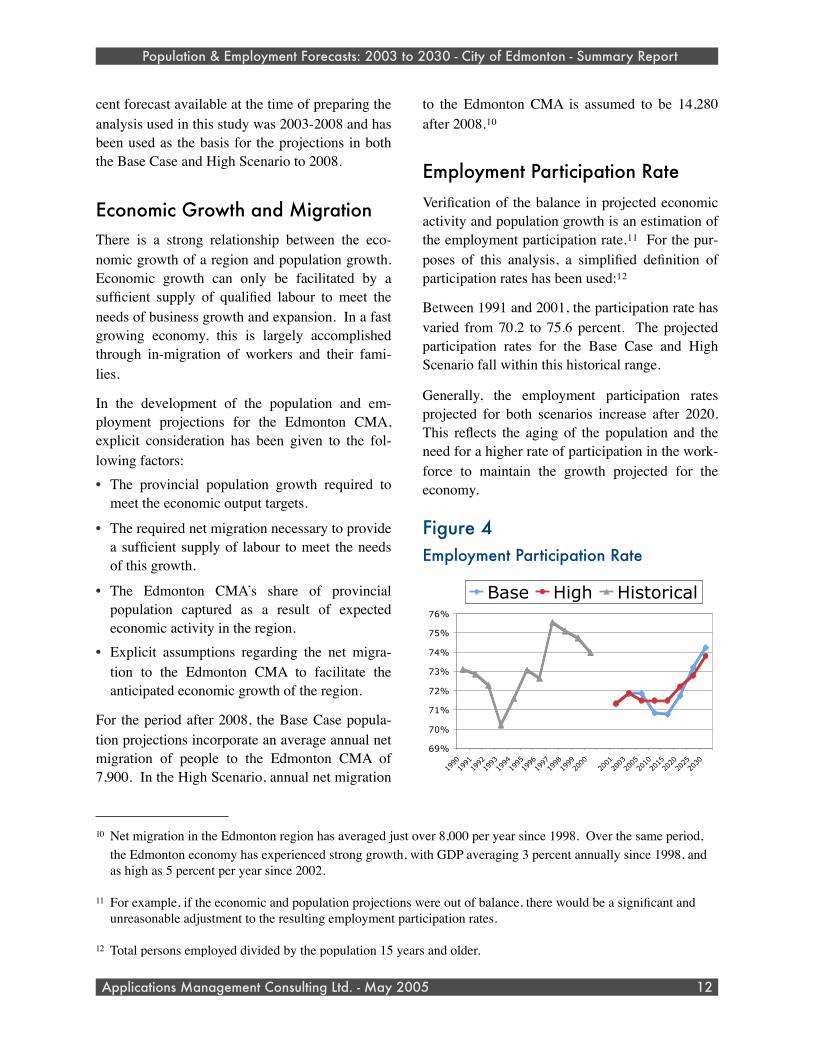
Employment Participation RateVerification of the balance in projected economic activity and population growth is an estimation of the employment participation rate.11 For the pur-poses of this analysis, a simplified definition of participation rates has been used:12
Between 1991 and 2001, the participation rate has varied from 70.2 to 75.6 percent. The projected participation rates for the Base Case and High Scenario fall within this historical range.
Generally, the employment participation rates projected for both scenarios increase after 2020. This reflects the aging of the population and the need for a higher rate of participation in the work-force to maintain the growth projected for the economy.
Figure 4Employment Participation Rate
69%
70%
71%
72%
73%
74%
75%
76%
19901991199219931994199519961997199819992000
20012003200520102015202020252030
Base High Historical
Population & Employment Forecasts: 2003 to 2030 - City of Edmonton - Summary Report
Applications Management Consulting Ltd. - May 2005 12
10 Net migration in the Edmonton region has averaged just over 8,000 per year since 1998. Over the same period, the Edmonton economy has experienced strong growth, with GDP averaging 3 percent annually since 1998, and as high as 5 percent per year since 2002.
11 For example, if the economic and population projections were out of balance, there would be a significant and unreasonable adjustment to the resulting employment participation rates.
12 Total persons employed divided by the population 15 years and older.
Chapter 4
Population Forecasts & Allocation
Population projections have been prepared for the Edmonton Census Metropolitan Area (CMA), City of Edmonton and the rest of the Edmonton Region that comprises the CMA. These aggregate forecasts have been prepared to the year 2030 and disaggregated by geography, age cohort and oc-cupation.
Population ForecastsThe population forecasts presented below are consistent with the economic context presented in the previous chapter. The process for developing these forecasts has been a “top down” analysis, looking first at the population growth for the Ed-monton CMA that would be consistent with the economic growth anticipated for the region. This total growth has subsequently been allocated to
the City of Edmonton and Edmonton Region, and then geographically within the City and the Re-gion.
Edmonton CMA
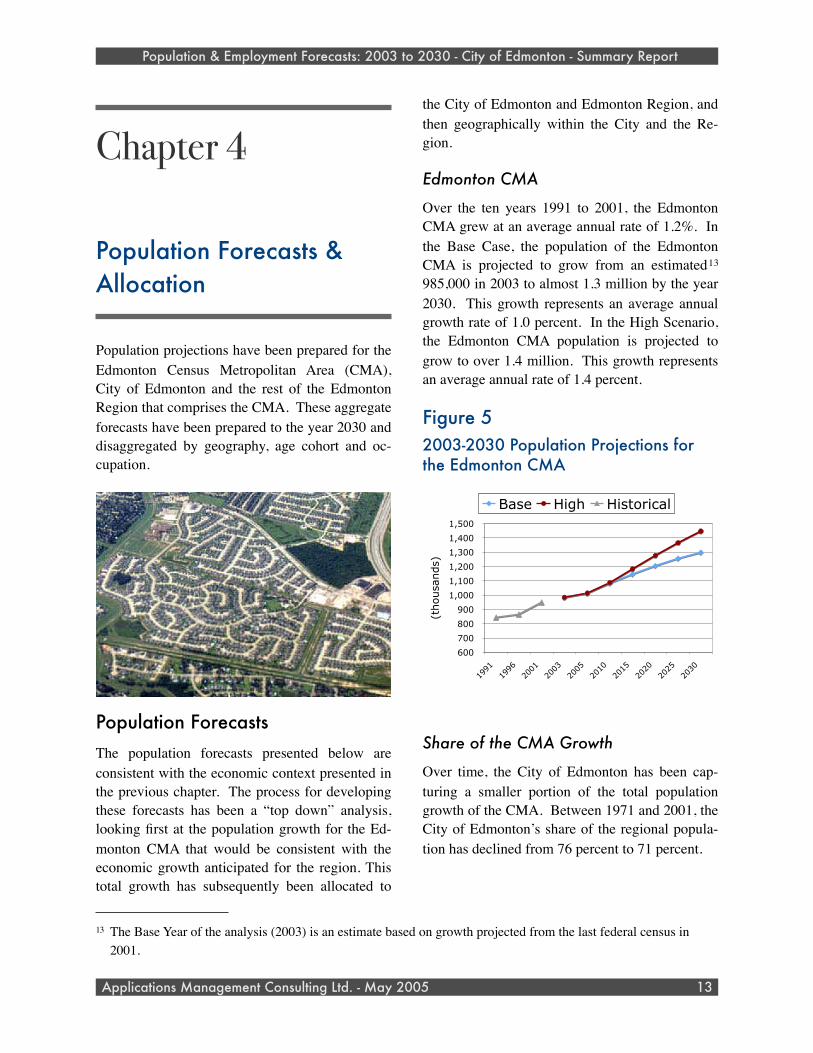
Over the ten years 1991 to 2001, the Edmonton CMA grew at an average annual rate of 1.2%. In the Base Case, the population of the Edmonton CMA is projected to grow from an estimated13 985,000 in 2003 to almost 1.3 million by the year 2030. This growth represents an average annual growth rate of 1.0 percent. In the High Scenario, the Edmonton CMA population is projected to grow to over 1.4 million. This growth represents an average annual rate of 1.4 percent.
Figure 52003-2030 Population Projections for the Edmonton CMA
600
700
800
900
1,000
1,100
1,200
1,300
1,400
1,500
1991
1996
2001
2003
2005
2010
2015
2020
2025
2030
(thousands)
Base High Historical
Share of the CMA Growth
Over time, the City of Edmonton has been cap-turing a smaller portion of the total population growth of the CMA. Between 1971 and 2001, the City of Edmonton’s share of the regional popula-tion has declined from 76 percent to 71 percent.
Population & Employment Forecasts: 2003 to 2030 - City of Edmonton - Summary Report
Applications Management Consulting Ltd. - May 2005 13
13 The Base Year of the analysis (2003) is an estimate based on growth projected from the last federal census in 2001.
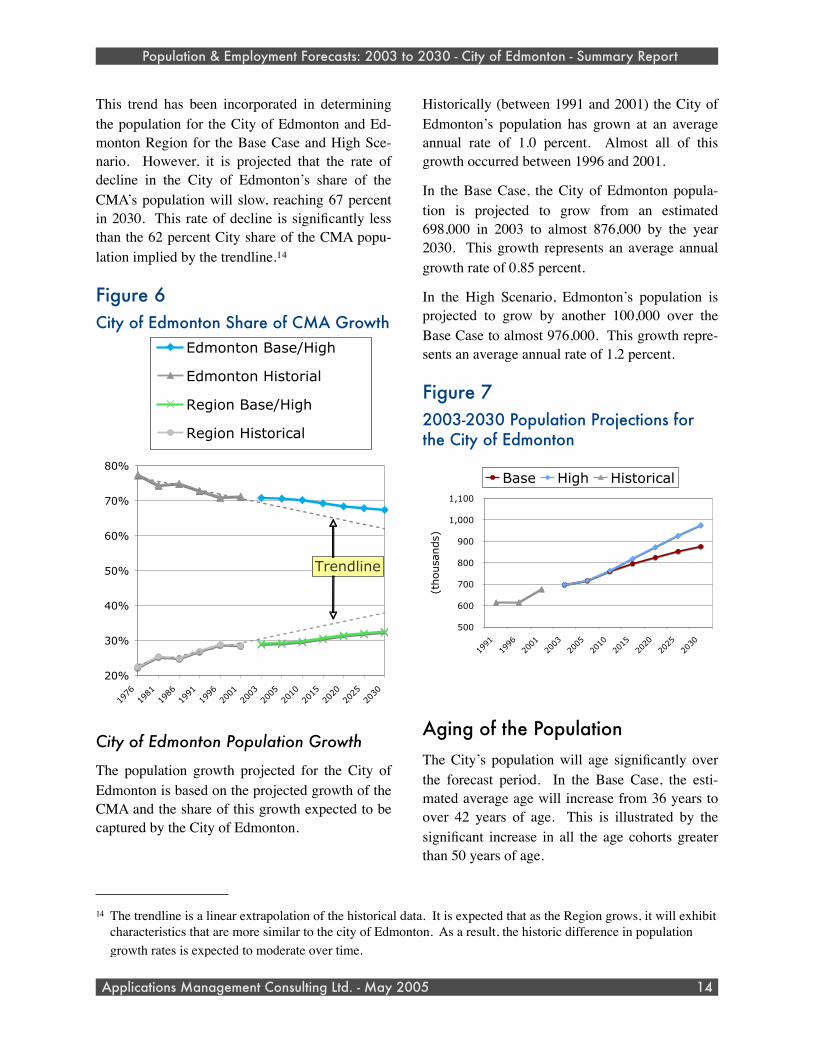
This trend has been incorporated in determining the population for the City of Edmonton and Ed-monton Region for the Base Case and High Sce-nario. However, it is projected that the rate of decline in the City of Edmonton’s share of the CMA’s population will slow, reaching 67 percent in 2030. This rate of decline is significantly less than the 62 percent City share of the CMA popu-lation implied by the trendline.14
Figure 6City of Edmonton Share of CMA Growth
20%
30%
40%
50%
60%
70%
80%
1976
1981
1986
1991
1996
2001
2003
2005
2010
2015
2020
2025
2030
Edmonton Base/High
Edmonton Historial
Region Base/High
Region Historical
Linear (EdmontonHistorial)Linear (Region Historical)
Trendline
City of Edmonton Population Growth
The population growth projected for the City of Edmonton is based on the projected growth of the CMA and the share of this growth expected to be captured by the City of Edmonton.
Historically (between 1991 and 2001) the City of Edmonton’s population has grown at an average annual rate of 1.0 percent. Almost all of this growth occurred between 1996 and 2001.
In the Base Case, the City of Edmonton popula-tion is projected to grow from an estimated 698,000 in 2003 to almost 876,000 by the year 2030. This growth represents an average annual growth rate of 0.85 percent.
In the High Scenario, Edmonton’s population is projected to grow by another 100,000 over the Base Case to almost 976,000. This growth repre-sents an average annual rate of 1.2 percent.
Figure 72003-2030 Population Projections for the City of Edmonton
500
600
700
800
900
1,000
1,100
1991
1996
2001
2003
2005
2010
2015
2020
2025
2030
(thousands)
Base High Historical
Aging of the PopulationThe City’s population will age significantly over the forecast period. In the Base Case, the esti-mated average age will increase from 36 years to over 42 years of age. This is illustrated by the significant increase in all the age cohorts greater than 50 years of age.
Population & Employment Forecasts: 2003 to 2030 - City of Edmonton - Summary Report
Applications Management Consulting Ltd. - May 2005 14
14 The trendline is a linear extrapolation of the historical data. It is expected that as the Region grows, it will exhibit characteristics that are more similar to the city of Edmonton. As a result, the historic difference in population growth rates is expected to moderate over time.
Base Case
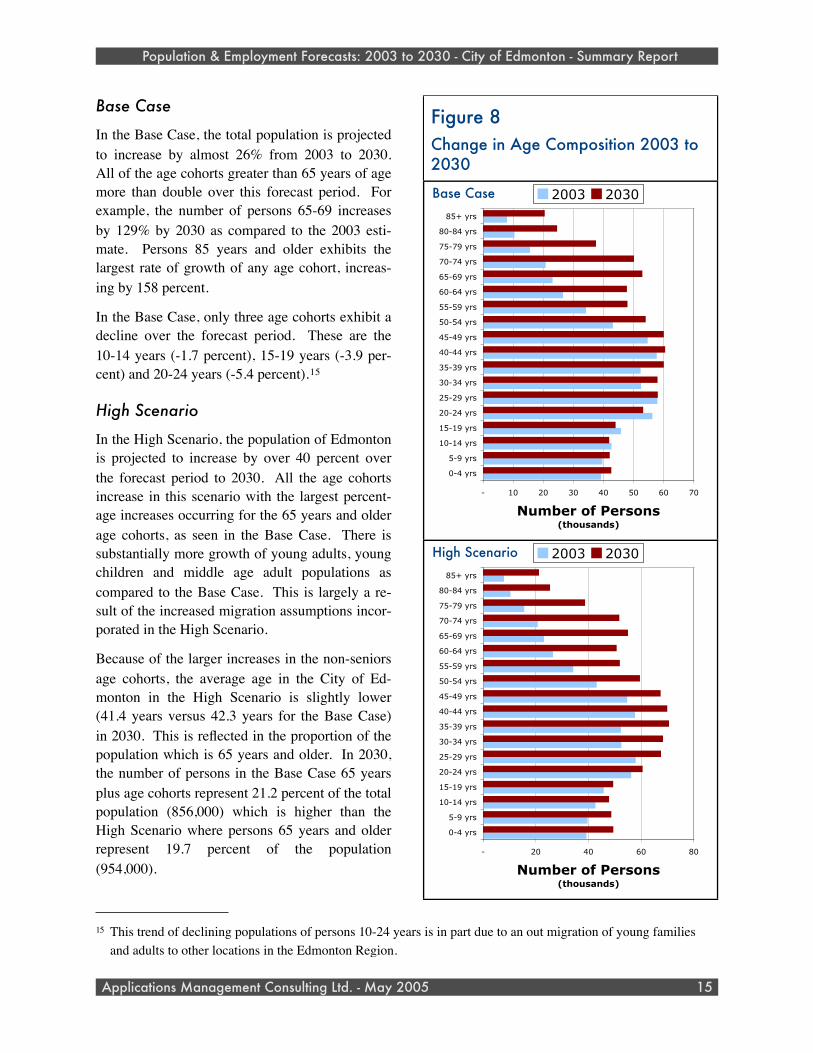
In the Base Case, the total population is projected to increase by almost 26% from 2003 to 2030. All of the age cohorts greater than 65 years of age more than double over this forecast period. For example, the number of persons 65-69 increases by 129% by 2030 as compared to the 2003 esti-mate. Persons 85 years and older exhibits the largest rate of growth of any age cohort, increas-ing by 158 percent.
In the Base Case, only three age cohorts exhibit a decline over the forecast period. These are the 10-14 years (-1.7 percent), 15-19 years (-3.9 per-cent) and 20-24 years (-5.4 percent).15
High Scenario
In the High Scenario, the population of Edmonton is projected to increase by over 40 percent over the forecast period to 2030. All the age cohorts increase in this scenario with the largest percent-age increases occurring for the 65 years and older age cohorts, as seen in the Base Case. There is substantially more growth of young adults, young children and middle age adult populations as compared to the Base Case. This is largely a re-sult of the increased migration assumptions incor-porated in the High Scenario.
Because of the larger increases in the non-seniors age cohorts, the average age in the City of Ed-monton in the High Scenario is slightly lower (41.4 years versus 42.3 years for the Base Case) in 2030. This is reflected in the proportion of the population which is 65 years and older. In 2030, the number of persons in the Base Case 65 years plus age cohorts represent 21.2 percent of the total population (856,000) which is higher than the High Scenario where persons 65 years and older represent 19.7 percent of the population (954,000).
Population & Employment Forecasts: 2003 to 2030 - City of Edmonton - Summary Report
Applications Management Consulting Ltd. - May 2005 15
15 This trend of declining populations of persons 10-24 years is in part due to an out migration of young families and adults to other locations in the Edmonton Region.
Figure 8Change in Age Composition 2003 to 2030
- 10 20 30 40 50 60 70
0-4 yrs
5-9 yrs
10-14 yrs
15-19 yrs
20-24 yrs
25-29 yrs
30-34 yrs
35-39 yrs
40-44 yrs
45-49 yrs
50-54 yrs
55-59 yrs
60-64 yrs
65-69 yrs
70-74 yrs
75-79 yrs
80-84 yrs
85+ yrs
Number of Persons(thousands)
2003 2030
- 20 40 60 80
0-4 yrs
5-9 yrs
10-14 yrs
15-19 yrs
20-24 yrs
25-29 yrs
30-34 yrs
35-39 yrs
40-44 yrs
45-49 yrs
50-54 yrs
55-59 yrs
60-64 yrs
65-69 yrs
70-74 yrs
75-79 yrs
80-84 yrs
85+ yrs
Number of Persons(thousands)
2003 2030High Scenario
Base Case
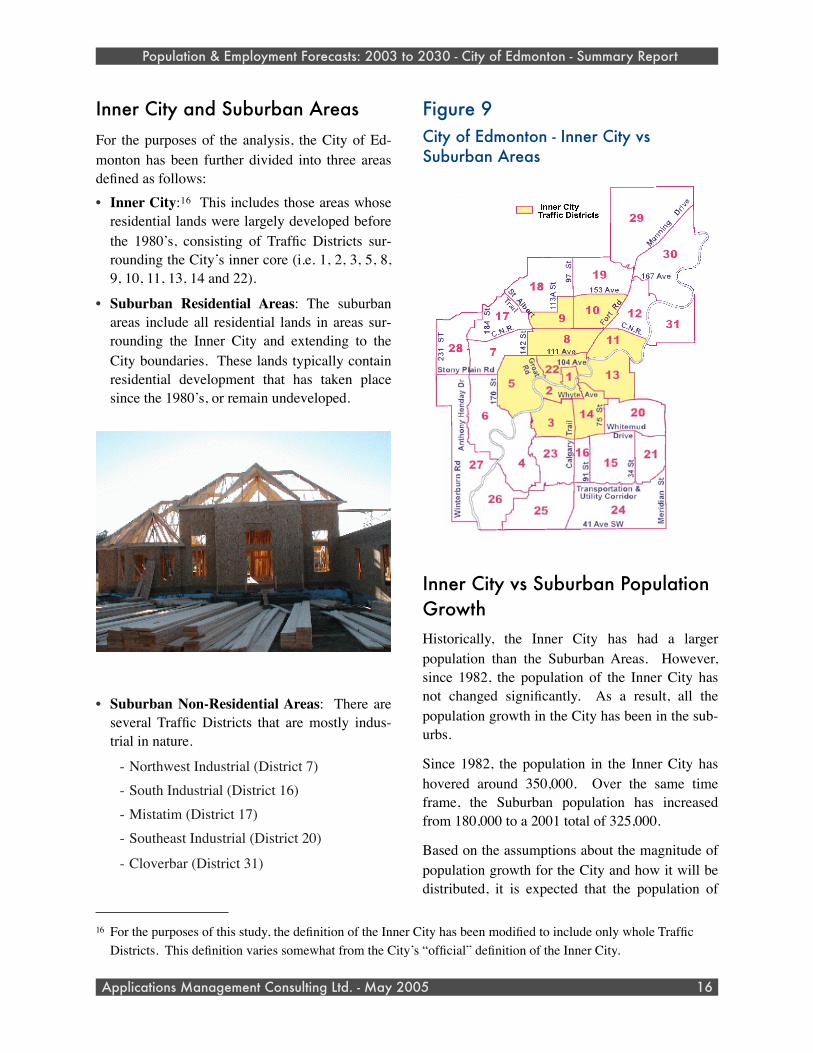
Inner City and Suburban AreasFor the purposes of the analysis, the City of Ed-monton has been further divided into three areas defined as follows:• Inner City:16 This includes those areas whose
residential lands were largely developed before the 1980’s, consisting of Traffic Districts sur-rounding the City’s inner core (i.e. 1, 2, 3, 5, 8, 9, 10, 11, 13, 14 and 22).
• Suburban Residential Areas: The suburban areas include all residential lands in areas sur-rounding the Inner City and extending to the City boundaries. These lands typically contain residential development that has taken place since the 1980’s, or remain undeveloped.
• Suburban Non-Residential Areas: There are several Traffic Districts that are mostly indus-trial in nature.
- Northwest Industrial (District 7)- South Industrial (District 16)- Mistatim (District 17)- Southeast Industrial (District 20)
- Cloverbar (District 31)
Figure 9City of Edmonton - Inner City vs Suburban Areas
Inner City vs Suburban Population GrowthHistorically, the Inner City has had a larger population than the Suburban Areas. However, since 1982, the population of the Inner City has not changed significantly. As a result, all the population growth in the City has been in the sub-urbs.
Since 1982, the population in the Inner City has hovered around 350,000. Over the same time frame, the Suburban population has increased from 180,000 to a 2001 total of 325,000.
Based on the assumptions about the magnitude of population growth for the City and how it will be distributed, it is expected that the population of
Population & Employment Forecasts: 2003 to 2030 - City of Edmonton - Summary Report
Applications Management Consulting Ltd. - May 2005 16
16 For the purposes of this study, the definition of the Inner City has been modified to include only whole Traffic Districts. This definition varies somewhat from the City’s “official” definition of the Inner City.
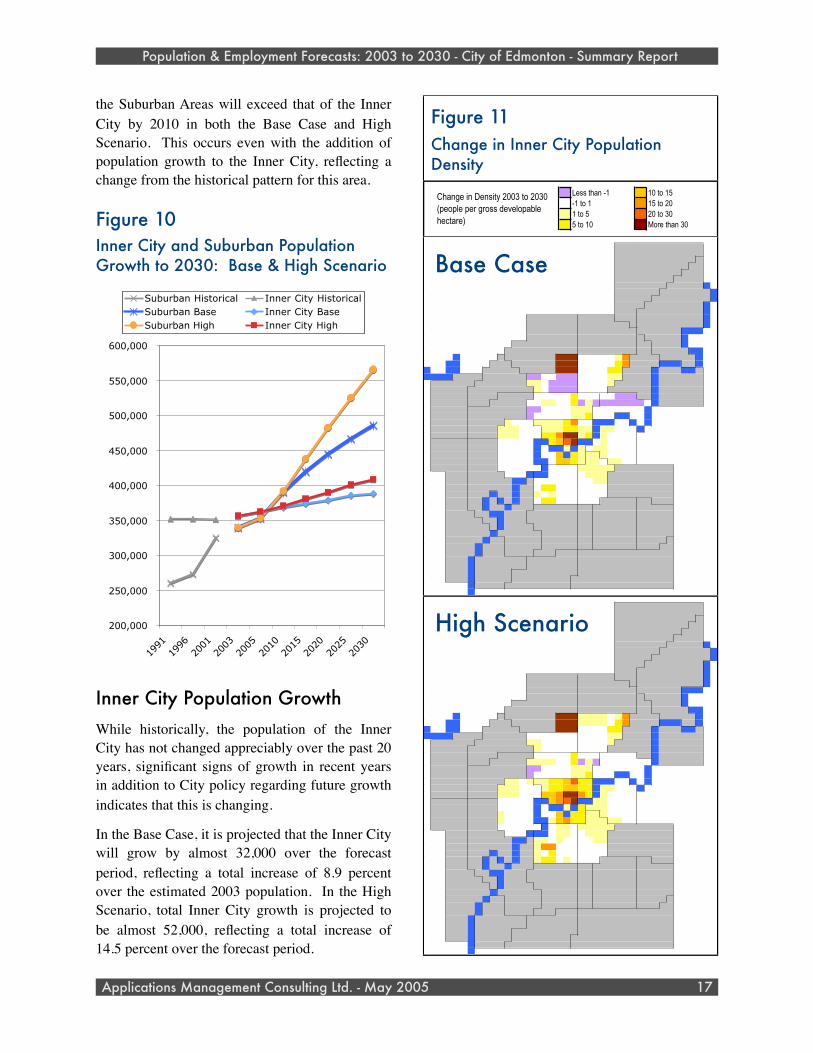
the Suburban Areas will exceed that of the Inner City by 2010 in both the Base Case and High Scenario. This occurs even with the addition of population growth to the Inner City, reflecting a change from the historical pattern for this area.
Figure 10Inner City and Suburban Population Growth to 2030: Base & High Scenario
200,000
250,000
300,000
350,000
400,000
450,000
500,000
550,000
600,000
1991
1996
2001
2003
2005
2010
2015
2020
2025
2030
Suburban Historical Inner City HistoricalSuburban Base Inner City BaseSuburban High Inner City High
Inner City Population GrowthWhile historically, the population of the Inner City has not changed appreciably over the past 20 years, significant signs of growth in recent years in addition to City policy regarding future growth indicates that this is changing.
In the Base Case, it is projected that the Inner City will grow by almost 32,000 over the forecast period, reflecting a total increase of 8.9 percent over the estimated 2003 population. In the High Scenario, total Inner City growth is projected to be almost 52,000, reflecting a total increase of 14.5 percent over the forecast period.
Population & Employment Forecasts: 2003 to 2030 - City of Edmonton - Summary Report
Applications Management Consulting Ltd. - May 2005 17
Figure 11Change in Inner City Population Density
Less than -1 10 to 15-1 to 1 15 to 201 to 5 20 to 305 to 10 More than 30
Change in Density 2003 to 2030 (people per gross developable hectare)
0 0 0 0 0 0 0 0 0 0 0 0 0 0 0 0 0 0 0 0 0 0 0 0 0 0 0 0 0 0 0 0 0 0 0 0 0 0 0 0
0 0 0 0 0 0 0 0 0 0 0 0 0 0 0 0 0 0 0 0 0 0 0 0 0 0 -0.01 -0.01 -0.01 -0 -0 -0.02 -0.02 0 0 -0.02 -0.02 -0.02 0 0
0 0 0 0 0 0 0 0 0 0 0 0 0 0 0 0 0 0 0 0 0 0 0 0 0 0 -0.01 -0.02 -0.02 -0.02 -0.02 -0.02 -0.02 -0 -0 -0.04 -0.04 -0.04 0 0
0 0 0 0 0 0 0 0 0 0 0 0 0 0 0 0 0 0 0 0 0 0 0 0 0 0 0 -0.01 -0.01 -0.04 -0.04 -0.02 -0.02 -0.01 -0.01 -0.01 -0.01 -0.01 0 0
0 0 0 0 0 0 0 0 0 0 0 0 0 0 0 0 0 0 0 0 0 0 0 0 0 0 0 -0.02 -0.02 -0.01 -0.01 -0.01 -0.01 -0.02 -0.02 -0.01 -0.01 -0.01 0 0
0 0 0 0 0 0 0 0 0 0 0 0 0 0 0 0 0 0 0 0 0 0 0 0 0 0 0 0.003 0.003 -0 -0 0.001 0.001 -0 -0 -0.01 -0.01 -0.01 0 0
0 0 0 0 0 0 0 0 0 0 0 0 0 0 0 0 0 0 0 0 0 0 0 0 0 0 0 0.002 0.002 -0 -0 -0.01 -0.01 0.75 -0.02 -0 -0 -0 0 0
0 0 0 0 0 0 0 0 0 0 0 0 0 0 0 0 0 0 0 0 0 0 0 0 0 0 -0 -0.02 -0.02 -0.03 -0.03 6E-04 6E-04 -0.02 -0.01 -0 -0 -0 0
0 0 0 0 0 0 0 0 0 0 0 0 0 0 0 0 0 0 0 0 0 0 0 0 0 0 -0 -0 -0 -0.06 -0.06 6E-04 -0.04 -0.02 -0.01 -0.06 -0.06 -0.02 -0.02
0 0 0 0 0 0 0 0 0 0 0 0 0 0 0 0 0 0 0 0 0 0 0 0 0 0 -0 -0 -0 -0.06 -0.06 -0.04 -0.04 -0.01 -0.01 -0.06 -0.06 -0.02 -0.02
0 0 0 0 0 0 0 0 0 0 0 0 0 0 0 0 0 0 0 0 0 0 0 0 0 0 -0.02 -0.02 -0.01 -0.01 0 -0.01 -0.01 -0.05 -0.01 -0.01 -0.02 -0.02 0
0 0 0 0 0 0 0 0 0 0 0 0 0 0 0 0 0 0 0 0 0 0 0 0 0 0 -0.02 -0.02 -0.01 0 0 -0.01 -0.01 -0.05 -0.01 -0.02 -0.02 -0.02 0
0 0 0 0 0 0 0 0 0 0 0 0 0 0 7E-04 7E-04 0.098 0.098 10.96 11.64 11.64 0.864 18.35 16.62 18.9 4.473 -0.02 -0.01 -0.01 0 0 -0.01 0.002 -0.05 -0.02 -0.02 -0.02 -0.02 0
0 0 0 0 0 0 0 0 0 0 0 0 0 0 7E-04 7E-04 0.098 18.04 10.96 11.64 11.64 0.864 18.35 16.62 18.9 4.473 4.473 4.473 -0.01 0 0 0.002 0.002 -0.05 -0.02 -0.02 -0.02 -0.02 0
0 0 0 0 0 0 0 0 0 0 0 0 0 0 7E-04 24.76 11.37 18.04 10.96 11.64 11.64 0.864 18.35 16.62 18.9 4.473 4.473 17.23 17.23 0 2.424 -0.02 -0.05 -0.05 -0.02 0 0
0 0 0 0 0 0 0 0 0 0 0 0 0 0 24.76 24.76 11.37 18.04 -4.98 -4.98 -4.98 0.864 18.35 27.54 31.25 4.473 4.473 17.23 17.23 -0.05 0 -0.02 1.05 -0.01 -0.02 0 0 0 0
0 0 0 0 0 0 0 0 0 0 0 0 -0 -0 15.33 12.44 -3.72 -3.72 -5.39 -5.39 -5.39 14.76 0.479 5.795 9.949 11.17 17.74 11.15 11.15 -0.05 -0.05 -0 -0 -0.01 -0.01 0 0 0 0
0 0 0 0 0 0 0 0 0 0 0 -0 -0 -0 15.33 12.44 -3.72 -3.72 -1.73 -1.73 -1.73 14.76 0.479 5.795 9.949 11.17 17.74 11.15 11.15 -0.05 0 -0 -0 -0.01 -0.01 -0.01 0 0
0 0 0 0 0 0 0 0 0 -0 -0 -0.01 -0.01 53.64 1.895 8.037 -5.35 46.83 46.83 46.83 0.467 0.467 0.636 0.636 -0.11 3.984 15.28 0 -0.86 2.194 2.194 -0 -0.01 -0.01 -0.01 -0.01 0 0
0 0 0 0 0 0 0 -0 -0 -0.02 -0.01 -0.01 15.92 15.92 8.037 -5.32 35.05 35.05 35.05 0.467 0.467 0.636 0.636 -0.11 5.249 15.28 0 -0.86 2.194 2.194 -0.01 -0.01 0 0
0 0 0 0 0 -0 -0 -0 -0.02 -0.02 -0.01 15.92 0 0 -5.32 35.05 35.05 35.05 -0.39 -0.39 -0.42 0 5.249 5.249 4.26 -1.26 -1.12 -1.12 -0.01 -0.01 0 0 0 0
3.677 3.677 7.144 7.144 -0 -0 -0 -0.01 -0.01 0 -1.46 -1.46 -0.98 -0.98 -1.52 -1.52 -1.52 0 -0.55 -0.48 -0.48 3.723 3.723 4.26 -1.43 -1.43 -2.35 -0.01 -0.01 0 0 0 0 0 0
0 -0 0 3.677 3.677 3.677 7.144 -0 -0 -0 -0 -0.01 -0.01 0 2.804 2.804 0.141 -2.63 -2.63 -1.82 -1.82 -0.55 -0.55 -0.48 -0.48 3.723 0 -1.16 -1.43 -1.43 -2.35 -0.01 -0.01 0 0 0 0 0 0
0 -0 0 3.396 3.396 3.396 -0.08 -0.08 -0.08 0 0 -0.01 -0.01 0 0 2.804 0.141 -2.63 -2.63 -1.82 -1.82 -0.12 -0.12 -0.09 -0.09 -0.08 -0.08 -0.92 -0.92 -1.65 3.761 -0.01 -0.01 0 0 0 0 0 0
0 0.012 0.012 3.396 3.396 3.396 -0.08 -0.08 -0.08 0 0 0 0 -0.07 -0.07 -0.17 -0.17 -0.17 -0.07 -0.07 5.015 -0.11 -0.07 -0.07 -0.14 -0.14 -3.21 -2.2 -2.2 -1.65 3.761 -0.01 -0.01 0 0 0 0 0 0
0 0 -0.01 -0.02 -0.02 -0.02 -0.08 -0.08 -0.08 0.111 0 0 0 0 0.689 0.689 1.123 1.226 0 0 5.015 -3.35 2.291 -2.04 -3.08 -3.08 -3.21 -3.02 -3.02 -2.55 0.17 -0.01 -0.01 0 0 0 0 0 0
0 0 -0.01 -0.02 -0.02 -0.02 0 -0 0 0.111 0 0 0 0 -4.46 -4.46 -0.04 -0.04 0 0 2.118 1.215 2.291 0.006 0.055 0.347 -0.1 -0.2 -0.2 0.17 0 0 0 0 0 0 0 0 0
0 0 -0.01 -0.02 -0 -0 -0 -0 0 0.111 0 0 -1.72 0 -4.46 0 -0.04 -0.04 -0.14 0 2.118 1.215 5.301 0.891 0.055 0.347 -0.2 0.17 0 0 0 0 0 0 0 0 0
0 -0.12 -0.11 -0 -0 -0 -0 -0 -0.02 0 0 1.323 -0.37 0.037 0.417 3.529 3.529 3.913 3.913 6.316 19.46 0.608 0.608 -0.1 -0.1 0.17 0 0 0 0 0 0 0 0 0
0 -0.12 -0.11 -0.04 -0.04 -0.04 -0.03 -0.03 -0.02 0 1.673 1.673 2.038 0.751 0.03 0.03 3.529 3.913 3.913 6.316 6.316 2.295 2.295 1.287 1.287 -0.1 -0.1 -0.1 0 0 0 0 0 0 0 0 0 0
0 -0.11 -0.11 -0.04 -0.04 -0.04 0 0 0 0 1.673 1.673 2.038 0.751 0.03 0.03 5.226 5.226 18.11 94.54 162 4.881 6.032 1.287 0.041 -0.1 -0.06 -0.06 0 0 0 0 0 0 0 0 0 0 0
0 -0.04 -0.04 -0.05 -0.05 -0.05 0 0 0 0 0.124 0.124 0.51 -0.13 -0.13 5.226 11.92 26.5 75.39 0.957 1.11 -0.96 -0.96 0 0 0 0 0 0 0 0 0 0 0 0 0
0 0.044 0.044 11.74 11.74 -0.05 -0.68 -0.68 -0.68 -2.08 0.124 0.124 0.51 -0.13 -0.13 -0.09 1.962 4.625 0.957 1.537 1.11 -0.96 -0.96 0 0 0 0 0 0 0 0 0 0 0 0 0
0 0.044 0.044 17.93 17.93 -0.05 0.098 0.098 0.098 1.552 0.771 0.081 -0.22 -0.16 -0.16 -0.09 -0.05 12.94 7.798 4.625 1.085 1.085 1.11 -0.96 -0.96 0 0 0 0 0 0 0 0 0 0 0 0 0
0 14.02 14.02 17.93 17.93 14.57 -4.71 -4.71 -4.71 11.32 0.771 0.081 0.771 -0.16 -0.16 0.774 12.94 12.3 7.798 4.625 1.085 1.085 -0.24 1.065 1.065 0 0 0 0 0 0 0 0 0 0 0 0 0
0 0 23.43 10.79 14.57 14.57 -4.71 -4.71 -4.71 -1.38 0.797 0.797 -0.08 -0.08 -0.1 -0.1 0 0 0.802 -0.08 2.281 2.281 2.524 2.524 2.524 3.755 -0.15 -0.15 0 0 0 -0.01 -0.01 0 0 0 0 0 0
0 0 0 18.48 20.03 20.03 -1.28 -1.28 -1.28 -0.15 -0.04 0 0.07 0.876 0 0 0.802 -0.06 -0.01 2.281 1.232 1.232 3.755 0 -0.15 -0.15 0 0 0 -0.01 -0.01 0 0 0 0 0 0
0 0 0 18.48 20.03 20.03 -3.41 -3.41 -3.41 -1.78 -0.04 -0.04 -0.08 0.181 0.181 0 -0.12 0 -0.06 -0.01 0.073 2.813 1.232 0 0 -0 -0 0 0 0 -0.05 -0.01 0 0 0 0 0 0
0 0 0 13.42 6.386 6.386 -2.68 -2.68 0.462 -0.21 0.466 0.466 -2.15 -0.08 0.181 9.994 9.994 0.734 0.734 0.003 -0.02 -0.02 0 0 0 0 0 0 0 0 0 -0.01 -0.01 0 0 0 0 0 0
0 0 0 13.42 6.386 6.386 -2.68 -2.68 0.462 0.466 0.466 -2.15 -0.08 3.108 0 4.822 0.734 0.734 0.003 0 0 0 0 0 0 0 0 0 0 0 -0.01 -0.01 0 0 0 0 0 0
0 0 0 7.298 7.298 6.386 2.06 10.65 -2.23 0.466 -4.03 -0.08 0.005 5.324 5.324 0 0.293 0.006 0 0 0 -1.49 0 0 1.687 1.687 9.409 9.409 0 0 -0.01 0 0 0 0 0 0
0 0 0 7.298 7.298 4.141 2.06 10.65 -2.23 -2.23 -4.03 -1.45 -1.45 0.044 -2.96 -2.96 -2.36 -2.36 0 -0.01 -0.01 -1.41 -1.49 0 0 1.687 -1.44 9.409 9.409 9.409 7.435 7.435 0 0 0 0 0 0
0 0 0 7.298 -0 4.141 4.141 4.701 4.701 -2.23 -2.23 -1.45 0.044 0.044 -2.96 -4.84 -4.64 -4.64 0 0 0 -1.41 -1.41 0 0 -1.44 -1.44 11.83 11.83 11.83 11.61 7.435 0 0 0 0 0 0
0 0 0 -0 -0 4.141 4.141 4.141 4.701 4.701 -1.51 -1.45 -1.45 -0.13 -0.13 -4.84 -4.84 -4.64 -2.88 0.85 -0.02 -0.02 -2.64 0 -2.69 -2.69 -2.16 -1.44 11.83 11.83 11.83 11.61 12.95 0 0 0 0 0 0
0 0 0 -0 0 4.141 4.141 7.291 7.291 4.701 -1.51 -0.76 -1.54 -2.58 -0.13 -2.7 -2.7 -2.88 -2.88 0.85 -0 -0 -2.56 -2.56 0 3.551 -3.52 -2.51 12.31 12.31 12.31 11.61 12.95 0 0 0 0 0 0
0 0 0 0 0 4.141 7.291 7.291 7.291 12.64 12.64 12.64 19.74 19.74 18.62 0.214 -6.61 88.2 -4.58 -2.95 0 0 -2.58 -2.58 0 7.682 -3.25 -2.72 12.51 12.24 12.24 7.264 7.264 0 0 0 0 0 0
0 0 0 -0 -0 1.889 1.889 1.889 7.814 7.814 12.64 29.33 29.58 15.96 15.96 -0.8 -2.46 -2.95 -2.54 -2.54 0 0 -1.17 -2.48 -2.48 -2.31 -3.25 -2.72 12.51 12.24 12.24 7.264 -0 0 0 0 0 0 0
0 0 0 0 0 1.889 1.889 7.814 7.814 7.814 12.64 7.484 12.78 6.296 6.296 -0.8 -0.8 -0.8 -2.54 -2.54 0 0 -1.17 -1.65 -1.9 -1.9 -1.64 -1.64 12.51 12.24 12.24 -0 -0 0 0 0 0 0 0
0 0 0 0.01 0.01 1.889 1.889 6.418 6.418 0 7.484 12.78 6.296 6.296 -0.8 -0.8 -0.8 21.28 4.908 4.908 0 0 10.15 10.15 6.103 6.103 4.347 4.347 0 0 0 -0 -0 0 0 0 0 0 0
0 0 0 0.01 0.01 1.889 6.418 6.418 6.418 7.278 7.278 0 0 0 8.995 8.995 21.28 21.28 15.84 4.908 0 0 10.15 10.15 6.103 6.103 4.347 4.347 0 0 0 -0 -0 0 0 0 0 0 0
0 0 0 0.007 0.007 0.007 2.22 17.34 17.34 10.4 10.4 10.4 10.4 0 8.995 8.995 13.23 13.23 -1.44 7.422 0 0 34 34 12.72 12.72 5.925 5.925 4E-04 4E-04 4E-04 -0 -0 0 0 0 0 0 0
0 0 0 0.007 0.007 0.007 2.22 12.69 12.69 10.94 10.94 1E-04 0 0 8.995 8.995 26.21 8.83 7.422 7.422 0 29.25 17.85 17.85 1.257 1.257 1.278 1.278 4E-04 4E-04 4E-04 0 0 0 0 0 0 0 0
0 0 0 0.007 0.007 0.007 0 7E-05 7E-05 0.025 0.025 1E-04 0 4E-04 0 0 -0.02 8.83 2.662 0 0 12.54 5.753 5.753 5E-04 5E-04 -0 -0 0.001 0.001 0.001 6E-04 6E-04 0 0 0 0 0 0
0 0 0 0 0 0 0 6E-05 6E-05 0.025 1E-04 1E-04 0 4E-04 7E-04 7E-04 0.002 -0 2.662 0 0 12.54 5E-04 5E-04 0 0 0 0 0 0 0 4E-04 4E-04 0 0 0 0 0 0
0 0 0 0 0 0 0 0 0 0 0 0 0 0 0 0 0 0 0 0 0 0 0 0 0 0 0 0 0 0 0 0 0 0 0 0 0 0 0 0 0 0 0 0 0 0 0 0 0 0 0 0 0 0 0 0 0 0 0 0 0 0 0 0 0 0 0 0 0 0 0 0 0 0 0 0 0 0 0
0 0 0 0 0 0 0 0 0 0 0 0 0 0 0 0 0 0 0 0 0 0 0 0 0 0 -0 -0.01 -0.01 -0 -0 -0.02 -0.02 0 0 -0.02 -0.02 -0.02 0 0
0 0 0 0 0 0 0 0 0 0 0 0 0 0 0 0 0 0 0 0 0 0 0 0 0 0 -0 -0.02 -0.02 -0.01 -0.01 -0.02 -0.02 0.001 0.001 -0.03 -0.03 -0.03 0 0
0 0 0 0 0 0 0 0 0 0 0 0 0 0 0 0 0 0 0 0 0 0 0 0 0 0 0 -0 -0 -0.03 -0.03 -0.02 -0.02 -0 -0 -0 -0 -0.01 0 0
0 0 0 0 0 0 0 0 0 0 0 0 0 0 0 0 0 0 0 0 0 0 0 0 0 0 0 -0.02 -0.02 -0.01 -0.01 -0.01 -0.01 -0.02 -0.02 -0 -0.01 -0.01 0 0
0 0 0 0 0 0 0 0 0 0 0 0 0 0 0 0 0 0 0 0 0 0 0 0 0 0 0 0.007 0.007 -0 -0 0.003 0.003 0.002 0.002 -0.01 -0.01 -0.01 0 0
0 0 0 0 0 0 0 0 0 0 0 0 0 0 0 0 0 0 0 0 0 0 0 0 0 0 0 0.007 0.007 0.001 0.001 -0.01 -0.01 1.398 -0.01 -0 -0 -0 0 0
0 0 0 0 0 0 0 0 0 0 0 0 0 0 0 0 0 0 0 0 0 0 0 0 0 0 -0 -0.02 -0.02 -0.02 -0.02 0.003 0.003 -0.01 -0.01 -0 -0 -0 0
0 0 0 0 0 0 0 0 0 0 0 0 0 0 0 0 0 0 0 0 0 0 0 0 0 0 -0 -0 -0 -0.05 -0.05 0.003 -0.03 -0.01 -0.01 -0.06 -0.06 -0.01 -0.01
0 0 0 0 0 0 0 0 0 0 0 0 0 0 0 0 0 0 0 0 0 0 0 0 0 0 -0 -0 -0 -0.05 -0.05 -0.03 -0.03 -0.01 -0.01 -0.06 -0.06 -0.01 -0.01
0 0 0 0 0 0 0 0 0 0 0 0 0 0 0 0 0 0 0 0 0 0 0 0 0 0 -0.02 -0.02 -0.01 -0.01 0 -0.01 -0.01 -0.04 -0.01 -0.01 -0.01 -0.01 0
0 0 0 0 0 0 0 0 0 0 0 0 0 0 0 0 0 0 0 0 0 0 0 0 0 0 -0.02 -0.02 -0.01 0 0 -0.01 -0.01 -0.04 -0.01 -0.01 -0.01 -0.01 0
0 0 0 0 0 0 0 0 0 0 0 0 0 0 -0 -0 0.187 0.187 24.43 15.07 15.07 1.785 21.18 23.36 26.32 8.987 -0.02 -0.01 -0.01 0 0 -0.01 0.005 -0.04 -0.01 -0.01 -0.01 -0.01 0
0 0 0 0 0 0 0 0 0 0 0 0 0 0 -0 -0 0.187 20.49 24.43 15.07 15.07 1.785 21.18 23.36 26.32 8.987 8.987 8.987 -0.01 0 0 0.005 0.005 -0.03 -0.01 -0.01 -0.01 -0.01 0
0 0 0 0 0 0 0 0 0 0 0 0 0 0 -0 25.01 26.92 20.49 24.43 15.07 15.07 1.785 21.18 23.36 26.32 8.987 8.987 23.95 23.95 0 3.376 -0.02 -0.03 -0.03 -0.01 0 0
0 0 0 0 0 0 0 0 0 0 0 0 0 0 25.01 25.01 26.92 20.49 -3.38 -3.38 -3.38 1.785 21.18 29.15 33.66 8.987 8.987 23.95 23.95 -0.03 0 -0.02 1.586 -0.01 -0.01 0 0 0 0
0 0 0 0 0 0 0 0 0 0 0 0 -0 -0 31.79 12.05 -2.31 -2.31 -3.71 -3.71 -3.71 18.87 3.159 11.64 11.91 13.99 20.52 32.21 32.21 -0.03 -0.03 -0 -0 -0.01 -0.01 0 0 0 0
0 0 0 0 0 0 0 0 0 0 0 -0 -0 -0 31.79 12.05 -2.31 -2.31 -1.15 -1.15 -1.15 18.87 3.159 11.64 11.91 13.99 20.52 32.21 32.21 -0.03 0 -0 -0 -0.01 -0.01 -0.01 0 0
0 0 0 0 0 0 0 0 0 -0 -0 -0 -0 53.06 4.911 9.141 -3.74 51.89 51.89 51.89 1.448 1.448 1.396 1.396 -0.11 3.941 17.53 0 -0.12 5.351 5.351 -0 -0.01 -0.01 -0.01 -0.01 0 0
0 0 0 0 0 0 0 -0 -0 -0.01 -0 -0 25.36 25.36 9.141 -3.53 40.76 40.76 40.76 1.448 1.448 1.396 1.396 -0.11 5.189 17.53 0 -0.12 5.351 5.351 -0.01 -0.01 0 0
0 0 0 0 0 -0 -0 -0 -0.01 -0.01 -0 25.36 0 0 -3.53 40.76 40.76 40.76 -0.39 -0.39 -0.42 0 5.189 5.189 6.344 -0.26 -0.21 -0.21 -0.01 -0.01 0 0 0 0
6.189 6.189 7.062 7.062 -0 -0 -0 -0 -0 0 -0.26 -0.26 -0.8 -0.8 -0.05 -0.05 -0.05 0 -0.08 -0.08 -0.08 3.88 3.88 6.344 -0.68 -0.68 -0.99 -0.01 -0.01 0 0 0 0 0 0
0 -0 0 6.189 6.189 6.189 7.062 -0 -0 -0 -0 -0 -0 0 4.204 4.204 0.771 -0.15 -0.15 -0.1 -0.1 -0.08 -0.08 -0.08 -0.08 3.88 0 -0.17 -0.68 -0.68 -0.99 -0.01 -0.01 0 0 0 0 0 0
0 -0 0 6.873 6.873 6.873 -0.06 -0.06 -0.06 0 0 -0 -0 0 0 4.204 0.771 -0.15 -0.15 -0.1 -0.1 0.906 0.906 0.461 0.461 -0.04 -0.04 -0.26 -0.26 -0.65 5.318 -0.01 -0.01 0 0 0 0 0 0
0 0.012 0.012 6.873 6.873 6.873 -0.06 -0.06 -0.06 0 0 0 0 -0.07 -0.07 -0.16 -0.16 -0.16 -0.05 -0.05 7.238 -0.08 -0.05 -0.05 -0.11 -0.11 -0.36 0.302 0.302 -0.65 5.318 -0.01 -0.01 0 0 0 0 0 0
0 0 -0 -0.01 -0.01 -0.01 -0.06 -0.06 -0.06 0.208 0 0 0 0 1.14 1.14 1.726 1.595 0 0 7.238 -1.95 3.25 -1.41 0.141 0.141 -0.36 -0.28 -0.28 0 0.816 -0.01 -0.01 0 0 0 0 0 0
0 0 -0 -0.01 -0.01 -0.01 0 -0 0 0.208 0 0 0 0 -4.09 -4.09 -0.04 -0.04 0 0 2.018 2.378 3.25 0.015 0.055 0.347 0.277 0.196 0.196 0.816 0 0 0 0 0 0 0 0 0
0 0 -0 -0.01 -0 -0 -0 -0 0 0.208 0 0 -1.58 0 -4.09 0 -0.04 -0.04 -0.1 0 2.018 2.378 6.7 0.891 0.055 0.347 0.196 0.816 0 0 0 0 0 0 0 0 0
0 -0.09 -0.11 -0 -0 -0 -0 -0 -0.02 0 0 1.599 1.041 0.282 1.856 3.621 3.621 6.023 6.023 11.94 23.2 6.597 6.597 -0.1 -0.1 0.816 0 0 0 0 0 0 0 0 0
0 -0.09 -0.11 -0.03 -0.03 -0.03 -0.03 -0.03 -0.02 0 1.556 1.556 4.672 0.709 0.494 0.494 3.621 6.023 6.023 11.94 11.94 9.705 9.705 1.214 1.214 -0.1 -0.1 -0.1 0 0 0 0 0 0 0 0 0 0
0 -0.09 -0.09 -0.03 -0.03 -0.03 0 0 0 0 1.556 1.556 4.672 0.709 0.494 0.494 12.83 12.83 18.29 133.3 295.9 16.37 9.96 1.214 0.041 -0.1 -0.06 -0.06 0 0 0 0 0 0 0 0 0 0 0
0 -0.03 -0.03 -0.04 -0.04 -0.04 0 0 0 0 0.124 0.124 0.51 -0.13 -0.13 12.83 18.9 26.36 125 1.007 1.012 0.538 0.538 0 0 0 0 0 0 0 0 0 0 0 0 0
0 0.044 0.044 12.6 12.6 -0.04 -0.58 -0.58 -0.58 -1.31 0.124 0.124 0.51 -0.13 -0.13 -0.09 4.263 6.727 1.007 1.724 1.012 0.538 0.538 0 0 0 0 0 0 0 0 0 0 0 0 0
0 0.044 0.044 37.41 37.41 -0.04 0.098 0.098 0.098 1.552 1.094 0.798 -0.22 -0.16 -0.16 -0.09 -0.05 14.37 9.975 6.727 3.503 3.503 1.012 0.538 0.538 0 0 0 0 0 0 0 0 0 0 0 0 0
0 13.87 13.87 37.41 37.41 14.26 -2.58 -2.58 -2.58 11.63 1.094 0.798 0.734 -0.16 -0.16 1.322 14.37 15.7 9.975 6.727 3.503 3.503 3.098 1.077 1.077 0 0 0 0 0 0 0 0 0 0 0 0 0
0 0 24.53 11.09 14.26 14.26 -2.58 -2.58 -2.58 -1.26 0.802 0.802 0.999 0.999 -0.1 -0.1 0 3.769 1.767 -0.04 3.785 3.785 3.661 3.661 3.661 3.751 -0.1 -0.1 0 0 0 -0.01 -0.01 0 0 0 0 0 0
0 0 0 20.2 20.47 20.47 -1.17 -1.17 -1.17 -0.06 -0.04 0 0.07 0.876 0 3.769 1.767 -0.03 -0.01 3.785 2.238 2.238 3.751 0 -0.1 -0.1 0 0 0 -0.01 -0.01 0 0 0 0 0 0
0 0 0 20.2 20.47 20.47 -0.71 -0.71 -0.71 0.002 -0.04 -0.04 -0.08 1.638 1.638 0 2.957 0 -0.03 -0.01 0.222 4.48 2.238 0 0 -0 -0 0 0 0 -0.05 -0.01 0 0 0 0 0 0
0 0 0 20.5 19.48 19.48 -1 -1 0.462 -0.21 0.494 0.494 -1.38 -0.08 1.638 19.49 19.49 0.985 0.985 0.009 -0.02 -0.02 0 0 0 0 0 0 0 0 0 -0.01 -0.01 0 0 0 0 0 0
0 0 0 20.5 19.48 19.48 -1 -1 0.462 0.494 0.494 -1.38 -0.08 3.507 0 6.064 0.985 0.985 0.009 0 0 0 0 0 0 0 0 0 0 0 -0.01 -0.01 0 0 0 0 0 0
0 0 0 11.96 11.96 19.48 2.775 23.14 -1.75 0.494 -2.7 -0.08 1.793 8.741 8.741 0 1.568 0.018 0 0 0 -1.4 0 0 3.16 3.16 11.94 11.94 0 0 -0.01 0 0 0 0 0 0
0 0 0 11.96 11.96 6.689 2.775 23.14 -1.75 -1.75 -2.7 -1.13 -1.13 0.044 -2.35 -2.35 -2.17 -2.17 0 -0.01 -0.01 -1.33 -1.4 0 0 3.16 0.148 11.94 11.94 11.94 12.2 12.2 0 0 0 0 0 0
0 0 0 11.96 -0 6.689 6.689 9.843 9.843 -1.75 -1.75 -1.13 0.044 0.044 -2.35 -3.14 -3.9 -3.9 0 0 0 -1.33 -1.33 0 0 0.148 0.148 14.8 14.8 14.8 17.42 12.2 0 0 0 0 0 0
0 0 0 -0 -0 6.689 6.689 6.689 9.843 9.843 -1.19 -1.13 -1.13 0.293 0.293 -3.14 -3.14 -3.9 -2.42 0.85 -0.01 -0.01 -1.82 0 -1.91 -1.91 -1.3 0.148 14.8 14.8 14.8 17.42 12.8 0 0 0 0 0 0
0 0 0 -0 0 6.689 6.689 11.95 11.95 9.843 -1.19 -0.68 -1.44 -2.52 0.293 -2.03 -2.03 -2.42 -2.42 0.85 -0 -0 -1.67 -1.67 0 7.72 -2.68 -1.6 21.64 21.64 21.64 17.42 12.8 0 0 0 0 0 0
0 0 0 0 0 6.689 11.95 11.95 11.95 12.92 12.92 12.92 23.86 23.86 29.45 0.214 -3.12 99.36 -3.29 -2.54 0 0 -1.8 -1.8 0 9.707 -2.22 -1.78 19.31 12.76 12.76 7.81 7.81 0 0 0 0 0 0
0 0 0 -0 -0 5.653 5.653 5.653 13.16 13.16 12.92 29.58 34.71 15.98 15.98 -0.08 -1.63 -2.54 -2.24 -2.24 0 0 -1.1 -1.74 -1.74 -1.56 -2.22 -1.78 19.31 12.76 12.76 7.81 -0 0 0 0 0 0 0
0 0 0 0 0 5.653 5.653 13.16 13.16 13.16 12.92 21.86 26.75 11.09 11.09 -0.08 -0.08 -0.08 -2.24 -2.24 0 0 -1.1 -1.11 -1.3 -1.3 -1.03 -1.03 19.31 12.76 12.76 -0 -0 0 0 0 0 0 0
0 0 0 0.01 0.01 5.653 5.653 10.25 10.25 0 21.86 26.75 11.09 11.09 -0.08 -0.08 -0.08 28.08 5.769 5.769 0 0 21.14 21.14 9.67 9.67 12.74 12.74 0 0 0 -0 -0 0 0 0 0 0 0
0 0 0 0.01 0.01 5.653 10.25 10.25 10.25 16.94 16.94 0 0 5.952 11.1 11.1 28.08 28.08 16.71 5.769 0 0 21.14 21.14 9.67 9.67 12.74 12.74 0 0 0 -0 -0 0 0 0 0 0 0
0 0 0 0.007 0.007 0.007 8.571 17.22 17.22 11.19 11.19 11.19 11.19 5.952 11.1 11.1 37.91 37.91 0.154 7.822 0 0 42.83 42.83 13.68 13.68 6.142 6.142 4E-04 4E-04 4E-04 -0 -0 0 0 0 0 0 0
0 0 0 0.007 0.007 0.007 8.571 12.65 12.65 14.9 14.9 1E-04 0 5.952 11.1 11.1 37.01 24.04 7.822 7.822 0 32.43 26.75 26.75 5.68 5.68 5.774 5.774 4E-04 4E-04 4E-04 0 0 0 0 0 0 0 0
0 0 0 0.007 0.007 0.007 0 7E-05 7E-05 0.025 0.025 1E-04 0 4E-04 0 0 -0.02 24.04 8.046 0 0 13.49 5.942 5.942 5E-04 5E-04 -0 -0 0.001 0.001 0.001 6E-04 6E-04 0 0 0 0 0 0
0 0 0 0 0 0 0 6E-05 6E-05 0.025 1E-04 1E-04 0 4E-04 7E-04 7E-04 0.002 -0 8.046 0 0 13.49 5E-04 5E-04 0 0 0 0 0 0 0 4E-04 4E-04 0 0 0 0 0 0
0 0 0 0 0 0 0 0 0 0 0 0 0 0 0 0 0 0 0 0 0 0 0 0 0 0 0 0 0 0 0 0 0 0 0 0 0 0 0
Base Case
High Scenario
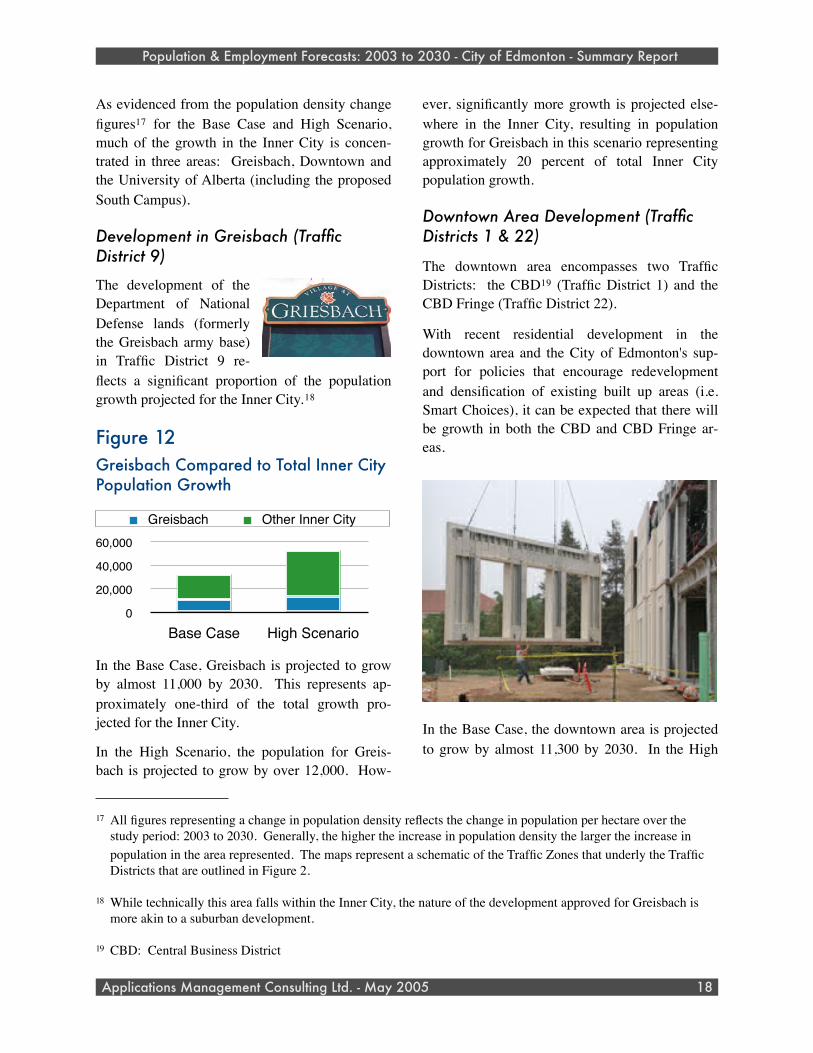
As evidenced from the population density change figures17 for the Base Case and High Scenario, much of the growth in the Inner City is concen-trated in three areas: Greisbach, Downtown and the University of Alberta (including the proposed South Campus).
Development in Greisbach (Traffic District 9)
The development of the Department of National Defense lands (formerly the Greisbach army base) in Traffic District 9 re-flects a significant proportion of the population growth projected for the Inner City.18
Figure 12Greisbach Compared to Total Inner City Population Growth
Greisbach Other Inner City
0
20,000
40,000
60,000
Base Case High Scenario
In the Base Case, Greisbach is projected to grow by almost 11,000 by 2030. This represents ap-proximately one-third of the total growth pro-jected for the Inner City.
In the High Scenario, the population for Greis-bach is projected to grow by over 12,000. How-
ever, significantly more growth is projected else-where in the Inner City, resulting in population growth for Greisbach in this scenario representing approximately 20 percent of total Inner City population growth.
Downtown Area Development (Traffic Districts 1 & 22)
The downtown area encompasses two Traffic Districts: the CBD19 (Traffic District 1) and the CBD Fringe (Traffic District 22).
With recent residential development in the downtown area and the City of Edmonton's sup-port for policies that encourage redevelopment and densification of existing built up areas (i.e. Smart Choices), it can be expected that there will be growth in both the CBD and CBD Fringe ar-eas.
In the Base Case, the downtown area is projected to grow by almost 11,300 by 2030. In the High
Population & Employment Forecasts: 2003 to 2030 - City of Edmonton - Summary Report
Applications Management Consulting Ltd. - May 2005 18
17 All figures representing a change in population density reflects the change in population per hectare over the study period: 2003 to 2030. Generally, the higher the increase in population density the larger the increase in population in the area represented. The maps represent a schematic of the Traffic Zones that underly the Traffic Districts that are outlined in Figure 2.
18 While technically this area falls within the Inner City, the nature of the development approved for Greisbach is more akin to a suburban development.
19 CBD: Central Business District

Scenario, the population for the downtown area is projected to grow by over 19,000.
These projections include the continued develop-ment of new medium and high rise apartments, the development of the CN lands and building of the Grant McEwan student residences on 104 Avenue.
University of Alberta & U of A South Campus (Traffic Districts 2 & 3)
The University of Alberta (U of A) is a dominant factor in Traffic District 2, which also includes the development north of Whyte Avenue and south of the North Saskatchewan River. The U of A is also going to be a significant factor in Traffic District 3 (Southgate) with the development of the proposed South Campus.
University of Alberta
In the Base Case, the population of the University (District 2) & U of A South Campus (Southgate: District 3) are projected to grow by 5,700 by 2030. In the High Scenario this almost doubles to over 9,000. A significant portion of this growth20 is post secondary students, especially for the South Campus in Traffic District 3.
In the Base Case, the U of A South Campus is projected to be established before 2025 and add almost 2,500 to the population of Southgate by 2030. In the High Scenario, development of the South Campus is assumed to start 10 years earlier and total population growth - largely related to this development - is projected to be over 5,000 for Traffic District 3.
Suburban Population GrowthSuburban residential development will drive most of the growth in the City of Edmonton over the forecast period. In the both the Base Case and High Scenario, over 80 percent of the total popu-lation growth is projected to occur in suburban areas. Most of this growth will be the result of new subdivisions and associated housing devel-opment.
In the Base Case, it is projected that the suburban areas will grow by 146,000 by 2030. This repre-sents an increase in the Suburban population of 43 percent.
In the High Scenario, suburban area growth is projected to be just over 226,000 by the end of the forecast period. This is equal to an increase of the existing Suburban population of 67 percent.
Population Growth by Sector
For the purposes of the analysis, the Suburban area has been broken down into five sectors.
Population & Employment Forecasts: 2003 to 2030 - City of Edmonton - Summary Report
Applications Management Consulting Ltd. - May 2005 19
20 In the University Traffic District (2), there is also residential growth and development associated with densifica-tion of existing areas through the addition of new high rises along the North Saskatchewan river and redevelop-ment of other residential areas.
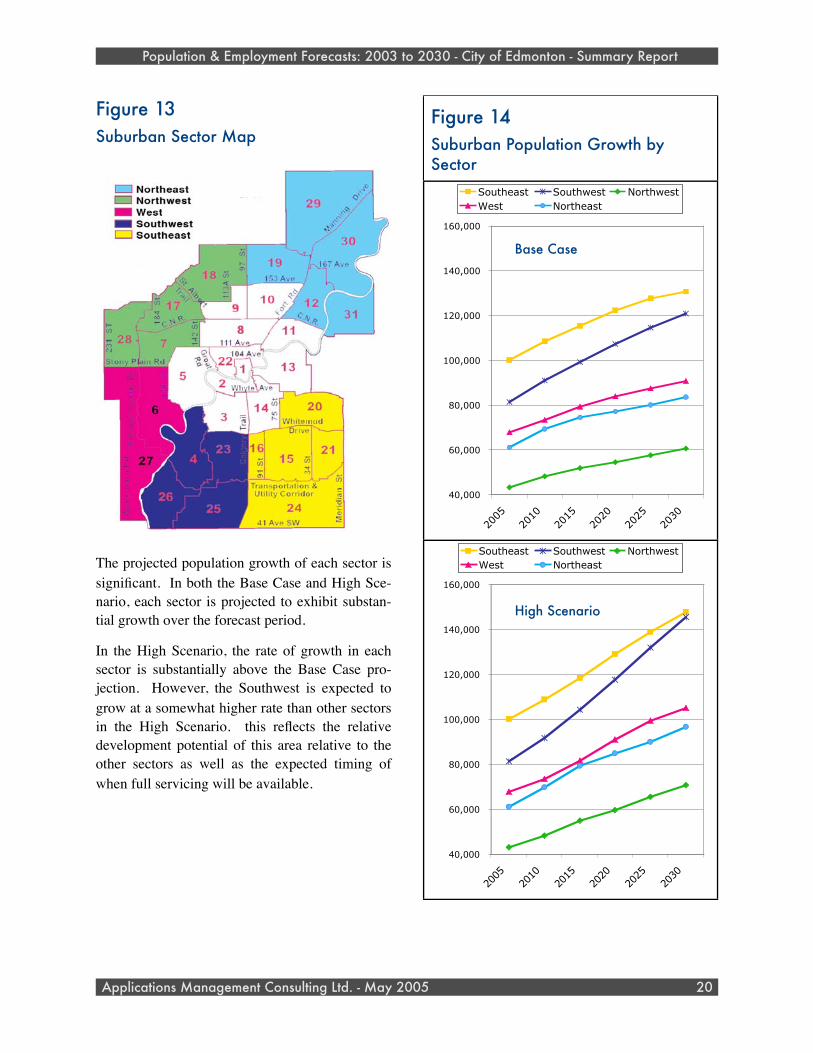
Figure 13Suburban Sector Map
The projected population growth of each sector is significant. In both the Base Case and High Sce-nario, each sector is projected to exhibit substan-tial growth over the forecast period.
In the High Scenario, the rate of growth in each sector is substantially above the Base Case pro-jection. However, the Southwest is expected to grow at a somewhat higher rate than other sectors in the High Scenario. this reflects the relative development potential of this area relative to the other sectors as well as the expected timing of when full servicing will be available.
Population & Employment Forecasts: 2003 to 2030 - City of Edmonton - Summary Report
Applications Management Consulting Ltd. - May 2005 20
Figure 14Suburban Population Growth by Sector
40,000
60,000
80,000
100,000
120,000
140,000
160,000
2005
2010
2015
2020
2025
2030
Southeast Southwest NorthwestWest Northeast
40,000
60,000
80,000
100,000
120,000
140,000
160,000
2005
2010
2015
2020
2025
2030
Southeast Southwest NorthwestWest Northeast
High Scenario
Base Case
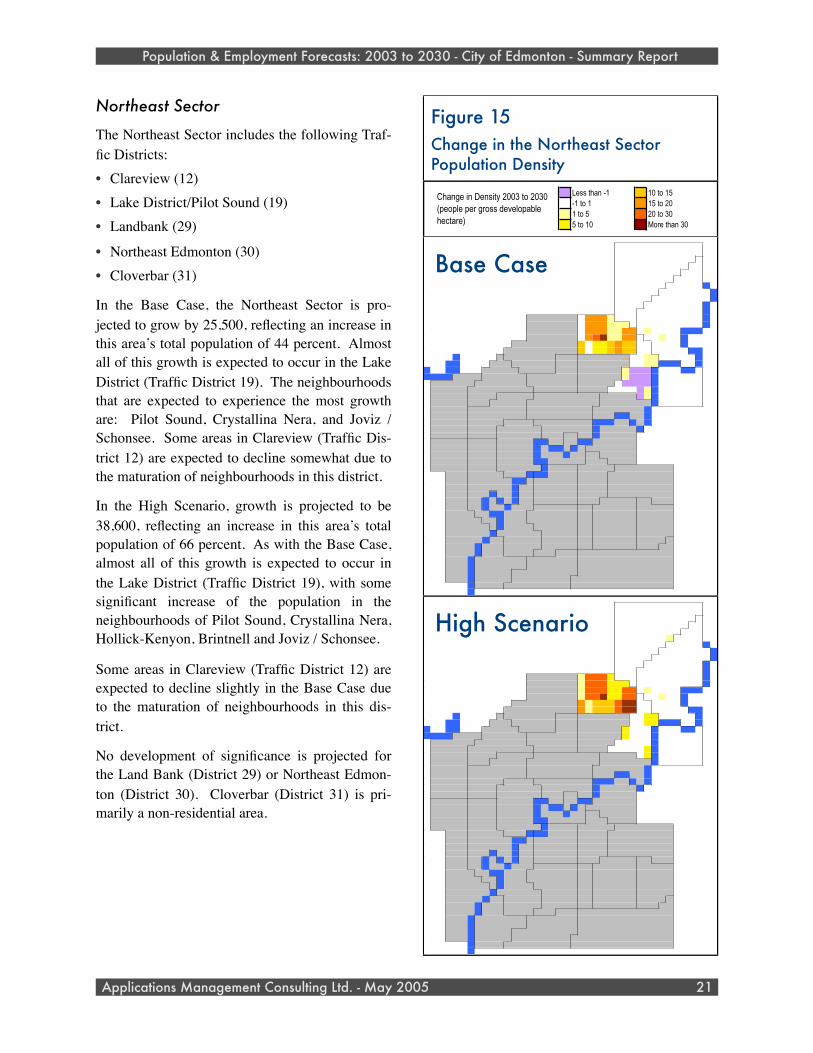
Northeast Sector
The Northeast Sector includes the following Traf-fic Districts:• Clareview (12)• Lake District/Pilot Sound (19)• Landbank (29)
• Northeast Edmonton (30)• Cloverbar (31)
In the Base Case, the Northeast Sector is pro-jected to grow by 25,500, reflecting an increase in this area’s total population of 44 percent. Almost all of this growth is expected to occur in the Lake District (Traffic District 19). The neighbourhoods that are expected to experience the most growth are: Pilot Sound, Crystallina Nera, and Joviz / Schonsee. Some areas in Clareview (Traffic Dis-trict 12) are expected to decline somewhat due to the maturation of neighbourhoods in this district.
In the High Scenario, growth is projected to be 38,600, reflecting an increase in this area’s total population of 66 percent. As with the Base Case, almost all of this growth is expected to occur in the Lake District (Traffic District 19), with some significant increase of the population in the neighbourhoods of Pilot Sound, Crystallina Nera, Hollick-Kenyon, Brintnell and Joviz / Schonsee.
Some areas in Clareview (Traffic District 12) are expected to decline slightly in the Base Case due to the maturation of neighbourhoods in this dis-trict.
No development of significance is projected for the Land Bank (District 29) or Northeast Edmon-ton (District 30). Cloverbar (District 31) is pri-marily a non-residential area.
Population & Employment Forecasts: 2003 to 2030 - City of Edmonton - Summary Report
Applications Management Consulting Ltd. - May 2005 21
Figure 15Change in the Northeast Sector Population Density
Less than -1 10 to 15-1 to 1 15 to 201 to 5 20 to 305 to 10 More than 30
Change in Density 2003 to 2030 (people per gross developable hectare)
0 0 0 0 0 0 0 0 0 0 0 0 0 0 0 0 0 0 0 0 0 0 0 0 0 0 0 0 0 0 0 0 0 0 0 0 0 0 0 0
0 0 0 0 0 0 0 0 0 0 0 0 0 0 0 0 0 0 0 0 0 0 0 0 0 0 -0.01 -0.01 -0.01 -0 -0 -0.02 -0.02 0 0 -0.02 -0.02 -0.02 0 0
0 0 0 0 0 0 0 0 0 0 0 0 0 0 0 0 0 0 0 0 0 0 0 0 0 0 -0.01 -0.02 -0.02 -0.02 -0.02 -0.02 -0.02 -0 -0 -0.04 -0.04 -0.04 0 0
0 0 0 0 0 0 0 0 0 0 0 0 0 0 0 0 0 0 0 0 0 0 0 0 0 0 0 -0.01 -0.01 -0.04 -0.04 -0.02 -0.02 -0.01 -0.01 -0.01 -0.01 -0.01 0 0
0 0 0 0 0 0 0 0 0 0 0 0 0 0 0 0 0 0 0 0 0 0 0 0 0 0 0 -0.02 -0.02 -0.01 -0.01 -0.01 -0.01 -0.02 -0.02 -0.01 -0.01 -0.01 0 0
0 0 0 0 0 0 0 0 0 0 0 0 0 0 0 0 0 0 0 0 0 0 0 0 0 0 0 0.003 0.003 -0 -0 0.001 0.001 -0 -0 -0.01 -0.01 -0.01 0 0
0 0 0 0 0 0 0 0 0 0 0 0 0 0 0 0 0 0 0 0 0 0 0 0 0 0 0 0.002 0.002 -0 -0 -0.01 -0.01 0.75 -0.02 -0 -0 -0 0 0
0 0 0 0 0 0 0 0 0 0 0 0 0 0 0 0 0 0 0 0 0 0 0 0 0 0 -0 -0.02 -0.02 -0.03 -0.03 6E-04 6E-04 -0.02 -0.01 -0 -0 -0 0
0 0 0 0 0 0 0 0 0 0 0 0 0 0 0 0 0 0 0 0 0 0 0 0 0 0 -0 -0 -0 -0.06 -0.06 6E-04 -0.04 -0.02 -0.01 -0.06 -0.06 -0.02 -0.02
0 0 0 0 0 0 0 0 0 0 0 0 0 0 0 0 0 0 0 0 0 0 0 0 0 0 -0 -0 -0 -0.06 -0.06 -0.04 -0.04 -0.01 -0.01 -0.06 -0.06 -0.02 -0.02
0 0 0 0 0 0 0 0 0 0 0 0 0 0 0 0 0 0 0 0 0 0 0 0 0 0 -0.02 -0.02 -0.01 -0.01 0 -0.01 -0.01 -0.05 -0.01 -0.01 -0.02 -0.02 0
0 0 0 0 0 0 0 0 0 0 0 0 0 0 0 0 0 0 0 0 0 0 0 0 0 0 -0.02 -0.02 -0.01 0 0 -0.01 -0.01 -0.05 -0.01 -0.02 -0.02 -0.02 0
0 0 0 0 0 0 0 0 0 0 0 0 0 0 7E-04 7E-04 0.098 0.098 10.96 11.64 11.64 0.864 18.35 16.62 18.9 4.473 -0.02 -0.01 -0.01 0 0 -0.01 0.002 -0.05 -0.02 -0.02 -0.02 -0.02 0
0 0 0 0 0 0 0 0 0 0 0 0 0 0 7E-04 7E-04 0.098 18.04 10.96 11.64 11.64 0.864 18.35 16.62 18.9 4.473 4.473 4.473 -0.01 0 0 0.002 0.002 -0.05 -0.02 -0.02 -0.02 -0.02 0
0 0 0 0 0 0 0 0 0 0 0 0 0 0 7E-04 24.76 11.37 18.04 10.96 11.64 11.64 0.864 18.35 16.62 18.9 4.473 4.473 17.23 17.23 0 2.424 -0.02 -0.05 -0.05 -0.02 0 0
0 0 0 0 0 0 0 0 0 0 0 0 0 0 24.76 24.76 11.37 18.04 -4.98 -4.98 -4.98 0.864 18.35 27.54 31.25 4.473 4.473 17.23 17.23 -0.05 0 -0.02 1.05 -0.01 -0.02 0 0 0 0
0 0 0 0 0 0 0 0 0 0 0 0 -0 -0 15.33 12.44 -3.72 -3.72 -5.39 -5.39 -5.39 14.76 0.479 5.795 9.949 11.17 17.74 11.15 11.15 -0.05 -0.05 -0 -0 -0.01 -0.01 0 0 0 0
0 0 0 0 0 0 0 0 0 0 0 -0 -0 -0 15.33 12.44 -3.72 -3.72 -1.73 -1.73 -1.73 14.76 0.479 5.795 9.949 11.17 17.74 11.15 11.15 -0.05 0 -0 -0 -0.01 -0.01 -0.01 0 0
0 0 0 0 0 0 0 0 0 -0 -0 -0.01 -0.01 53.64 1.895 8.037 -5.35 46.83 46.83 46.83 0.467 0.467 0.636 0.636 -0.11 3.984 15.28 0 -0.86 2.194 2.194 -0 -0.01 -0.01 -0.01 -0.01 0 0
0 0 0 0 0 0 0 -0 -0 -0.02 -0.01 -0.01 15.92 15.92 8.037 -5.32 35.05 35.05 35.05 0.467 0.467 0.636 0.636 -0.11 5.249 15.28 0 -0.86 2.194 2.194 -0.01 -0.01 0 0
0 0 0 0 0 -0 -0 -0 -0.02 -0.02 -0.01 15.92 0 0 -5.32 35.05 35.05 35.05 -0.39 -0.39 -0.42 0 5.249 5.249 4.26 -1.26 -1.12 -1.12 -0.01 -0.01 0 0 0 0
3.677 3.677 7.144 7.144 -0 -0 -0 -0.01 -0.01 0 -1.46 -1.46 -0.98 -0.98 -1.52 -1.52 -1.52 0 -0.55 -0.48 -0.48 3.723 3.723 4.26 -1.43 -1.43 -2.35 -0.01 -0.01 0 0 0 0 0 0
0 -0 0 3.677 3.677 3.677 7.144 -0 -0 -0 -0 -0.01 -0.01 0 2.804 2.804 0.141 -2.63 -2.63 -1.82 -1.82 -0.55 -0.55 -0.48 -0.48 3.723 0 -1.16 -1.43 -1.43 -2.35 -0.01 -0.01 0 0 0 0 0 0
0 -0 0 3.396 3.396 3.396 -0.08 -0.08 -0.08 0 0 -0.01 -0.01 0 0 2.804 0.141 -2.63 -2.63 -1.82 -1.82 -0.12 -0.12 -0.09 -0.09 -0.08 -0.08 -0.92 -0.92 -1.65 3.761 -0.01 -0.01 0 0 0 0 0 0
0 0.012 0.012 3.396 3.396 3.396 -0.08 -0.08 -0.08 0 0 0 0 -0.07 -0.07 -0.17 -0.17 -0.17 -0.07 -0.07 5.015 -0.11 -0.07 -0.07 -0.14 -0.14 -3.21 -2.2 -2.2 -1.65 3.761 -0.01 -0.01 0 0 0 0 0 0
0 0 -0.01 -0.02 -0.02 -0.02 -0.08 -0.08 -0.08 0.111 0 0 0 0 0.689 0.689 1.123 1.226 0 0 5.015 -3.35 2.291 -2.04 -3.08 -3.08 -3.21 -3.02 -3.02 -2.55 0.17 -0.01 -0.01 0 0 0 0 0 0
0 0 -0.01 -0.02 -0.02 -0.02 0 -0 0 0.111 0 0 0 0 -4.46 -4.46 -0.04 -0.04 0 0 2.118 1.215 2.291 0.006 0.055 0.347 -0.1 -0.2 -0.2 0.17 0 0 0 0 0 0 0 0 0
0 0 -0.01 -0.02 -0 -0 -0 -0 0 0.111 0 0 -1.72 0 -4.46 0 -0.04 -0.04 -0.14 0 2.118 1.215 5.301 0.891 0.055 0.347 -0.2 0.17 0 0 0 0 0 0 0 0 0
0 -0.12 -0.11 -0 -0 -0 -0 -0 -0.02 0 0 1.323 -0.37 0.037 0.417 3.529 3.529 3.913 3.913 6.316 19.46 0.608 0.608 -0.1 -0.1 0.17 0 0 0 0 0 0 0 0 0
0 -0.12 -0.11 -0.04 -0.04 -0.04 -0.03 -0.03 -0.02 0 1.673 1.673 2.038 0.751 0.03 0.03 3.529 3.913 3.913 6.316 6.316 2.295 2.295 1.287 1.287 -0.1 -0.1 -0.1 0 0 0 0 0 0 0 0 0 0
0 -0.11 -0.11 -0.04 -0.04 -0.04 0 0 0 0 1.673 1.673 2.038 0.751 0.03 0.03 5.226 5.226 18.11 94.54 162 4.881 6.032 1.287 0.041 -0.1 -0.06 -0.06 0 0 0 0 0 0 0 0 0 0 0
0 -0.04 -0.04 -0.05 -0.05 -0.05 0 0 0 0 0.124 0.124 0.51 -0.13 -0.13 5.226 11.92 26.5 75.39 0.957 1.11 -0.96 -0.96 0 0 0 0 0 0 0 0 0 0 0 0 0
0 0.044 0.044 11.74 11.74 -0.05 -0.68 -0.68 -0.68 -2.08 0.124 0.124 0.51 -0.13 -0.13 -0.09 1.962 4.625 0.957 1.537 1.11 -0.96 -0.96 0 0 0 0 0 0 0 0 0 0 0 0 0
0 0.044 0.044 17.93 17.93 -0.05 0.098 0.098 0.098 1.552 0.771 0.081 -0.22 -0.16 -0.16 -0.09 -0.05 12.94 7.798 4.625 1.085 1.085 1.11 -0.96 -0.96 0 0 0 0 0 0 0 0 0 0 0 0 0
0 14.02 14.02 17.93 17.93 14.57 -4.71 -4.71 -4.71 11.32 0.771 0.081 0.771 -0.16 -0.16 0.774 12.94 12.3 7.798 4.625 1.085 1.085 -0.24 1.065 1.065 0 0 0 0 0 0 0 0 0 0 0 0 0
0 0 23.43 10.79 14.57 14.57 -4.71 -4.71 -4.71 -1.38 0.797 0.797 -0.08 -0.08 -0.1 -0.1 0 0 0.802 -0.08 2.281 2.281 2.524 2.524 2.524 3.755 -0.15 -0.15 0 0 0 -0.01 -0.01 0 0 0 0 0 0
0 0 0 18.48 20.03 20.03 -1.28 -1.28 -1.28 -0.15 -0.04 0 0.07 0.876 0 0 0.802 -0.06 -0.01 2.281 1.232 1.232 3.755 0 -0.15 -0.15 0 0 0 -0.01 -0.01 0 0 0 0 0 0
0 0 0 18.48 20.03 20.03 -3.41 -3.41 -3.41 -1.78 -0.04 -0.04 -0.08 0.181 0.181 0 -0.12 0 -0.06 -0.01 0.073 2.813 1.232 0 0 -0 -0 0 0 0 -0.05 -0.01 0 0 0 0 0 0
0 0 0 13.42 6.386 6.386 -2.68 -2.68 0.462 -0.21 0.466 0.466 -2.15 -0.08 0.181 9.994 9.994 0.734 0.734 0.003 -0.02 -0.02 0 0 0 0 0 0 0 0 0 -0.01 -0.01 0 0 0 0 0 0
0 0 0 13.42 6.386 6.386 -2.68 -2.68 0.462 0.466 0.466 -2.15 -0.08 3.108 0 4.822 0.734 0.734 0.003 0 0 0 0 0 0 0 0 0 0 0 -0.01 -0.01 0 0 0 0 0 0
0 0 0 7.298 7.298 6.386 2.06 10.65 -2.23 0.466 -4.03 -0.08 0.005 5.324 5.324 0 0.293 0.006 0 0 0 -1.49 0 0 1.687 1.687 9.409 9.409 0 0 -0.01 0 0 0 0 0 0
0 0 0 7.298 7.298 4.141 2.06 10.65 -2.23 -2.23 -4.03 -1.45 -1.45 0.044 -2.96 -2.96 -2.36 -2.36 0 -0.01 -0.01 -1.41 -1.49 0 0 1.687 -1.44 9.409 9.409 9.409 7.435 7.435 0 0 0 0 0 0
0 0 0 7.298 -0 4.141 4.141 4.701 4.701 -2.23 -2.23 -1.45 0.044 0.044 -2.96 -4.84 -4.64 -4.64 0 0 0 -1.41 -1.41 0 0 -1.44 -1.44 11.83 11.83 11.83 11.61 7.435 0 0 0 0 0 0
0 0 0 -0 -0 4.141 4.141 4.141 4.701 4.701 -1.51 -1.45 -1.45 -0.13 -0.13 -4.84 -4.84 -4.64 -2.88 0.85 -0.02 -0.02 -2.64 0 -2.69 -2.69 -2.16 -1.44 11.83 11.83 11.83 11.61 12.95 0 0 0 0 0 0
0 0 0 -0 0 4.141 4.141 7.291 7.291 4.701 -1.51 -0.76 -1.54 -2.58 -0.13 -2.7 -2.7 -2.88 -2.88 0.85 -0 -0 -2.56 -2.56 0 3.551 -3.52 -2.51 12.31 12.31 12.31 11.61 12.95 0 0 0 0 0 0
0 0 0 0 0 4.141 7.291 7.291 7.291 12.64 12.64 12.64 19.74 19.74 18.62 0.214 -6.61 88.2 -4.58 -2.95 0 0 -2.58 -2.58 0 7.682 -3.25 -2.72 12.51 12.24 12.24 7.264 7.264 0 0 0 0 0 0
0 0 0 -0 -0 1.889 1.889 1.889 7.814 7.814 12.64 29.33 29.58 15.96 15.96 -0.8 -2.46 -2.95 -2.54 -2.54 0 0 -1.17 -2.48 -2.48 -2.31 -3.25 -2.72 12.51 12.24 12.24 7.264 -0 0 0 0 0 0 0
0 0 0 0 0 1.889 1.889 7.814 7.814 7.814 12.64 7.484 12.78 6.296 6.296 -0.8 -0.8 -0.8 -2.54 -2.54 0 0 -1.17 -1.65 -1.9 -1.9 -1.64 -1.64 12.51 12.24 12.24 -0 -0 0 0 0 0 0 0
0 0 0 0.01 0.01 1.889 1.889 6.418 6.418 0 7.484 12.78 6.296 6.296 -0.8 -0.8 -0.8 21.28 4.908 4.908 0 0 10.15 10.15 6.103 6.103 4.347 4.347 0 0 0 -0 -0 0 0 0 0 0 0
0 0 0 0.01 0.01 1.889 6.418 6.418 6.418 7.278 7.278 0 0 0 8.995 8.995 21.28 21.28 15.84 4.908 0 0 10.15 10.15 6.103 6.103 4.347 4.347 0 0 0 -0 -0 0 0 0 0 0 0
0 0 0 0.007 0.007 0.007 2.22 17.34 17.34 10.4 10.4 10.4 10.4 0 8.995 8.995 13.23 13.23 -1.44 7.422 0 0 34 34 12.72 12.72 5.925 5.925 4E-04 4E-04 4E-04 -0 -0 0 0 0 0 0 0
0 0 0 0.007 0.007 0.007 2.22 12.69 12.69 10.94 10.94 1E-04 0 0 8.995 8.995 26.21 8.83 7.422 7.422 0 29.25 17.85 17.85 1.257 1.257 1.278 1.278 4E-04 4E-04 4E-04 0 0 0 0 0 0 0 0
0 0 0 0.007 0.007 0.007 0 7E-05 7E-05 0.025 0.025 1E-04 0 4E-04 0 0 -0.02 8.83 2.662 0 0 12.54 5.753 5.753 5E-04 5E-04 -0 -0 0.001 0.001 0.001 6E-04 6E-04 0 0 0 0 0 0
0 0 0 0 0 0 0 6E-05 6E-05 0.025 1E-04 1E-04 0 4E-04 7E-04 7E-04 0.002 -0 2.662 0 0 12.54 5E-04 5E-04 0 0 0 0 0 0 0 4E-04 4E-04 0 0 0 0 0 0
0 0 0 0 0 0 0 0 0 0 0 0 0 0 0 0 0 0 0 0 0 0 0 0 0 0 0 0 0 0 0 0 0 0 0 0 0 0 0 0 0 0 0 0 0 0 0 0 0 0 0 0 0 0 0 0 0 0 0 0 0 0 0 0 0 0 0 0 0 0 0 0 0 0 0 0 0 0 0
0 0 0 0 0 0 0 0 0 0 0 0 0 0 0 0 0 0 0 0 0 0 0 0 0 0 -0 -0.01 -0.01 -0 -0 -0.02 -0.02 0 0 -0.02 -0.02 -0.02 0 0
0 0 0 0 0 0 0 0 0 0 0 0 0 0 0 0 0 0 0 0 0 0 0 0 0 0 -0 -0.02 -0.02 -0.01 -0.01 -0.02 -0.02 0.001 0.001 -0.03 -0.03 -0.03 0 0
0 0 0 0 0 0 0 0 0 0 0 0 0 0 0 0 0 0 0 0 0 0 0 0 0 0 0 -0 -0 -0.03 -0.03 -0.02 -0.02 -0 -0 -0 -0 -0.01 0 0
0 0 0 0 0 0 0 0 0 0 0 0 0 0 0 0 0 0 0 0 0 0 0 0 0 0 0 -0.02 -0.02 -0.01 -0.01 -0.01 -0.01 -0.02 -0.02 -0 -0.01 -0.01 0 0
0 0 0 0 0 0 0 0 0 0 0 0 0 0 0 0 0 0 0 0 0 0 0 0 0 0 0 0.007 0.007 -0 -0 0.003 0.003 0.002 0.002 -0.01 -0.01 -0.01 0 0
0 0 0 0 0 0 0 0 0 0 0 0 0 0 0 0 0 0 0 0 0 0 0 0 0 0 0 0.007 0.007 0.001 0.001 -0.01 -0.01 1.398 -0.01 -0 -0 -0 0 0
0 0 0 0 0 0 0 0 0 0 0 0 0 0 0 0 0 0 0 0 0 0 0 0 0 0 -0 -0.02 -0.02 -0.02 -0.02 0.003 0.003 -0.01 -0.01 -0 -0 -0 0
0 0 0 0 0 0 0 0 0 0 0 0 0 0 0 0 0 0 0 0 0 0 0 0 0 0 -0 -0 -0 -0.05 -0.05 0.003 -0.03 -0.01 -0.01 -0.06 -0.06 -0.01 -0.01
0 0 0 0 0 0 0 0 0 0 0 0 0 0 0 0 0 0 0 0 0 0 0 0 0 0 -0 -0 -0 -0.05 -0.05 -0.03 -0.03 -0.01 -0.01 -0.06 -0.06 -0.01 -0.01
0 0 0 0 0 0 0 0 0 0 0 0 0 0 0 0 0 0 0 0 0 0 0 0 0 0 -0.02 -0.02 -0.01 -0.01 0 -0.01 -0.01 -0.04 -0.01 -0.01 -0.01 -0.01 0
0 0 0 0 0 0 0 0 0 0 0 0 0 0 0 0 0 0 0 0 0 0 0 0 0 0 -0.02 -0.02 -0.01 0 0 -0.01 -0.01 -0.04 -0.01 -0.01 -0.01 -0.01 0
0 0 0 0 0 0 0 0 0 0 0 0 0 0 -0 -0 0.187 0.187 24.43 15.07 15.07 1.785 21.18 23.36 26.32 8.987 -0.02 -0.01 -0.01 0 0 -0.01 0.005 -0.04 -0.01 -0.01 -0.01 -0.01 0
0 0 0 0 0 0 0 0 0 0 0 0 0 0 -0 -0 0.187 20.49 24.43 15.07 15.07 1.785 21.18 23.36 26.32 8.987 8.987 8.987 -0.01 0 0 0.005 0.005 -0.03 -0.01 -0.01 -0.01 -0.01 0
0 0 0 0 0 0 0 0 0 0 0 0 0 0 -0 25.01 26.92 20.49 24.43 15.07 15.07 1.785 21.18 23.36 26.32 8.987 8.987 23.95 23.95 0 3.376 -0.02 -0.03 -0.03 -0.01 0 0
0 0 0 0 0 0 0 0 0 0 0 0 0 0 25.01 25.01 26.92 20.49 -3.38 -3.38 -3.38 1.785 21.18 29.15 33.66 8.987 8.987 23.95 23.95 -0.03 0 -0.02 1.586 -0.01 -0.01 0 0 0 0
0 0 0 0 0 0 0 0 0 0 0 0 -0 -0 31.79 12.05 -2.31 -2.31 -3.71 -3.71 -3.71 18.87 3.159 11.64 11.91 13.99 20.52 32.21 32.21 -0.03 -0.03 -0 -0 -0.01 -0.01 0 0 0 0
0 0 0 0 0 0 0 0 0 0 0 -0 -0 -0 31.79 12.05 -2.31 -2.31 -1.15 -1.15 -1.15 18.87 3.159 11.64 11.91 13.99 20.52 32.21 32.21 -0.03 0 -0 -0 -0.01 -0.01 -0.01 0 0
0 0 0 0 0 0 0 0 0 -0 -0 -0 -0 53.06 4.911 9.141 -3.74 51.89 51.89 51.89 1.448 1.448 1.396 1.396 -0.11 3.941 17.53 0 -0.12 5.351 5.351 -0 -0.01 -0.01 -0.01 -0.01 0 0
0 0 0 0 0 0 0 -0 -0 -0.01 -0 -0 25.36 25.36 9.141 -3.53 40.76 40.76 40.76 1.448 1.448 1.396 1.396 -0.11 5.189 17.53 0 -0.12 5.351 5.351 -0.01 -0.01 0 0
0 0 0 0 0 -0 -0 -0 -0.01 -0.01 -0 25.36 0 0 -3.53 40.76 40.76 40.76 -0.39 -0.39 -0.42 0 5.189 5.189 6.344 -0.26 -0.21 -0.21 -0.01 -0.01 0 0 0 0
6.189 6.189 7.062 7.062 -0 -0 -0 -0 -0 0 -0.26 -0.26 -0.8 -0.8 -0.05 -0.05 -0.05 0 -0.08 -0.08 -0.08 3.88 3.88 6.344 -0.68 -0.68 -0.99 -0.01 -0.01 0 0 0 0 0 0
0 -0 0 6.189 6.189 6.189 7.062 -0 -0 -0 -0 -0 -0 0 4.204 4.204 0.771 -0.15 -0.15 -0.1 -0.1 -0.08 -0.08 -0.08 -0.08 3.88 0 -0.17 -0.68 -0.68 -0.99 -0.01 -0.01 0 0 0 0 0 0
0 -0 0 6.873 6.873 6.873 -0.06 -0.06 -0.06 0 0 -0 -0 0 0 4.204 0.771 -0.15 -0.15 -0.1 -0.1 0.906 0.906 0.461 0.461 -0.04 -0.04 -0.26 -0.26 -0.65 5.318 -0.01 -0.01 0 0 0 0 0 0
0 0.012 0.012 6.873 6.873 6.873 -0.06 -0.06 -0.06 0 0 0 0 -0.07 -0.07 -0.16 -0.16 -0.16 -0.05 -0.05 7.238 -0.08 -0.05 -0.05 -0.11 -0.11 -0.36 0.302 0.302 -0.65 5.318 -0.01 -0.01 0 0 0 0 0 0
0 0 -0 -0.01 -0.01 -0.01 -0.06 -0.06 -0.06 0.208 0 0 0 0 1.14 1.14 1.726 1.595 0 0 7.238 -1.95 3.25 -1.41 0.141 0.141 -0.36 -0.28 -0.28 0 0.816 -0.01 -0.01 0 0 0 0 0 0
0 0 -0 -0.01 -0.01 -0.01 0 -0 0 0.208 0 0 0 0 -4.09 -4.09 -0.04 -0.04 0 0 2.018 2.378 3.25 0.015 0.055 0.347 0.277 0.196 0.196 0.816 0 0 0 0 0 0 0 0 0
0 0 -0 -0.01 -0 -0 -0 -0 0 0.208 0 0 -1.58 0 -4.09 0 -0.04 -0.04 -0.1 0 2.018 2.378 6.7 0.891 0.055 0.347 0.196 0.816 0 0 0 0 0 0 0 0 0
0 -0.09 -0.11 -0 -0 -0 -0 -0 -0.02 0 0 1.599 1.041 0.282 1.856 3.621 3.621 6.023 6.023 11.94 23.2 6.597 6.597 -0.1 -0.1 0.816 0 0 0 0 0 0 0 0 0
0 -0.09 -0.11 -0.03 -0.03 -0.03 -0.03 -0.03 -0.02 0 1.556 1.556 4.672 0.709 0.494 0.494 3.621 6.023 6.023 11.94 11.94 9.705 9.705 1.214 1.214 -0.1 -0.1 -0.1 0 0 0 0 0 0 0 0 0 0
0 -0.09 -0.09 -0.03 -0.03 -0.03 0 0 0 0 1.556 1.556 4.672 0.709 0.494 0.494 12.83 12.83 18.29 133.3 295.9 16.37 9.96 1.214 0.041 -0.1 -0.06 -0.06 0 0 0 0 0 0 0 0 0 0 0
0 -0.03 -0.03 -0.04 -0.04 -0.04 0 0 0 0 0.124 0.124 0.51 -0.13 -0.13 12.83 18.9 26.36 125 1.007 1.012 0.538 0.538 0 0 0 0 0 0 0 0 0 0 0 0 0
0 0.044 0.044 12.6 12.6 -0.04 -0.58 -0.58 -0.58 -1.31 0.124 0.124 0.51 -0.13 -0.13 -0.09 4.263 6.727 1.007 1.724 1.012 0.538 0.538 0 0 0 0 0 0 0 0 0 0 0 0 0
0 0.044 0.044 37.41 37.41 -0.04 0.098 0.098 0.098 1.552 1.094 0.798 -0.22 -0.16 -0.16 -0.09 -0.05 14.37 9.975 6.727 3.503 3.503 1.012 0.538 0.538 0 0 0 0 0 0 0 0 0 0 0 0 0
0 13.87 13.87 37.41 37.41 14.26 -2.58 -2.58 -2.58 11.63 1.094 0.798 0.734 -0.16 -0.16 1.322 14.37 15.7 9.975 6.727 3.503 3.503 3.098 1.077 1.077 0 0 0 0 0 0 0 0 0 0 0 0 0
0 0 24.53 11.09 14.26 14.26 -2.58 -2.58 -2.58 -1.26 0.802 0.802 0.999 0.999 -0.1 -0.1 0 3.769 1.767 -0.04 3.785 3.785 3.661 3.661 3.661 3.751 -0.1 -0.1 0 0 0 -0.01 -0.01 0 0 0 0 0 0
0 0 0 20.2 20.47 20.47 -1.17 -1.17 -1.17 -0.06 -0.04 0 0.07 0.876 0 3.769 1.767 -0.03 -0.01 3.785 2.238 2.238 3.751 0 -0.1 -0.1 0 0 0 -0.01 -0.01 0 0 0 0 0 0
0 0 0 20.2 20.47 20.47 -0.71 -0.71 -0.71 0.002 -0.04 -0.04 -0.08 1.638 1.638 0 2.957 0 -0.03 -0.01 0.222 4.48 2.238 0 0 -0 -0 0 0 0 -0.05 -0.01 0 0 0 0 0 0
0 0 0 20.5 19.48 19.48 -1 -1 0.462 -0.21 0.494 0.494 -1.38 -0.08 1.638 19.49 19.49 0.985 0.985 0.009 -0.02 -0.02 0 0 0 0 0 0 0 0 0 -0.01 -0.01 0 0 0 0 0 0
0 0 0 20.5 19.48 19.48 -1 -1 0.462 0.494 0.494 -1.38 -0.08 3.507 0 6.064 0.985 0.985 0.009 0 0 0 0 0 0 0 0 0 0 0 -0.01 -0.01 0 0 0 0 0 0
0 0 0 11.96 11.96 19.48 2.775 23.14 -1.75 0.494 -2.7 -0.08 1.793 8.741 8.741 0 1.568 0.018 0 0 0 -1.4 0 0 3.16 3.16 11.94 11.94 0 0 -0.01 0 0 0 0 0 0
0 0 0 11.96 11.96 6.689 2.775 23.14 -1.75 -1.75 -2.7 -1.13 -1.13 0.044 -2.35 -2.35 -2.17 -2.17 0 -0.01 -0.01 -1.33 -1.4 0 0 3.16 0.148 11.94 11.94 11.94 12.2 12.2 0 0 0 0 0 0
0 0 0 11.96 -0 6.689 6.689 9.843 9.843 -1.75 -1.75 -1.13 0.044 0.044 -2.35 -3.14 -3.9 -3.9 0 0 0 -1.33 -1.33 0 0 0.148 0.148 14.8 14.8 14.8 17.42 12.2 0 0 0 0 0 0
0 0 0 -0 -0 6.689 6.689 6.689 9.843 9.843 -1.19 -1.13 -1.13 0.293 0.293 -3.14 -3.14 -3.9 -2.42 0.85 -0.01 -0.01 -1.82 0 -1.91 -1.91 -1.3 0.148 14.8 14.8 14.8 17.42 12.8 0 0 0 0 0 0
0 0 0 -0 0 6.689 6.689 11.95 11.95 9.843 -1.19 -0.68 -1.44 -2.52 0.293 -2.03 -2.03 -2.42 -2.42 0.85 -0 -0 -1.67 -1.67 0 7.72 -2.68 -1.6 21.64 21.64 21.64 17.42 12.8 0 0 0 0 0 0
0 0 0 0 0 6.689 11.95 11.95 11.95 12.92 12.92 12.92 23.86 23.86 29.45 0.214 -3.12 99.36 -3.29 -2.54 0 0 -1.8 -1.8 0 9.707 -2.22 -1.78 19.31 12.76 12.76 7.81 7.81 0 0 0 0 0 0
0 0 0 -0 -0 5.653 5.653 5.653 13.16 13.16 12.92 29.58 34.71 15.98 15.98 -0.08 -1.63 -2.54 -2.24 -2.24 0 0 -1.1 -1.74 -1.74 -1.56 -2.22 -1.78 19.31 12.76 12.76 7.81 -0 0 0 0 0 0 0
0 0 0 0 0 5.653 5.653 13.16 13.16 13.16 12.92 21.86 26.75 11.09 11.09 -0.08 -0.08 -0.08 -2.24 -2.24 0 0 -1.1 -1.11 -1.3 -1.3 -1.03 -1.03 19.31 12.76 12.76 -0 -0 0 0 0 0 0 0
0 0 0 0.01 0.01 5.653 5.653 10.25 10.25 0 21.86 26.75 11.09 11.09 -0.08 -0.08 -0.08 28.08 5.769 5.769 0 0 21.14 21.14 9.67 9.67 12.74 12.74 0 0 0 -0 -0 0 0 0 0 0 0
0 0 0 0.01 0.01 5.653 10.25 10.25 10.25 16.94 16.94 0 0 5.952 11.1 11.1 28.08 28.08 16.71 5.769 0 0 21.14 21.14 9.67 9.67 12.74 12.74 0 0 0 -0 -0 0 0 0 0 0 0
0 0 0 0.007 0.007 0.007 8.571 17.22 17.22 11.19 11.19 11.19 11.19 5.952 11.1 11.1 37.91 37.91 0.154 7.822 0 0 42.83 42.83 13.68 13.68 6.142 6.142 4E-04 4E-04 4E-04 -0 -0 0 0 0 0 0 0
0 0 0 0.007 0.007 0.007 8.571 12.65 12.65 14.9 14.9 1E-04 0 5.952 11.1 11.1 37.01 24.04 7.822 7.822 0 32.43 26.75 26.75 5.68 5.68 5.774 5.774 4E-04 4E-04 4E-04 0 0 0 0 0 0 0 0
0 0 0 0.007 0.007 0.007 0 7E-05 7E-05 0.025 0.025 1E-04 0 4E-04 0 0 -0.02 24.04 8.046 0 0 13.49 5.942 5.942 5E-04 5E-04 -0 -0 0.001 0.001 0.001 6E-04 6E-04 0 0 0 0 0 0
0 0 0 0 0 0 0 6E-05 6E-05 0.025 1E-04 1E-04 0 4E-04 7E-04 7E-04 0.002 -0 8.046 0 0 13.49 5E-04 5E-04 0 0 0 0 0 0 0 4E-04 4E-04 0 0 0 0 0 0
0 0 0 0 0 0 0 0 0 0 0 0 0 0 0 0 0 0 0 0 0 0 0 0 0 0 0 0 0 0 0 0 0 0 0 0 0 0 0
Base Case
High Scenario
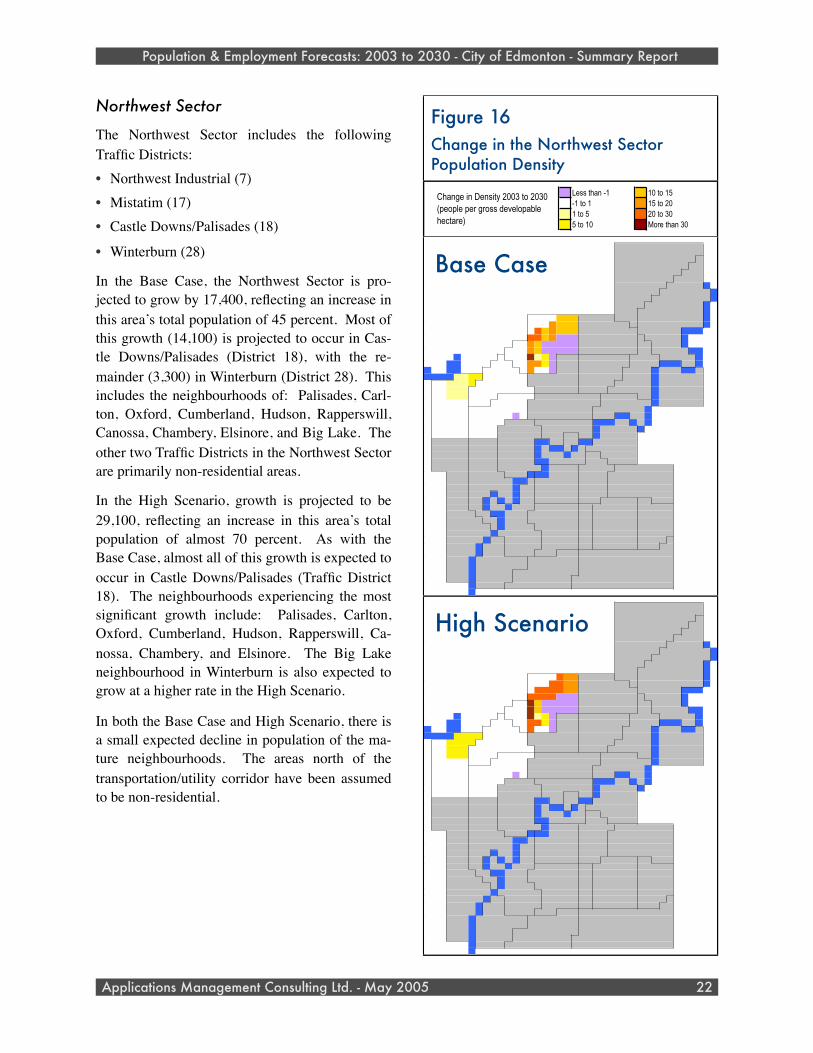
Northwest Sector
The Northwest Sector includes the following Traffic Districts:• Northwest Industrial (7)• Mistatim (17)• Castle Downs/Palisades (18)
• Winterburn (28)
In the Base Case, the Northwest Sector is pro-jected to grow by 17,400, reflecting an increase in this area’s total population of 45 percent. Most of this growth (14,100) is projected to occur in Cas-tle Downs/Palisades (District 18), with the re-mainder (3,300) in Winterburn (District 28). This includes the neighbourhoods of: Palisades, Carl-ton, Oxford, Cumberland, Hudson, Rapperswill, Canossa, Chambery, Elsinore, and Big Lake. The other two Traffic Districts in the Northwest Sector are primarily non-residential areas.
In the High Scenario, growth is projected to be 29,100, reflecting an increase in this area’s total population of almost 70 percent. As with the Base Case, almost all of this growth is expected to occur in Castle Downs/Palisades (Traffic District 18). The neighbourhoods experiencing the most significant growth include: Palisades, Carlton, Oxford, Cumberland, Hudson, Rapperswill, Ca-nossa, Chambery, and Elsinore. The Big Lake neighbourhood in Winterburn is also expected to grow at a higher rate in the High Scenario.
In both the Base Case and High Scenario, there is a small expected decline in population of the ma-ture neighbourhoods. The areas north of the transportation/utility corridor have been assumed to be non-residential.
Population & Employment Forecasts: 2003 to 2030 - City of Edmonton - Summary Report
Applications Management Consulting Ltd. - May 2005 22
Figure 16Change in the Northwest Sector Population Density
Less than -1 10 to 15-1 to 1 15 to 201 to 5 20 to 305 to 10 More than 30
Change in Density 2003 to 2030 (people per gross developable hectare)
0 0 0 0 0 0 0 0 0 0 0 0 0 0 0 0 0 0 0 0 0 0 0 0 0 0 0 0 0 0 0 0 0 0 0 0 0 0 0 0
0 0 0 0 0 0 0 0 0 0 0 0 0 0 0 0 0 0 0 0 0 0 0 0 0 0 -0.01 -0.01 -0.01 -0 -0 -0.02 -0.02 0 0 -0.02 -0.02 -0.02 0 0
0 0 0 0 0 0 0 0 0 0 0 0 0 0 0 0 0 0 0 0 0 0 0 0 0 0 -0.01 -0.02 -0.02 -0.02 -0.02 -0.02 -0.02 -0 -0 -0.04 -0.04 -0.04 0 0
0 0 0 0 0 0 0 0 0 0 0 0 0 0 0 0 0 0 0 0 0 0 0 0 0 0 0 -0.01 -0.01 -0.04 -0.04 -0.02 -0.02 -0.01 -0.01 -0.01 -0.01 -0.01 0 0
0 0 0 0 0 0 0 0 0 0 0 0 0 0 0 0 0 0 0 0 0 0 0 0 0 0 0 -0.02 -0.02 -0.01 -0.01 -0.01 -0.01 -0.02 -0.02 -0.01 -0.01 -0.01 0 0
0 0 0 0 0 0 0 0 0 0 0 0 0 0 0 0 0 0 0 0 0 0 0 0 0 0 0 0.003 0.003 -0 -0 0.001 0.001 -0 -0 -0.01 -0.01 -0.01 0 0
0 0 0 0 0 0 0 0 0 0 0 0 0 0 0 0 0 0 0 0 0 0 0 0 0 0 0 0.002 0.002 -0 -0 -0.01 -0.01 0.75 -0.02 -0 -0 -0 0 0
0 0 0 0 0 0 0 0 0 0 0 0 0 0 0 0 0 0 0 0 0 0 0 0 0 0 -0 -0.02 -0.02 -0.03 -0.03 6E-04 6E-04 -0.02 -0.01 -0 -0 -0 0
0 0 0 0 0 0 0 0 0 0 0 0 0 0 0 0 0 0 0 0 0 0 0 0 0 0 -0 -0 -0 -0.06 -0.06 6E-04 -0.04 -0.02 -0.01 -0.06 -0.06 -0.02 -0.02
0 0 0 0 0 0 0 0 0 0 0 0 0 0 0 0 0 0 0 0 0 0 0 0 0 0 -0 -0 -0 -0.06 -0.06 -0.04 -0.04 -0.01 -0.01 -0.06 -0.06 -0.02 -0.02
0 0 0 0 0 0 0 0 0 0 0 0 0 0 0 0 0 0 0 0 0 0 0 0 0 0 -0.02 -0.02 -0.01 -0.01 0 -0.01 -0.01 -0.05 -0.01 -0.01 -0.02 -0.02 0
0 0 0 0 0 0 0 0 0 0 0 0 0 0 0 0 0 0 0 0 0 0 0 0 0 0 -0.02 -0.02 -0.01 0 0 -0.01 -0.01 -0.05 -0.01 -0.02 -0.02 -0.02 0
0 0 0 0 0 0 0 0 0 0 0 0 0 0 7E-04 7E-04 0.098 0.098 10.96 11.64 11.64 0.864 18.35 16.62 18.9 4.473 -0.02 -0.01 -0.01 0 0 -0.01 0.002 -0.05 -0.02 -0.02 -0.02 -0.02 0
0 0 0 0 0 0 0 0 0 0 0 0 0 0 7E-04 7E-04 0.098 18.04 10.96 11.64 11.64 0.864 18.35 16.62 18.9 4.473 4.473 4.473 -0.01 0 0 0.002 0.002 -0.05 -0.02 -0.02 -0.02 -0.02 0
0 0 0 0 0 0 0 0 0 0 0 0 0 0 7E-04 24.76 11.37 18.04 10.96 11.64 11.64 0.864 18.35 16.62 18.9 4.473 4.473 17.23 17.23 0 2.424 -0.02 -0.05 -0.05 -0.02 0 0
0 0 0 0 0 0 0 0 0 0 0 0 0 0 24.76 24.76 11.37 18.04 -4.98 -4.98 -4.98 0.864 18.35 27.54 31.25 4.473 4.473 17.23 17.23 -0.05 0 -0.02 1.05 -0.01 -0.02 0 0 0 0
0 0 0 0 0 0 0 0 0 0 0 0 -0 -0 15.33 12.44 -3.72 -3.72 -5.39 -5.39 -5.39 14.76 0.479 5.795 9.949 11.17 17.74 11.15 11.15 -0.05 -0.05 -0 -0 -0.01 -0.01 0 0 0 0
0 0 0 0 0 0 0 0 0 0 0 -0 -0 -0 15.33 12.44 -3.72 -3.72 -1.73 -1.73 -1.73 14.76 0.479 5.795 9.949 11.17 17.74 11.15 11.15 -0.05 0 -0 -0 -0.01 -0.01 -0.01 0 0
0 0 0 0 0 0 0 0 0 -0 -0 -0.01 -0.01 53.64 1.895 8.037 -5.35 46.83 46.83 46.83 0.467 0.467 0.636 0.636 -0.11 3.984 15.28 0 -0.86 2.194 2.194 -0 -0.01 -0.01 -0.01 -0.01 0 0
0 0 0 0 0 0 0 -0 -0 -0.02 -0.01 -0.01 15.92 15.92 8.037 -5.32 35.05 35.05 35.05 0.467 0.467 0.636 0.636 -0.11 5.249 15.28 0 -0.86 2.194 2.194 -0.01 -0.01 0 0
0 0 0 0 0 -0 -0 -0 -0.02 -0.02 -0.01 15.92 0 0 -5.32 35.05 35.05 35.05 -0.39 -0.39 -0.42 0 5.249 5.249 4.26 -1.26 -1.12 -1.12 -0.01 -0.01 0 0 0 0
3.677 3.677 7.144 7.144 -0 -0 -0 -0.01 -0.01 0 -1.46 -1.46 -0.98 -0.98 -1.52 -1.52 -1.52 0 -0.55 -0.48 -0.48 3.723 3.723 4.26 -1.43 -1.43 -2.35 -0.01 -0.01 0 0 0 0 0 0
0 -0 0 3.677 3.677 3.677 7.144 -0 -0 -0 -0 -0.01 -0.01 0 2.804 2.804 0.141 -2.63 -2.63 -1.82 -1.82 -0.55 -0.55 -0.48 -0.48 3.723 0 -1.16 -1.43 -1.43 -2.35 -0.01 -0.01 0 0 0 0 0 0
0 -0 0 3.396 3.396 3.396 -0.08 -0.08 -0.08 0 0 -0.01 -0.01 0 0 2.804 0.141 -2.63 -2.63 -1.82 -1.82 -0.12 -0.12 -0.09 -0.09 -0.08 -0.08 -0.92 -0.92 -1.65 3.761 -0.01 -0.01 0 0 0 0 0 0
0 0.012 0.012 3.396 3.396 3.396 -0.08 -0.08 -0.08 0 0 0 0 -0.07 -0.07 -0.17 -0.17 -0.17 -0.07 -0.07 5.015 -0.11 -0.07 -0.07 -0.14 -0.14 -3.21 -2.2 -2.2 -1.65 3.761 -0.01 -0.01 0 0 0 0 0 0
0 0 -0.01 -0.02 -0.02 -0.02 -0.08 -0.08 -0.08 0.111 0 0 0 0 0.689 0.689 1.123 1.226 0 0 5.015 -3.35 2.291 -2.04 -3.08 -3.08 -3.21 -3.02 -3.02 -2.55 0.17 -0.01 -0.01 0 0 0 0 0 0
0 0 -0.01 -0.02 -0.02 -0.02 0 -0 0 0.111 0 0 0 0 -4.46 -4.46 -0.04 -0.04 0 0 2.118 1.215 2.291 0.006 0.055 0.347 -0.1 -0.2 -0.2 0.17 0 0 0 0 0 0 0 0 0
0 0 -0.01 -0.02 -0 -0 -0 -0 0 0.111 0 0 -1.72 0 -4.46 0 -0.04 -0.04 -0.14 0 2.118 1.215 5.301 0.891 0.055 0.347 -0.2 0.17 0 0 0 0 0 0 0 0 0
0 -0.12 -0.11 -0 -0 -0 -0 -0 -0.02 0 0 1.323 -0.37 0.037 0.417 3.529 3.529 3.913 3.913 6.316 19.46 0.608 0.608 -0.1 -0.1 0.17 0 0 0 0 0 0 0 0 0
0 -0.12 -0.11 -0.04 -0.04 -0.04 -0.03 -0.03 -0.02 0 1.673 1.673 2.038 0.751 0.03 0.03 3.529 3.913 3.913 6.316 6.316 2.295 2.295 1.287 1.287 -0.1 -0.1 -0.1 0 0 0 0 0 0 0 0 0 0
0 -0.11 -0.11 -0.04 -0.04 -0.04 0 0 0 0 1.673 1.673 2.038 0.751 0.03 0.03 5.226 5.226 18.11 94.54 162 4.881 6.032 1.287 0.041 -0.1 -0.06 -0.06 0 0 0 0 0 0 0 0 0 0 0
0 -0.04 -0.04 -0.05 -0.05 -0.05 0 0 0 0 0.124 0.124 0.51 -0.13 -0.13 5.226 11.92 26.5 75.39 0.957 1.11 -0.96 -0.96 0 0 0 0 0 0 0 0 0 0 0 0 0
0 0.044 0.044 11.74 11.74 -0.05 -0.68 -0.68 -0.68 -2.08 0.124 0.124 0.51 -0.13 -0.13 -0.09 1.962 4.625 0.957 1.537 1.11 -0.96 -0.96 0 0 0 0 0 0 0 0 0 0 0 0 0
0 0.044 0.044 17.93 17.93 -0.05 0.098 0.098 0.098 1.552 0.771 0.081 -0.22 -0.16 -0.16 -0.09 -0.05 12.94 7.798 4.625 1.085 1.085 1.11 -0.96 -0.96 0 0 0 0 0 0 0 0 0 0 0 0 0
0 14.02 14.02 17.93 17.93 14.57 -4.71 -4.71 -4.71 11.32 0.771 0.081 0.771 -0.16 -0.16 0.774 12.94 12.3 7.798 4.625 1.085 1.085 -0.24 1.065 1.065 0 0 0 0 0 0 0 0 0 0 0 0 0
0 0 23.43 10.79 14.57 14.57 -4.71 -4.71 -4.71 -1.38 0.797 0.797 -0.08 -0.08 -0.1 -0.1 0 0 0.802 -0.08 2.281 2.281 2.524 2.524 2.524 3.755 -0.15 -0.15 0 0 0 -0.01 -0.01 0 0 0 0 0 0
0 0 0 18.48 20.03 20.03 -1.28 -1.28 -1.28 -0.15 -0.04 0 0.07 0.876 0 0 0.802 -0.06 -0.01 2.281 1.232 1.232 3.755 0 -0.15 -0.15 0 0 0 -0.01 -0.01 0 0 0 0 0 0
0 0 0 18.48 20.03 20.03 -3.41 -3.41 -3.41 -1.78 -0.04 -0.04 -0.08 0.181 0.181 0 -0.12 0 -0.06 -0.01 0.073 2.813 1.232 0 0 -0 -0 0 0 0 -0.05 -0.01 0 0 0 0 0 0
0 0 0 13.42 6.386 6.386 -2.68 -2.68 0.462 -0.21 0.466 0.466 -2.15 -0.08 0.181 9.994 9.994 0.734 0.734 0.003 -0.02 -0.02 0 0 0 0 0 0 0 0 0 -0.01 -0.01 0 0 0 0 0 0
0 0 0 13.42 6.386 6.386 -2.68 -2.68 0.462 0.466 0.466 -2.15 -0.08 3.108 0 4.822 0.734 0.734 0.003 0 0 0 0 0 0 0 0 0 0 0 -0.01 -0.01 0 0 0 0 0 0
0 0 0 7.298 7.298 6.386 2.06 10.65 -2.23 0.466 -4.03 -0.08 0.005 5.324 5.324 0 0.293 0.006 0 0 0 -1.49 0 0 1.687 1.687 9.409 9.409 0 0 -0.01 0 0 0 0 0 0
0 0 0 7.298 7.298 4.141 2.06 10.65 -2.23 -2.23 -4.03 -1.45 -1.45 0.044 -2.96 -2.96 -2.36 -2.36 0 -0.01 -0.01 -1.41 -1.49 0 0 1.687 -1.44 9.409 9.409 9.409 7.435 7.435 0 0 0 0 0 0
0 0 0 7.298 -0 4.141 4.141 4.701 4.701 -2.23 -2.23 -1.45 0.044 0.044 -2.96 -4.84 -4.64 -4.64 0 0 0 -1.41 -1.41 0 0 -1.44 -1.44 11.83 11.83 11.83 11.61 7.435 0 0 0 0 0 0
0 0 0 -0 -0 4.141 4.141 4.141 4.701 4.701 -1.51 -1.45 -1.45 -0.13 -0.13 -4.84 -4.84 -4.64 -2.88 0.85 -0.02 -0.02 -2.64 0 -2.69 -2.69 -2.16 -1.44 11.83 11.83 11.83 11.61 12.95 0 0 0 0 0 0
0 0 0 -0 0 4.141 4.141 7.291 7.291 4.701 -1.51 -0.76 -1.54 -2.58 -0.13 -2.7 -2.7 -2.88 -2.88 0.85 -0 -0 -2.56 -2.56 0 3.551 -3.52 -2.51 12.31 12.31 12.31 11.61 12.95 0 0 0 0 0 0
0 0 0 0 0 4.141 7.291 7.291 7.291 12.64 12.64 12.64 19.74 19.74 18.62 0.214 -6.61 88.2 -4.58 -2.95 0 0 -2.58 -2.58 0 7.682 -3.25 -2.72 12.51 12.24 12.24 7.264 7.264 0 0 0 0 0 0
0 0 0 -0 -0 1.889 1.889 1.889 7.814 7.814 12.64 29.33 29.58 15.96 15.96 -0.8 -2.46 -2.95 -2.54 -2.54 0 0 -1.17 -2.48 -2.48 -2.31 -3.25 -2.72 12.51 12.24 12.24 7.264 -0 0 0 0 0 0 0
0 0 0 0 0 1.889 1.889 7.814 7.814 7.814 12.64 7.484 12.78 6.296 6.296 -0.8 -0.8 -0.8 -2.54 -2.54 0 0 -1.17 -1.65 -1.9 -1.9 -1.64 -1.64 12.51 12.24 12.24 -0 -0 0 0 0 0 0 0
0 0 0 0.01 0.01 1.889 1.889 6.418 6.418 0 7.484 12.78 6.296 6.296 -0.8 -0.8 -0.8 21.28 4.908 4.908 0 0 10.15 10.15 6.103 6.103 4.347 4.347 0 0 0 -0 -0 0 0 0 0 0 0
0 0 0 0.01 0.01 1.889 6.418 6.418 6.418 7.278 7.278 0 0 0 8.995 8.995 21.28 21.28 15.84 4.908 0 0 10.15 10.15 6.103 6.103 4.347 4.347 0 0 0 -0 -0 0 0 0 0 0 0
0 0 0 0.007 0.007 0.007 2.22 17.34 17.34 10.4 10.4 10.4 10.4 0 8.995 8.995 13.23 13.23 -1.44 7.422 0 0 34 34 12.72 12.72 5.925 5.925 4E-04 4E-04 4E-04 -0 -0 0 0 0 0 0 0
0 0 0 0.007 0.007 0.007 2.22 12.69 12.69 10.94 10.94 1E-04 0 0 8.995 8.995 26.21 8.83 7.422 7.422 0 29.25 17.85 17.85 1.257 1.257 1.278 1.278 4E-04 4E-04 4E-04 0 0 0 0 0 0 0 0
0 0 0 0.007 0.007 0.007 0 7E-05 7E-05 0.025 0.025 1E-04 0 4E-04 0 0 -0.02 8.83 2.662 0 0 12.54 5.753 5.753 5E-04 5E-04 -0 -0 0.001 0.001 0.001 6E-04 6E-04 0 0 0 0 0 0
0 0 0 0 0 0 0 6E-05 6E-05 0.025 1E-04 1E-04 0 4E-04 7E-04 7E-04 0.002 -0 2.662 0 0 12.54 5E-04 5E-04 0 0 0 0 0 0 0 4E-04 4E-04 0 0 0 0 0 0
0 0 0 0 0 0 0 0 0 0 0 0 0 0 0 0 0 0 0 0 0 0 0 0 0 0 0 0 0 0 0 0 0 0 0 0 0 0 0 0 0 0 0 0 0 0 0 0 0 0 0 0 0 0 0 0 0 0 0 0 0 0 0 0 0 0 0 0 0 0 0 0 0 0 0 0 0 0 0
0 0 0 0 0 0 0 0 0 0 0 0 0 0 0 0 0 0 0 0 0 0 0 0 0 0 -0 -0.01 -0.01 -0 -0 -0.02 -0.02 0 0 -0.02 -0.02 -0.02 0 0
0 0 0 0 0 0 0 0 0 0 0 0 0 0 0 0 0 0 0 0 0 0 0 0 0 0 -0 -0.02 -0.02 -0.01 -0.01 -0.02 -0.02 0.001 0.001 -0.03 -0.03 -0.03 0 0
0 0 0 0 0 0 0 0 0 0 0 0 0 0 0 0 0 0 0 0 0 0 0 0 0 0 0 -0 -0 -0.03 -0.03 -0.02 -0.02 -0 -0 -0 -0 -0.01 0 0
0 0 0 0 0 0 0 0 0 0 0 0 0 0 0 0 0 0 0 0 0 0 0 0 0 0 0 -0.02 -0.02 -0.01 -0.01 -0.01 -0.01 -0.02 -0.02 -0 -0.01 -0.01 0 0
0 0 0 0 0 0 0 0 0 0 0 0 0 0 0 0 0 0 0 0 0 0 0 0 0 0 0 0.007 0.007 -0 -0 0.003 0.003 0.002 0.002 -0.01 -0.01 -0.01 0 0
0 0 0 0 0 0 0 0 0 0 0 0 0 0 0 0 0 0 0 0 0 0 0 0 0 0 0 0.007 0.007 0.001 0.001 -0.01 -0.01 1.398 -0.01 -0 -0 -0 0 0
0 0 0 0 0 0 0 0 0 0 0 0 0 0 0 0 0 0 0 0 0 0 0 0 0 0 -0 -0.02 -0.02 -0.02 -0.02 0.003 0.003 -0.01 -0.01 -0 -0 -0 0
0 0 0 0 0 0 0 0 0 0 0 0 0 0 0 0 0 0 0 0 0 0 0 0 0 0 -0 -0 -0 -0.05 -0.05 0.003 -0.03 -0.01 -0.01 -0.06 -0.06 -0.01 -0.01
0 0 0 0 0 0 0 0 0 0 0 0 0 0 0 0 0 0 0 0 0 0 0 0 0 0 -0 -0 -0 -0.05 -0.05 -0.03 -0.03 -0.01 -0.01 -0.06 -0.06 -0.01 -0.01
0 0 0 0 0 0 0 0 0 0 0 0 0 0 0 0 0 0 0 0 0 0 0 0 0 0 -0.02 -0.02 -0.01 -0.01 0 -0.01 -0.01 -0.04 -0.01 -0.01 -0.01 -0.01 0
0 0 0 0 0 0 0 0 0 0 0 0 0 0 0 0 0 0 0 0 0 0 0 0 0 0 -0.02 -0.02 -0.01 0 0 -0.01 -0.01 -0.04 -0.01 -0.01 -0.01 -0.01 0
0 0 0 0 0 0 0 0 0 0 0 0 0 0 -0 -0 0.187 0.187 24.43 15.07 15.07 1.785 21.18 23.36 26.32 8.987 -0.02 -0.01 -0.01 0 0 -0.01 0.005 -0.04 -0.01 -0.01 -0.01 -0.01 0
0 0 0 0 0 0 0 0 0 0 0 0 0 0 -0 -0 0.187 20.49 24.43 15.07 15.07 1.785 21.18 23.36 26.32 8.987 8.987 8.987 -0.01 0 0 0.005 0.005 -0.03 -0.01 -0.01 -0.01 -0.01 0
0 0 0 0 0 0 0 0 0 0 0 0 0 0 -0 25.01 26.92 20.49 24.43 15.07 15.07 1.785 21.18 23.36 26.32 8.987 8.987 23.95 23.95 0 3.376 -0.02 -0.03 -0.03 -0.01 0 0
0 0 0 0 0 0 0 0 0 0 0 0 0 0 25.01 25.01 26.92 20.49 -3.38 -3.38 -3.38 1.785 21.18 29.15 33.66 8.987 8.987 23.95 23.95 -0.03 0 -0.02 1.586 -0.01 -0.01 0 0 0 0
0 0 0 0 0 0 0 0 0 0 0 0 -0 -0 31.79 12.05 -2.31 -2.31 -3.71 -3.71 -3.71 18.87 3.159 11.64 11.91 13.99 20.52 32.21 32.21 -0.03 -0.03 -0 -0 -0.01 -0.01 0 0 0 0
0 0 0 0 0 0 0 0 0 0 0 -0 -0 -0 31.79 12.05 -2.31 -2.31 -1.15 -1.15 -1.15 18.87 3.159 11.64 11.91 13.99 20.52 32.21 32.21 -0.03 0 -0 -0 -0.01 -0.01 -0.01 0 0
0 0 0 0 0 0 0 0 0 -0 -0 -0 -0 53.06 4.911 9.141 -3.74 51.89 51.89 51.89 1.448 1.448 1.396 1.396 -0.11 3.941 17.53 0 -0.12 5.351 5.351 -0 -0.01 -0.01 -0.01 -0.01 0 0
0 0 0 0 0 0 0 -0 -0 -0.01 -0 -0 25.36 25.36 9.141 -3.53 40.76 40.76 40.76 1.448 1.448 1.396 1.396 -0.11 5.189 17.53 0 -0.12 5.351 5.351 -0.01 -0.01 0 0
0 0 0 0 0 -0 -0 -0 -0.01 -0.01 -0 25.36 0 0 -3.53 40.76 40.76 40.76 -0.39 -0.39 -0.42 0 5.189 5.189 6.344 -0.26 -0.21 -0.21 -0.01 -0.01 0 0 0 0
6.189 6.189 7.062 7.062 -0 -0 -0 -0 -0 0 -0.26 -0.26 -0.8 -0.8 -0.05 -0.05 -0.05 0 -0.08 -0.08 -0.08 3.88 3.88 6.344 -0.68 -0.68 -0.99 -0.01 -0.01 0 0 0 0 0 0
0 -0 0 6.189 6.189 6.189 7.062 -0 -0 -0 -0 -0 -0 0 4.204 4.204 0.771 -0.15 -0.15 -0.1 -0.1 -0.08 -0.08 -0.08 -0.08 3.88 0 -0.17 -0.68 -0.68 -0.99 -0.01 -0.01 0 0 0 0 0 0
0 -0 0 6.873 6.873 6.873 -0.06 -0.06 -0.06 0 0 -0 -0 0 0 4.204 0.771 -0.15 -0.15 -0.1 -0.1 0.906 0.906 0.461 0.461 -0.04 -0.04 -0.26 -0.26 -0.65 5.318 -0.01 -0.01 0 0 0 0 0 0
0 0.012 0.012 6.873 6.873 6.873 -0.06 -0.06 -0.06 0 0 0 0 -0.07 -0.07 -0.16 -0.16 -0.16 -0.05 -0.05 7.238 -0.08 -0.05 -0.05 -0.11 -0.11 -0.36 0.302 0.302 -0.65 5.318 -0.01 -0.01 0 0 0 0 0 0
0 0 -0 -0.01 -0.01 -0.01 -0.06 -0.06 -0.06 0.208 0 0 0 0 1.14 1.14 1.726 1.595 0 0 7.238 -1.95 3.25 -1.41 0.141 0.141 -0.36 -0.28 -0.28 0 0.816 -0.01 -0.01 0 0 0 0 0 0
0 0 -0 -0.01 -0.01 -0.01 0 -0 0 0.208 0 0 0 0 -4.09 -4.09 -0.04 -0.04 0 0 2.018 2.378 3.25 0.015 0.055 0.347 0.277 0.196 0.196 0.816 0 0 0 0 0 0 0 0 0
0 0 -0 -0.01 -0 -0 -0 -0 0 0.208 0 0 -1.58 0 -4.09 0 -0.04 -0.04 -0.1 0 2.018 2.378 6.7 0.891 0.055 0.347 0.196 0.816 0 0 0 0 0 0 0 0 0
0 -0.09 -0.11 -0 -0 -0 -0 -0 -0.02 0 0 1.599 1.041 0.282 1.856 3.621 3.621 6.023 6.023 11.94 23.2 6.597 6.597 -0.1 -0.1 0.816 0 0 0 0 0 0 0 0 0
0 -0.09 -0.11 -0.03 -0.03 -0.03 -0.03 -0.03 -0.02 0 1.556 1.556 4.672 0.709 0.494 0.494 3.621 6.023 6.023 11.94 11.94 9.705 9.705 1.214 1.214 -0.1 -0.1 -0.1 0 0 0 0 0 0 0 0 0 0
0 -0.09 -0.09 -0.03 -0.03 -0.03 0 0 0 0 1.556 1.556 4.672 0.709 0.494 0.494 12.83 12.83 18.29 133.3 295.9 16.37 9.96 1.214 0.041 -0.1 -0.06 -0.06 0 0 0 0 0 0 0 0 0 0 0
0 -0.03 -0.03 -0.04 -0.04 -0.04 0 0 0 0 0.124 0.124 0.51 -0.13 -0.13 12.83 18.9 26.36 125 1.007 1.012 0.538 0.538 0 0 0 0 0 0 0 0 0 0 0 0 0
0 0.044 0.044 12.6 12.6 -0.04 -0.58 -0.58 -0.58 -1.31 0.124 0.124 0.51 -0.13 -0.13 -0.09 4.263 6.727 1.007 1.724 1.012 0.538 0.538 0 0 0 0 0 0 0 0 0 0 0 0 0
0 0.044 0.044 37.41 37.41 -0.04 0.098 0.098 0.098 1.552 1.094 0.798 -0.22 -0.16 -0.16 -0.09 -0.05 14.37 9.975 6.727 3.503 3.503 1.012 0.538 0.538 0 0 0 0 0 0 0 0 0 0 0 0 0
0 13.87 13.87 37.41 37.41 14.26 -2.58 -2.58 -2.58 11.63 1.094 0.798 0.734 -0.16 -0.16 1.322 14.37 15.7 9.975 6.727 3.503 3.503 3.098 1.077 1.077 0 0 0 0 0 0 0 0 0 0 0 0 0
0 0 24.53 11.09 14.26 14.26 -2.58 -2.58 -2.58 -1.26 0.802 0.802 0.999 0.999 -0.1 -0.1 0 3.769 1.767 -0.04 3.785 3.785 3.661 3.661 3.661 3.751 -0.1 -0.1 0 0 0 -0.01 -0.01 0 0 0 0 0 0
0 0 0 20.2 20.47 20.47 -1.17 -1.17 -1.17 -0.06 -0.04 0 0.07 0.876 0 3.769 1.767 -0.03 -0.01 3.785 2.238 2.238 3.751 0 -0.1 -0.1 0 0 0 -0.01 -0.01 0 0 0 0 0 0
0 0 0 20.2 20.47 20.47 -0.71 -0.71 -0.71 0.002 -0.04 -0.04 -0.08 1.638 1.638 0 2.957 0 -0.03 -0.01 0.222 4.48 2.238 0 0 -0 -0 0 0 0 -0.05 -0.01 0 0 0 0 0 0
0 0 0 20.5 19.48 19.48 -1 -1 0.462 -0.21 0.494 0.494 -1.38 -0.08 1.638 19.49 19.49 0.985 0.985 0.009 -0.02 -0.02 0 0 0 0 0 0 0 0 0 -0.01 -0.01 0 0 0 0 0 0
0 0 0 20.5 19.48 19.48 -1 -1 0.462 0.494 0.494 -1.38 -0.08 3.507 0 6.064 0.985 0.985 0.009 0 0 0 0 0 0 0 0 0 0 0 -0.01 -0.01 0 0 0 0 0 0
0 0 0 11.96 11.96 19.48 2.775 23.14 -1.75 0.494 -2.7 -0.08 1.793 8.741 8.741 0 1.568 0.018 0 0 0 -1.4 0 0 3.16 3.16 11.94 11.94 0 0 -0.01 0 0 0 0 0 0
0 0 0 11.96 11.96 6.689 2.775 23.14 -1.75 -1.75 -2.7 -1.13 -1.13 0.044 -2.35 -2.35 -2.17 -2.17 0 -0.01 -0.01 -1.33 -1.4 0 0 3.16 0.148 11.94 11.94 11.94 12.2 12.2 0 0 0 0 0 0
0 0 0 11.96 -0 6.689 6.689 9.843 9.843 -1.75 -1.75 -1.13 0.044 0.044 -2.35 -3.14 -3.9 -3.9 0 0 0 -1.33 -1.33 0 0 0.148 0.148 14.8 14.8 14.8 17.42 12.2 0 0 0 0 0 0
0 0 0 -0 -0 6.689 6.689 6.689 9.843 9.843 -1.19 -1.13 -1.13 0.293 0.293 -3.14 -3.14 -3.9 -2.42 0.85 -0.01 -0.01 -1.82 0 -1.91 -1.91 -1.3 0.148 14.8 14.8 14.8 17.42 12.8 0 0 0 0 0 0
0 0 0 -0 0 6.689 6.689 11.95 11.95 9.843 -1.19 -0.68 -1.44 -2.52 0.293 -2.03 -2.03 -2.42 -2.42 0.85 -0 -0 -1.67 -1.67 0 7.72 -2.68 -1.6 21.64 21.64 21.64 17.42 12.8 0 0 0 0 0 0
0 0 0 0 0 6.689 11.95 11.95 11.95 12.92 12.92 12.92 23.86 23.86 29.45 0.214 -3.12 99.36 -3.29 -2.54 0 0 -1.8 -1.8 0 9.707 -2.22 -1.78 19.31 12.76 12.76 7.81 7.81 0 0 0 0 0 0
0 0 0 -0 -0 5.653 5.653 5.653 13.16 13.16 12.92 29.58 34.71 15.98 15.98 -0.08 -1.63 -2.54 -2.24 -2.24 0 0 -1.1 -1.74 -1.74 -1.56 -2.22 -1.78 19.31 12.76 12.76 7.81 -0 0 0 0 0 0 0
0 0 0 0 0 5.653 5.653 13.16 13.16 13.16 12.92 21.86 26.75 11.09 11.09 -0.08 -0.08 -0.08 -2.24 -2.24 0 0 -1.1 -1.11 -1.3 -1.3 -1.03 -1.03 19.31 12.76 12.76 -0 -0 0 0 0 0 0 0
0 0 0 0.01 0.01 5.653 5.653 10.25 10.25 0 21.86 26.75 11.09 11.09 -0.08 -0.08 -0.08 28.08 5.769 5.769 0 0 21.14 21.14 9.67 9.67 12.74 12.74 0 0 0 -0 -0 0 0 0 0 0 0
0 0 0 0.01 0.01 5.653 10.25 10.25 10.25 16.94 16.94 0 0 5.952 11.1 11.1 28.08 28.08 16.71 5.769 0 0 21.14 21.14 9.67 9.67 12.74 12.74 0 0 0 -0 -0 0 0 0 0 0 0
0 0 0 0.007 0.007 0.007 8.571 17.22 17.22 11.19 11.19 11.19 11.19 5.952 11.1 11.1 37.91 37.91 0.154 7.822 0 0 42.83 42.83 13.68 13.68 6.142 6.142 4E-04 4E-04 4E-04 -0 -0 0 0 0 0 0 0
0 0 0 0.007 0.007 0.007 8.571 12.65 12.65 14.9 14.9 1E-04 0 5.952 11.1 11.1 37.01 24.04 7.822 7.822 0 32.43 26.75 26.75 5.68 5.68 5.774 5.774 4E-04 4E-04 4E-04 0 0 0 0 0 0 0 0
0 0 0 0.007 0.007 0.007 0 7E-05 7E-05 0.025 0.025 1E-04 0 4E-04 0 0 -0.02 24.04 8.046 0 0 13.49 5.942 5.942 5E-04 5E-04 -0 -0 0.001 0.001 0.001 6E-04 6E-04 0 0 0 0 0 0
0 0 0 0 0 0 0 6E-05 6E-05 0.025 1E-04 1E-04 0 4E-04 7E-04 7E-04 0.002 -0 8.046 0 0 13.49 5E-04 5E-04 0 0 0 0 0 0 0 4E-04 4E-04 0 0 0 0 0 0
0 0 0 0 0 0 0 0 0 0 0 0 0 0 0 0 0 0 0 0 0 0 0 0 0 0 0 0 0 0 0 0 0 0 0 0 0 0 0
Base Case
High Scenario
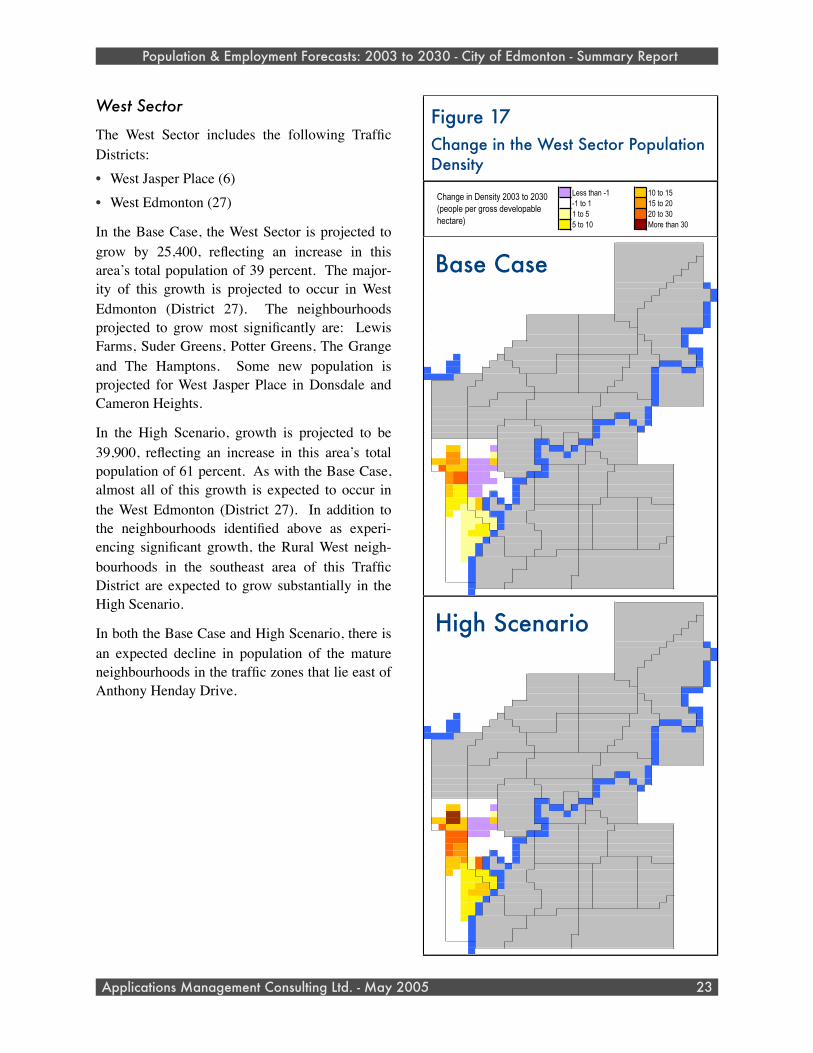
West Sector
The West Sector includes the following Traffic Districts:• West Jasper Place (6)• West Edmonton (27)
In the Base Case, the West Sector is projected to grow by 25,400, reflecting an increase in this area’s total population of 39 percent. The major-ity of this growth is projected to occur in West Edmonton (District 27). The neighbourhoods projected to grow most significantly are: Lewis Farms, Suder Greens, Potter Greens, The Grange and The Hamptons. Some new population is projected for West Jasper Place in Donsdale and Cameron Heights.
In the High Scenario, growth is projected to be 39,900, reflecting an increase in this area’s total population of 61 percent. As with the Base Case, almost all of this growth is expected to occur in the West Edmonton (District 27). In addition to the neighbourhoods identified above as experi-encing significant growth, the Rural West neigh-bourhoods in the southeast area of this Traffic District are expected to grow substantially in the High Scenario.
In both the Base Case and High Scenario, there is an expected decline in population of the mature neighbourhoods in the traffic zones that lie east of Anthony Henday Drive.
Population & Employment Forecasts: 2003 to 2030 - City of Edmonton - Summary Report
Applications Management Consulting Ltd. - May 2005 23
Figure 17Change in the West Sector Population Density
Less than -1 10 to 15-1 to 1 15 to 201 to 5 20 to 305 to 10 More than 30
Change in Density 2003 to 2030 (people per gross developable hectare)
0 0 0 0 0 0 0 0 0 0 0 0 0 0 0 0 0 0 0 0 0 0 0 0 0 0 0 0 0 0 0 0 0 0 0 0 0 0 0 0
0 0 0 0 0 0 0 0 0 0 0 0 0 0 0 0 0 0 0 0 0 0 0 0 0 0 -0.01 -0.01 -0.01 -0 -0 -0.02 -0.02 0 0 -0.02 -0.02 -0.02 0 0
0 0 0 0 0 0 0 0 0 0 0 0 0 0 0 0 0 0 0 0 0 0 0 0 0 0 -0.01 -0.02 -0.02 -0.02 -0.02 -0.02 -0.02 -0 -0 -0.04 -0.04 -0.04 0 0
0 0 0 0 0 0 0 0 0 0 0 0 0 0 0 0 0 0 0 0 0 0 0 0 0 0 0 -0.01 -0.01 -0.04 -0.04 -0.02 -0.02 -0.01 -0.01 -0.01 -0.01 -0.01 0 0
0 0 0 0 0 0 0 0 0 0 0 0 0 0 0 0 0 0 0 0 0 0 0 0 0 0 0 -0.02 -0.02 -0.01 -0.01 -0.01 -0.01 -0.02 -0.02 -0.01 -0.01 -0.01 0 0
0 0 0 0 0 0 0 0 0 0 0 0 0 0 0 0 0 0 0 0 0 0 0 0 0 0 0 0.003 0.003 -0 -0 0.001 0.001 -0 -0 -0.01 -0.01 -0.01 0 0
0 0 0 0 0 0 0 0 0 0 0 0 0 0 0 0 0 0 0 0 0 0 0 0 0 0 0 0.002 0.002 -0 -0 -0.01 -0.01 0.75 -0.02 -0 -0 -0 0 0
0 0 0 0 0 0 0 0 0 0 0 0 0 0 0 0 0 0 0 0 0 0 0 0 0 0 -0 -0.02 -0.02 -0.03 -0.03 6E-04 6E-04 -0.02 -0.01 -0 -0 -0 0
0 0 0 0 0 0 0 0 0 0 0 0 0 0 0 0 0 0 0 0 0 0 0 0 0 0 -0 -0 -0 -0.06 -0.06 6E-04 -0.04 -0.02 -0.01 -0.06 -0.06 -0.02 -0.02
0 0 0 0 0 0 0 0 0 0 0 0 0 0 0 0 0 0 0 0 0 0 0 0 0 0 -0 -0 -0 -0.06 -0.06 -0.04 -0.04 -0.01 -0.01 -0.06 -0.06 -0.02 -0.02
0 0 0 0 0 0 0 0 0 0 0 0 0 0 0 0 0 0 0 0 0 0 0 0 0 0 -0.02 -0.02 -0.01 -0.01 0 -0.01 -0.01 -0.05 -0.01 -0.01 -0.02 -0.02 0
0 0 0 0 0 0 0 0 0 0 0 0 0 0 0 0 0 0 0 0 0 0 0 0 0 0 -0.02 -0.02 -0.01 0 0 -0.01 -0.01 -0.05 -0.01 -0.02 -0.02 -0.02 0
0 0 0 0 0 0 0 0 0 0 0 0 0 0 7E-04 7E-04 0.098 0.098 10.96 11.64 11.64 0.864 18.35 16.62 18.9 4.473 -0.02 -0.01 -0.01 0 0 -0.01 0.002 -0.05 -0.02 -0.02 -0.02 -0.02 0
0 0 0 0 0 0 0 0 0 0 0 0 0 0 7E-04 7E-04 0.098 18.04 10.96 11.64 11.64 0.864 18.35 16.62 18.9 4.473 4.473 4.473 -0.01 0 0 0.002 0.002 -0.05 -0.02 -0.02 -0.02 -0.02 0
0 0 0 0 0 0 0 0 0 0 0 0 0 0 7E-04 24.76 11.37 18.04 10.96 11.64 11.64 0.864 18.35 16.62 18.9 4.473 4.473 17.23 17.23 0 2.424 -0.02 -0.05 -0.05 -0.02 0 0
0 0 0 0 0 0 0 0 0 0 0 0 0 0 24.76 24.76 11.37 18.04 -4.98 -4.98 -4.98 0.864 18.35 27.54 31.25 4.473 4.473 17.23 17.23 -0.05 0 -0.02 1.05 -0.01 -0.02 0 0 0 0
0 0 0 0 0 0 0 0 0 0 0 0 -0 -0 15.33 12.44 -3.72 -3.72 -5.39 -5.39 -5.39 14.76 0.479 5.795 9.949 11.17 17.74 11.15 11.15 -0.05 -0.05 -0 -0 -0.01 -0.01 0 0 0 0
0 0 0 0 0 0 0 0 0 0 0 -0 -0 -0 15.33 12.44 -3.72 -3.72 -1.73 -1.73 -1.73 14.76 0.479 5.795 9.949 11.17 17.74 11.15 11.15 -0.05 0 -0 -0 -0.01 -0.01 -0.01 0 0
0 0 0 0 0 0 0 0 0 -0 -0 -0.01 -0.01 53.64 1.895 8.037 -5.35 46.83 46.83 46.83 0.467 0.467 0.636 0.636 -0.11 3.984 15.28 0 -0.86 2.194 2.194 -0 -0.01 -0.01 -0.01 -0.01 0 0
0 0 0 0 0 0 0 -0 -0 -0.02 -0.01 -0.01 15.92 15.92 8.037 -5.32 35.05 35.05 35.05 0.467 0.467 0.636 0.636 -0.11 5.249 15.28 0 -0.86 2.194 2.194 -0.01 -0.01 0 0
0 0 0 0 0 -0 -0 -0 -0.02 -0.02 -0.01 15.92 0 0 -5.32 35.05 35.05 35.05 -0.39 -0.39 -0.42 0 5.249 5.249 4.26 -1.26 -1.12 -1.12 -0.01 -0.01 0 0 0 0
3.677 3.677 7.144 7.144 -0 -0 -0 -0.01 -0.01 0 -1.46 -1.46 -0.98 -0.98 -1.52 -1.52 -1.52 0 -0.55 -0.48 -0.48 3.723 3.723 4.26 -1.43 -1.43 -2.35 -0.01 -0.01 0 0 0 0 0 0
0 -0 0 3.677 3.677 3.677 7.144 -0 -0 -0 -0 -0.01 -0.01 0 2.804 2.804 0.141 -2.63 -2.63 -1.82 -1.82 -0.55 -0.55 -0.48 -0.48 3.723 0 -1.16 -1.43 -1.43 -2.35 -0.01 -0.01 0 0 0 0 0 0
0 -0 0 3.396 3.396 3.396 -0.08 -0.08 -0.08 0 0 -0.01 -0.01 0 0 2.804 0.141 -2.63 -2.63 -1.82 -1.82 -0.12 -0.12 -0.09 -0.09 -0.08 -0.08 -0.92 -0.92 -1.65 3.761 -0.01 -0.01 0 0 0 0 0 0
0 0.012 0.012 3.396 3.396 3.396 -0.08 -0.08 -0.08 0 0 0 0 -0.07 -0.07 -0.17 -0.17 -0.17 -0.07 -0.07 5.015 -0.11 -0.07 -0.07 -0.14 -0.14 -3.21 -2.2 -2.2 -1.65 3.761 -0.01 -0.01 0 0 0 0 0 0
0 0 -0.01 -0.02 -0.02 -0.02 -0.08 -0.08 -0.08 0.111 0 0 0 0 0.689 0.689 1.123 1.226 0 0 5.015 -3.35 2.291 -2.04 -3.08 -3.08 -3.21 -3.02 -3.02 -2.55 0.17 -0.01 -0.01 0 0 0 0 0 0
0 0 -0.01 -0.02 -0.02 -0.02 0 -0 0 0.111 0 0 0 0 -4.46 -4.46 -0.04 -0.04 0 0 2.118 1.215 2.291 0.006 0.055 0.347 -0.1 -0.2 -0.2 0.17 0 0 0 0 0 0 0 0 0
0 0 -0.01 -0.02 -0 -0 -0 -0 0 0.111 0 0 -1.72 0 -4.46 0 -0.04 -0.04 -0.14 0 2.118 1.215 5.301 0.891 0.055 0.347 -0.2 0.17 0 0 0 0 0 0 0 0 0
0 -0.12 -0.11 -0 -0 -0 -0 -0 -0.02 0 0 1.323 -0.37 0.037 0.417 3.529 3.529 3.913 3.913 6.316 19.46 0.608 0.608 -0.1 -0.1 0.17 0 0 0 0 0 0 0 0 0
0 -0.12 -0.11 -0.04 -0.04 -0.04 -0.03 -0.03 -0.02 0 1.673 1.673 2.038 0.751 0.03 0.03 3.529 3.913 3.913 6.316 6.316 2.295 2.295 1.287 1.287 -0.1 -0.1 -0.1 0 0 0 0 0 0 0 0 0 0
0 -0.11 -0.11 -0.04 -0.04 -0.04 0 0 0 0 1.673 1.673 2.038 0.751 0.03 0.03 5.226 5.226 18.11 94.54 162 4.881 6.032 1.287 0.041 -0.1 -0.06 -0.06 0 0 0 0 0 0 0 0 0 0 0
0 -0.04 -0.04 -0.05 -0.05 -0.05 0 0 0 0 0.124 0.124 0.51 -0.13 -0.13 5.226 11.92 26.5 75.39 0.957 1.11 -0.96 -0.96 0 0 0 0 0 0 0 0 0 0 0 0 0
0 0.044 0.044 11.74 11.74 -0.05 -0.68 -0.68 -0.68 -2.08 0.124 0.124 0.51 -0.13 -0.13 -0.09 1.962 4.625 0.957 1.537 1.11 -0.96 -0.96 0 0 0 0 0 0 0 0 0 0 0 0 0
0 0.044 0.044 17.93 17.93 -0.05 0.098 0.098 0.098 1.552 0.771 0.081 -0.22 -0.16 -0.16 -0.09 -0.05 12.94 7.798 4.625 1.085 1.085 1.11 -0.96 -0.96 0 0 0 0 0 0 0 0 0 0 0 0 0
0 14.02 14.02 17.93 17.93 14.57 -4.71 -4.71 -4.71 11.32 0.771 0.081 0.771 -0.16 -0.16 0.774 12.94 12.3 7.798 4.625 1.085 1.085 -0.24 1.065 1.065 0 0 0 0 0 0 0 0 0 0 0 0 0
0 0 23.43 10.79 14.57 14.57 -4.71 -4.71 -4.71 -1.38 0.797 0.797 -0.08 -0.08 -0.1 -0.1 0 0 0.802 -0.08 2.281 2.281 2.524 2.524 2.524 3.755 -0.15 -0.15 0 0 0 -0.01 -0.01 0 0 0 0 0 0
0 0 0 18.48 20.03 20.03 -1.28 -1.28 -1.28 -0.15 -0.04 0 0.07 0.876 0 0 0.802 -0.06 -0.01 2.281 1.232 1.232 3.755 0 -0.15 -0.15 0 0 0 -0.01 -0.01 0 0 0 0 0 0
0 0 0 18.48 20.03 20.03 -3.41 -3.41 -3.41 -1.78 -0.04 -0.04 -0.08 0.181 0.181 0 -0.12 0 -0.06 -0.01 0.073 2.813 1.232 0 0 -0 -0 0 0 0 -0.05 -0.01 0 0 0 0 0 0
0 0 0 13.42 6.386 6.386 -2.68 -2.68 0.462 -0.21 0.466 0.466 -2.15 -0.08 0.181 9.994 9.994 0.734 0.734 0.003 -0.02 -0.02 0 0 0 0 0 0 0 0 0 -0.01 -0.01 0 0 0 0 0 0
0 0 0 13.42 6.386 6.386 -2.68 -2.68 0.462 0.466 0.466 -2.15 -0.08 3.108 0 4.822 0.734 0.734 0.003 0 0 0 0 0 0 0 0 0 0 0 -0.01 -0.01 0 0 0 0 0 0
0 0 0 7.298 7.298 6.386 2.06 10.65 -2.23 0.466 -4.03 -0.08 0.005 5.324 5.324 0 0.293 0.006 0 0 0 -1.49 0 0 1.687 1.687 9.409 9.409 0 0 -0.01 0 0 0 0 0 0
0 0 0 7.298 7.298 4.141 2.06 10.65 -2.23 -2.23 -4.03 -1.45 -1.45 0.044 -2.96 -2.96 -2.36 -2.36 0 -0.01 -0.01 -1.41 -1.49 0 0 1.687 -1.44 9.409 9.409 9.409 7.435 7.435 0 0 0 0 0 0
0 0 0 7.298 -0 4.141 4.141 4.701 4.701 -2.23 -2.23 -1.45 0.044 0.044 -2.96 -4.84 -4.64 -4.64 0 0 0 -1.41 -1.41 0 0 -1.44 -1.44 11.83 11.83 11.83 11.61 7.435 0 0 0 0 0 0
0 0 0 -0 -0 4.141 4.141 4.141 4.701 4.701 -1.51 -1.45 -1.45 -0.13 -0.13 -4.84 -4.84 -4.64 -2.88 0.85 -0.02 -0.02 -2.64 0 -2.69 -2.69 -2.16 -1.44 11.83 11.83 11.83 11.61 12.95 0 0 0 0 0 0
0 0 0 -0 0 4.141 4.141 7.291 7.291 4.701 -1.51 -0.76 -1.54 -2.58 -0.13 -2.7 -2.7 -2.88 -2.88 0.85 -0 -0 -2.56 -2.56 0 3.551 -3.52 -2.51 12.31 12.31 12.31 11.61 12.95 0 0 0 0 0 0
0 0 0 0 0 4.141 7.291 7.291 7.291 12.64 12.64 12.64 19.74 19.74 18.62 0.214 -6.61 88.2 -4.58 -2.95 0 0 -2.58 -2.58 0 7.682 -3.25 -2.72 12.51 12.24 12.24 7.264 7.264 0 0 0 0 0 0
0 0 0 -0 -0 1.889 1.889 1.889 7.814 7.814 12.64 29.33 29.58 15.96 15.96 -0.8 -2.46 -2.95 -2.54 -2.54 0 0 -1.17 -2.48 -2.48 -2.31 -3.25 -2.72 12.51 12.24 12.24 7.264 -0 0 0 0 0 0 0
0 0 0 0 0 1.889 1.889 7.814 7.814 7.814 12.64 7.484 12.78 6.296 6.296 -0.8 -0.8 -0.8 -2.54 -2.54 0 0 -1.17 -1.65 -1.9 -1.9 -1.64 -1.64 12.51 12.24 12.24 -0 -0 0 0 0 0 0 0
0 0 0 0.01 0.01 1.889 1.889 6.418 6.418 0 7.484 12.78 6.296 6.296 -0.8 -0.8 -0.8 21.28 4.908 4.908 0 0 10.15 10.15 6.103 6.103 4.347 4.347 0 0 0 -0 -0 0 0 0 0 0 0
0 0 0 0.01 0.01 1.889 6.418 6.418 6.418 7.278 7.278 0 0 0 8.995 8.995 21.28 21.28 15.84 4.908 0 0 10.15 10.15 6.103 6.103 4.347 4.347 0 0 0 -0 -0 0 0 0 0 0 0
0 0 0 0.007 0.007 0.007 2.22 17.34 17.34 10.4 10.4 10.4 10.4 0 8.995 8.995 13.23 13.23 -1.44 7.422 0 0 34 34 12.72 12.72 5.925 5.925 4E-04 4E-04 4E-04 -0 -0 0 0 0 0 0 0
0 0 0 0.007 0.007 0.007 2.22 12.69 12.69 10.94 10.94 1E-04 0 0 8.995 8.995 26.21 8.83 7.422 7.422 0 29.25 17.85 17.85 1.257 1.257 1.278 1.278 4E-04 4E-04 4E-04 0 0 0 0 0 0 0 0
0 0 0 0.007 0.007 0.007 0 7E-05 7E-05 0.025 0.025 1E-04 0 4E-04 0 0 -0.02 8.83 2.662 0 0 12.54 5.753 5.753 5E-04 5E-04 -0 -0 0.001 0.001 0.001 6E-04 6E-04 0 0 0 0 0 0
0 0 0 0 0 0 0 6E-05 6E-05 0.025 1E-04 1E-04 0 4E-04 7E-04 7E-04 0.002 -0 2.662 0 0 12.54 5E-04 5E-04 0 0 0 0 0 0 0 4E-04 4E-04 0 0 0 0 0 0
0 0 0 0 0 0 0 0 0 0 0 0 0 0 0 0 0 0 0 0 0 0 0 0 0 0 0 0 0 0 0 0 0 0 0 0 0 0 0 0 0 0 0 0 0 0 0 0 0 0 0 0 0 0 0 0 0 0 0 0 0 0 0 0 0 0 0 0 0 0 0 0 0 0 0 0 0 0 0
0 0 0 0 0 0 0 0 0 0 0 0 0 0 0 0 0 0 0 0 0 0 0 0 0 0 -0 -0.01 -0.01 -0 -0 -0.02 -0.02 0 0 -0.02 -0.02 -0.02 0 0
0 0 0 0 0 0 0 0 0 0 0 0 0 0 0 0 0 0 0 0 0 0 0 0 0 0 -0 -0.02 -0.02 -0.01 -0.01 -0.02 -0.02 0.001 0.001 -0.03 -0.03 -0.03 0 0
0 0 0 0 0 0 0 0 0 0 0 0 0 0 0 0 0 0 0 0 0 0 0 0 0 0 0 -0 -0 -0.03 -0.03 -0.02 -0.02 -0 -0 -0 -0 -0.01 0 0
0 0 0 0 0 0 0 0 0 0 0 0 0 0 0 0 0 0 0 0 0 0 0 0 0 0 0 -0.02 -0.02 -0.01 -0.01 -0.01 -0.01 -0.02 -0.02 -0 -0.01 -0.01 0 0
0 0 0 0 0 0 0 0 0 0 0 0 0 0 0 0 0 0 0 0 0 0 0 0 0 0 0 0.007 0.007 -0 -0 0.003 0.003 0.002 0.002 -0.01 -0.01 -0.01 0 0
0 0 0 0 0 0 0 0 0 0 0 0 0 0 0 0 0 0 0 0 0 0 0 0 0 0 0 0.007 0.007 0.001 0.001 -0.01 -0.01 1.398 -0.01 -0 -0 -0 0 0
0 0 0 0 0 0 0 0 0 0 0 0 0 0 0 0 0 0 0 0 0 0 0 0 0 0 -0 -0.02 -0.02 -0.02 -0.02 0.003 0.003 -0.01 -0.01 -0 -0 -0 0
0 0 0 0 0 0 0 0 0 0 0 0 0 0 0 0 0 0 0 0 0 0 0 0 0 0 -0 -0 -0 -0.05 -0.05 0.003 -0.03 -0.01 -0.01 -0.06 -0.06 -0.01 -0.01
0 0 0 0 0 0 0 0 0 0 0 0 0 0 0 0 0 0 0 0 0 0 0 0 0 0 -0 -0 -0 -0.05 -0.05 -0.03 -0.03 -0.01 -0.01 -0.06 -0.06 -0.01 -0.01
0 0 0 0 0 0 0 0 0 0 0 0 0 0 0 0 0 0 0 0 0 0 0 0 0 0 -0.02 -0.02 -0.01 -0.01 0 -0.01 -0.01 -0.04 -0.01 -0.01 -0.01 -0.01 0
0 0 0 0 0 0 0 0 0 0 0 0 0 0 0 0 0 0 0 0 0 0 0 0 0 0 -0.02 -0.02 -0.01 0 0 -0.01 -0.01 -0.04 -0.01 -0.01 -0.01 -0.01 0
0 0 0 0 0 0 0 0 0 0 0 0 0 0 -0 -0 0.187 0.187 24.43 15.07 15.07 1.785 21.18 23.36 26.32 8.987 -0.02 -0.01 -0.01 0 0 -0.01 0.005 -0.04 -0.01 -0.01 -0.01 -0.01 0
0 0 0 0 0 0 0 0 0 0 0 0 0 0 -0 -0 0.187 20.49 24.43 15.07 15.07 1.785 21.18 23.36 26.32 8.987 8.987 8.987 -0.01 0 0 0.005 0.005 -0.03 -0.01 -0.01 -0.01 -0.01 0
0 0 0 0 0 0 0 0 0 0 0 0 0 0 -0 25.01 26.92 20.49 24.43 15.07 15.07 1.785 21.18 23.36 26.32 8.987 8.987 23.95 23.95 0 3.376 -0.02 -0.03 -0.03 -0.01 0 0
0 0 0 0 0 0 0 0 0 0 0 0 0 0 25.01 25.01 26.92 20.49 -3.38 -3.38 -3.38 1.785 21.18 29.15 33.66 8.987 8.987 23.95 23.95 -0.03 0 -0.02 1.586 -0.01 -0.01 0 0 0 0
0 0 0 0 0 0 0 0 0 0 0 0 -0 -0 31.79 12.05 -2.31 -2.31 -3.71 -3.71 -3.71 18.87 3.159 11.64 11.91 13.99 20.52 32.21 32.21 -0.03 -0.03 -0 -0 -0.01 -0.01 0 0 0 0
0 0 0 0 0 0 0 0 0 0 0 -0 -0 -0 31.79 12.05 -2.31 -2.31 -1.15 -1.15 -1.15 18.87 3.159 11.64 11.91 13.99 20.52 32.21 32.21 -0.03 0 -0 -0 -0.01 -0.01 -0.01 0 0
0 0 0 0 0 0 0 0 0 -0 -0 -0 -0 53.06 4.911 9.141 -3.74 51.89 51.89 51.89 1.448 1.448 1.396 1.396 -0.11 3.941 17.53 0 -0.12 5.351 5.351 -0 -0.01 -0.01 -0.01 -0.01 0 0
0 0 0 0 0 0 0 -0 -0 -0.01 -0 -0 25.36 25.36 9.141 -3.53 40.76 40.76 40.76 1.448 1.448 1.396 1.396 -0.11 5.189 17.53 0 -0.12 5.351 5.351 -0.01 -0.01 0 0
0 0 0 0 0 -0 -0 -0 -0.01 -0.01 -0 25.36 0 0 -3.53 40.76 40.76 40.76 -0.39 -0.39 -0.42 0 5.189 5.189 6.344 -0.26 -0.21 -0.21 -0.01 -0.01 0 0 0 0
6.189 6.189 7.062 7.062 -0 -0 -0 -0 -0 0 -0.26 -0.26 -0.8 -0.8 -0.05 -0.05 -0.05 0 -0.08 -0.08 -0.08 3.88 3.88 6.344 -0.68 -0.68 -0.99 -0.01 -0.01 0 0 0 0 0 0
0 -0 0 6.189 6.189 6.189 7.062 -0 -0 -0 -0 -0 -0 0 4.204 4.204 0.771 -0.15 -0.15 -0.1 -0.1 -0.08 -0.08 -0.08 -0.08 3.88 0 -0.17 -0.68 -0.68 -0.99 -0.01 -0.01 0 0 0 0 0 0
0 -0 0 6.873 6.873 6.873 -0.06 -0.06 -0.06 0 0 -0 -0 0 0 4.204 0.771 -0.15 -0.15 -0.1 -0.1 0.906 0.906 0.461 0.461 -0.04 -0.04 -0.26 -0.26 -0.65 5.318 -0.01 -0.01 0 0 0 0 0 0
0 0.012 0.012 6.873 6.873 6.873 -0.06 -0.06 -0.06 0 0 0 0 -0.07 -0.07 -0.16 -0.16 -0.16 -0.05 -0.05 7.238 -0.08 -0.05 -0.05 -0.11 -0.11 -0.36 0.302 0.302 -0.65 5.318 -0.01 -0.01 0 0 0 0 0 0
0 0 -0 -0.01 -0.01 -0.01 -0.06 -0.06 -0.06 0.208 0 0 0 0 1.14 1.14 1.726 1.595 0 0 7.238 -1.95 3.25 -1.41 0.141 0.141 -0.36 -0.28 -0.28 0 0.816 -0.01 -0.01 0 0 0 0 0 0
0 0 -0 -0.01 -0.01 -0.01 0 -0 0 0.208 0 0 0 0 -4.09 -4.09 -0.04 -0.04 0 0 2.018 2.378 3.25 0.015 0.055 0.347 0.277 0.196 0.196 0.816 0 0 0 0 0 0 0 0 0
0 0 -0 -0.01 -0 -0 -0 -0 0 0.208 0 0 -1.58 0 -4.09 0 -0.04 -0.04 -0.1 0 2.018 2.378 6.7 0.891 0.055 0.347 0.196 0.816 0 0 0 0 0 0 0 0 0
0 -0.09 -0.11 -0 -0 -0 -0 -0 -0.02 0 0 1.599 1.041 0.282 1.856 3.621 3.621 6.023 6.023 11.94 23.2 6.597 6.597 -0.1 -0.1 0.816 0 0 0 0 0 0 0 0 0
0 -0.09 -0.11 -0.03 -0.03 -0.03 -0.03 -0.03 -0.02 0 1.556 1.556 4.672 0.709 0.494 0.494 3.621 6.023 6.023 11.94 11.94 9.705 9.705 1.214 1.214 -0.1 -0.1 -0.1 0 0 0 0 0 0 0 0 0 0
0 -0.09 -0.09 -0.03 -0.03 -0.03 0 0 0 0 1.556 1.556 4.672 0.709 0.494 0.494 12.83 12.83 18.29 133.3 295.9 16.37 9.96 1.214 0.041 -0.1 -0.06 -0.06 0 0 0 0 0 0 0 0 0 0 0
0 -0.03 -0.03 -0.04 -0.04 -0.04 0 0 0 0 0.124 0.124 0.51 -0.13 -0.13 12.83 18.9 26.36 125 1.007 1.012 0.538 0.538 0 0 0 0 0 0 0 0 0 0 0 0 0
0 0.044 0.044 12.6 12.6 -0.04 -0.58 -0.58 -0.58 -1.31 0.124 0.124 0.51 -0.13 -0.13 -0.09 4.263 6.727 1.007 1.724 1.012 0.538 0.538 0 0 0 0 0 0 0 0 0 0 0 0 0
0 0.044 0.044 37.41 37.41 -0.04 0.098 0.098 0.098 1.552 1.094 0.798 -0.22 -0.16 -0.16 -0.09 -0.05 14.37 9.975 6.727 3.503 3.503 1.012 0.538 0.538 0 0 0 0 0 0 0 0 0 0 0 0 0
0 13.87 13.87 37.41 37.41 14.26 -2.58 -2.58 -2.58 11.63 1.094 0.798 0.734 -0.16 -0.16 1.322 14.37 15.7 9.975 6.727 3.503 3.503 3.098 1.077 1.077 0 0 0 0 0 0 0 0 0 0 0 0 0
0 0 24.53 11.09 14.26 14.26 -2.58 -2.58 -2.58 -1.26 0.802 0.802 0.999 0.999 -0.1 -0.1 0 3.769 1.767 -0.04 3.785 3.785 3.661 3.661 3.661 3.751 -0.1 -0.1 0 0 0 -0.01 -0.01 0 0 0 0 0 0
0 0 0 20.2 20.47 20.47 -1.17 -1.17 -1.17 -0.06 -0.04 0 0.07 0.876 0 3.769 1.767 -0.03 -0.01 3.785 2.238 2.238 3.751 0 -0.1 -0.1 0 0 0 -0.01 -0.01 0 0 0 0 0 0
0 0 0 20.2 20.47 20.47 -0.71 -0.71 -0.71 0.002 -0.04 -0.04 -0.08 1.638 1.638 0 2.957 0 -0.03 -0.01 0.222 4.48 2.238 0 0 -0 -0 0 0 0 -0.05 -0.01 0 0 0 0 0 0
0 0 0 20.5 19.48 19.48 -1 -1 0.462 -0.21 0.494 0.494 -1.38 -0.08 1.638 19.49 19.49 0.985 0.985 0.009 -0.02 -0.02 0 0 0 0 0 0 0 0 0 -0.01 -0.01 0 0 0 0 0 0
0 0 0 20.5 19.48 19.48 -1 -1 0.462 0.494 0.494 -1.38 -0.08 3.507 0 6.064 0.985 0.985 0.009 0 0 0 0 0 0 0 0 0 0 0 -0.01 -0.01 0 0 0 0 0 0
0 0 0 11.96 11.96 19.48 2.775 23.14 -1.75 0.494 -2.7 -0.08 1.793 8.741 8.741 0 1.568 0.018 0 0 0 -1.4 0 0 3.16 3.16 11.94 11.94 0 0 -0.01 0 0 0 0 0 0
0 0 0 11.96 11.96 6.689 2.775 23.14 -1.75 -1.75 -2.7 -1.13 -1.13 0.044 -2.35 -2.35 -2.17 -2.17 0 -0.01 -0.01 -1.33 -1.4 0 0 3.16 0.148 11.94 11.94 11.94 12.2 12.2 0 0 0 0 0 0
0 0 0 11.96 -0 6.689 6.689 9.843 9.843 -1.75 -1.75 -1.13 0.044 0.044 -2.35 -3.14 -3.9 -3.9 0 0 0 -1.33 -1.33 0 0 0.148 0.148 14.8 14.8 14.8 17.42 12.2 0 0 0 0 0 0
0 0 0 -0 -0 6.689 6.689 6.689 9.843 9.843 -1.19 -1.13 -1.13 0.293 0.293 -3.14 -3.14 -3.9 -2.42 0.85 -0.01 -0.01 -1.82 0 -1.91 -1.91 -1.3 0.148 14.8 14.8 14.8 17.42 12.8 0 0 0 0 0 0
0 0 0 -0 0 6.689 6.689 11.95 11.95 9.843 -1.19 -0.68 -1.44 -2.52 0.293 -2.03 -2.03 -2.42 -2.42 0.85 -0 -0 -1.67 -1.67 0 7.72 -2.68 -1.6 21.64 21.64 21.64 17.42 12.8 0 0 0 0 0 0
0 0 0 0 0 6.689 11.95 11.95 11.95 12.92 12.92 12.92 23.86 23.86 29.45 0.214 -3.12 99.36 -3.29 -2.54 0 0 -1.8 -1.8 0 9.707 -2.22 -1.78 19.31 12.76 12.76 7.81 7.81 0 0 0 0 0 0
0 0 0 -0 -0 5.653 5.653 5.653 13.16 13.16 12.92 29.58 34.71 15.98 15.98 -0.08 -1.63 -2.54 -2.24 -2.24 0 0 -1.1 -1.74 -1.74 -1.56 -2.22 -1.78 19.31 12.76 12.76 7.81 -0 0 0 0 0 0 0
0 0 0 0 0 5.653 5.653 13.16 13.16 13.16 12.92 21.86 26.75 11.09 11.09 -0.08 -0.08 -0.08 -2.24 -2.24 0 0 -1.1 -1.11 -1.3 -1.3 -1.03 -1.03 19.31 12.76 12.76 -0 -0 0 0 0 0 0 0
0 0 0 0.01 0.01 5.653 5.653 10.25 10.25 0 21.86 26.75 11.09 11.09 -0.08 -0.08 -0.08 28.08 5.769 5.769 0 0 21.14 21.14 9.67 9.67 12.74 12.74 0 0 0 -0 -0 0 0 0 0 0 0
0 0 0 0.01 0.01 5.653 10.25 10.25 10.25 16.94 16.94 0 0 5.952 11.1 11.1 28.08 28.08 16.71 5.769 0 0 21.14 21.14 9.67 9.67 12.74 12.74 0 0 0 -0 -0 0 0 0 0 0 0
0 0 0 0.007 0.007 0.007 8.571 17.22 17.22 11.19 11.19 11.19 11.19 5.952 11.1 11.1 37.91 37.91 0.154 7.822 0 0 42.83 42.83 13.68 13.68 6.142 6.142 4E-04 4E-04 4E-04 -0 -0 0 0 0 0 0 0
0 0 0 0.007 0.007 0.007 8.571 12.65 12.65 14.9 14.9 1E-04 0 5.952 11.1 11.1 37.01 24.04 7.822 7.822 0 32.43 26.75 26.75 5.68 5.68 5.774 5.774 4E-04 4E-04 4E-04 0 0 0 0 0 0 0 0
0 0 0 0.007 0.007 0.007 0 7E-05 7E-05 0.025 0.025 1E-04 0 4E-04 0 0 -0.02 24.04 8.046 0 0 13.49 5.942 5.942 5E-04 5E-04 -0 -0 0.001 0.001 0.001 6E-04 6E-04 0 0 0 0 0 0
0 0 0 0 0 0 0 6E-05 6E-05 0.025 1E-04 1E-04 0 4E-04 7E-04 7E-04 0.002 -0 8.046 0 0 13.49 5E-04 5E-04 0 0 0 0 0 0 0 4E-04 4E-04 0 0 0 0 0 0
0 0 0 0 0 0 0 0 0 0 0 0 0 0 0 0 0 0 0 0 0 0 0 0 0 0 0 0 0 0 0 0 0 0 0 0 0 0 0
Base Case
High Scenario
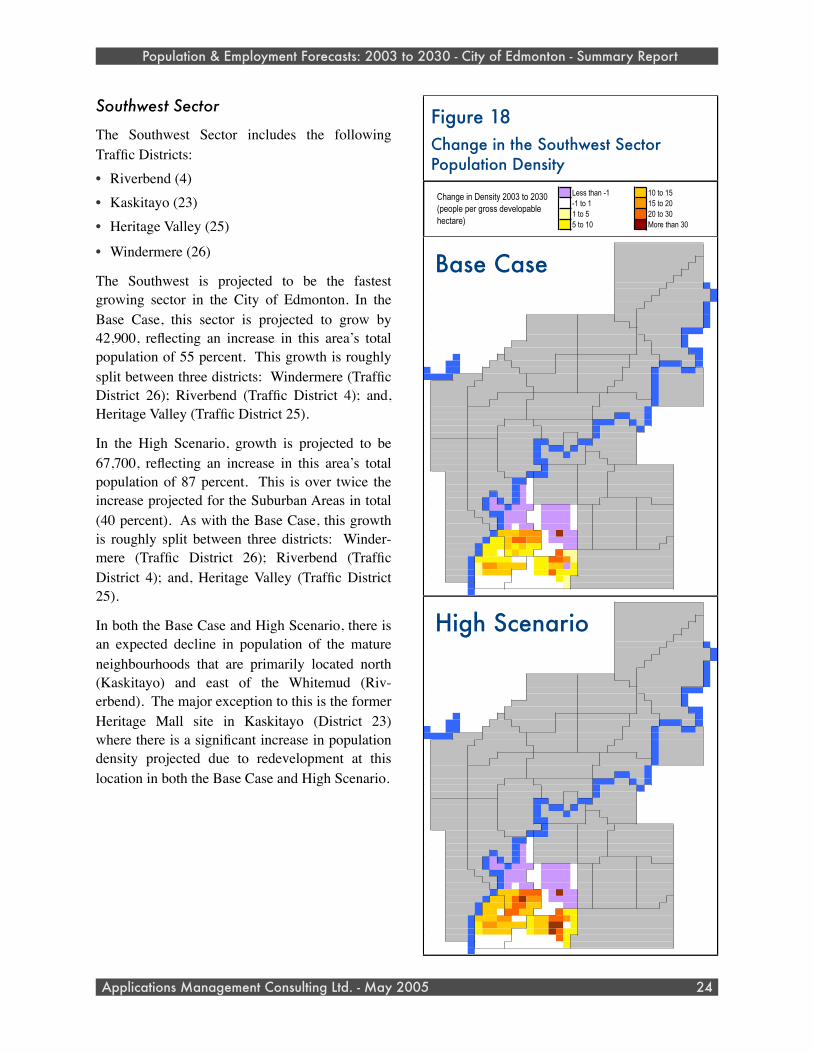
Southwest Sector
The Southwest Sector includes the following Traffic Districts:• Riverbend (4)• Kaskitayo (23)• Heritage Valley (25)
• Windermere (26)
The Southwest is projected to be the fastest growing sector in the City of Edmonton. In the Base Case, this sector is projected to grow by 42,900, reflecting an increase in this area’s total population of 55 percent. This growth is roughly split between three districts: Windermere (Traffic District 26); Riverbend (Traffic District 4); and, Heritage Valley (Traffic District 25).
In the High Scenario, growth is projected to be 67,700, reflecting an increase in this area’s total population of 87 percent. This is over twice the increase projected for the Suburban Areas in total (40 percent). As with the Base Case, this growth is roughly split between three districts: Winder-mere (Traffic District 26); Riverbend (Traffic District 4); and, Heritage Valley (Traffic District 25).
In both the Base Case and High Scenario, there is an expected decline in population of the mature neighbourhoods that are primarily located north (Kaskitayo) and east of the Whitemud (Riv-erbend). The major exception to this is the former Heritage Mall site in Kaskitayo (District 23) where there is a significant increase in population density projected due to redevelopment at this location in both the Base Case and High Scenario.
Population & Employment Forecasts: 2003 to 2030 - City of Edmonton - Summary Report
Applications Management Consulting Ltd. - May 2005 24
Figure 18Change in the Southwest Sector Population Density
Less than -1 10 to 15-1 to 1 15 to 201 to 5 20 to 305 to 10 More than 30
Change in Density 2003 to 2030 (people per gross developable hectare)
0 0 0 0 0 0 0 0 0 0 0 0 0 0 0 0 0 0 0 0 0 0 0 0 0 0 0 0 0 0 0 0 0 0 0 0 0 0 0 0
0 0 0 0 0 0 0 0 0 0 0 0 0 0 0 0 0 0 0 0 0 0 0 0 0 0 -0.01 -0.01 -0.01 -0 -0 -0.02 -0.02 0 0 -0.02 -0.02 -0.02 0 0
0 0 0 0 0 0 0 0 0 0 0 0 0 0 0 0 0 0 0 0 0 0 0 0 0 0 -0.01 -0.02 -0.02 -0.02 -0.02 -0.02 -0.02 -0 -0 -0.04 -0.04 -0.04 0 0
0 0 0 0 0 0 0 0 0 0 0 0 0 0 0 0 0 0 0 0 0 0 0 0 0 0 0 -0.01 -0.01 -0.04 -0.04 -0.02 -0.02 -0.01 -0.01 -0.01 -0.01 -0.01 0 0
0 0 0 0 0 0 0 0 0 0 0 0 0 0 0 0 0 0 0 0 0 0 0 0 0 0 0 -0.02 -0.02 -0.01 -0.01 -0.01 -0.01 -0.02 -0.02 -0.01 -0.01 -0.01 0 0
0 0 0 0 0 0 0 0 0 0 0 0 0 0 0 0 0 0 0 0 0 0 0 0 0 0 0 0.003 0.003 -0 -0 0.001 0.001 -0 -0 -0.01 -0.01 -0.01 0 0
0 0 0 0 0 0 0 0 0 0 0 0 0 0 0 0 0 0 0 0 0 0 0 0 0 0 0 0.002 0.002 -0 -0 -0.01 -0.01 0.75 -0.02 -0 -0 -0 0 0
0 0 0 0 0 0 0 0 0 0 0 0 0 0 0 0 0 0 0 0 0 0 0 0 0 0 -0 -0.02 -0.02 -0.03 -0.03 6E-04 6E-04 -0.02 -0.01 -0 -0 -0 0
0 0 0 0 0 0 0 0 0 0 0 0 0 0 0 0 0 0 0 0 0 0 0 0 0 0 -0 -0 -0 -0.06 -0.06 6E-04 -0.04 -0.02 -0.01 -0.06 -0.06 -0.02 -0.02
0 0 0 0 0 0 0 0 0 0 0 0 0 0 0 0 0 0 0 0 0 0 0 0 0 0 -0 -0 -0 -0.06 -0.06 -0.04 -0.04 -0.01 -0.01 -0.06 -0.06 -0.02 -0.02
0 0 0 0 0 0 0 0 0 0 0 0 0 0 0 0 0 0 0 0 0 0 0 0 0 0 -0.02 -0.02 -0.01 -0.01 0 -0.01 -0.01 -0.05 -0.01 -0.01 -0.02 -0.02 0
0 0 0 0 0 0 0 0 0 0 0 0 0 0 0 0 0 0 0 0 0 0 0 0 0 0 -0.02 -0.02 -0.01 0 0 -0.01 -0.01 -0.05 -0.01 -0.02 -0.02 -0.02 0
0 0 0 0 0 0 0 0 0 0 0 0 0 0 7E-04 7E-04 0.098 0.098 10.96 11.64 11.64 0.864 18.35 16.62 18.9 4.473 -0.02 -0.01 -0.01 0 0 -0.01 0.002 -0.05 -0.02 -0.02 -0.02 -0.02 0
0 0 0 0 0 0 0 0 0 0 0 0 0 0 7E-04 7E-04 0.098 18.04 10.96 11.64 11.64 0.864 18.35 16.62 18.9 4.473 4.473 4.473 -0.01 0 0 0.002 0.002 -0.05 -0.02 -0.02 -0.02 -0.02 0
0 0 0 0 0 0 0 0 0 0 0 0 0 0 7E-04 24.76 11.37 18.04 10.96 11.64 11.64 0.864 18.35 16.62 18.9 4.473 4.473 17.23 17.23 0 2.424 -0.02 -0.05 -0.05 -0.02 0 0
0 0 0 0 0 0 0 0 0 0 0 0 0 0 24.76 24.76 11.37 18.04 -4.98 -4.98 -4.98 0.864 18.35 27.54 31.25 4.473 4.473 17.23 17.23 -0.05 0 -0.02 1.05 -0.01 -0.02 0 0 0 0
0 0 0 0 0 0 0 0 0 0 0 0 -0 -0 15.33 12.44 -3.72 -3.72 -5.39 -5.39 -5.39 14.76 0.479 5.795 9.949 11.17 17.74 11.15 11.15 -0.05 -0.05 -0 -0 -0.01 -0.01 0 0 0 0
0 0 0 0 0 0 0 0 0 0 0 -0 -0 -0 15.33 12.44 -3.72 -3.72 -1.73 -1.73 -1.73 14.76 0.479 5.795 9.949 11.17 17.74 11.15 11.15 -0.05 0 -0 -0 -0.01 -0.01 -0.01 0 0
0 0 0 0 0 0 0 0 0 -0 -0 -0.01 -0.01 53.64 1.895 8.037 -5.35 46.83 46.83 46.83 0.467 0.467 0.636 0.636 -0.11 3.984 15.28 0 -0.86 2.194 2.194 -0 -0.01 -0.01 -0.01 -0.01 0 0
0 0 0 0 0 0 0 -0 -0 -0.02 -0.01 -0.01 15.92 15.92 8.037 -5.32 35.05 35.05 35.05 0.467 0.467 0.636 0.636 -0.11 5.249 15.28 0 -0.86 2.194 2.194 -0.01 -0.01 0 0
0 0 0 0 0 -0 -0 -0 -0.02 -0.02 -0.01 15.92 0 0 -5.32 35.05 35.05 35.05 -0.39 -0.39 -0.42 0 5.249 5.249 4.26 -1.26 -1.12 -1.12 -0.01 -0.01 0 0 0 0
3.677 3.677 7.144 7.144 -0 -0 -0 -0.01 -0.01 0 -1.46 -1.46 -0.98 -0.98 -1.52 -1.52 -1.52 0 -0.55 -0.48 -0.48 3.723 3.723 4.26 -1.43 -1.43 -2.35 -0.01 -0.01 0 0 0 0 0 0
0 -0 0 3.677 3.677 3.677 7.144 -0 -0 -0 -0 -0.01 -0.01 0 2.804 2.804 0.141 -2.63 -2.63 -1.82 -1.82 -0.55 -0.55 -0.48 -0.48 3.723 0 -1.16 -1.43 -1.43 -2.35 -0.01 -0.01 0 0 0 0 0 0
0 -0 0 3.396 3.396 3.396 -0.08 -0.08 -0.08 0 0 -0.01 -0.01 0 0 2.804 0.141 -2.63 -2.63 -1.82 -1.82 -0.12 -0.12 -0.09 -0.09 -0.08 -0.08 -0.92 -0.92 -1.65 3.761 -0.01 -0.01 0 0 0 0 0 0
0 0.012 0.012 3.396 3.396 3.396 -0.08 -0.08 -0.08 0 0 0 0 -0.07 -0.07 -0.17 -0.17 -0.17 -0.07 -0.07 5.015 -0.11 -0.07 -0.07 -0.14 -0.14 -3.21 -2.2 -2.2 -1.65 3.761 -0.01 -0.01 0 0 0 0 0 0
0 0 -0.01 -0.02 -0.02 -0.02 -0.08 -0.08 -0.08 0.111 0 0 0 0 0.689 0.689 1.123 1.226 0 0 5.015 -3.35 2.291 -2.04 -3.08 -3.08 -3.21 -3.02 -3.02 -2.55 0.17 -0.01 -0.01 0 0 0 0 0 0
0 0 -0.01 -0.02 -0.02 -0.02 0 -0 0 0.111 0 0 0 0 -4.46 -4.46 -0.04 -0.04 0 0 2.118 1.215 2.291 0.006 0.055 0.347 -0.1 -0.2 -0.2 0.17 0 0 0 0 0 0 0 0 0
0 0 -0.01 -0.02 -0 -0 -0 -0 0 0.111 0 0 -1.72 0 -4.46 0 -0.04 -0.04 -0.14 0 2.118 1.215 5.301 0.891 0.055 0.347 -0.2 0.17 0 0 0 0 0 0 0 0 0
0 -0.12 -0.11 -0 -0 -0 -0 -0 -0.02 0 0 1.323 -0.37 0.037 0.417 3.529 3.529 3.913 3.913 6.316 19.46 0.608 0.608 -0.1 -0.1 0.17 0 0 0 0 0 0 0 0 0
0 -0.12 -0.11 -0.04 -0.04 -0.04 -0.03 -0.03 -0.02 0 1.673 1.673 2.038 0.751 0.03 0.03 3.529 3.913 3.913 6.316 6.316 2.295 2.295 1.287 1.287 -0.1 -0.1 -0.1 0 0 0 0 0 0 0 0 0 0
0 -0.11 -0.11 -0.04 -0.04 -0.04 0 0 0 0 1.673 1.673 2.038 0.751 0.03 0.03 5.226 5.226 18.11 94.54 162 4.881 6.032 1.287 0.041 -0.1 -0.06 -0.06 0 0 0 0 0 0 0 0 0 0 0
0 -0.04 -0.04 -0.05 -0.05 -0.05 0 0 0 0 0.124 0.124 0.51 -0.13 -0.13 5.226 11.92 26.5 75.39 0.957 1.11 -0.96 -0.96 0 0 0 0 0 0 0 0 0 0 0 0 0
0 0.044 0.044 11.74 11.74 -0.05 -0.68 -0.68 -0.68 -2.08 0.124 0.124 0.51 -0.13 -0.13 -0.09 1.962 4.625 0.957 1.537 1.11 -0.96 -0.96 0 0 0 0 0 0 0 0 0 0 0 0 0
0 0.044 0.044 17.93 17.93 -0.05 0.098 0.098 0.098 1.552 0.771 0.081 -0.22 -0.16 -0.16 -0.09 -0.05 12.94 7.798 4.625 1.085 1.085 1.11 -0.96 -0.96 0 0 0 0 0 0 0 0 0 0 0 0 0
0 14.02 14.02 17.93 17.93 14.57 -4.71 -4.71 -4.71 11.32 0.771 0.081 0.771 -0.16 -0.16 0.774 12.94 12.3 7.798 4.625 1.085 1.085 -0.24 1.065 1.065 0 0 0 0 0 0 0 0 0 0 0 0 0
0 0 23.43 10.79 14.57 14.57 -4.71 -4.71 -4.71 -1.38 0.797 0.797 -0.08 -0.08 -0.1 -0.1 0 0 0.802 -0.08 2.281 2.281 2.524 2.524 2.524 3.755 -0.15 -0.15 0 0 0 -0.01 -0.01 0 0 0 0 0 0
0 0 0 18.48 20.03 20.03 -1.28 -1.28 -1.28 -0.15 -0.04 0 0.07 0.876 0 0 0.802 -0.06 -0.01 2.281 1.232 1.232 3.755 0 -0.15 -0.15 0 0 0 -0.01 -0.01 0 0 0 0 0 0
0 0 0 18.48 20.03 20.03 -3.41 -3.41 -3.41 -1.78 -0.04 -0.04 -0.08 0.181 0.181 0 -0.12 0 -0.06 -0.01 0.073 2.813 1.232 0 0 -0 -0 0 0 0 -0.05 -0.01 0 0 0 0 0 0
0 0 0 13.42 6.386 6.386 -2.68 -2.68 0.462 -0.21 0.466 0.466 -2.15 -0.08 0.181 9.994 9.994 0.734 0.734 0.003 -0.02 -0.02 0 0 0 0 0 0 0 0 0 -0.01 -0.01 0 0 0 0 0 0
0 0 0 13.42 6.386 6.386 -2.68 -2.68 0.462 0.466 0.466 -2.15 -0.08 3.108 0 4.822 0.734 0.734 0.003 0 0 0 0 0 0 0 0 0 0 0 -0.01 -0.01 0 0 0 0 0 0
0 0 0 7.298 7.298 6.386 2.06 10.65 -2.23 0.466 -4.03 -0.08 0.005 5.324 5.324 0 0.293 0.006 0 0 0 -1.49 0 0 1.687 1.687 9.409 9.409 0 0 -0.01 0 0 0 0 0 0
0 0 0 7.298 7.298 4.141 2.06 10.65 -2.23 -2.23 -4.03 -1.45 -1.45 0.044 -2.96 -2.96 -2.36 -2.36 0 -0.01 -0.01 -1.41 -1.49 0 0 1.687 -1.44 9.409 9.409 9.409 7.435 7.435 0 0 0 0 0 0
0 0 0 7.298 -0 4.141 4.141 4.701 4.701 -2.23 -2.23 -1.45 0.044 0.044 -2.96 -4.84 -4.64 -4.64 0 0 0 -1.41 -1.41 0 0 -1.44 -1.44 11.83 11.83 11.83 11.61 7.435 0 0 0 0 0 0
0 0 0 -0 -0 4.141 4.141 4.141 4.701 4.701 -1.51 -1.45 -1.45 -0.13 -0.13 -4.84 -4.84 -4.64 -2.88 0.85 -0.02 -0.02 -2.64 0 -2.69 -2.69 -2.16 -1.44 11.83 11.83 11.83 11.61 12.95 0 0 0 0 0 0
0 0 0 -0 0 4.141 4.141 7.291 7.291 4.701 -1.51 -0.76 -1.54 -2.58 -0.13 -2.7 -2.7 -2.88 -2.88 0.85 -0 -0 -2.56 -2.56 0 3.551 -3.52 -2.51 12.31 12.31 12.31 11.61 12.95 0 0 0 0 0 0
0 0 0 0 0 4.141 7.291 7.291 7.291 12.64 12.64 12.64 19.74 19.74 18.62 0.214 -6.61 88.2 -4.58 -2.95 0 0 -2.58 -2.58 0 7.682 -3.25 -2.72 12.51 12.24 12.24 7.264 7.264 0 0 0 0 0 0
0 0 0 -0 -0 1.889 1.889 1.889 7.814 7.814 12.64 29.33 29.58 15.96 15.96 -0.8 -2.46 -2.95 -2.54 -2.54 0 0 -1.17 -2.48 -2.48 -2.31 -3.25 -2.72 12.51 12.24 12.24 7.264 -0 0 0 0 0 0 0
0 0 0 0 0 1.889 1.889 7.814 7.814 7.814 12.64 7.484 12.78 6.296 6.296 -0.8 -0.8 -0.8 -2.54 -2.54 0 0 -1.17 -1.65 -1.9 -1.9 -1.64 -1.64 12.51 12.24 12.24 -0 -0 0 0 0 0 0 0
0 0 0 0.01 0.01 1.889 1.889 6.418 6.418 0 7.484 12.78 6.296 6.296 -0.8 -0.8 -0.8 21.28 4.908 4.908 0 0 10.15 10.15 6.103 6.103 4.347 4.347 0 0 0 -0 -0 0 0 0 0 0 0
0 0 0 0.01 0.01 1.889 6.418 6.418 6.418 7.278 7.278 0 0 0 8.995 8.995 21.28 21.28 15.84 4.908 0 0 10.15 10.15 6.103 6.103 4.347 4.347 0 0 0 -0 -0 0 0 0 0 0 0
0 0 0 0.007 0.007 0.007 2.22 17.34 17.34 10.4 10.4 10.4 10.4 0 8.995 8.995 13.23 13.23 -1.44 7.422 0 0 34 34 12.72 12.72 5.925 5.925 4E-04 4E-04 4E-04 -0 -0 0 0 0 0 0 0
0 0 0 0.007 0.007 0.007 2.22 12.69 12.69 10.94 10.94 1E-04 0 0 8.995 8.995 26.21 8.83 7.422 7.422 0 29.25 17.85 17.85 1.257 1.257 1.278 1.278 4E-04 4E-04 4E-04 0 0 0 0 0 0 0 0
0 0 0 0.007 0.007 0.007 0 7E-05 7E-05 0.025 0.025 1E-04 0 4E-04 0 0 -0.02 8.83 2.662 0 0 12.54 5.753 5.753 5E-04 5E-04 -0 -0 0.001 0.001 0.001 6E-04 6E-04 0 0 0 0 0 0
0 0 0 0 0 0 0 6E-05 6E-05 0.025 1E-04 1E-04 0 4E-04 7E-04 7E-04 0.002 -0 2.662 0 0 12.54 5E-04 5E-04 0 0 0 0 0 0 0 4E-04 4E-04 0 0 0 0 0 0
0 0 0 0 0 0 0 0 0 0 0 0 0 0 0 0 0 0 0 0 0 0 0 0 0 0 0 0 0 0 0 0 0 0 0 0 0 0 0 0 0 0 0 0 0 0 0 0 0 0 0 0 0 0 0 0 0 0 0 0 0 0 0 0 0 0 0 0 0 0 0 0 0 0 0 0 0 0 0
0 0 0 0 0 0 0 0 0 0 0 0 0 0 0 0 0 0 0 0 0 0 0 0 0 0 -0 -0.01 -0.01 -0 -0 -0.02 -0.02 0 0 -0.02 -0.02 -0.02 0 0
0 0 0 0 0 0 0 0 0 0 0 0 0 0 0 0 0 0 0 0 0 0 0 0 0 0 -0 -0.02 -0.02 -0.01 -0.01 -0.02 -0.02 0.001 0.001 -0.03 -0.03 -0.03 0 0
0 0 0 0 0 0 0 0 0 0 0 0 0 0 0 0 0 0 0 0 0 0 0 0 0 0 0 -0 -0 -0.03 -0.03 -0.02 -0.02 -0 -0 -0 -0 -0.01 0 0
0 0 0 0 0 0 0 0 0 0 0 0 0 0 0 0 0 0 0 0 0 0 0 0 0 0 0 -0.02 -0.02 -0.01 -0.01 -0.01 -0.01 -0.02 -0.02 -0 -0.01 -0.01 0 0
0 0 0 0 0 0 0 0 0 0 0 0 0 0 0 0 0 0 0 0 0 0 0 0 0 0 0 0.007 0.007 -0 -0 0.003 0.003 0.002 0.002 -0.01 -0.01 -0.01 0 0
0 0 0 0 0 0 0 0 0 0 0 0 0 0 0 0 0 0 0 0 0 0 0 0 0 0 0 0.007 0.007 0.001 0.001 -0.01 -0.01 1.398 -0.01 -0 -0 -0 0 0
0 0 0 0 0 0 0 0 0 0 0 0 0 0 0 0 0 0 0 0 0 0 0 0 0 0 -0 -0.02 -0.02 -0.02 -0.02 0.003 0.003 -0.01 -0.01 -0 -0 -0 0
0 0 0 0 0 0 0 0 0 0 0 0 0 0 0 0 0 0 0 0 0 0 0 0 0 0 -0 -0 -0 -0.05 -0.05 0.003 -0.03 -0.01 -0.01 -0.06 -0.06 -0.01 -0.01
0 0 0 0 0 0 0 0 0 0 0 0 0 0 0 0 0 0 0 0 0 0 0 0 0 0 -0 -0 -0 -0.05 -0.05 -0.03 -0.03 -0.01 -0.01 -0.06 -0.06 -0.01 -0.01
0 0 0 0 0 0 0 0 0 0 0 0 0 0 0 0 0 0 0 0 0 0 0 0 0 0 -0.02 -0.02 -0.01 -0.01 0 -0.01 -0.01 -0.04 -0.01 -0.01 -0.01 -0.01 0
0 0 0 0 0 0 0 0 0 0 0 0 0 0 0 0 0 0 0 0 0 0 0 0 0 0 -0.02 -0.02 -0.01 0 0 -0.01 -0.01 -0.04 -0.01 -0.01 -0.01 -0.01 0
0 0 0 0 0 0 0 0 0 0 0 0 0 0 -0 -0 0.187 0.187 24.43 15.07 15.07 1.785 21.18 23.36 26.32 8.987 -0.02 -0.01 -0.01 0 0 -0.01 0.005 -0.04 -0.01 -0.01 -0.01 -0.01 0
0 0 0 0 0 0 0 0 0 0 0 0 0 0 -0 -0 0.187 20.49 24.43 15.07 15.07 1.785 21.18 23.36 26.32 8.987 8.987 8.987 -0.01 0 0 0.005 0.005 -0.03 -0.01 -0.01 -0.01 -0.01 0
0 0 0 0 0 0 0 0 0 0 0 0 0 0 -0 25.01 26.92 20.49 24.43 15.07 15.07 1.785 21.18 23.36 26.32 8.987 8.987 23.95 23.95 0 3.376 -0.02 -0.03 -0.03 -0.01 0 0
0 0 0 0 0 0 0 0 0 0 0 0 0 0 25.01 25.01 26.92 20.49 -3.38 -3.38 -3.38 1.785 21.18 29.15 33.66 8.987 8.987 23.95 23.95 -0.03 0 -0.02 1.586 -0.01 -0.01 0 0 0 0
0 0 0 0 0 0 0 0 0 0 0 0 -0 -0 31.79 12.05 -2.31 -2.31 -3.71 -3.71 -3.71 18.87 3.159 11.64 11.91 13.99 20.52 32.21 32.21 -0.03 -0.03 -0 -0 -0.01 -0.01 0 0 0 0
0 0 0 0 0 0 0 0 0 0 0 -0 -0 -0 31.79 12.05 -2.31 -2.31 -1.15 -1.15 -1.15 18.87 3.159 11.64 11.91 13.99 20.52 32.21 32.21 -0.03 0 -0 -0 -0.01 -0.01 -0.01 0 0
0 0 0 0 0 0 0 0 0 -0 -0 -0 -0 53.06 4.911 9.141 -3.74 51.89 51.89 51.89 1.448 1.448 1.396 1.396 -0.11 3.941 17.53 0 -0.12 5.351 5.351 -0 -0.01 -0.01 -0.01 -0.01 0 0
0 0 0 0 0 0 0 -0 -0 -0.01 -0 -0 25.36 25.36 9.141 -3.53 40.76 40.76 40.76 1.448 1.448 1.396 1.396 -0.11 5.189 17.53 0 -0.12 5.351 5.351 -0.01 -0.01 0 0
0 0 0 0 0 -0 -0 -0 -0.01 -0.01 -0 25.36 0 0 -3.53 40.76 40.76 40.76 -0.39 -0.39 -0.42 0 5.189 5.189 6.344 -0.26 -0.21 -0.21 -0.01 -0.01 0 0 0 0
6.189 6.189 7.062 7.062 -0 -0 -0 -0 -0 0 -0.26 -0.26 -0.8 -0.8 -0.05 -0.05 -0.05 0 -0.08 -0.08 -0.08 3.88 3.88 6.344 -0.68 -0.68 -0.99 -0.01 -0.01 0 0 0 0 0 0
0 -0 0 6.189 6.189 6.189 7.062 -0 -0 -0 -0 -0 -0 0 4.204 4.204 0.771 -0.15 -0.15 -0.1 -0.1 -0.08 -0.08 -0.08 -0.08 3.88 0 -0.17 -0.68 -0.68 -0.99 -0.01 -0.01 0 0 0 0 0 0
0 -0 0 6.873 6.873 6.873 -0.06 -0.06 -0.06 0 0 -0 -0 0 0 4.204 0.771 -0.15 -0.15 -0.1 -0.1 0.906 0.906 0.461 0.461 -0.04 -0.04 -0.26 -0.26 -0.65 5.318 -0.01 -0.01 0 0 0 0 0 0
0 0.012 0.012 6.873 6.873 6.873 -0.06 -0.06 -0.06 0 0 0 0 -0.07 -0.07 -0.16 -0.16 -0.16 -0.05 -0.05 7.238 -0.08 -0.05 -0.05 -0.11 -0.11 -0.36 0.302 0.302 -0.65 5.318 -0.01 -0.01 0 0 0 0 0 0
0 0 -0 -0.01 -0.01 -0.01 -0.06 -0.06 -0.06 0.208 0 0 0 0 1.14 1.14 1.726 1.595 0 0 7.238 -1.95 3.25 -1.41 0.141 0.141 -0.36 -0.28 -0.28 0 0.816 -0.01 -0.01 0 0 0 0 0 0
0 0 -0 -0.01 -0.01 -0.01 0 -0 0 0.208 0 0 0 0 -4.09 -4.09 -0.04 -0.04 0 0 2.018 2.378 3.25 0.015 0.055 0.347 0.277 0.196 0.196 0.816 0 0 0 0 0 0 0 0 0
0 0 -0 -0.01 -0 -0 -0 -0 0 0.208 0 0 -1.58 0 -4.09 0 -0.04 -0.04 -0.1 0 2.018 2.378 6.7 0.891 0.055 0.347 0.196 0.816 0 0 0 0 0 0 0 0 0
0 -0.09 -0.11 -0 -0 -0 -0 -0 -0.02 0 0 1.599 1.041 0.282 1.856 3.621 3.621 6.023 6.023 11.94 23.2 6.597 6.597 -0.1 -0.1 0.816 0 0 0 0 0 0 0 0 0
0 -0.09 -0.11 -0.03 -0.03 -0.03 -0.03 -0.03 -0.02 0 1.556 1.556 4.672 0.709 0.494 0.494 3.621 6.023 6.023 11.94 11.94 9.705 9.705 1.214 1.214 -0.1 -0.1 -0.1 0 0 0 0 0 0 0 0 0 0
0 -0.09 -0.09 -0.03 -0.03 -0.03 0 0 0 0 1.556 1.556 4.672 0.709 0.494 0.494 12.83 12.83 18.29 133.3 295.9 16.37 9.96 1.214 0.041 -0.1 -0.06 -0.06 0 0 0 0 0 0 0 0 0 0 0
0 -0.03 -0.03 -0.04 -0.04 -0.04 0 0 0 0 0.124 0.124 0.51 -0.13 -0.13 12.83 18.9 26.36 125 1.007 1.012 0.538 0.538 0 0 0 0 0 0 0 0 0 0 0 0 0
0 0.044 0.044 12.6 12.6 -0.04 -0.58 -0.58 -0.58 -1.31 0.124 0.124 0.51 -0.13 -0.13 -0.09 4.263 6.727 1.007 1.724 1.012 0.538 0.538 0 0 0 0 0 0 0 0 0 0 0 0 0
0 0.044 0.044 37.41 37.41 -0.04 0.098 0.098 0.098 1.552 1.094 0.798 -0.22 -0.16 -0.16 -0.09 -0.05 14.37 9.975 6.727 3.503 3.503 1.012 0.538 0.538 0 0 0 0 0 0 0 0 0 0 0 0 0
0 13.87 13.87 37.41 37.41 14.26 -2.58 -2.58 -2.58 11.63 1.094 0.798 0.734 -0.16 -0.16 1.322 14.37 15.7 9.975 6.727 3.503 3.503 3.098 1.077 1.077 0 0 0 0 0 0 0 0 0 0 0 0 0
0 0 24.53 11.09 14.26 14.26 -2.58 -2.58 -2.58 -1.26 0.802 0.802 0.999 0.999 -0.1 -0.1 0 3.769 1.767 -0.04 3.785 3.785 3.661 3.661 3.661 3.751 -0.1 -0.1 0 0 0 -0.01 -0.01 0 0 0 0 0 0
0 0 0 20.2 20.47 20.47 -1.17 -1.17 -1.17 -0.06 -0.04 0 0.07 0.876 0 3.769 1.767 -0.03 -0.01 3.785 2.238 2.238 3.751 0 -0.1 -0.1 0 0 0 -0.01 -0.01 0 0 0 0 0 0
0 0 0 20.2 20.47 20.47 -0.71 -0.71 -0.71 0.002 -0.04 -0.04 -0.08 1.638 1.638 0 2.957 0 -0.03 -0.01 0.222 4.48 2.238 0 0 -0 -0 0 0 0 -0.05 -0.01 0 0 0 0 0 0
0 0 0 20.5 19.48 19.48 -1 -1 0.462 -0.21 0.494 0.494 -1.38 -0.08 1.638 19.49 19.49 0.985 0.985 0.009 -0.02 -0.02 0 0 0 0 0 0 0 0 0 -0.01 -0.01 0 0 0 0 0 0
0 0 0 20.5 19.48 19.48 -1 -1 0.462 0.494 0.494 -1.38 -0.08 3.507 0 6.064 0.985 0.985 0.009 0 0 0 0 0 0 0 0 0 0 0 -0.01 -0.01 0 0 0 0 0 0
0 0 0 11.96 11.96 19.48 2.775 23.14 -1.75 0.494 -2.7 -0.08 1.793 8.741 8.741 0 1.568 0.018 0 0 0 -1.4 0 0 3.16 3.16 11.94 11.94 0 0 -0.01 0 0 0 0 0 0
0 0 0 11.96 11.96 6.689 2.775 23.14 -1.75 -1.75 -2.7 -1.13 -1.13 0.044 -2.35 -2.35 -2.17 -2.17 0 -0.01 -0.01 -1.33 -1.4 0 0 3.16 0.148 11.94 11.94 11.94 12.2 12.2 0 0 0 0 0 0
0 0 0 11.96 -0 6.689 6.689 9.843 9.843 -1.75 -1.75 -1.13 0.044 0.044 -2.35 -3.14 -3.9 -3.9 0 0 0 -1.33 -1.33 0 0 0.148 0.148 14.8 14.8 14.8 17.42 12.2 0 0 0 0 0 0
0 0 0 -0 -0 6.689 6.689 6.689 9.843 9.843 -1.19 -1.13 -1.13 0.293 0.293 -3.14 -3.14 -3.9 -2.42 0.85 -0.01 -0.01 -1.82 0 -1.91 -1.91 -1.3 0.148 14.8 14.8 14.8 17.42 12.8 0 0 0 0 0 0
0 0 0 -0 0 6.689 6.689 11.95 11.95 9.843 -1.19 -0.68 -1.44 -2.52 0.293 -2.03 -2.03 -2.42 -2.42 0.85 -0 -0 -1.67 -1.67 0 7.72 -2.68 -1.6 21.64 21.64 21.64 17.42 12.8 0 0 0 0 0 0
0 0 0 0 0 6.689 11.95 11.95 11.95 12.92 12.92 12.92 23.86 23.86 29.45 0.214 -3.12 99.36 -3.29 -2.54 0 0 -1.8 -1.8 0 9.707 -2.22 -1.78 19.31 12.76 12.76 7.81 7.81 0 0 0 0 0 0
0 0 0 -0 -0 5.653 5.653 5.653 13.16 13.16 12.92 29.58 34.71 15.98 15.98 -0.08 -1.63 -2.54 -2.24 -2.24 0 0 -1.1 -1.74 -1.74 -1.56 -2.22 -1.78 19.31 12.76 12.76 7.81 -0 0 0 0 0 0 0
0 0 0 0 0 5.653 5.653 13.16 13.16 13.16 12.92 21.86 26.75 11.09 11.09 -0.08 -0.08 -0.08 -2.24 -2.24 0 0 -1.1 -1.11 -1.3 -1.3 -1.03 -1.03 19.31 12.76 12.76 -0 -0 0 0 0 0 0 0
0 0 0 0.01 0.01 5.653 5.653 10.25 10.25 0 21.86 26.75 11.09 11.09 -0.08 -0.08 -0.08 28.08 5.769 5.769 0 0 21.14 21.14 9.67 9.67 12.74 12.74 0 0 0 -0 -0 0 0 0 0 0 0
0 0 0 0.01 0.01 5.653 10.25 10.25 10.25 16.94 16.94 0 0 5.952 11.1 11.1 28.08 28.08 16.71 5.769 0 0 21.14 21.14 9.67 9.67 12.74 12.74 0 0 0 -0 -0 0 0 0 0 0 0
0 0 0 0.007 0.007 0.007 8.571 17.22 17.22 11.19 11.19 11.19 11.19 5.952 11.1 11.1 37.91 37.91 0.154 7.822 0 0 42.83 42.83 13.68 13.68 6.142 6.142 4E-04 4E-04 4E-04 -0 -0 0 0 0 0 0 0
0 0 0 0.007 0.007 0.007 8.571 12.65 12.65 14.9 14.9 1E-04 0 5.952 11.1 11.1 37.01 24.04 7.822 7.822 0 32.43 26.75 26.75 5.68 5.68 5.774 5.774 4E-04 4E-04 4E-04 0 0 0 0 0 0 0 0
0 0 0 0.007 0.007 0.007 0 7E-05 7E-05 0.025 0.025 1E-04 0 4E-04 0 0 -0.02 24.04 8.046 0 0 13.49 5.942 5.942 5E-04 5E-04 -0 -0 0.001 0.001 0.001 6E-04 6E-04 0 0 0 0 0 0
0 0 0 0 0 0 0 6E-05 6E-05 0.025 1E-04 1E-04 0 4E-04 7E-04 7E-04 0.002 -0 8.046 0 0 13.49 5E-04 5E-04 0 0 0 0 0 0 0 4E-04 4E-04 0 0 0 0 0 0
0 0 0 0 0 0 0 0 0 0 0 0 0 0 0 0 0 0 0 0 0 0 0 0 0 0 0 0 0 0 0 0 0 0 0 0 0 0 0
Base Case
High Scenario
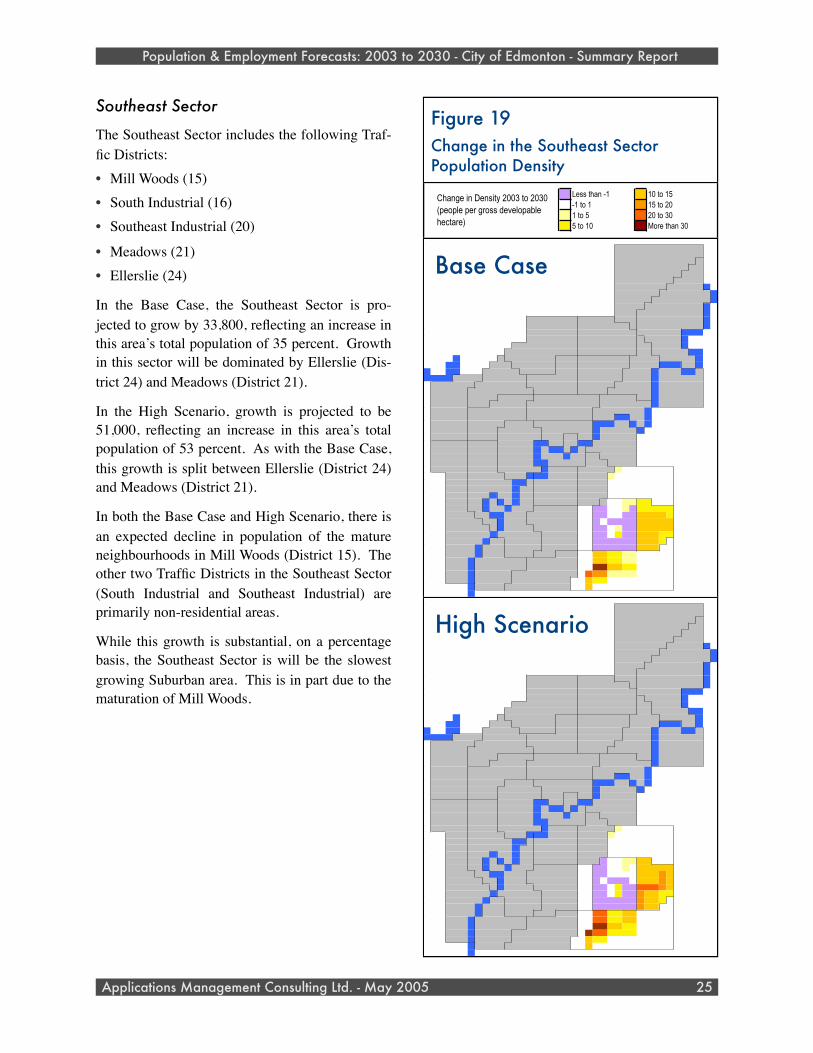
Southeast Sector
The Southeast Sector includes the following Traf-fic Districts:• Mill Woods (15)• South Industrial (16)• Southeast Industrial (20)
• Meadows (21)• Ellerslie (24)
In the Base Case, the Southeast Sector is pro-jected to grow by 33,800, reflecting an increase in this area’s total population of 35 percent. Growth in this sector will be dominated by Ellerslie (Dis-trict 24) and Meadows (District 21).
In the High Scenario, growth is projected to be 51,000, reflecting an increase in this area’s total population of 53 percent. As with the Base Case, this growth is split between Ellerslie (District 24) and Meadows (District 21).
In both the Base Case and High Scenario, there is an expected decline in population of the mature neighbourhoods in Mill Woods (District 15). The other two Traffic Districts in the Southeast Sector (South Industrial and Southeast Industrial) are primarily non-residential areas.
While this growth is substantial, on a percentage basis, the Southeast Sector is will be the slowest growing Suburban area. This is in part due to the maturation of Mill Woods.
Population & Employment Forecasts: 2003 to 2030 - City of Edmonton - Summary Report
Applications Management Consulting Ltd. - May 2005 25
Figure 19Change in the Southeast Sector Population Density
Less than -1 10 to 15-1 to 1 15 to 201 to 5 20 to 305 to 10 More than 30
Change in Density 2003 to 2030 (people per gross developable hectare)
0 0 0 0 0 0 0 0 0 0 0 0 0 0 0 0 0 0 0 0 0 0 0 0 0 0 0 0 0 0 0 0 0 0 0 0 0 0 0 0
0 0 0 0 0 0 0 0 0 0 0 0 0 0 0 0 0 0 0 0 0 0 0 0 0 0 -0.01 -0.01 -0.01 -0 -0 -0.02 -0.02 0 0 -0.02 -0.02 -0.02 0 0
0 0 0 0 0 0 0 0 0 0 0 0 0 0 0 0 0 0 0 0 0 0 0 0 0 0 -0.01 -0.02 -0.02 -0.02 -0.02 -0.02 -0.02 -0 -0 -0.04 -0.04 -0.04 0 0
0 0 0 0 0 0 0 0 0 0 0 0 0 0 0 0 0 0 0 0 0 0 0 0 0 0 0 -0.01 -0.01 -0.04 -0.04 -0.02 -0.02 -0.01 -0.01 -0.01 -0.01 -0.01 0 0
0 0 0 0 0 0 0 0 0 0 0 0 0 0 0 0 0 0 0 0 0 0 0 0 0 0 0 -0.02 -0.02 -0.01 -0.01 -0.01 -0.01 -0.02 -0.02 -0.01 -0.01 -0.01 0 0
0 0 0 0 0 0 0 0 0 0 0 0 0 0 0 0 0 0 0 0 0 0 0 0 0 0 0 0.003 0.003 -0 -0 0.001 0.001 -0 -0 -0.01 -0.01 -0.01 0 0
0 0 0 0 0 0 0 0 0 0 0 0 0 0 0 0 0 0 0 0 0 0 0 0 0 0 0 0.002 0.002 -0 -0 -0.01 -0.01 0.75 -0.02 -0 -0 -0 0 0
0 0 0 0 0 0 0 0 0 0 0 0 0 0 0 0 0 0 0 0 0 0 0 0 0 0 -0 -0.02 -0.02 -0.03 -0.03 6E-04 6E-04 -0.02 -0.01 -0 -0 -0 0
0 0 0 0 0 0 0 0 0 0 0 0 0 0 0 0 0 0 0 0 0 0 0 0 0 0 -0 -0 -0 -0.06 -0.06 6E-04 -0.04 -0.02 -0.01 -0.06 -0.06 -0.02 -0.02
0 0 0 0 0 0 0 0 0 0 0 0 0 0 0 0 0 0 0 0 0 0 0 0 0 0 -0 -0 -0 -0.06 -0.06 -0.04 -0.04 -0.01 -0.01 -0.06 -0.06 -0.02 -0.02
0 0 0 0 0 0 0 0 0 0 0 0 0 0 0 0 0 0 0 0 0 0 0 0 0 0 -0.02 -0.02 -0.01 -0.01 0 -0.01 -0.01 -0.05 -0.01 -0.01 -0.02 -0.02 0
0 0 0 0 0 0 0 0 0 0 0 0 0 0 0 0 0 0 0 0 0 0 0 0 0 0 -0.02 -0.02 -0.01 0 0 -0.01 -0.01 -0.05 -0.01 -0.02 -0.02 -0.02 0
0 0 0 0 0 0 0 0 0 0 0 0 0 0 7E-04 7E-04 0.098 0.098 10.96 11.64 11.64 0.864 18.35 16.62 18.9 4.473 -0.02 -0.01 -0.01 0 0 -0.01 0.002 -0.05 -0.02 -0.02 -0.02 -0.02 0
0 0 0 0 0 0 0 0 0 0 0 0 0 0 7E-04 7E-04 0.098 18.04 10.96 11.64 11.64 0.864 18.35 16.62 18.9 4.473 4.473 4.473 -0.01 0 0 0.002 0.002 -0.05 -0.02 -0.02 -0.02 -0.02 0
0 0 0 0 0 0 0 0 0 0 0 0 0 0 7E-04 24.76 11.37 18.04 10.96 11.64 11.64 0.864 18.35 16.62 18.9 4.473 4.473 17.23 17.23 0 2.424 -0.02 -0.05 -0.05 -0.02 0 0
0 0 0 0 0 0 0 0 0 0 0 0 0 0 24.76 24.76 11.37 18.04 -4.98 -4.98 -4.98 0.864 18.35 27.54 31.25 4.473 4.473 17.23 17.23 -0.05 0 -0.02 1.05 -0.01 -0.02 0 0 0 0
0 0 0 0 0 0 0 0 0 0 0 0 -0 -0 15.33 12.44 -3.72 -3.72 -5.39 -5.39 -5.39 14.76 0.479 5.795 9.949 11.17 17.74 11.15 11.15 -0.05 -0.05 -0 -0 -0.01 -0.01 0 0 0 0
0 0 0 0 0 0 0 0 0 0 0 -0 -0 -0 15.33 12.44 -3.72 -3.72 -1.73 -1.73 -1.73 14.76 0.479 5.795 9.949 11.17 17.74 11.15 11.15 -0.05 0 -0 -0 -0.01 -0.01 -0.01 0 0
0 0 0 0 0 0 0 0 0 -0 -0 -0.01 -0.01 53.64 1.895 8.037 -5.35 46.83 46.83 46.83 0.467 0.467 0.636 0.636 -0.11 3.984 15.28 0 -0.86 2.194 2.194 -0 -0.01 -0.01 -0.01 -0.01 0 0
0 0 0 0 0 0 0 -0 -0 -0.02 -0.01 -0.01 15.92 15.92 8.037 -5.32 35.05 35.05 35.05 0.467 0.467 0.636 0.636 -0.11 5.249 15.28 0 -0.86 2.194 2.194 -0.01 -0.01 0 0
0 0 0 0 0 -0 -0 -0 -0.02 -0.02 -0.01 15.92 0 0 -5.32 35.05 35.05 35.05 -0.39 -0.39 -0.42 0 5.249 5.249 4.26 -1.26 -1.12 -1.12 -0.01 -0.01 0 0 0 0
3.677 3.677 7.144 7.144 -0 -0 -0 -0.01 -0.01 0 -1.46 -1.46 -0.98 -0.98 -1.52 -1.52 -1.52 0 -0.55 -0.48 -0.48 3.723 3.723 4.26 -1.43 -1.43 -2.35 -0.01 -0.01 0 0 0 0 0 0
0 -0 0 3.677 3.677 3.677 7.144 -0 -0 -0 -0 -0.01 -0.01 0 2.804 2.804 0.141 -2.63 -2.63 -1.82 -1.82 -0.55 -0.55 -0.48 -0.48 3.723 0 -1.16 -1.43 -1.43 -2.35 -0.01 -0.01 0 0 0 0 0 0
0 -0 0 3.396 3.396 3.396 -0.08 -0.08 -0.08 0 0 -0.01 -0.01 0 0 2.804 0.141 -2.63 -2.63 -1.82 -1.82 -0.12 -0.12 -0.09 -0.09 -0.08 -0.08 -0.92 -0.92 -1.65 3.761 -0.01 -0.01 0 0 0 0 0 0
0 0.012 0.012 3.396 3.396 3.396 -0.08 -0.08 -0.08 0 0 0 0 -0.07 -0.07 -0.17 -0.17 -0.17 -0.07 -0.07 5.015 -0.11 -0.07 -0.07 -0.14 -0.14 -3.21 -2.2 -2.2 -1.65 3.761 -0.01 -0.01 0 0 0 0 0 0
0 0 -0.01 -0.02 -0.02 -0.02 -0.08 -0.08 -0.08 0.111 0 0 0 0 0.689 0.689 1.123 1.226 0 0 5.015 -3.35 2.291 -2.04 -3.08 -3.08 -3.21 -3.02 -3.02 -2.55 0.17 -0.01 -0.01 0 0 0 0 0 0
0 0 -0.01 -0.02 -0.02 -0.02 0 -0 0 0.111 0 0 0 0 -4.46 -4.46 -0.04 -0.04 0 0 2.118 1.215 2.291 0.006 0.055 0.347 -0.1 -0.2 -0.2 0.17 0 0 0 0 0 0 0 0 0
0 0 -0.01 -0.02 -0 -0 -0 -0 0 0.111 0 0 -1.72 0 -4.46 0 -0.04 -0.04 -0.14 0 2.118 1.215 5.301 0.891 0.055 0.347 -0.2 0.17 0 0 0 0 0 0 0 0 0
0 -0.12 -0.11 -0 -0 -0 -0 -0 -0.02 0 0 1.323 -0.37 0.037 0.417 3.529 3.529 3.913 3.913 6.316 19.46 0.608 0.608 -0.1 -0.1 0.17 0 0 0 0 0 0 0 0 0
0 -0.12 -0.11 -0.04 -0.04 -0.04 -0.03 -0.03 -0.02 0 1.673 1.673 2.038 0.751 0.03 0.03 3.529 3.913 3.913 6.316 6.316 2.295 2.295 1.287 1.287 -0.1 -0.1 -0.1 0 0 0 0 0 0 0 0 0 0
0 -0.11 -0.11 -0.04 -0.04 -0.04 0 0 0 0 1.673 1.673 2.038 0.751 0.03 0.03 5.226 5.226 18.11 94.54 162 4.881 6.032 1.287 0.041 -0.1 -0.06 -0.06 0 0 0 0 0 0 0 0 0 0 0
0 -0.04 -0.04 -0.05 -0.05 -0.05 0 0 0 0 0.124 0.124 0.51 -0.13 -0.13 5.226 11.92 26.5 75.39 0.957 1.11 -0.96 -0.96 0 0 0 0 0 0 0 0 0 0 0 0 0
0 0.044 0.044 11.74 11.74 -0.05 -0.68 -0.68 -0.68 -2.08 0.124 0.124 0.51 -0.13 -0.13 -0.09 1.962 4.625 0.957 1.537 1.11 -0.96 -0.96 0 0 0 0 0 0 0 0 0 0 0 0 0
0 0.044 0.044 17.93 17.93 -0.05 0.098 0.098 0.098 1.552 0.771 0.081 -0.22 -0.16 -0.16 -0.09 -0.05 12.94 7.798 4.625 1.085 1.085 1.11 -0.96 -0.96 0 0 0 0 0 0 0 0 0 0 0 0 0
0 14.02 14.02 17.93 17.93 14.57 -4.71 -4.71 -4.71 11.32 0.771 0.081 0.771 -0.16 -0.16 0.774 12.94 12.3 7.798 4.625 1.085 1.085 -0.24 1.065 1.065 0 0 0 0 0 0 0 0 0 0 0 0 0
0 0 23.43 10.79 14.57 14.57 -4.71 -4.71 -4.71 -1.38 0.797 0.797 -0.08 -0.08 -0.1 -0.1 0 0 0.802 -0.08 2.281 2.281 2.524 2.524 2.524 3.755 -0.15 -0.15 0 0 0 -0.01 -0.01 0 0 0 0 0 0
0 0 0 18.48 20.03 20.03 -1.28 -1.28 -1.28 -0.15 -0.04 0 0.07 0.876 0 0 0.802 -0.06 -0.01 2.281 1.232 1.232 3.755 0 -0.15 -0.15 0 0 0 -0.01 -0.01 0 0 0 0 0 0
0 0 0 18.48 20.03 20.03 -3.41 -3.41 -3.41 -1.78 -0.04 -0.04 -0.08 0.181 0.181 0 -0.12 0 -0.06 -0.01 0.073 2.813 1.232 0 0 -0 -0 0 0 0 -0.05 -0.01 0 0 0 0 0 0
0 0 0 13.42 6.386 6.386 -2.68 -2.68 0.462 -0.21 0.466 0.466 -2.15 -0.08 0.181 9.994 9.994 0.734 0.734 0.003 -0.02 -0.02 0 0 0 0 0 0 0 0 0 -0.01 -0.01 0 0 0 0 0 0
0 0 0 13.42 6.386 6.386 -2.68 -2.68 0.462 0.466 0.466 -2.15 -0.08 3.108 0 4.822 0.734 0.734 0.003 0 0 0 0 0 0 0 0 0 0 0 -0.01 -0.01 0 0 0 0 0 0
0 0 0 7.298 7.298 6.386 2.06 10.65 -2.23 0.466 -4.03 -0.08 0.005 5.324 5.324 0 0.293 0.006 0 0 0 -1.49 0 0 1.687 1.687 9.409 9.409 0 0 -0.01 0 0 0 0 0 0
0 0 0 7.298 7.298 4.141 2.06 10.65 -2.23 -2.23 -4.03 -1.45 -1.45 0.044 -2.96 -2.96 -2.36 -2.36 0 -0.01 -0.01 -1.41 -1.49 0 0 1.687 -1.44 9.409 9.409 9.409 7.435 7.435 0 0 0 0 0 0
0 0 0 7.298 -0 4.141 4.141 4.701 4.701 -2.23 -2.23 -1.45 0.044 0.044 -2.96 -4.84 -4.64 -4.64 0 0 0 -1.41 -1.41 0 0 -1.44 -1.44 11.83 11.83 11.83 11.61 7.435 0 0 0 0 0 0
0 0 0 -0 -0 4.141 4.141 4.141 4.701 4.701 -1.51 -1.45 -1.45 -0.13 -0.13 -4.84 -4.84 -4.64 -2.88 0.85 -0.02 -0.02 -2.64 0 -2.69 -2.69 -2.16 -1.44 11.83 11.83 11.83 11.61 12.95 0 0 0 0 0 0
0 0 0 -0 0 4.141 4.141 7.291 7.291 4.701 -1.51 -0.76 -1.54 -2.58 -0.13 -2.7 -2.7 -2.88 -2.88 0.85 -0 -0 -2.56 -2.56 0 3.551 -3.52 -2.51 12.31 12.31 12.31 11.61 12.95 0 0 0 0 0 0
0 0 0 0 0 4.141 7.291 7.291 7.291 12.64 12.64 12.64 19.74 19.74 18.62 0.214 -6.61 88.2 -4.58 -2.95 0 0 -2.58 -2.58 0 7.682 -3.25 -2.72 12.51 12.24 12.24 7.264 7.264 0 0 0 0 0 0
0 0 0 -0 -0 1.889 1.889 1.889 7.814 7.814 12.64 29.33 29.58 15.96 15.96 -0.8 -2.46 -2.95 -2.54 -2.54 0 0 -1.17 -2.48 -2.48 -2.31 -3.25 -2.72 12.51 12.24 12.24 7.264 -0 0 0 0 0 0 0
0 0 0 0 0 1.889 1.889 7.814 7.814 7.814 12.64 7.484 12.78 6.296 6.296 -0.8 -0.8 -0.8 -2.54 -2.54 0 0 -1.17 -1.65 -1.9 -1.9 -1.64 -1.64 12.51 12.24 12.24 -0 -0 0 0 0 0 0 0
0 0 0 0.01 0.01 1.889 1.889 6.418 6.418 0 7.484 12.78 6.296 6.296 -0.8 -0.8 -0.8 21.28 4.908 4.908 0 0 10.15 10.15 6.103 6.103 4.347 4.347 0 0 0 -0 -0 0 0 0 0 0 0
0 0 0 0.01 0.01 1.889 6.418 6.418 6.418 7.278 7.278 0 0 0 8.995 8.995 21.28 21.28 15.84 4.908 0 0 10.15 10.15 6.103 6.103 4.347 4.347 0 0 0 -0 -0 0 0 0 0 0 0
0 0 0 0.007 0.007 0.007 2.22 17.34 17.34 10.4 10.4 10.4 10.4 0 8.995 8.995 13.23 13.23 -1.44 7.422 0 0 34 34 12.72 12.72 5.925 5.925 4E-04 4E-04 4E-04 -0 -0 0 0 0 0 0 0
0 0 0 0.007 0.007 0.007 2.22 12.69 12.69 10.94 10.94 1E-04 0 0 8.995 8.995 26.21 8.83 7.422 7.422 0 29.25 17.85 17.85 1.257 1.257 1.278 1.278 4E-04 4E-04 4E-04 0 0 0 0 0 0 0 0
0 0 0 0.007 0.007 0.007 0 7E-05 7E-05 0.025 0.025 1E-04 0 4E-04 0 0 -0.02 8.83 2.662 0 0 12.54 5.753 5.753 5E-04 5E-04 -0 -0 0.001 0.001 0.001 6E-04 6E-04 0 0 0 0 0 0
0 0 0 0 0 0 0 6E-05 6E-05 0.025 1E-04 1E-04 0 4E-04 7E-04 7E-04 0.002 -0 2.662 0 0 12.54 5E-04 5E-04 0 0 0 0 0 0 0 4E-04 4E-04 0 0 0 0 0 0
0 0 0 0 0 0 0 0 0 0 0 0 0 0 0 0 0 0 0 0 0 0 0 0 0 0 0 0 0 0 0 0 0 0 0 0 0 0 0 0 0 0 0 0 0 0 0 0 0 0 0 0 0 0 0 0 0 0 0 0 0 0 0 0 0 0 0 0 0 0 0 0 0 0 0 0 0 0 0
0 0 0 0 0 0 0 0 0 0 0 0 0 0 0 0 0 0 0 0 0 0 0 0 0 0 -0 -0.01 -0.01 -0 -0 -0.02 -0.02 0 0 -0.02 -0.02 -0.02 0 0
0 0 0 0 0 0 0 0 0 0 0 0 0 0 0 0 0 0 0 0 0 0 0 0 0 0 -0 -0.02 -0.02 -0.01 -0.01 -0.02 -0.02 0.001 0.001 -0.03 -0.03 -0.03 0 0
0 0 0 0 0 0 0 0 0 0 0 0 0 0 0 0 0 0 0 0 0 0 0 0 0 0 0 -0 -0 -0.03 -0.03 -0.02 -0.02 -0 -0 -0 -0 -0.01 0 0
0 0 0 0 0 0 0 0 0 0 0 0 0 0 0 0 0 0 0 0 0 0 0 0 0 0 0 -0.02 -0.02 -0.01 -0.01 -0.01 -0.01 -0.02 -0.02 -0 -0.01 -0.01 0 0
0 0 0 0 0 0 0 0 0 0 0 0 0 0 0 0 0 0 0 0 0 0 0 0 0 0 0 0.007 0.007 -0 -0 0.003 0.003 0.002 0.002 -0.01 -0.01 -0.01 0 0
0 0 0 0 0 0 0 0 0 0 0 0 0 0 0 0 0 0 0 0 0 0 0 0 0 0 0 0.007 0.007 0.001 0.001 -0.01 -0.01 1.398 -0.01 -0 -0 -0 0 0
0 0 0 0 0 0 0 0 0 0 0 0 0 0 0 0 0 0 0 0 0 0 0 0 0 0 -0 -0.02 -0.02 -0.02 -0.02 0.003 0.003 -0.01 -0.01 -0 -0 -0 0
0 0 0 0 0 0 0 0 0 0 0 0 0 0 0 0 0 0 0 0 0 0 0 0 0 0 -0 -0 -0 -0.05 -0.05 0.003 -0.03 -0.01 -0.01 -0.06 -0.06 -0.01 -0.01
0 0 0 0 0 0 0 0 0 0 0 0 0 0 0 0 0 0 0 0 0 0 0 0 0 0 -0 -0 -0 -0.05 -0.05 -0.03 -0.03 -0.01 -0.01 -0.06 -0.06 -0.01 -0.01
0 0 0 0 0 0 0 0 0 0 0 0 0 0 0 0 0 0 0 0 0 0 0 0 0 0 -0.02 -0.02 -0.01 -0.01 0 -0.01 -0.01 -0.04 -0.01 -0.01 -0.01 -0.01 0
0 0 0 0 0 0 0 0 0 0 0 0 0 0 0 0 0 0 0 0 0 0 0 0 0 0 -0.02 -0.02 -0.01 0 0 -0.01 -0.01 -0.04 -0.01 -0.01 -0.01 -0.01 0
0 0 0 0 0 0 0 0 0 0 0 0 0 0 -0 -0 0.187 0.187 24.43 15.07 15.07 1.785 21.18 23.36 26.32 8.987 -0.02 -0.01 -0.01 0 0 -0.01 0.005 -0.04 -0.01 -0.01 -0.01 -0.01 0
0 0 0 0 0 0 0 0 0 0 0 0 0 0 -0 -0 0.187 20.49 24.43 15.07 15.07 1.785 21.18 23.36 26.32 8.987 8.987 8.987 -0.01 0 0 0.005 0.005 -0.03 -0.01 -0.01 -0.01 -0.01 0
0 0 0 0 0 0 0 0 0 0 0 0 0 0 -0 25.01 26.92 20.49 24.43 15.07 15.07 1.785 21.18 23.36 26.32 8.987 8.987 23.95 23.95 0 3.376 -0.02 -0.03 -0.03 -0.01 0 0
0 0 0 0 0 0 0 0 0 0 0 0 0 0 25.01 25.01 26.92 20.49 -3.38 -3.38 -3.38 1.785 21.18 29.15 33.66 8.987 8.987 23.95 23.95 -0.03 0 -0.02 1.586 -0.01 -0.01 0 0 0 0
0 0 0 0 0 0 0 0 0 0 0 0 -0 -0 31.79 12.05 -2.31 -2.31 -3.71 -3.71 -3.71 18.87 3.159 11.64 11.91 13.99 20.52 32.21 32.21 -0.03 -0.03 -0 -0 -0.01 -0.01 0 0 0 0
0 0 0 0 0 0 0 0 0 0 0 -0 -0 -0 31.79 12.05 -2.31 -2.31 -1.15 -1.15 -1.15 18.87 3.159 11.64 11.91 13.99 20.52 32.21 32.21 -0.03 0 -0 -0 -0.01 -0.01 -0.01 0 0
0 0 0 0 0 0 0 0 0 -0 -0 -0 -0 53.06 4.911 9.141 -3.74 51.89 51.89 51.89 1.448 1.448 1.396 1.396 -0.11 3.941 17.53 0 -0.12 5.351 5.351 -0 -0.01 -0.01 -0.01 -0.01 0 0
0 0 0 0 0 0 0 -0 -0 -0.01 -0 -0 25.36 25.36 9.141 -3.53 40.76 40.76 40.76 1.448 1.448 1.396 1.396 -0.11 5.189 17.53 0 -0.12 5.351 5.351 -0.01 -0.01 0 0
0 0 0 0 0 -0 -0 -0 -0.01 -0.01 -0 25.36 0 0 -3.53 40.76 40.76 40.76 -0.39 -0.39 -0.42 0 5.189 5.189 6.344 -0.26 -0.21 -0.21 -0.01 -0.01 0 0 0 0
6.189 6.189 7.062 7.062 -0 -0 -0 -0 -0 0 -0.26 -0.26 -0.8 -0.8 -0.05 -0.05 -0.05 0 -0.08 -0.08 -0.08 3.88 3.88 6.344 -0.68 -0.68 -0.99 -0.01 -0.01 0 0 0 0 0 0
0 -0 0 6.189 6.189 6.189 7.062 -0 -0 -0 -0 -0 -0 0 4.204 4.204 0.771 -0.15 -0.15 -0.1 -0.1 -0.08 -0.08 -0.08 -0.08 3.88 0 -0.17 -0.68 -0.68 -0.99 -0.01 -0.01 0 0 0 0 0 0
0 -0 0 6.873 6.873 6.873 -0.06 -0.06 -0.06 0 0 -0 -0 0 0 4.204 0.771 -0.15 -0.15 -0.1 -0.1 0.906 0.906 0.461 0.461 -0.04 -0.04 -0.26 -0.26 -0.65 5.318 -0.01 -0.01 0 0 0 0 0 0
0 0.012 0.012 6.873 6.873 6.873 -0.06 -0.06 -0.06 0 0 0 0 -0.07 -0.07 -0.16 -0.16 -0.16 -0.05 -0.05 7.238 -0.08 -0.05 -0.05 -0.11 -0.11 -0.36 0.302 0.302 -0.65 5.318 -0.01 -0.01 0 0 0 0 0 0
0 0 -0 -0.01 -0.01 -0.01 -0.06 -0.06 -0.06 0.208 0 0 0 0 1.14 1.14 1.726 1.595 0 0 7.238 -1.95 3.25 -1.41 0.141 0.141 -0.36 -0.28 -0.28 0 0.816 -0.01 -0.01 0 0 0 0 0 0
0 0 -0 -0.01 -0.01 -0.01 0 -0 0 0.208 0 0 0 0 -4.09 -4.09 -0.04 -0.04 0 0 2.018 2.378 3.25 0.015 0.055 0.347 0.277 0.196 0.196 0.816 0 0 0 0 0 0 0 0 0
0 0 -0 -0.01 -0 -0 -0 -0 0 0.208 0 0 -1.58 0 -4.09 0 -0.04 -0.04 -0.1 0 2.018 2.378 6.7 0.891 0.055 0.347 0.196 0.816 0 0 0 0 0 0 0 0 0
0 -0.09 -0.11 -0 -0 -0 -0 -0 -0.02 0 0 1.599 1.041 0.282 1.856 3.621 3.621 6.023 6.023 11.94 23.2 6.597 6.597 -0.1 -0.1 0.816 0 0 0 0 0 0 0 0 0
0 -0.09 -0.11 -0.03 -0.03 -0.03 -0.03 -0.03 -0.02 0 1.556 1.556 4.672 0.709 0.494 0.494 3.621 6.023 6.023 11.94 11.94 9.705 9.705 1.214 1.214 -0.1 -0.1 -0.1 0 0 0 0 0 0 0 0 0 0
0 -0.09 -0.09 -0.03 -0.03 -0.03 0 0 0 0 1.556 1.556 4.672 0.709 0.494 0.494 12.83 12.83 18.29 133.3 295.9 16.37 9.96 1.214 0.041 -0.1 -0.06 -0.06 0 0 0 0 0 0 0 0 0 0 0
0 -0.03 -0.03 -0.04 -0.04 -0.04 0 0 0 0 0.124 0.124 0.51 -0.13 -0.13 12.83 18.9 26.36 125 1.007 1.012 0.538 0.538 0 0 0 0 0 0 0 0 0 0 0 0 0
0 0.044 0.044 12.6 12.6 -0.04 -0.58 -0.58 -0.58 -1.31 0.124 0.124 0.51 -0.13 -0.13 -0.09 4.263 6.727 1.007 1.724 1.012 0.538 0.538 0 0 0 0 0 0 0 0 0 0 0 0 0
0 0.044 0.044 37.41 37.41 -0.04 0.098 0.098 0.098 1.552 1.094 0.798 -0.22 -0.16 -0.16 -0.09 -0.05 14.37 9.975 6.727 3.503 3.503 1.012 0.538 0.538 0 0 0 0 0 0 0 0 0 0 0 0 0
0 13.87 13.87 37.41 37.41 14.26 -2.58 -2.58 -2.58 11.63 1.094 0.798 0.734 -0.16 -0.16 1.322 14.37 15.7 9.975 6.727 3.503 3.503 3.098 1.077 1.077 0 0 0 0 0 0 0 0 0 0 0 0 0
0 0 24.53 11.09 14.26 14.26 -2.58 -2.58 -2.58 -1.26 0.802 0.802 0.999 0.999 -0.1 -0.1 0 3.769 1.767 -0.04 3.785 3.785 3.661 3.661 3.661 3.751 -0.1 -0.1 0 0 0 -0.01 -0.01 0 0 0 0 0 0
0 0 0 20.2 20.47 20.47 -1.17 -1.17 -1.17 -0.06 -0.04 0 0.07 0.876 0 3.769 1.767 -0.03 -0.01 3.785 2.238 2.238 3.751 0 -0.1 -0.1 0 0 0 -0.01 -0.01 0 0 0 0 0 0
0 0 0 20.2 20.47 20.47 -0.71 -0.71 -0.71 0.002 -0.04 -0.04 -0.08 1.638 1.638 0 2.957 0 -0.03 -0.01 0.222 4.48 2.238 0 0 -0 -0 0 0 0 -0.05 -0.01 0 0 0 0 0 0
0 0 0 20.5 19.48 19.48 -1 -1 0.462 -0.21 0.494 0.494 -1.38 -0.08 1.638 19.49 19.49 0.985 0.985 0.009 -0.02 -0.02 0 0 0 0 0 0 0 0 0 -0.01 -0.01 0 0 0 0 0 0
0 0 0 20.5 19.48 19.48 -1 -1 0.462 0.494 0.494 -1.38 -0.08 3.507 0 6.064 0.985 0.985 0.009 0 0 0 0 0 0 0 0 0 0 0 -0.01 -0.01 0 0 0 0 0 0
0 0 0 11.96 11.96 19.48 2.775 23.14 -1.75 0.494 -2.7 -0.08 1.793 8.741 8.741 0 1.568 0.018 0 0 0 -1.4 0 0 3.16 3.16 11.94 11.94 0 0 -0.01 0 0 0 0 0 0
0 0 0 11.96 11.96 6.689 2.775 23.14 -1.75 -1.75 -2.7 -1.13 -1.13 0.044 -2.35 -2.35 -2.17 -2.17 0 -0.01 -0.01 -1.33 -1.4 0 0 3.16 0.148 11.94 11.94 11.94 12.2 12.2 0 0 0 0 0 0
0 0 0 11.96 -0 6.689 6.689 9.843 9.843 -1.75 -1.75 -1.13 0.044 0.044 -2.35 -3.14 -3.9 -3.9 0 0 0 -1.33 -1.33 0 0 0.148 0.148 14.8 14.8 14.8 17.42 12.2 0 0 0 0 0 0
0 0 0 -0 -0 6.689 6.689 6.689 9.843 9.843 -1.19 -1.13 -1.13 0.293 0.293 -3.14 -3.14 -3.9 -2.42 0.85 -0.01 -0.01 -1.82 0 -1.91 -1.91 -1.3 0.148 14.8 14.8 14.8 17.42 12.8 0 0 0 0 0 0
0 0 0 -0 0 6.689 6.689 11.95 11.95 9.843 -1.19 -0.68 -1.44 -2.52 0.293 -2.03 -2.03 -2.42 -2.42 0.85 -0 -0 -1.67 -1.67 0 7.72 -2.68 -1.6 21.64 21.64 21.64 17.42 12.8 0 0 0 0 0 0
0 0 0 0 0 6.689 11.95 11.95 11.95 12.92 12.92 12.92 23.86 23.86 29.45 0.214 -3.12 99.36 -3.29 -2.54 0 0 -1.8 -1.8 0 9.707 -2.22 -1.78 19.31 12.76 12.76 7.81 7.81 0 0 0 0 0 0
0 0 0 -0 -0 5.653 5.653 5.653 13.16 13.16 12.92 29.58 34.71 15.98 15.98 -0.08 -1.63 -2.54 -2.24 -2.24 0 0 -1.1 -1.74 -1.74 -1.56 -2.22 -1.78 19.31 12.76 12.76 7.81 -0 0 0 0 0 0 0
0 0 0 0 0 5.653 5.653 13.16 13.16 13.16 12.92 21.86 26.75 11.09 11.09 -0.08 -0.08 -0.08 -2.24 -2.24 0 0 -1.1 -1.11 -1.3 -1.3 -1.03 -1.03 19.31 12.76 12.76 -0 -0 0 0 0 0 0 0
0 0 0 0.01 0.01 5.653 5.653 10.25 10.25 0 21.86 26.75 11.09 11.09 -0.08 -0.08 -0.08 28.08 5.769 5.769 0 0 21.14 21.14 9.67 9.67 12.74 12.74 0 0 0 -0 -0 0 0 0 0 0 0
0 0 0 0.01 0.01 5.653 10.25 10.25 10.25 16.94 16.94 0 0 5.952 11.1 11.1 28.08 28.08 16.71 5.769 0 0 21.14 21.14 9.67 9.67 12.74 12.74 0 0 0 -0 -0 0 0 0 0 0 0
0 0 0 0.007 0.007 0.007 8.571 17.22 17.22 11.19 11.19 11.19 11.19 5.952 11.1 11.1 37.91 37.91 0.154 7.822 0 0 42.83 42.83 13.68 13.68 6.142 6.142 4E-04 4E-04 4E-04 -0 -0 0 0 0 0 0 0
0 0 0 0.007 0.007 0.007 8.571 12.65 12.65 14.9 14.9 1E-04 0 5.952 11.1 11.1 37.01 24.04 7.822 7.822 0 32.43 26.75 26.75 5.68 5.68 5.774 5.774 4E-04 4E-04 4E-04 0 0 0 0 0 0 0 0
0 0 0 0.007 0.007 0.007 0 7E-05 7E-05 0.025 0.025 1E-04 0 4E-04 0 0 -0.02 24.04 8.046 0 0 13.49 5.942 5.942 5E-04 5E-04 -0 -0 0.001 0.001 0.001 6E-04 6E-04 0 0 0 0 0 0
0 0 0 0 0 0 0 6E-05 6E-05 0.025 1E-04 1E-04 0 4E-04 7E-04 7E-04 0.002 -0 8.046 0 0 13.49 5E-04 5E-04 0 0 0 0 0 0 0 4E-04 4E-04 0 0 0 0 0 0
0 0 0 0 0 0 0 0 0 0 0 0 0 0 0 0 0 0 0 0 0 0 0 0 0 0 0 0 0 0 0 0 0 0 0 0 0 0 0
Base Case
High Scenario
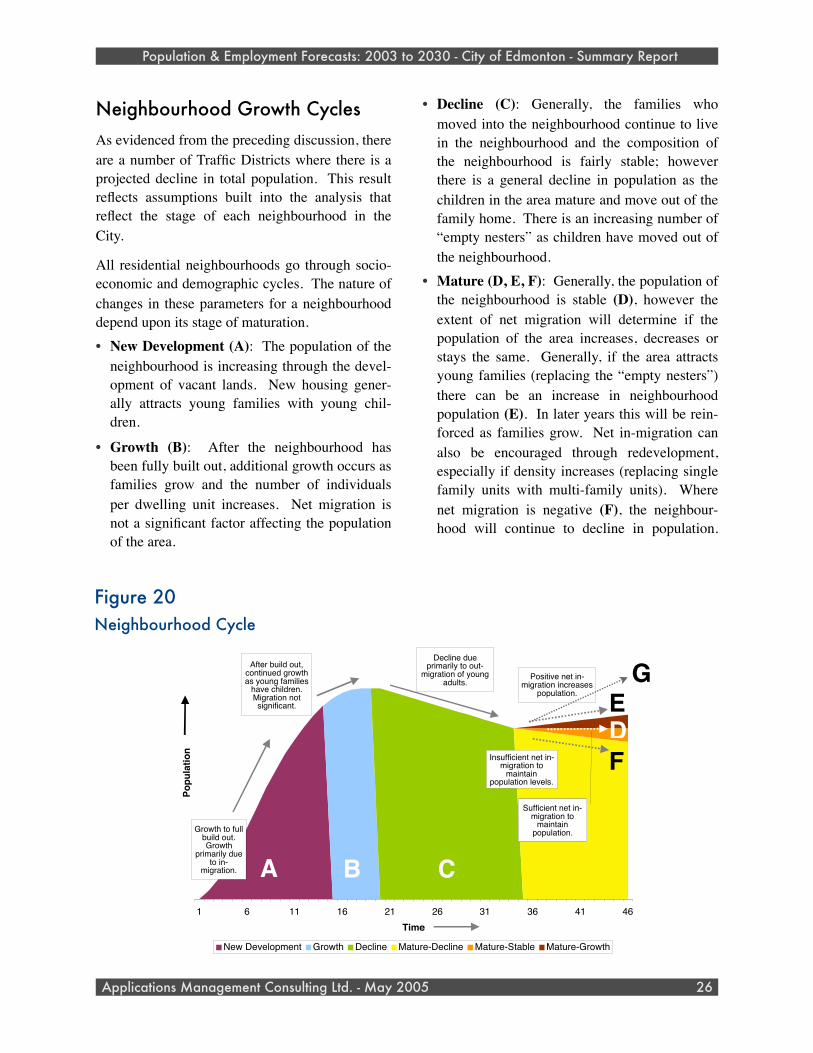
Neighbourhood Growth CyclesAs evidenced from the preceding discussion, there are a number of Traffic Districts where there is a projected decline in total population. This result reflects assumptions built into the analysis that reflect the stage of each neighbourhood in the City.
All residential neighbourhoods go through socio-economic and demographic cycles. The nature of changes in these parameters for a neighbourhood depend upon its stage of maturation. • New Development (A): The population of the
neighbourhood is increasing through the devel-opment of vacant lands. New housing gener-ally attracts young families with young chil-dren.
• Growth (B): After the neighbourhood has been fully built out, additional growth occurs as families grow and the number of individuals per dwelling unit increases. Net migration is not a significant factor affecting the population of the area.
• Decline (C): Generally, the families who moved into the neighbourhood continue to live in the neighbourhood and the composition of the neighbourhood is fairly stable; however there is a general decline in population as the children in the area mature and move out of the family home. There is an increasing number of “empty nesters” as children have moved out of the neighbourhood.
• Mature (D, E, F): Generally, the population of the neighbourhood is stable (D), however the extent of net migration will determine if the population of the area increases, decreases or stays the same. Generally, if the area attracts young families (replacing the “empty nesters”) there can be an increase in neighbourhood population (E). In later years this will be rein-forced as families grow. Net in-migration can also be encouraged through redevelopment, especially if density increases (replacing single family units with multi-family units). Where net migration is negative (F), the neighbour-hood will continue to decline in population.
Population & Employment Forecasts: 2003 to 2030 - City of Edmonton - Summary Report
Applications Management Consulting Ltd. - May 2005 26
1 6 11 16 21 26 31 36 41 46Time
Population
New Development Growth Decline Mature-Decline Mature-Stable Mature-Growth
A B
E
C
FD
Growth to full build out. Growth
primarily due to in-
migration.
After build out, continued growth as young families
have children. Migration not significant.
Decline due primarily to out-
migration of young adults.
Insufficient net in-migration to
maintain population levels.
Positive net in-migration increases
population.
Sufficient net in-migration to
maintain population.
Figure 20Neighbourhood Cycle
G
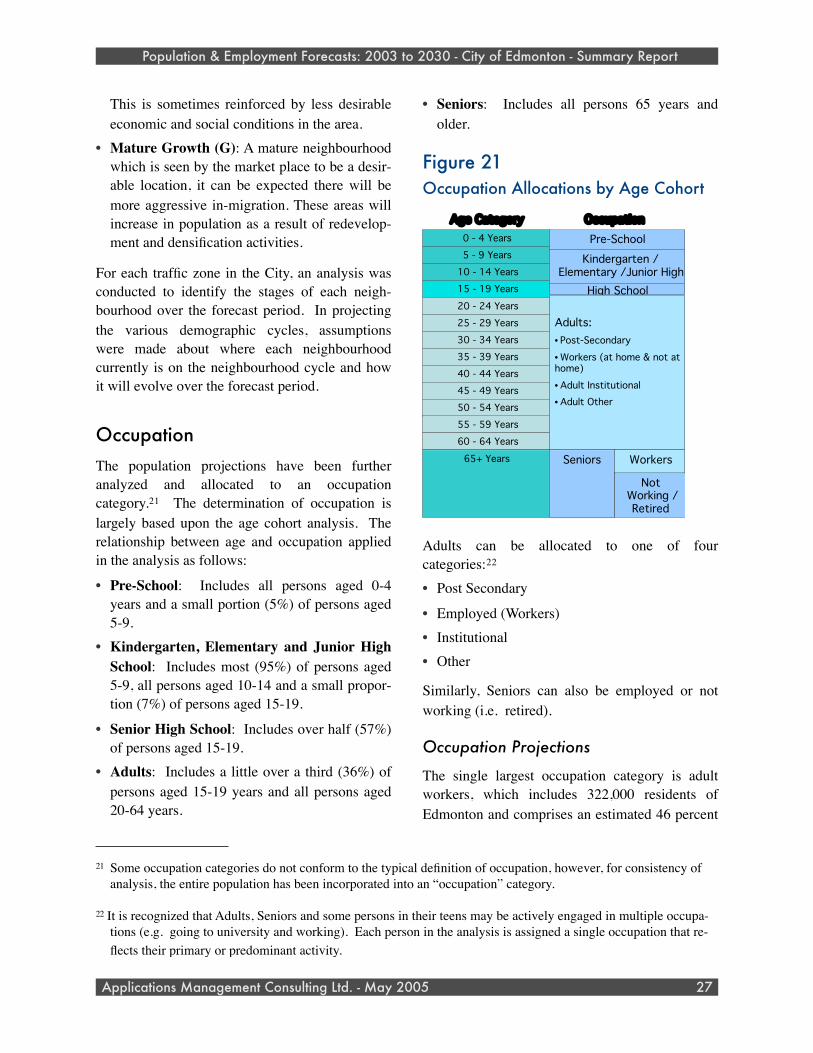
This is sometimes reinforced by less desirable economic and social conditions in the area.
• Mature Growth (G): A mature neighbourhood which is seen by the market place to be a desir-able location, it can be expected there will be more aggressive in-migration. These areas will increase in population as a result of redevelop-ment and densification activities.
For each traffic zone in the City, an analysis was conducted to identify the stages of each neigh-bourhood over the forecast period. In projecting the various demographic cycles, assumptions were made about where each neighbourhood currently is on the neighbourhood cycle and how it will evolve over the forecast period.
OccupationThe population projections have been further analyzed and allocated to an occupation category.21 The determination of occupation is largely based upon the age cohort analysis. The relationship between age and occupation applied in the analysis as follows:
• Pre-School: Includes all persons aged 0-4 years and a small portion (5%) of persons aged 5-9.
• Kindergarten, Elementary and Junior High School: Includes most (95%) of persons aged 5-9, all persons aged 10-14 and a small propor-tion (7%) of persons aged 15-19.
• Senior High School: Includes over half (57%) of persons aged 15-19.
• Adults: Includes a little over a third (36%) of persons aged 15-19 years and all persons aged 20-64 years.
• Seniors: Includes all persons 65 years and older.
Figure 21Occupation Allocations by Age Cohort
0 - 4 Years
5 - 9 Years
10 - 14 Years
15 - 19 Years
20 - 24 Years
25 - 29 Years
30 - 34 Years
35 - 39 Years
40 - 44 Years
45 - 49 Years
50 - 54 Years
55 - 59 Years
60 - 64 Years
65+ Years
Pre-School
Kindergarten /Elementary /Junior High
High School
Adults:• Post-Secondary
• Workers (at home & not athome)
• Adult Institutional• Adult Other
Seniors Workers
NotWorking /Retired
OccupationAge Category
Adults can be allocated to one of four categories:22
• Post Secondary
• Employed (Workers)• Institutional• Other
Similarly, Seniors can also be employed or not working (i.e. retired).
Occupation Projections
The single largest occupation category is adult workers, which includes 322,000 residents of Edmonton and comprises an estimated 46 percent
Population & Employment Forecasts: 2003 to 2030 - City of Edmonton - Summary Report
Applications Management Consulting Ltd. - May 2005 27
21 Some occupation categories do not conform to the typical definition of occupation, however, for consistency of analysis, the entire population has been incorporated into an “occupation” category.
22 It is recognized that Adults, Seniors and some persons in their teens may be actively engaged in multiple occupa-tions (e.g. going to university and working). Each person in the analysis is assigned a single occupation that re-flects their primary or predominant activity.
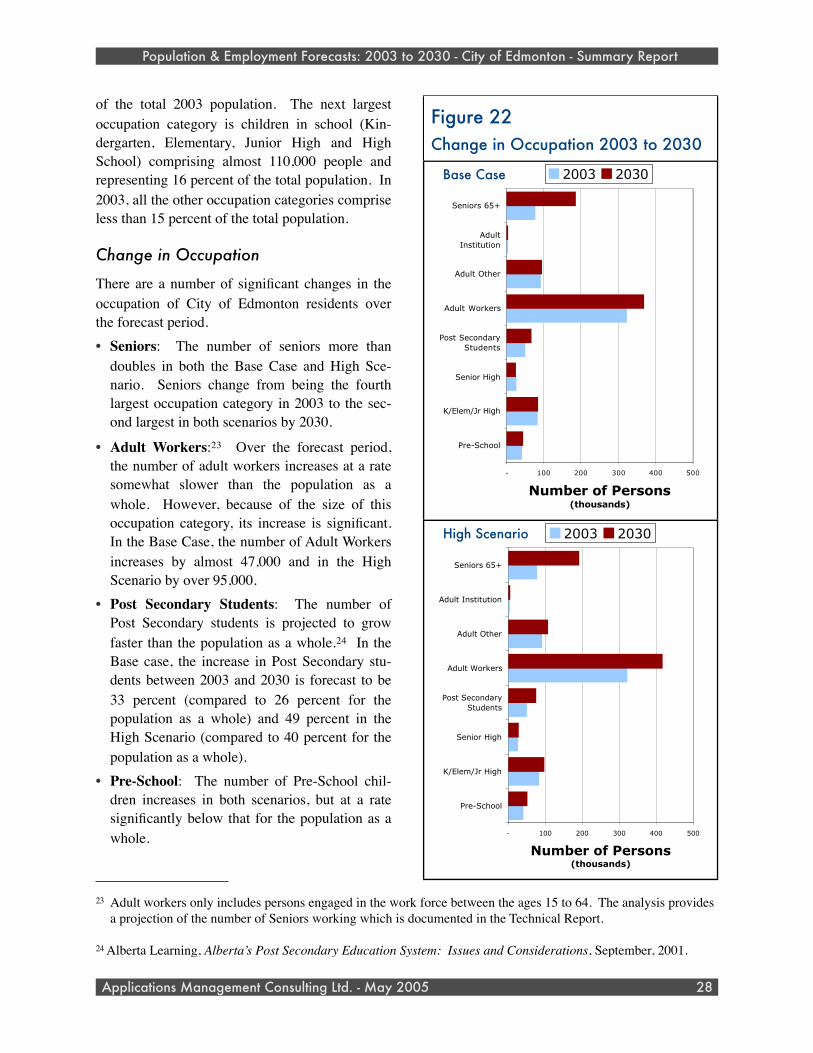
of the total 2003 population. The next largest occupation category is children in school (Kin-dergarten, Elementary, Junior High and High School) comprising almost 110,000 people and representing 16 percent of the total population. In 2003, all the other occupation categories comprise less than 15 percent of the total population.
Change in Occupation
There are a number of significant changes in the occupation of City of Edmonton residents over the forecast period.• Seniors: The number of seniors more than
doubles in both the Base Case and High Sce-nario. Seniors change from being the fourth largest occupation category in 2003 to the sec-ond largest in both scenarios by 2030.
• Adult Workers:23 Over the forecast period, the number of adult workers increases at a rate somewhat slower than the population as a whole. However, because of the size of this occupation category, its increase is significant. In the Base Case, the number of Adult Workers increases by almost 47,000 and in the High Scenario by over 95,000.
• Post Secondary Students: The number of Post Secondary students is projected to grow faster than the population as a whole.24 In the Base case, the increase in Post Secondary stu-dents between 2003 and 2030 is forecast to be 33 percent (compared to 26 percent for the population as a whole) and 49 percent in the High Scenario (compared to 40 percent for the population as a whole).
• Pre-School: The number of Pre-School chil-dren increases in both scenarios, but at a rate significantly below that for the population as a whole.
Population & Employment Forecasts: 2003 to 2030 - City of Edmonton - Summary Report
Applications Management Consulting Ltd. - May 2005 28
23 Adult workers only includes persons engaged in the work force between the ages 15 to 64. The analysis provides a projection of the number of Seniors working which is documented in the Technical Report.
24 Alberta Learning, Alberta’s Post Secondary Education System: Issues and Considerations, September, 2001.
Figure 22Change in Occupation 2003 to 2030
- 100 200 300 400 500
Pre-School
K/Elem/Jr High
Senior High
Post SecondaryStudents
Adult Workers
Adult Other
AdultInstitution
Seniors 65+
Number of Persons(thousands)
2003 2030
- 100 200 300 400 500
Pre-School
K/Elem/Jr High
Senior High
Post SecondaryStudents
Adult Workers
Adult Other
Adult Institution
Seniors 65+
Number of Persons(thousands)
2003 2030High Scenario
Base Case
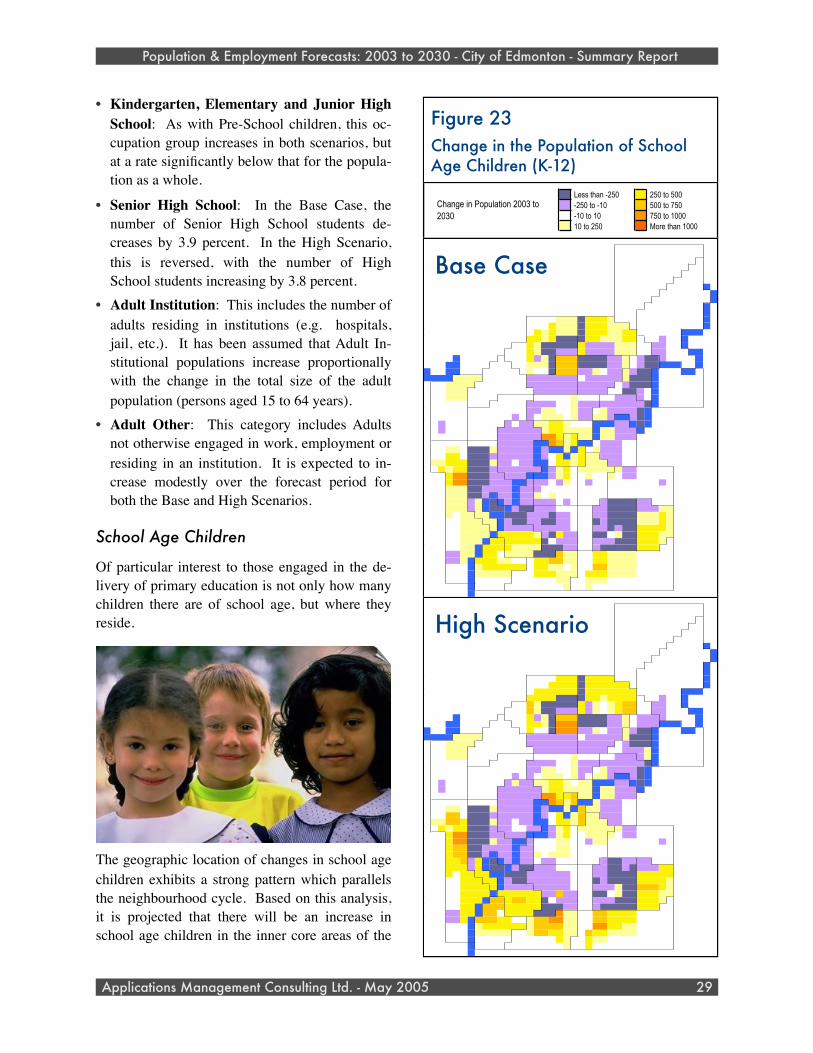
• Kindergarten, Elementary and Junior High School: As with Pre-School children, this oc-cupation group increases in both scenarios, but at a rate significantly below that for the popula-tion as a whole.
• Senior High School: In the Base Case, the number of Senior High School students de-creases by 3.9 percent. In the High Scenario, this is reversed, with the number of High School students increasing by 3.8 percent.
• Adult Institution: This includes the number of adults residing in institutions (e.g. hospitals, jail, etc.). It has been assumed that Adult In-stitutional populations increase proportionally with the change in the total size of the adult population (persons aged 15 to 64 years).
• Adult Other: This category includes Adults not otherwise engaged in work, employment or residing in an institution. It is expected to in-crease modestly over the forecast period for both the Base and High Scenarios.
School Age Children
Of particular interest to those engaged in the de-livery of primary education is not only how many children there are of school age, but where they reside.
The geographic location of changes in school age children exhibits a strong pattern which parallels the neighbourhood cycle. Based on this analysis, it is projected that there will be an increase in school age children in the inner core areas of the
Population & Employment Forecasts: 2003 to 2030 - City of Edmonton - Summary Report
Applications Management Consulting Ltd. - May 2005 29
Figure 23Change in the Population of School Age Children (K-12)
Less than -250 250 to 500 -250 to -10 500 to 750 -10 to 10 750 to 1000 10 to 250 More than 1000
Change in Population 2003 to 2030
0 0 0 0 0 0 0 0 0 0 0 0 0 0 0 0 0 0 0 0 0 0 0 0 0 0 0 0 0 0 0 0 0 0 0 0 0 0 0 0
0 0 0 0 0 0 0 0 0 0 0 0 0 0 0 0 0 0 0 0 0 0 0 0 0 0 0.328 0 0 -0.52 -0.52 -0.89 -0.89 0 0 -0.63 -0.63 -0.63 0 0
0 0 0 0 0 0 0 0 0 0 0 0 0 0 0 0 0 0 0 0 0 0 0 0 0 0 0.328 -0.3 -0.3 -0.63 -0.63 0.261 0.261 -0.48 -0.48 -1.24 -1.24 -1.24 0 0
0 0 0 0 0 0 0 0 0 0 0 0 0 0 0 0 0 0 0 0 0 0 0 0 0 0 0 -0.42 -0.42 -1.24 -1.24 -0.89 -0.89 -0.42 -0.42 -0.11 -0.11 0 0 0
0 0 0 0 0 0 0 0 0 0 0 0 0 0 0 0 0 0 0 0 0 0 0 0 0 0 0 -0.3 -0.3 -0.8 -0.8 0.191 0.191 -0.3 -0.3 -0.11 0 0 0 0
0 0 0 0 0 0 0 0 0 0 0 0 0 0 0 0 0 0 0 0 0 0 0 0 0 0 0 -1.13 -1.13 -0.52 -0.52 0.328 0.328 -0.4 -0.4 0 0 0 0 0
0 0 0 0 0 0 0 0 0 0 0 0 0 0 0 0 0 0 0 0 0 0 0 0 0 0 0 -0.54 -0.54 -0.48 -0.48 0.004 0.004 0 7E-04 -0.52 -0.52 -0.52 0 0
0 0 0 0 0 0 0 0 0 0 0 0 0 0 0 0 0 0 0 0 0 0 0 0 0 0 0.12 -0.89 -0.89 -0.63 -0.63 -0.61 -0.61 7E-04 2.648 -0.52 -0.52 -0.52 0
0 0 0 0 0 0 0 0 0 0 0 0 0 0 0 0 0 0 0 0 0 0 0 0 0 0 0.12 -0.05 -0.05 -1.54 -1.54 -0.61 0.022 7E-04 2.648 -0.7 -0.7 -2.51 -2.51
0 0 0 0 0 0 0 0 0 0 0 0 0 0 0 0 0 0 0 0 0 0 0 0 0 0 0.12 -0.05 -0.05 -1.54 -1.54 0.022 0.022 2.648 2.648 -0.7 -0.7 -2.51 -2.51
0 0 0 0 0 0 0 0 0 0 0 0 0 0 0 0 0 0 0 0 0 0 0 0 0 0 -0.63 -0.63 -0.89 -0.89 0 0.163 0.163 0.023 2.092 2.092 -4.18 -4.58 0
0 0 0 0 0 0 0 0 0 0 0 0 0 0 0 0 0 0 0 0 0 0 0 0 0 0 -0.63 -0.63 -0.89 0 0 0.163 0.163 0.023 2.092 -4.18 -4.18 -4.58 0
0 0 0 0 0 0 0 0 0 0 0 0 0 0 -2.57 -2.57 0 0 208 137.8 137.8 -416 382.8 334.3 292.6 194.3 -0.63 -0.89 -0.89 0 0 0.163 0.519 0.023 -4.18 -4.18 -4.18 -4.58 0
0 0 0 0 0 0 0 0 0 0 0 0 0 0 -2.57 -2.57 0 342.7 208 137.8 137.8 -416 382.8 334.3 292.6 194.3 194.3 194.3 -0.89 0 0 0.519 0.519 -4.58 -4.18 -4.18 -4.18 -4.58 0
0 0 0 0 0 0 0 0 0 0 0 0 0 0 -2.57 418.5 196.8 342.7 208 137.8 137.8 -416 382.8 334.3 292.6 194.3 194.3 292.3 292.3 0 0 0.023 -4.58 -4.58 -4.18 0 0
0 0 0 0 0 0 0 0 0 0 0 0 0 0 418.5 418.5 196.8 342.7 -498 -498 -498 -416 382.8 277.2 215.7 194.3 194.3 292.3 292.3 -6.9 0 0.023 -40 -8.9 -4.18 0 0 0 0
0 0 0 0 0 0 0 0 0 0 0 0 -1.24 -1.24 305.7 106.4 -700 -700 -439 -439 -439 271.6 -244 -60.1 -44 -14.5 242 245.7 245.7 -6.9 -6.9 -15.4 -15.4 -8.9 -8.9 0 0 0 0
0 0 0 0 0 0 0 0 0 0 0 -1.24 -1.24 -1.24 305.7 106.4 -700 -700 -190 -190 -190 271.6 -244 -60.1 -44 -14.5 242 245.7 245.7 -6.9 0 -15.4 -15.4 -8.9 -8.9 -8.9 0 0
0 0 0 0 0 0 0 0 0 -1.27 -1.24 -1.24 -1.24 469.5 -85.3 73.6 -371 605.4 605.4 605.4 -401 -401 -452 -452 -126 -128 186.2 0 -226 -275 -275 -15.4 -8.9 -8.9 -8.9 -8.9 0 0
0 0 0 0 0 0 0 -1.27 -1.27 -1.27 -1.24 -1.24 204.1 204.1 73.6 -362 697.3 697.3 697.3 -401 -401 -452 -452 -126 -70.7 186.2 0 -226 -275 -275 -8.9 -8.9 0 0
0 0 0 0 0 -1.27 -1.27 -1.27 -1.27 -1.27 -1.24 204.1 0 0 -362 697.3 697.3 697.3 -113 -113 11.87 0 -70.7 -70.7 92.97 -232 -315 -315 -7.23 -7.23 0 0 0 0
98.93 98.93 195.2 195.2 0.239 -1.24 -1.24 -1.24 -1.24 0 -109 -109 -98.2 -98.2 -63.9 -63.9 -63.9 0 -84 -72 -72 -81.8 -81.8 92.97 -456 -456 -317 -7.23 -7.23 0 0 0 0 0 0
0 -3.21 0 98.93 98.93 98.93 195.2 0.239 0.239 0.239 -1.24 -1.24 -1.24 0 -53.6 -53.6 -131 -210 -210 -198 -198 -84 -84 -72 -72 -81.8 0 -179 -456 -456 -317 -7.23 -7.23 0 0 0 0 0 0
0 -3.21 0 99.24 99.24 99.24 -7.58 -7.58 -7.58 0 0 -1.24 -1.24 0 0 -53.6 -131 -210 -210 -198 -198 -187 -187 -231 -231 -4.4 -4.4 -272 -272 -167 3.435 -7.23 -7.23 0 0 0 0 0 0
0 -9.32 -9.32 99.24 99.24 99.24 -7.58 -7.58 -7.58 0 0 0 0 0.023 0.023 -1.95 -1.95 -1.95 -0.9 -0.9 173.4 -0.72 -1.03 -1.03 -2.27 -2.27 -134 -119 -119 -167 3.435 -7.23 -7.23 0 0 0 0 0 0
0 0 0.188 -1.14 -1.14 -1.14 -7.58 -7.58 -7.58 0 0 0 0 0 -59.8 -59.8 -64.9 -54.8 0 0 173.4 -118 -98.7 -60.7 -195 -195 -134 -159 -159 -213 -286 -7.23 -7.23 0 0 0 0 0 0
0 0 0.188 -1.14 -1.14 -1.14 0 -0.63 0 0 0 0 0 0 -127 -127 116.1 116.1 0 0 15.02 -228 -98.7 -0.68 48.55 -18.8 -39.2 -38.1 -38.1 -286 0 0 0 0 0 0 0 0 0
0 0 0.188 -1.14 -1.32 -1.32 -0.63 -0.63 0 0 0 0 -15.2 0 -127 0 116.1 116.1 18.81 0 15.02 -228 -40.4 16.97 48.55 -18.8 -38.1 -286 0 0 0 0 0 0 0 0 0
0 -3.03 -71.7 -1.32 -1.32 -1.32 -0.63 -0.63 0.023 0 0 -72.9 2.123 -47.9 -39.6 132.3 132.3 305.5 305.5 145.9 0 -5.04 -5.04 -95.8 -95.8 -286 0 0 0 0 0 0 0 0 0
0 -3.03 -71.7 -1.22 -1.22 -1.23 -1.37 -1.37 0.023 0 -65.5 -65.5 -63.6 -52.5 -133 -133 132.3 305.5 305.5 145.9 145.9 170.1 170.1 70.79 70.79 -95.8 -95.8 -95.8 0 0 0 0 0 0 0 0 0 0
0 -4.69 -4.69 -1.22 -1.22 -1.23 0 0 0 0 -65.5 -65.5 -63.6 -52.5 -133 -133 793.5 793.5 398 225.4 411.1 83.26 19.66 70.79 14.79 -65 -113 -113 0 0 0 0 0 0 0 0 0 0 0
0 -2.11 -2.11 -3.17 -3.17 -3.17 0 0 -5.96 0 -28 -28 -114 -110 -110 793.5 506.6 179 481.7 7.83 -44.7 -152 -152 0 0 0 0 0 0 0 0 0 0 0 0 0
0 0.743 0.743 199.8 199.8 -3.17 -492 -492 -492 90.6 -28 -28 -114 -110 -110 -18 59.71 449.6 7.83 55.9 -44.7 -152 -152 0 0 0 0 0 0 0 0 0 0 0 0 0
0 0.743 0.743 277 277 -3.17 -352 -352 -352 -28.7 -48.2 -71.7 -48.5 -133 -133 -18 -2.45 449.9 171.7 449.6 13.78 13.78 -44.7 -152 -152 0 0 0 0 0 0 0 0 0 0 0 0 0
0 196.3 196.3 277 277 280.1 -525 -525 -525 82.27 -48.2 -71.7 -8.49 -133 -133 0 449.9 358.5 171.7 449.6 13.78 13.78 36.38 -23.5 -23.5 0 0 0 0 0 0 0 0 0 0 0 0 0
0 0 292.5 89.07 280.1 280.1 -525 -525 -525 -204 -128 -128 -28.5 -28.5 -180 -180 -48.9 109.8 287.4 -0.95 108.6 108.6 75.05 75.05 75.05 52.58 -12.6 -12.6 0 0 0 -1.24 -1.24 0 0 0 0 0 0
0 0 0 341.4 752.7 752.7 -617 -617 -617 -35.6 -110 -49.3 -68.7 -36.6 -48.9 109.8 287.4 -1.08 0 108.6 -9.31 -9.31 52.58 0 -12.6 -12.6 0 0 0 -1.24 -1.24 0 0 0 0 0 0
0 0 0 341.4 752.7 752.7 -556 -556 -556 -12 -110 -110 -100 -26.3 -26.3 0 -18.5 35.16 -1.08 0 -86.8 0.245 -9.31 0 0 0.069 0.069 0 0 0 -124 -1.24 0 0 0 0 0 0
0 0 0 245.5 180.2 180.2 -391 -391 -213 -142 -233 -233 -151 -100 -26.3 0 0 3.583 3.583 0.328 0 0 0 0 0 0 0 0 0 0 0 -1.24 -1.24 0 0 0 0 0 0
0 0 0 245.5 180.2 180.2 -391 -391 -213 -233 -233 -151 -100 39.87 0 13.96 3.583 3.583 0.328 0 0 0 0 0 0 0 0 0 0 0 -1.24 -1.24 0 0 0 0 0 0
0 0 0 183.9 183.9 180.2 -177 104.8 -425 -233 -176 -100 -29.3 -75.6 -75.6 0 -32.6 0.328 0 0 0 -147 -305 -305 -295 -295 -141 -141 0 0 -1.24 0 0 0 0 0 0
0 0 0 183.9 183.9 191.4 -177 104.8 -425 -425 -176 -449 -449 -71.3 -226 -226 0.325 0.325 -0.43 0.026 0.026 -250 -147 -305 -305 -295 -797 -141 -141 -141 182.2 182.2 0 0 0 0 0 0
0 0 0 183.9 -2.38 191.4 191.4 245.5 245.5 -425 -425 -449 -71.3 -71.3 -226 -277 -248 -248 -0.43 0 0 -250 -250 -305 -305 -797 -797 220.4 220.4 220.4 341.8 182.2 0 0 0 0 0 0
0 0 0 -2.38 -2.38 191.4 191.4 191.4 245.5 245.5 -214 -449 -449 -32.3 -32.3 -277 -277 -248 -95.3 5.653 0.139 0.139 -388 -125 -343 -343 -381 -797 220.4 220.4 220.4 341.8 194.8 0 0 0 0 0 0
0 0 0 -2.38 0 191.4 191.4 182.5 182.5 245.5 -214 -120 -152 -100 -32.3 -217 -217 -95.3 -95.3 5.653 0.026 0.026 -218 -218 -260 -28.4 -344 -319 414.1 414.1 414.1 341.8 194.8 0 0 0 0 0 0
0 0 0 0 0 191.4 182.5 182.5 182.5 407.6 407.6 407.6 318.9 318.9 233.1 -48.3 -287 440.3 -67.6 -244 0 0 -289 -289 0 104.3 -381 -448 291 291.2 291.2 197.5 197.5 0 0 0 0 0 0
0 0 0 -1.26 -1.26 87.59 87.59 87.59 354.7 354.7 407.6 464.5 451.2 259.7 259.7 -500 -6.51 -244 -197 -197 0 0 -249 -249 -249 -306 -381 -448 291 291.2 291.2 197.5 -0.74 0 0 0 0 0 0
0 0 0 0 0 87.59 87.59 354.7 354.7 354.7 407.6 104.8 245.5 182.5 182.5 -500 -500 -500 -197 -197 0 0 -249 -317 -486 -486 -583 -583 291 291.2 291.2 -0.74 -0.74 0 0 0 0 0 0
0 0 0 -22.2 -22.2 87.59 87.59 345.5 345.5 0 104.8 245.5 182.5 182.5 -500 -500 -500 567.3 73.27 73.27 0 0 362.6 362.6 161 161 104.3 104.3 0 0 0 -0.74 -0.74 0 0 0 0 0 0
0 0 0 -22.2 -22.2 87.59 345.5 345.5 345.5 197 197 0 0 0 421.4 421.4 567.3 567.3 148.5 73.27 0 0 362.6 362.6 161 161 104.3 104.3 0 0 0 -0.74 -0.74 0 0 0 0 0 0
0 0 0 -3.56 -3.56 -3.56 48.43 292.5 292.5 290.8 290.8 290.8 290.8 0 421.4 421.4 246.5 246.5 -2.05 211 0 0 658.9 658.9 245.7 245.7 103.3 103.3 -0.78 -0.78 -0.78 -0.74 -0.74 0 0 0 0 0 0
0 0 0 -3.56 -3.56 -3.56 48.43 194.5 194.5 181.9 181.9 -0.91 0 0 421.4 421.4 341.4 98.56 211 211 0 472.2 341.4 341.4 19.21 19.21 19.21 19.21 -0.78 -0.78 -0.78 0 0 0 0 0 0 0 0
0 0 0 -3.56 -3.56 -3.56 0 -0.91 -0.91 -0.84 -0.84 -0.91 0 -0.81 0 0 -0.41 98.56 33.39 0 0 245.5 124.8 124.8 -0.78 -0.78 -0.66 -0.66 -4.55 -4.55 -4.55 -0.88 -0.88 0 0 0 0 0 0
0 0 0 0 0 0 0 -0.91 -0.91 -0.84 -0.91 -0.91 0 -0.81 -0.2 -0.2 -0.27 -0.8 33.39 0 0 245.5 -1.09 -1.09 0 0 0 0 0 0 0 -1.09 -1.09 0 0 0 0 0 0
0 0 0 0 0 0 0 0 0 0 0 0 0 0 0 0 0 0 0 0 0 0 0 0 0 0 0 0 0 0 0 0 0 0 0 0 0 0 0 0 0 0 0 0 0 0 0 0 0 0 0 0 0 0 0 0 0 0 0 0 0 0 0 0 0 0 0 0 0 0 0 0 0 0 0 0 0 0 0
0 0 0 0 0 0 0 0 0 0 0 0 0 0 0 0 0 0 0 0 0 0 0 0 0 0 0.382 0 0 -0.48 -0.48 -0.78 -0.78 0 0 -0.48 -0.48 -0.48 0 0
0 0 0 0 0 0 0 0 0 0 0 0 0 0 0 0 0 0 0 0 0 0 0 0 0 0 0.382 -0.24 -0.24 -0.48 -0.48 0.304 0.304 -0.42 -0.42 -1.07 -1.07 -1.07 0 0
0 0 0 0 0 0 0 0 0 0 0 0 0 0 0 0 0 0 0 0 0 0 0 0 0 0 0 -0.37 -0.37 -1.07 -1.07 -0.78 -0.78 -0.37 -0.37 -0.02 -0.02 0 0 0
0 0 0 0 0 0 0 0 0 0 0 0 0 0 0 0 0 0 0 0 0 0 0 0 0 0 0 -0.24 -0.24 -0.74 -0.74 0.222 0.222 -0.24 -0.24 -0.02 0 0 0 0
0 0 0 0 0 0 0 0 0 0 0 0 0 0 0 0 0 0 0 0 0 0 0 0 0 0 0 -1.03 -1.03 -0.48 -0.48 0.382 0.382 -0.32 -0.32 0 0 0 0 0
0 0 0 0 0 0 0 0 0 0 0 0 0 0 0 0 0 0 0 0 0 0 0 0 0 0 0 -0.44 -0.44 -0.42 -0.42 0.005 0.005 0 0.265 -0.48 -0.48 -0.48 0 0
0 0 0 0 0 0 0 0 0 0 0 0 0 0 0 0 0 0 0 0 0 0 0 0 0 0 0.19 -0.78 -0.78 -0.48 -0.48 -0.52 -0.52 0.265 2.898 -0.48 -0.48 -0.48 0
0 0 0 0 0 0 0 0 0 0 0 0 0 0 0 0 0 0 0 0 0 0 0 0 0 0 0.19 -0.01 -0.01 -1.3 -1.3 -0.52 0.077 0.265 2.898 -0.41 -0.41 -2.27 -2.27
0 0 0 0 0 0 0 0 0 0 0 0 0 0 0 0 0 0 0 0 0 0 0 0 0 0 0.19 -0.01 -0.01 -1.3 -1.3 0.077 0.077 2.898 2.898 -0.41 -0.41 -2.27 -2.27
0 0 0 0 0 0 0 0 0 0 0 0 0 0 0 0 0 0 0 0 0 0 0 0 0 0 -0.48 -0.48 -0.78 -0.78 0 0.191 0.191 0.342 2.284 2.284 -3.84 -4.17 0
0 0 0 0 0 0 0 0 0 0 0 0 0 0 0 0 0 0 0 0 0 0 0 0 0 0 -0.48 -0.48 -0.78 0 0 0.191 0.191 0.342 2.284 -3.84 -3.84 -4.17 0
0 0 0 0 0 0 0 0 0 0 0 0 0 0 -2.55 -2.55 0 0 468.5 252.3 252.3 -370 480.6 473.4 413.4 412 -0.48 -0.78 -0.78 0 0 0.191 0.604 0.342 -3.84 -3.84 -3.84 -4.17 0
0 0 0 0 0 0 0 0 0 0 0 0 0 0 -2.55 -2.55 0 411.1 468.5 252.3 252.3 -370 480.6 473.4 413.4 412 412 412 -0.78 0 0 0.604 0.604 -4.17 -3.84 -3.84 -3.84 -4.17 0
0 0 0 0 0 0 0 0 0 0 0 0 0 0 -2.55 412 412 411.1 468.5 252.3 252.3 -370 480.6 473.4 413.4 412 412 412 412 0 0 0.027 -4.17 -4.17 -3.84 0 0
0 0 0 0 0 0 0 0 0 0 0 0 0 0 412 412 412 411.1 -451 -451 -451 -370 480.6 300.4 240.4 412 412 412 412 -5.93 0 0.027 -29.9 -8.17 -3.84 0 0 0 0
0 0 0 0 0 0 0 0 0 0 0 0 -1.07 -1.07 601.2 120.8 -634 -634 -396 -396 -396 378.7 -180 43.37 4.406 53.96 319.5 635.9 635.9 -5.93 -5.93 -15 -15 -8.17 -8.17 0 0 0 0
0 0 0 0 0 0 0 0 0 0 0 -1.07 -1.07 -1.07 601.2 120.8 -634 -634 -163 -163 -163 378.7 -180 43.37 4.406 53.96 319.5 635.9 635.9 -5.93 0 -15 -15 -8.17 -8.17 -8.17 0 0
0 0 0 0 0 0 0 0 0 -1.12 -1.07 -1.07 -1.07 476.8 -37.2 79.57 -329 690.7 690.7 690.7 -363 -363 -413 -413 -118 -113 219.5 0 -203 -188 -188 -15 -8.17 -8.17 -8.17 -8.17 0 0
0 0 0 0 0 0 0 -1.12 -1.12 -1.12 -1.07 -1.07 344.7 344.7 79.57 -326 797.7 797.7 797.7 -363 -363 -413 -413 -118 -50.7 219.5 0 -203 -188 -188 -8.17 -8.17 0 0
0 0 0 0 0 -1.12 -1.12 -1.12 -1.12 -1.12 -1.07 344.7 0 0 -326 797.7 797.7 797.7 -103 -103 20.64 0 -50.7 -50.7 142.4 -211 -289 -289 -6.61 -6.61 0 0 0 0
161.8 161.8 182.8 182.8 0.278 -1.07 -1.07 -1.07 -1.07 0 -75.9 -75.9 -85.4 -85.4 -24.1 -24.1 -24.1 0 -68.9 -56.2 -56.2 -51.3 -51.3 142.4 -420 -420 -274 -6.61 -6.61 0 0 0 0 0 0
0 -3.04 0 161.8 161.8 161.8 182.8 0.278 0.278 0.278 -1.07 -1.07 -1.07 0 -37.5 -37.5 -115 -143 -143 -151 -151 -68.9 -68.9 -56.2 -56.2 -51.3 0 -161 -420 -420 -274 -6.61 -6.61 0 0 0 0 0 0
0 -3.04 0 182.4 182.4 182.4 -6.75 -6.75 -6.75 0 0 -1.07 -1.07 0 0 -37.5 -115 -143 -143 -151 -151 -150 -150 -205 -205 -3.79 -3.79 -242 -242 -144 35.41 -6.61 -6.61 0 0 0 0 0 0
0 -8.78 -8.78 182.4 182.4 182.4 -6.75 -6.75 -6.75 0 0 0 0 0.027 0.027 -1.83 -1.83 -1.83 -0.68 -0.68 220.2 -0.47 -0.81 -0.81 -1.88 -1.88 -82.2 -86.7 -86.7 -144 35.41 -6.61 -6.61 0 0 0 0 0 0
0 0 0.269 -1.02 -1.02 -1.02 -6.75 -6.75 -6.75 0 0 0 0 0 -44.9 -44.9 -46.5 -45.3 0 0 220.2 -98.9 -64.1 -51.9 -127 -127 -82.2 -105 -105 -187 -255 -6.61 -6.61 0 0 0 0 0 0
0 0 0.269 -1.02 -1.02 -1.02 0 -0.59 0 0 0 0 0 0 -114 -114 137.4 137.4 0 0 20.76 -181 -64.1 -0.6 51.09 -15.6 -23 -20.9 -20.9 -255 0 0 0 0 0 0 0 0 0
0 0 0.269 -1.02 -1.26 -1.26 -0.59 -0.59 0 0 0 0 -14.2 0 -114 0 137.4 137.4 23.36 0 20.76 -181 -3.09 23.3 51.09 -15.6 -20.9 -255 0 0 0 0 0 0 0 0 0
0 -2.68 -65.4 -1.26 -1.26 -1.26 -0.59 -0.59 0.027 0 0 -63.3 19.03 -39.3 -18.3 159.6 159.6 396.3 396.3 237.4 0 107.9 107.9 -87.6 -87.6 -255 0 0 0 0 0 0 0 0 0
0 -2.68 -65.4 -1.04 -1.04 -1.05 -1.28 -1.28 0.027 0 -49 -49 -24.3 -44.6 -110 -110 159.6 396.3 396.3 237.4 237.4 245.1 245.1 83.79 83.79 -87.6 -87.6 -87.6 0 0 0 0 0 0 0 0 0 0
0 -4.18 -4.18 -1.04 -1.04 -1.05 0 0 0 0 -49 -49 -24.3 -44.6 -110 -110 959.4 959.4 417.5 344.5 626.3 134.6 70.89 83.79 21.69 -58.5 -104 -104 0 0 0 0 0 0 0 0 0 0 0
0 -1.88 -1.88 -2.68 -2.68 -2.68 0 0 -5.59 0 -13.2 -13.2 -103 -102 -102 959.4 598.4 186.6 565.7 11.01 -34.4 -90.6 -90.6 0 0 0 0 0 0 0 0 0 0 0 0 0
0 0.85 0.85 216.7 216.7 -2.68 -470 -470 -470 103.4 -13.2 -13.2 -103 -102 -102 -14.2 84.62 531.9 11.01 67.09 -34.4 -90.6 -90.6 0 0 0 0 0 0 0 0 0 0 0 0 0
0 0.85 0.85 552.5 552.5 -2.68 -334 -334 -334 -21.9 -36.1 -60.3 -44.2 -123 -123 -14.2 -1.91 491.6 200.2 531.9 80.36 80.36 -34.4 -90.6 -90.6 0 0 0 0 0 0 0 0 0 0 0 0 0
0 184.2 184.2 552.5 552.5 294.9 -444 -444 -444 86.39 -36.1 -60.3 -0.9 -123 -123 0 491.6 407.5 200.2 531.9 80.36 80.36 74.57 -12.4 -12.4 0 0 0 0 0 0 0 0 0 0 0 0 0
0 0 297.4 100.7 294.9 294.9 -444 -444 -444 -189 -116 -116 -0.87 -0.87 -172 -172 -42 161 319.6 -0.73 158.4 158.4 118.8 118.8 118.8 54.88 -11.1 -11.1 0 0 0 -1.07 -1.07 0 0 0 0 0 0
0 0 0 378.7 813 813 -592 -592 -592 -25.8 -106 -42.9 -64.7 -35.1 -42 161 319.6 -0.89 0 158.4 14.05 14.05 54.88 0 -11.1 -11.1 0 0 0 -1.07 -1.07 0 0 0 0 0 0
0 0 0 378.7 813 813 -471 -471 -471 28.59 -106 -106 -93.7 -6.09 -6.09 0 23.37 44.45 -0.89 0 -76.7 15.85 14.05 0 0 0.081 0.081 0 0 0 -119 -1.07 0 0 0 0 0 0
0 0 0 378.7 539.6 539.6 -337 -337 -206 -135 -221 -221 -123 -93.7 -6.09 0 0 17.45 17.45 0.382 0 0 0 0 0 0 0 0 0 0 0 -1.07 -1.07 0 0 0 0 0 0
0 0 0 378.7 539.6 539.6 -337 -337 -206 -221 -221 -123 -93.7 42.05 0 28.92 17.45 17.45 0.382 0 0 0 0 0 0 0 0 0 0 0 -1.07 -1.07 0 0 0 0 0 0
0 0 0 272.8 272.8 539.6 -159 258.1 -393 -221 -141 -93.7 -6.34 -26.8 -26.8 0 -3.17 0.382 0 0 0 -138 -293 -293 -249 -249 -51.8 -51.8 0 0 -1.07 0 0 0 0 0 0
0 0 0 272.8 272.8 305.3 -159 258.1 -393 -393 -141 -428 -428 -65.9 -204 -204 6.961 6.961 -0.38 0.031 0.031 -238 -138 -293 -293 -249 -722 -51.8 -51.8 -51.8 270.9 270.9 0 0 0 0 0 0
0 0 0 272.8 -2.31 305.3 305.3 497 497 -393 -393 -428 -65.9 -65.9 -204 -236 -218 -218 -0.38 0 0 -238 -238 -293 -293 -722 -722 331 331 331 498 270.9 0 0 0 0 0 0
0 0 0 -2.31 -2.31 305.3 305.3 305.3 497 497 -203 -428 -428 -19.2 -19.2 -236 -236 -218 -83.4 5.943 0.183 0.183 -363 -115 -317 -317 -356 -722 331 331 331 498 182.4 0 0 0 0 0 0
0 0 0 -2.31 0 305.3 305.3 271 271 497 -203 -114 -144 -96.1 -19.2 -198 -198 -83.4 -83.4 5.943 0.031 0.031 -196 -196 -248 20.52 -320 -292 684.6 684.6 684.6 498 182.4 0 0 0 0 0 0
0 0 0 0 0 305.3 271 271 271 435.3 435.3 435.3 399.1 399.1 370 -44.3 -218 506.4 -42.7 -228 0 0 -267 -267 0 126 -347 -419 412.2 303.2 303.2 214.7 214.7 0 0 0 0 0 0
0 0 0 -1.24 -1.24 269 269 269 593.5 593.5 435.3 501.9 533.9 261 261 -420 7.153 -228 -186 -186 0 0 -236 -230 -230 -283 -347 -419 412.2 303.2 303.2 214.7 -0.69 0 0 0 0 0 0
0 0 0 0 0 269 269 593.5 593.5 593.5 435.3 271 497 293.5 293.5 -420 -420 -420 -186 -186 0 0 -236 -298 -454 -454 -549 -549 412.2 303.2 303.2 -0.69 -0.69 0 0 0 0 0 0
0 0 0 -21.6 -21.6 269 269 551.6 551.6 0 271 497 293.5 293.5 -420 -420 -420 768.5 100.5 100.5 0 0 714.7 714.7 269.5 269.5 272.3 272.3 0 0 0 -0.69 -0.69 0 0 0 0 0 0
0 0 0 -21.6 -21.6 269 551.6 551.6 551.6 420.5 420.5 0 0 78.03 506.9 506.9 768.5 768.5 161 100.5 0 0 714.7 714.7 269.5 269.5 272.3 272.3 0 0 0 -0.69 -0.69 0 0 0 0 0 0
0 0 0 -3.39 -3.39 -3.39 174.7 290.1 290.1 312.5 312.5 312.5 312.5 78.03 506.9 506.9 638.7 638.7 22.46 231.1 0 0 804.2 804.2 269.8 269.8 106.7 106.7 -0.73 -0.73 -0.73 -0.69 -0.69 0 0 0 0 0 0
0 0 0 -3.39 -3.39 -3.39 174.7 192.5 192.5 235 235 -0.86 0 78.03 506.9 506.9 476.1 253.7 231.1 231.1 0 530 497 497 78.03 78.03 78.03 78.03 -0.73 -0.73 -0.73 0 0 0 0 0 0 0 0
0 0 0 -3.39 -3.39 -3.39 0 -0.86 -0.86 -0.75 -0.75 -0.86 0 -0.8 0 0 -0.32 253.7 103.3 0 0 269.5 130.9 130.9 -0.73 -0.73 -0.61 -0.61 -4.25 -4.25 -4.25 -0.83 -0.83 0 0 0 0 0 0
0 0 0 0 0 0 0 -0.86 -0.86 -0.75 -0.86 -0.86 0 -0.8 -0.17 -0.17 -0.25 -0.76 103.3 0 0 269.5 -1.05 -1.05 0 0 0 0 0 0 0 -1.05 -1.05 0 0 0 0 0 0
0 0 0 0 0 0 0 0 0 0 0 0 0 0 0 0 0 0 0 0 0 0 0 0 0 0 0 0 0 0 0 0 0 0 0 0 0 0 0
Base Case
High Scenario
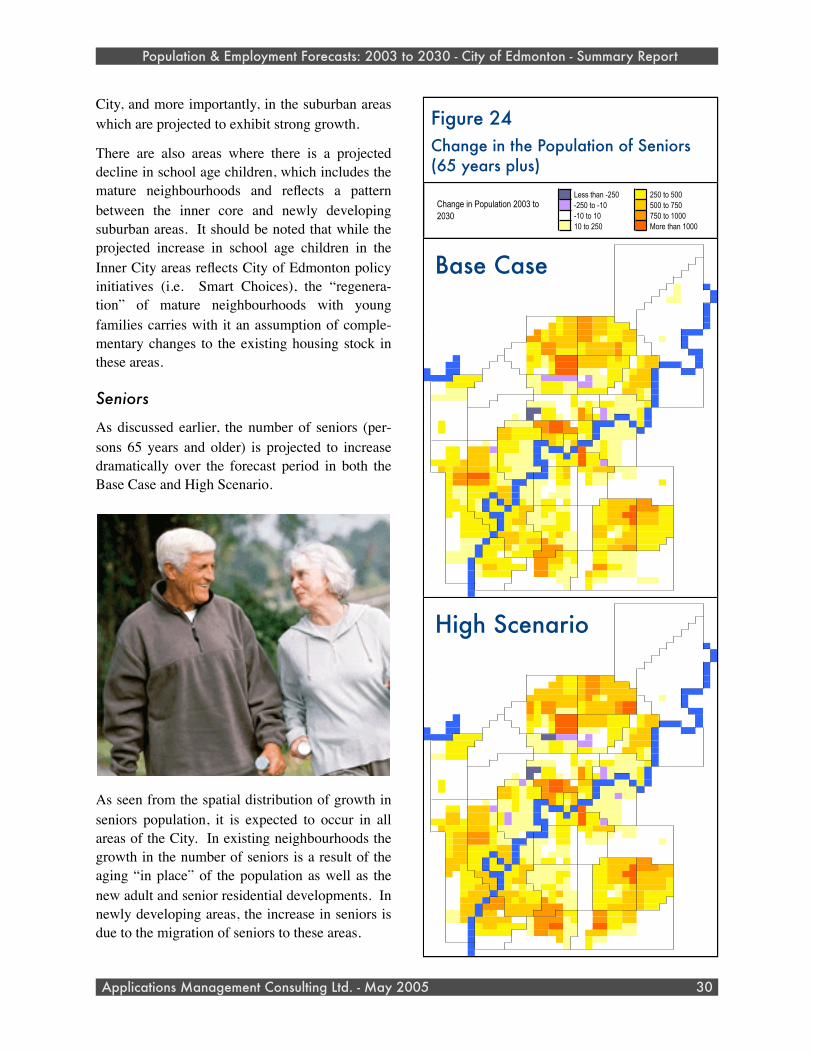
City, and more importantly, in the suburban areas which are projected to exhibit strong growth.
There are also areas where there is a projected decline in school age children, which includes the mature neighbourhoods and reflects a pattern between the inner core and newly developing suburban areas. It should be noted that while the projected increase in school age children in the Inner City areas reflects City of Edmonton policy initiatives (i.e. Smart Choices), the “regenera-tion” of mature neighbourhoods with young families carries with it an assumption of comple-mentary changes to the existing housing stock in these areas.
Seniors
As discussed earlier, the number of seniors (per-sons 65 years and older) is projected to increase dramatically over the forecast period in both the Base Case and High Scenario.
As seen from the spatial distribution of growth in seniors population, it is expected to occur in all areas of the City. In existing neighbourhoods the growth in the number of seniors is a result of the aging “in place” of the population as well as the new adult and senior residential developments. In newly developing areas, the increase in seniors is due to the migration of seniors to these areas.
Population & Employment Forecasts: 2003 to 2030 - City of Edmonton - Summary Report
Applications Management Consulting Ltd. - May 2005 30
Figure 24Change in the Population of Seniors (65 years plus)
Less than -250 250 to 500 -250 to -10 500 to 750 -10 to 10 750 to 1000 10 to 250 More than 1000
Change in Population 2003 to 2030
0 0 0 0 0 0 0 0 0 0 0 0 0 0 0 0 0 0 0 0 0 0 0 0 0 0 0 0 0 0 0 0 0 0 0 0 0 0 0 0
0 0 0 0 0 0 0 0 0 0 0 0 0 0 0 0 0 0 0 0 0 0 0 0 0 0 0.959 0.68 0.68 0.537 0.537 0.424 0.424 0 0 1.067 1.067 1.067 0 0
0 0 0 0 0 0 0 0 0 0 0 0 0 0 0 0 0 0 0 0 0 0 0 0 0 0 0.959 0.073 0.073 1.528 1.528 0.14 0.14 0.438 0.438 0.498 0.498 0.498 0 0
0 0 0 0 0 0 0 0 0 0 0 0 0 0 0 0 0 0 0 0 0 0 0 0 0 0 0 0.641 0.641 0.689 0.689 0.424 0.424 0.641 0.641 -0.07 -0.07 0.557 0 0
0 0 0 0 0 0 0 0 0 0 0 0 0 0 0 0 0 0 0 0 0 0 0 0 0 0 0 0.073 0.073 -0.09 -0.09 0.627 0.627 0.073 0.073 -0.07 0.557 0.557 0 0
0 0 0 0 0 0 0 0 0 0 0 0 0 0 0 0 0 0 0 0 0 0 0 0 0 0 0 0.21 0.21 0.537 0.537 0.2 0.2 0.624 0.624 0.557 0.557 0.557 0 0
0 0 0 0 0 0 0 0 0 0 0 0 0 0 0 0 0 0 0 0 0 0 0 0 0 0 0 0.206 0.206 0.438 0.438 1.583 1.583 0 1.227 0.537 0.537 0.537 0 0
0 0 0 0 0 0 0 0 0 0 0 0 0 0 0 0 0 0 0 0 0 0 0 0 0 0 0.703 0.424 0.424 0.627 0.627 0.289 0.289 1.227 11.43 0.537 0.537 0.537 0
0 0 0 0 0 0 0 0 0 0 0 0 0 0 0 0 0 0 0 0 0 0 0 0 0 0 0.703 0.524 0.524 0.762 0.762 0.289 0.123 1.227 11.43 1.358 1.358 0.095 0.095
0 0 0 0 0 0 0 0 0 0 0 0 0 0 0 0 0 0 0 0 0 0 0 0 0 0 0.703 0.524 0.524 0.762 0.762 0.123 0.123 11.43 11.43 1.358 1.358 0.095 0.095
0 0 0 0 0 0 0 0 0 0 0 0 0 0 0 0 0 0 0 0 0 0 0 0 0 0 0.484 0.484 0.424 0.424 0 0.364 0.364 0.829 8.987 8.987 -0.73 -0.82 0
0 0 0 0 0 0 0 0 0 0 0 0 0 0 0 0 0 0 0 0 0 0 0 0 0 0 0.484 0.484 0.424 0 0 0.364 0.364 0.829 8.987 -0.73 -0.73 -0.82 0
0 0 0 0 0 0 0 0 0 0 0 0 0 0 3.086 3.086 0 0 257.9 509 509 802.4 904.2 670.3 612.6 450.5 0.484 0.424 0.424 0 0 0.364 0.27 0.829 -0.73 -0.73 -0.73 -0.82 0
0 0 0 0 0 0 0 0 0 0 0 0 0 0 3.086 3.086 0 642.1 257.9 509 509 802.4 904.2 670.3 612.6 450.5 450.5 450.5 0.424 0 0 0.27 0.27 -0.82 -0.73 -0.73 -0.73 -0.82 0
0 0 0 0 0 0 0 0 0 0 0 0 0 0 3.086 777.1 264 642.1 257.9 509 509 802.4 904.2 670.3 612.6 450.5 450.5 607.6 607.6 0 0 0.868 -0.82 -0.82 -0.73 0 0
0 0 0 0 0 0 0 0 0 0 0 0 0 0 777.1 777.1 264 642.1 621.3 621.3 621.3 802.4 904.2 276.9 216.5 450.5 450.5 607.6 607.6 4.8 0 0.868 179.1 -1.21 -0.73 0 0 0 0
0 0 0 0 0 0 0 0 0 0 0 0 1.941 1.941 345.9 441.5 905.6 905.6 531.3 531.3 531.3 368.3 582 505 566.4 655.4 785.3 293.9 293.9 4.8 4.8 2.363 2.363 -1.21 -1.21 0 0 0 0
0 0 0 0 0 0 0 0 0 0 0 1.941 1.941 1.941 345.9 441.5 905.6 905.6 281.1 281.1 281.1 368.3 582 505 566.4 655.4 785.3 293.9 293.9 4.8 0 2.363 2.363 -1.21 -1.21 -1.21 0 0
0 0 0 0 0 0 0 0 0 1.905 1.941 1.941 1.941 679.7 463.2 120.7 552.5 1163 1163 1163 677.3 677.3 730.4 730.4 383.5 547 268.4 0 489.5 592.8 592.8 2.363 -1.21 -1.21 -1.21 -1.21 0 0
0 0 0 0 0 0 0 1.905 1.905 1.905 1.941 1.941 289.7 289.7 120.7 444.2 1309 1309 1309 677.3 677.3 730.4 730.4 383.5 429.5 268.4 0 489.5 592.8 592.8 -1.21 -1.21 0 0
0 0 0 0 0 1.905 1.905 1.905 1.905 1.905 1.941 289.7 0 0 444.2 1309 1309 1309 123.3 123.3 108.4 0 429.5 429.5 186.8 443.2 600.8 600.8 -0.78 -0.78 0 0 0 0
257.3 257.3 455.1 455.1 1.082 1.941 1.941 1.941 1.941 0 127.1 127.1 -247 -247 -52.6 -52.6 -52.6 0 -65.1 37.09 37.09 490.7 490.7 186.8 743.9 743.9 555.2 -0.78 -0.78 0 0 0 0 0 0
0 7.131 0 257.3 257.3 257.3 455.1 1.082 1.082 1.082 1.941 1.941 1.941 0 168.9 168.9 259.3 298.7 298.7 131.4 131.4 -65.1 -65.1 37.09 37.09 490.7 0 271.2 743.9 743.9 555.2 -0.78 -0.78 0 0 0 0 0 0
0 7.131 0 205.4 205.4 205.4 5.032 5.032 5.032 0 0 1.941 1.941 0 0 168.9 259.3 298.7 298.7 131.4 131.4 289.8 289.8 283.8 283.8 5.84 5.84 626.3 626.3 421.5 183 -0.78 -0.78 0 0 0 0 0 0
0 23.24 23.24 205.4 205.4 205.4 5.032 5.032 5.032 0 0 0 0 0.749 0.749 2.346 2.346 2.346 -0.08 -0.08 429.9 1.17 1.263 1.263 0.371 0.371 44.73 139.5 139.5 421.5 183 -0.78 -0.78 0 0 0 0 0 0
0 0 0.703 0.787 0.787 0.787 5.032 5.032 5.032 0 0 0 0 0 131.1 131.1 237.9 176.4 0 0 429.9 144.1 459.8 106.3 378.8 378.8 44.73 174.2 174.2 200.9 416.7 -0.78 -0.78 0 0 0 0 0 0
0 0 0.703 0.787 0.787 0.787 0 0.933 0 0 0 0 0 0 -253 -253 462.1 462.1 0 0 197.5 963 459.8 0.077 -39.7 121.7 190.2 91.44 91.44 416.7 0 0 0 0 0 0 0 0 0
0 0 0.703 0.787 0.735 0.735 0.933 0.933 0 0 0 0 18.1 0 -253 0 462.1 462.1 82.64 0 197.5 963 505.3 312.3 -39.7 121.7 91.44 416.7 0 0 0 0 0 0 0 0 0
0 2.18 284.2 0.735 0.735 0.735 0.933 0.933 0.749 0 0 219.3 51.69 13.67 148.2 871.1 871.1 1086 1086 846.3 0 413.1 413.1 111.2 111.2 416.7 0 0 0 0 0 0 0 0 0
0 2.18 284.2 1.79 1.79 1.384 0.778 0.778 0.749 0 593.2 593.2 487.8 288.4 354.7 354.7 871.1 1086 1086 846.3 846.3 298.7 298.7 230.9 230.9 111.2 111.2 111.2 0 0 0 0 0 0 0 0 0 0
0 3.016 3.016 1.79 1.79 1.384 0 0 0 0 593.2 593.2 487.8 288.4 354.7 354.7 687.8 687.8 394.5 264.7 490 131.4 321.9 230.9 133.5 19.53 99.95 99.95 0 0 0 0 0 0 0 0 0 0 0
0 1.322 1.322 3.836 3.836 3.836 0 0 31.19 0 297.5 297.5 370.3 48.7 48.7 687.8 445.5 219.6 558.3 108.5 251.3 11.68 11.68 0 0 0 0 0 0 0 0 0 0 0 0 0
0 3.238 3.238 269 269 3.836 713.6 713.6 713.6 -38.6 297.5 297.5 370.3 48.7 48.7 90.2 226.8 1114 108.5 133 251.3 11.68 11.68 0 0 0 0 0 0 0 0 0 0 0 0 0
0 3.238 3.238 323.8 323.8 3.836 746.4 746.4 746.4 126.9 306.1 22.85 119.1 152 152 90.2 12.57 479.8 355.4 1114 304.6 304.6 251.3 11.68 11.68 0 0 0 0 0 0 0 0 0 0 0 0 0
0 456.6 456.6 323.8 323.8 533.6 637.9 637.9 637.9 110.2 306.1 22.85 211 152 152 0 479.8 413.2 355.4 1114 304.6 304.6 -30.3 112.4 112.4 0 0 0 0 0 0 0 0 0 0 0 0 0
0 0 611.5 307.2 533.6 533.6 637.9 637.9 637.9 462.7 260.9 260.9 52.29 52.29 157.6 157.6 94.47 388.3 541.5 0.524 470.1 470.1 565.5 565.5 565.5 52.48 14.72 14.72 0 0 0 1.96 1.96 0 0 0 0 0 0
0 0 0 421.4 834.1 834.1 1086 1086 1086 307.5 155.9 154.6 62.21 13.84 94.47 388.3 541.5 0.398 -0.9 470.1 130.8 130.8 52.48 0 14.72 14.72 0 0 0 1.96 1.96 0 0 0 0 0 0
0 0 0 421.4 834.1 834.1 805.9 805.9 805.9 331 155.9 155.9 217.2 38.12 38.12 0 317.9 299.3 0.398 -0.9 258.3 27.95 130.8 0 0 0.212 0.212 0 0 0 268.9 1.96 0 0 0 0 0 0
0 0 0 293.5 230.4 230.4 405.1 405.1 317.4 345.2 561.6 561.6 160.7 217.2 38.12 0 0 86.76 86.76 0.2 -0.9 -0.9 0 0 0 0 0 0 0 0 0 1.96 1.96 0 0 0 0 0 0
0 0 0 293.5 230.4 230.4 405.1 405.1 317.4 561.6 561.6 160.7 217.2 88.82 0 175.8 86.76 86.76 0.2 0 0 0 0 0 0 0 0 0 0 0 1.96 1.96 0 0 0 0 0 0
0 0 0 322.9 322.9 230.4 383 203.9 372.5 561.6 389.8 217.2 87.67 374.6 374.6 0 315.3 0.2 0 0 0 346.1 570.8 570.8 722 722 859.7 859.7 0 0 1.96 0 0 0 0 0 0
0 0 0 322.9 322.9 284.8 383 203.9 372.5 372.5 389.8 604.6 604.6 92.23 258.9 258.9 103.1 103.1 2.604 0.716 0.716 425.6 346.1 570.8 570.8 722 1160 859.7 859.7 859.7 321.2 321.2 0 0 0 0 0 0
0 0 0 322.9 2.204 284.8 284.8 293.5 293.5 372.5 372.5 604.6 92.23 92.23 258.9 136.9 343.9 343.9 2.604 0 0 425.6 425.6 570.8 570.8 1160 1160 665.8 665.8 665.8 421.6 321.2 0 0 0 0 0 0
0 0 0 2.204 2.204 284.8 284.8 284.8 293.5 293.5 313.6 604.6 604.6 53 53 136.9 136.9 343.9 268.1 5.847 1.013 1.013 453 357 583.5 583.5 602 1160 665.8 665.8 665.8 421.6 452.3 0 0 0 0 0 0
0 0 0 2.204 0 284.8 284.8 321.4 321.4 293.5 313.6 176.4 377 130.1 53 358.7 358.7 268.1 268.1 5.847 0.716 0.716 500.7 500.7 355.6 231.4 430.2 634.8 364.1 364.1 364.1 421.6 452.3 0 0 0 0 0 0
0 0 0 0 0 284.8 321.4 321.4 321.4 634 634 634 451.2 451.2 275.3 196.7 464.6 596.9 201.5 164 0 0 531.3 531.3 0 26.27 622.6 612.5 444.4 444.9 444.9 264.2 264.2 0 0 0 0 0 0
0 0 0 0.168 0.168 196.2 196.2 196.2 470.8 470.8 634 594.5 496.2 543.8 543.8 920.9 349.1 164 190.4 190.4 0 0 450.4 429.9 429.9 509.1 622.6 612.5 444.4 444.9 444.9 264.2 2.418 0 0 0 0 0 0
0 0 0 0 0 196.2 196.2 470.8 470.8 470.8 634 172.3 293.5 321.4 321.4 920.9 920.9 920.9 190.4 190.4 0 0 450.4 478.9 657 657 793.7 793.7 444.4 444.9 444.9 2.418 2.418 0 0 0 0 0 0
0 0 0 19.06 19.06 196.2 196.2 437.8 437.8 0 172.3 293.5 321.4 321.4 920.9 920.9 920.9 715.1 290.9 290.9 0 0 417.2 417.2 214.7 214.7 176 176 0 0 0 2.418 2.418 0 0 0 0 0 0
0 0 0 19.06 19.06 196.2 437.8 437.8 437.8 264.5 264.5 0 0 0 787.8 787.8 715.1 715.1 142.3 290.9 0 0 417.2 417.2 214.7 214.7 176 176 0 0 0 2.418 2.418 0 0 0 0 0 0
0 0 0 4.684 4.684 4.684 97.67 608.2 608.2 444.3 444.3 444.3 444.3 0 787.8 787.8 299.4 299.4 14.09 206.3 0 0 877.7 877.7 294.3 294.3 180.7 180.7 2.187 2.187 2.187 2.418 2.418 0 0 0 0 0 0
0 0 0 4.684 4.684 4.684 97.67 453.9 453.9 325.6 325.6 2.107 0 0 787.8 787.8 421.4 205.3 206.3 206.3 0 548.7 421.4 421.4 49.65 49.65 49.65 49.65 2.187 2.187 2.187 0 0 0 0 0 0 0 0
0 0 0 4.684 4.684 4.684 0 2.107 2.107 3.148 3.148 2.107 0 0.466 0 0 1.966 205.3 81.53 0 0 293.5 170 170 2.187 2.187 1.432 1.432 11.25 11.25 11.25 1.823 1.823 0 0 0 0 0 0
0 0 0 0 0 0 0 2.107 2.107 3.148 2.107 2.107 0 0.466 2.406 2.406 1.943 2.065 81.53 0 0 293.5 0.687 0.687 0 0 0 0 0 0 0 0.687 0.687 0 0 0 0 0 0
0 0 0 0 0 0 0 0 0 0 0 0 0 0 0 0 0 0 0 0 0 0 0 0 0 0 0 0 0 0 0 0 0 0 0 0 0 0 0 0 0 0 0 0 0 0 0 0 0 0 0 0 0 0 0 0 0 0 0 0 0 0 0 0 0 0 0 0 0 0 0 0 0 0 0 0 0 0 0
0 0 0 0 0 0 0 0 0 0 0 0 0 0 0 0 0 0 0 0 0 0 0 0 0 0 0.962 0.677 0.677 0.541 0.541 0.427 0.427 0 0 1.073 1.073 1.073 0 0
0 0 0 0 0 0 0 0 0 0 0 0 0 0 0 0 0 0 0 0 0 0 0 0 0 0 0.962 0.074 0.074 1.535 1.535 0.143 0.143 0.443 0.443 0.505 0.505 0.505 0 0
0 0 0 0 0 0 0 0 0 0 0 0 0 0 0 0 0 0 0 0 0 0 0 0 0 0 0 0.642 0.642 0.695 0.695 0.427 0.427 0.642 0.642 -0.06 -0.06 0.554 0 0
0 0 0 0 0 0 0 0 0 0 0 0 0 0 0 0 0 0 0 0 0 0 0 0 0 0 0 0.074 0.074 -0.09 -0.09 0.627 0.627 0.074 0.074 -0.06 0.554 0.554 0 0
0 0 0 0 0 0 0 0 0 0 0 0 0 0 0 0 0 0 0 0 0 0 0 0 0 0 0 0.216 0.216 0.541 0.541 0.205 0.205 0.628 0.628 0.554 0.554 0.554 0 0
0 0 0 0 0 0 0 0 0 0 0 0 0 0 0 0 0 0 0 0 0 0 0 0 0 0 0 0.212 0.212 0.443 0.443 1.579 1.579 0 1.241 0.541 0.541 0.541 0 0
0 0 0 0 0 0 0 0 0 0 0 0 0 0 0 0 0 0 0 0 0 0 0 0 0 0 0.706 0.427 0.427 0.635 0.635 0.294 0.294 1.241 9.999 0.541 0.541 0.541 0
0 0 0 0 0 0 0 0 0 0 0 0 0 0 0 0 0 0 0 0 0 0 0 0 0 0 0.706 0.528 0.528 0.769 0.769 0.294 0.124 1.241 9.999 1.369 1.369 0.107 0.107
0 0 0 0 0 0 0 0 0 0 0 0 0 0 0 0 0 0 0 0 0 0 0 0 0 0 0.706 0.528 0.528 0.769 0.769 0.124 0.124 9.999 9.999 1.369 1.369 0.107 0.107
0 0 0 0 0 0 0 0 0 0 0 0 0 0 0 0 0 0 0 0 0 0 0 0 0 0 0.49 0.49 0.427 0.427 0 0.367 0.367 0.845 7.877 7.877 -0.72 -0.8 0
0 0 0 0 0 0 0 0 0 0 0 0 0 0 0 0 0 0 0 0 0 0 0 0 0 0 0.49 0.49 0.427 0 0 0.367 0.367 0.845 7.877 -0.72 -0.72 -0.8 0
0 0 0 0 0 0 0 0 0 0 0 0 0 0 2.67 2.67 0 0 511.6 434.5 434.5 749.3 914 826.9 748.6 742.2 0.49 0.427 0.427 0 0 0.367 0.278 0.845 -0.72 -0.72 -0.72 -0.8 0
0 0 0 0 0 0 0 0 0 0 0 0 0 0 2.67 2.67 0 645.7 511.6 434.5 434.5 749.3 914 826.9 748.6 742.2 742.2 742.2 0.427 0 0 0.278 0.278 -0.8 -0.72 -0.72 -0.72 -0.8 0
0 0 0 0 0 0 0 0 0 0 0 0 0 0 2.67 742.2 742.2 645.7 511.6 434.5 434.5 749.3 914 826.9 748.6 742.2 742.2 742.2 742.2 0 0 0.866 -0.8 -0.8 -0.72 0 0
0 0 0 0 0 0 0 0 0 0 0 0 0 0 742.2 742.2 742.2 645.7 600.9 600.9 600.9 749.3 914 274 209 742.2 742.2 742.2 742.2 4.847 0 0.866 159 -1.18 -0.72 0 0 0 0
0 0 0 0 0 0 0 0 0 0 0 0 1.95 1.95 762.8 357.9 876.4 876.4 512.6 512.6 512.6 348.4 556.5 622.7 532.6 632.2 790.5 1042 1042 4.847 4.847 0.454 0.454 -1.18 -1.18 0 0 0 0
0 0 0 0 0 0 0 0 0 0 0 1.95 1.95 1.95 762.8 357.9 876.4 876.4 221.4 221.4 221.4 348.4 556.5 622.7 532.6 632.2 790.5 1042 1042 4.847 0 0.454 0.454 -1.18 -1.18 -1.18 0 0
0 0 0 0 0 0 0 0 0 1.892 1.95 1.95 1.95 601.2 452.3 131.5 534.6 1186 1186 1186 618.2 618.2 655 655 341.4 475.4 260.7 0 444.6 613 613 0.454 -1.18 -1.18 -1.18 -1.18 0 0
0 0 0 0 0 0 0 1.892 1.892 1.892 1.95 1.95 368.3 368.3 131.5 428.5 1467 1467 1467 618.2 618.2 655 655 341.4 338.7 260.7 0 444.6 613 613 -1.18 -1.18 0 0
0 0 0 0 0 1.892 1.892 1.892 1.892 1.892 1.95 368.3 0 0 428.5 1467 1467 1467 71.26 71.26 63.08 0 338.7 338.7 205.7 406 552.9 552.9 -0.75 -0.75 0 0 0 0
387.2 387.2 423.2 423.2 1.084 1.95 1.95 1.95 1.95 0 101.4 101.4 -302 -302 -70.4 -70.4 -70.4 0 -96.4 -1.3 -1.3 385.3 385.3 205.7 677.5 677.5 533.1 -0.75 -0.75 0 0 0 0 0 0
0 6.263 0 387.2 387.2 387.2 423.2 1.084 1.084 1.084 1.95 1.95 1.95 0 153 153 230.2 311.5 311.5 138.8 138.8 -96.4 -96.4 -1.3 -1.3 385.3 0 238.6 677.5 677.5 533.1 -0.75 -0.75 0 0 0 0 0 0
0 6.263 0 422.5 422.5 422.5 5.053 5.053 5.053 0 0 1.95 1.95 0 0 153 230.2 311.5 311.5 138.8 138.8 253.6 253.6 231.2 231.2 5.868 5.868 573.6 573.6 381.7 190.3 -0.75 -0.75 0 0 0 0 0 0
0 20.49 20.49 422.5 422.5 422.5 5.053 5.053 5.053 0 0 0 0 0.747 0.747 2.344 2.344 2.344 -0.07 -0.07 403.1 1.187 1.274 1.274 0.391 0.391 54.55 163.8 163.8 381.7 190.3 -0.75 -0.75 0 0 0 0 0 0
0 0 0.708 0.791 0.791 0.791 5.053 5.053 5.053 0 0 0 0 0 98.61 98.61 199.1 156.9 0 0 403.1 133.8 395.8 89.19 427.9 427.9 54.55 188 188 191.2 398.6 -0.75 -0.75 0 0 0 0 0 0
0 0 0.708 0.791 0.791 0.791 0 0.936 0 0 0 0 0 0 -280 -280 355.9 355.9 0 0 156.4 895.1 395.8 0.08 -53.2 105.3 160.2 53.91 53.91 398.6 0 0 0 0 0 0 0 0 0
0 0 0.708 0.791 0.737 0.737 0.936 0.936 0 0 0 0 18.08 0 -280 0 355.9 355.9 64.27 0 156.4 895.1 456.3 279.9 -53.2 105.3 53.91 398.6 0 0 0 0 0 0 0 0 0
0 2.189 252.1 0.737 0.737 0.737 0.936 0.936 0.747 0 0 189.6 51.4 -11.2 147.6 758.4 758.4 1007 1007 903 0 551.7 551.7 68.29 68.29 398.6 0 0 0 0 0 0 0 0 0
0 2.189 252.1 1.798 1.798 1.393 0.778 0.778 0.747 0 500.7 500.7 486.6 246.1 318.8 318.8 758.4 1007 1007 903 903 371.6 371.6 150.4 150.4 68.29 68.29 68.29 0 0 0 0 0 0 0 0 0 0
0 3.028 3.028 1.798 1.798 1.393 0 0 0 0 500.7 500.7 486.6 246.1 318.8 318.8 782.7 782.7 305.4 368.5 709.5 192.8 364.8 150.4 98.6 -13.5 54.56 54.56 0 0 0 0 0 0 0 0 0 0 0
0 1.329 1.329 3.855 3.855 3.855 0 0 29.14 0 224.4 224.4 316 10.7 10.7 782.7 451.4 193 573.7 96.95 191.2 11.02 11.02 0 0 0 0 0 0 0 0 0 0 0 0 0
0 2.74 2.74 272.4 272.4 3.855 624.8 624.8 624.8 -54.4 224.4 224.4 316 10.7 10.7 70.05 253.2 1033 96.95 89.63 191.2 11.02 11.02 0 0 0 0 0 0 0 0 0 0 0 0 0
0 2.74 2.74 714.9 714.9 3.855 662.9 662.9 662.9 92.89 259.5 -18.8 97.47 99.89 99.89 70.05 9.695 411.1 333 1033 341 341 191.2 11.02 11.02 0 0 0 0 0 0 0 0 0 0 0 0 0
0 424.8 424.8 714.9 714.9 455.1 644.8 644.8 644.8 105.8 259.5 -18.8 173.8 99.89 99.89 0 411.1 377 333 1033 341 341 -17 60.29 60.29 0 0 0 0 0 0 0 0 0 0 0 0 0
0 0 597.4 269.7 455.1 455.1 644.8 644.8 644.8 403.7 207.6 207.6 17.26 17.26 114.5 114.5 58.33 408.3 482.7 0.537 428.4 428.4 511.2 511.2 511.2 44.79 14.78 14.78 0 0 0 1.968 1.968 0 0 0 0 0 0
0 0 0 429.2 690.6 690.6 985.2 985.2 985.2 269.4 130.9 124.5 40.49 6.088 58.33 408.3 482.7 0.409 -0.9 428.4 112.3 112.3 44.79 0 14.78 14.78 0 0 0 1.968 1.968 0 0 0 0 0 0
0 0 0 429.2 690.6 690.6 812.6 812.6 812.6 262.9 130.9 130.9 185.6 60.78 60.78 0 341.6 253.7 0.409 -0.9 208.6 36.28 112.3 0 0 0.214 0.214 0 0 0 243.2 1.968 0 0 0 0 0 0
0 0 0 429.2 697.6 697.6 409.3 409.3 284.3 310.2 508.3 508.3 156.5 185.6 60.78 0 0 27.64 27.64 0.205 -0.9 -0.9 0 0 0 0 0 0 0 0 0 1.968 1.968 0 0 0 0 0 0
0 0 0 429.2 697.6 697.6 409.3 409.3 284.3 508.3 508.3 156.5 185.6 95.68 0 168.3 27.64 27.64 0.205 0 0 0 0 0 0 0 0 0 0 0 1.968 1.968 0 0 0 0 0 0
0 0 0 562.2 562.2 697.6 360.2 283.6 360.4 508.3 384.2 185.6 104.3 388.5 388.5 0 261.5 0.205 0 0 0 311 515.1 515.1 672.4 672.4 818.6 818.6 0 0 1.968 0 0 0 0 0 0
0 0 0 562.2 562.2 468.5 360.2 283.6 360.4 360.4 384.2 558.3 558.3 65.08 217.1 217.1 89.55 89.55 2.331 0.717 0.717 375.5 311 515.1 515.1 672.4 1080 818.6 818.6 818.6 560.2 560.2 0 0 0 0 0 0
0 0 0 562.2 1.901 468.5 468.5 653.4 653.4 360.4 360.4 558.3 65.08 65.08 217.1 145.6 284.8 284.8 2.331 0 0 375.5 375.5 515.1 515.1 1080 1080 670.9 670.9 670.9 654.4 560.2 0 0 0 0 0 0
0 0 0 1.901 1.901 468.5 468.5 468.5 653.4 653.4 289.8 558.3 558.3 52.72 52.72 145.6 145.6 284.8 242.8 4.542 1.017 1.017 406 309.2 531.7 531.7 554.2 1080 670.9 670.9 670.9 654.4 420 0 0 0 0 0 0
0 0 0 1.901 0 468.5 468.5 559.9 559.9 653.4 289.8 149.3 345.6 110.7 52.72 323 323 242.8 242.8 4.542 0.717 0.717 460.1 460.1 306 244 383.2 584.4 694.3 694.3 694.3 654.4 420 0 0 0 0 0 0
0 0 0 0 0 468.5 559.9 559.9 559.9 568.8 568.8 568.8 472.6 472.6 386.1 174.7 470.5 614.7 156.5 129.2 0 0 489.8 489.8 0 19.31 560.5 558.4 742.6 437.7 437.7 267.7 267.7 0 0 0 0 0 0
0 0 0 0.049 0.049 613.6 613.6 613.6 785.1 785.1 568.8 489.9 527.5 478.8 478.8 882.2 323.8 129.2 163.6 163.6 0 0 392.2 393.5 393.5 465.7 560.5 558.4 742.6 437.7 437.7 267.7 2.13 0 0 0 0 0 0
0 0 0 0 0 613.6 613.6 785.1 785.1 785.1 568.8 559.9 653.4 595.7 595.7 882.2 882.2 882.2 163.6 163.6 0 0 392.2 439.7 597.2 597.2 728.1 728.1 742.6 437.7 437.7 2.13 2.13 0 0 0 0 0 0
0 0 0 15.84 15.84 613.6 613.6 682.4 682.4 0 559.9 653.4 595.7 595.7 882.2 882.2 882.2 775.2 266.5 266.5 0 0 907.9 907.9 287.1 287.1 567.2 567.2 0 0 0 2.13 2.13 0 0 0 0 0 0
0 0 0 15.84 15.84 613.6 682.4 682.4 682.4 687.2 687.2 0 0 217.7 912.3 912.3 775.2 775.2 131.1 266.5 0 0 907.9 907.9 287.1 287.1 567.2 567.2 0 0 0 2.13 2.13 0 0 0 0 0 0
0 0 0 3.882 3.882 3.882 371 539 539 450.6 450.6 450.6 450.6 217.7 912.3 912.3 1025 1025 40.43 192 0 0 1102 1102 287.9 287.9 176.6 176.6 1.957 1.957 1.957 2.13 2.13 0 0 0 0 0 0
0 0 0 3.882 3.882 3.882 371 404.3 404.3 443.3 443.3 1.892 0 217.7 912.3 912.3 592.4 543.6 192 192 0 563.5 653.4 653.4 217.7 217.7 217.7 217.7 1.957 1.957 1.957 0 0 0 0 0 0 0 0
0 0 0 3.882 3.882 3.882 0 1.892 1.892 2.725 2.725 1.892 0 0.404 0 0 1.948 543.6 212.8 0 0 287.1 162 162 1.957 1.957 1.188 1.188 9.77 9.77 9.77 1.604 1.604 0 0 0 0 0 0
0 0 0 0 0 0 0 1.892 1.892 2.725 1.892 1.892 0 0.404 2.262 2.262 1.807 1.84 212.8 0 0 287.1 0.496 0.496 0 0 0 0 0 0 0 0.496 0.496 0 0 0 0 0 0
0 0 0 0 0 0 0 0 0 0 0 0 0 0 0 0 0 0 0 0 0 0 0 0 0 0 0 0 0 0 0 0 0 0 0 0 0 0 0
Base Case
High Scenario
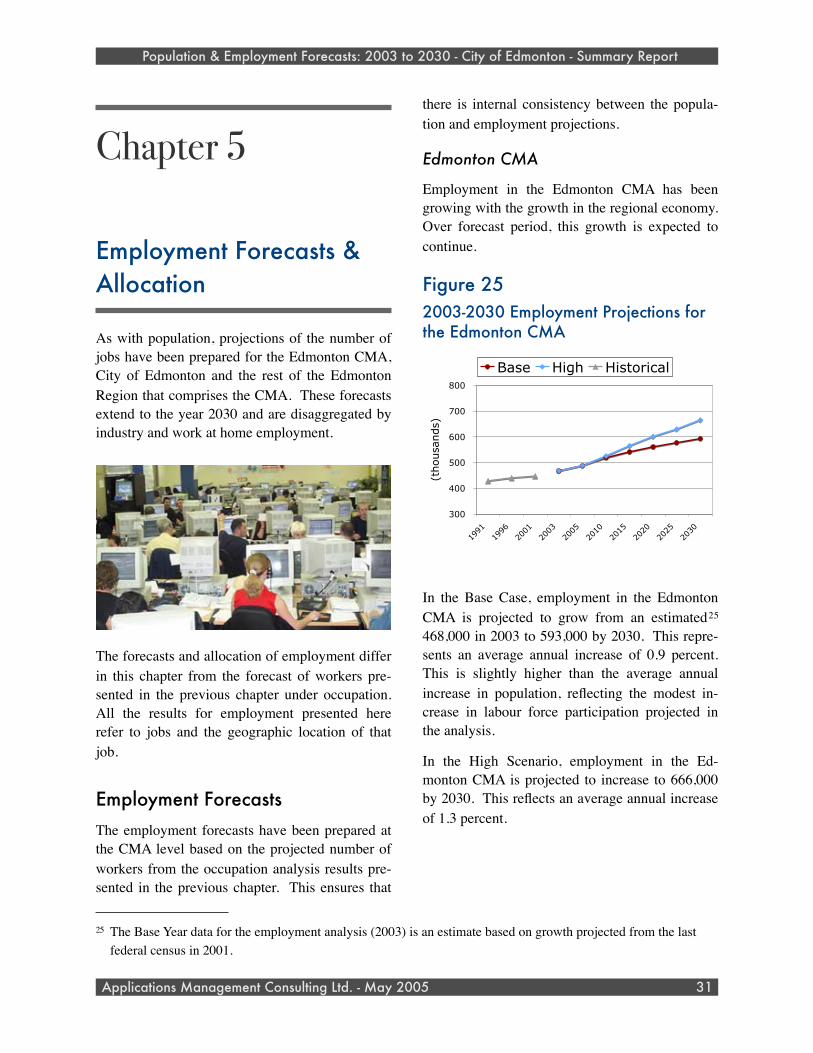
Chapter 5
Employment Forecasts & Allocation
As with population, projections of the number of jobs have been prepared for the Edmonton CMA, City of Edmonton and the rest of the Edmonton Region that comprises the CMA. These forecasts extend to the year 2030 and are disaggregated by industry and work at home employment.
The forecasts and allocation of employment differ in this chapter from the forecast of workers pre-sented in the previous chapter under occupation. All the results for employment presented here refer to jobs and the geographic location of that job.
Employment ForecastsThe employment forecasts have been prepared at the CMA level based on the projected number of workers from the occupation analysis results pre-sented in the previous chapter. This ensures that
there is internal consistency between the popula-tion and employment projections.
Edmonton CMA
Employment in the Edmonton CMA has been growing with the growth in the regional economy. Over forecast period, this growth is expected to continue.
Figure 252003-2030 Employment Projections for the Edmonton CMA
300
400
500
600
700
800
1991
1996
2001
2003
2005
2010
2015
2020
2025
2030
(thousands)
Base High Historical
In the Base Case, employment in the Edmonton CMA is projected to grow from an estimated25 468,000 in 2003 to 593,000 by 2030. This repre-sents an average annual increase of 0.9 percent. This is slightly higher than the average annual increase in population, reflecting the modest in-crease in labour force participation projected in the analysis.
In the High Scenario, employment in the Ed-monton CMA is projected to increase to 666,000 by 2030. This reflects an average annual increase of 1.3 percent.
Population & Employment Forecasts: 2003 to 2030 - City of Edmonton - Summary Report
Applications Management Consulting Ltd. - May 2005 31
25 The Base Year data for the employment analysis (2003) is an estimate based on growth projected from the last federal census in 2001.
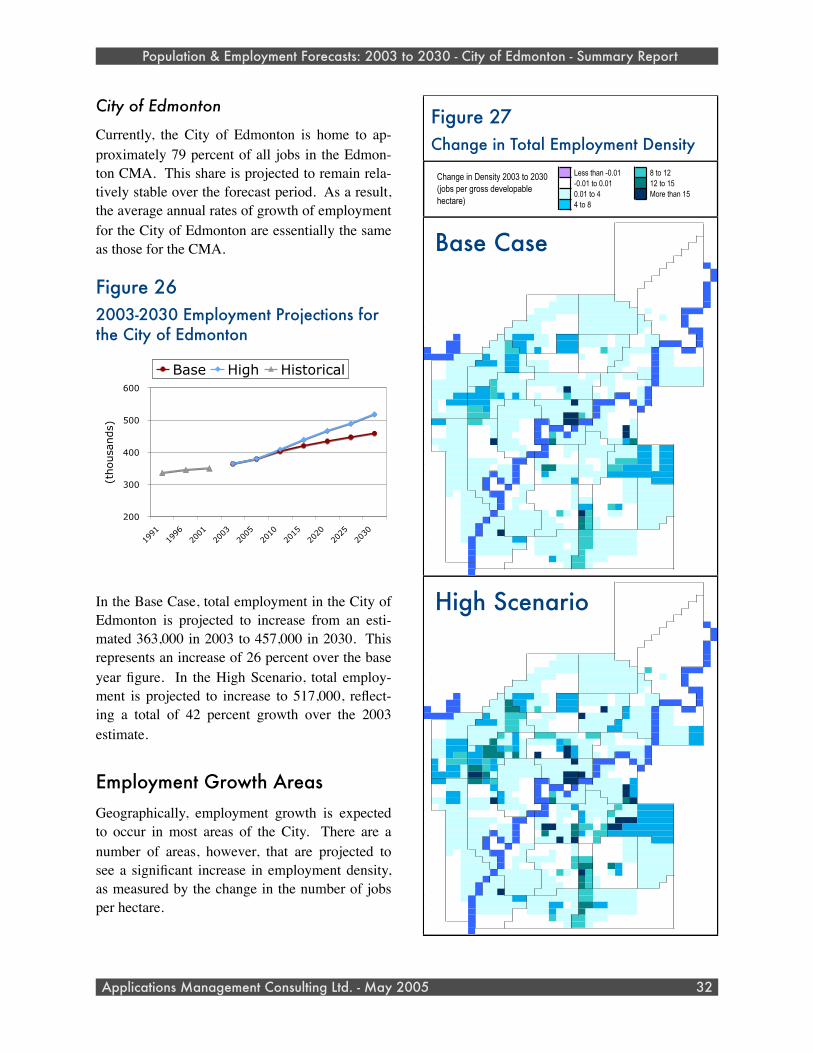
City of Edmonton
Currently, the City of Edmonton is home to ap-proximately 79 percent of all jobs in the Edmon-ton CMA. This share is projected to remain rela-tively stable over the forecast period. As a result, the average annual rates of growth of employment for the City of Edmonton are essentially the same as those for the CMA.
Figure 262003-2030 Employment Projections for the City of Edmonton
200
300
400
500
600
1991
1996
2001
2003
2005
2010
2015
2020
2025
2030
(thousands)
Base High Historical
In the Base Case, total employment in the City of Edmonton is projected to increase from an esti-mated 363,000 in 2003 to 457,000 in 2030. This represents an increase of 26 percent over the base year figure. In the High Scenario, total employ-ment is projected to increase to 517,000, reflect-ing a total of 42 percent growth over the 2003 estimate.
Employment Growth AreasGeographically, employment growth is expected to occur in most areas of the City. There are a number of areas, however, that are projected to see a significant increase in employment density, as measured by the change in the number of jobs per hectare.
Population & Employment Forecasts: 2003 to 2030 - City of Edmonton - Summary Report
Applications Management Consulting Ltd. - May 2005 32
Figure 27Change in Total Employment Density
Less than -0.01 8 to 12 -0.01 to 0.01 12 to 15 0.01 to 4 More than 15 4 to 8
Change in Density 2003 to 2030 (jobs per gross developable hectare)
0 0 0 0 0 0 0 0 0 0 0 0 0 0 0 0 0 0 0 0 0 0 0 0 0 0 0 0 0 0 0 0 0 0 0 0 0 0 0 0
0 0 0 0 0 0 0 0 0 0 0 0 0 0 0 0 0 0 0 0 0 0 0 0 0 0 8E-05 0 0 2E-05 2E-05 0 0 0 0 1E-06 1E-06 1E-06 0 0
0 0 0 0 0 0 0 0 0 0 0 0 0 0 0 0 0 0 0 0 0 0 0 0 0 0 8E-05 0 0 5E-05 5E-05 0 0 4E-05 4E-05 0 0 0 0 0
0 0 0 0 0 0 0 0 0 0 0 0 0 0 0 0 0 0 0 0 0 0 0 0 0 0 0 2E-05 2E-05 0 0 0 0 2E-05 2E-05 0 0 0 0 0
0 0 0 0 0 0 0 0 0 0 0 0 0 0 0 0 0 0 0 0 0 0 0 0 0 0 0 0 0 0 0 1E-05 1E-05 0 0 0 0 0 0 0
0 0 0 0 0 0 0 0 0 0 0 0 0 0 0 0 0 0 0 0 0 0 0 0 0 0 0 3E-04 3E-04 2E-05 2E-05 2E-04 2E-04 0 0 0 0 0 0 0
0 0 0 0 0 0 0 0 0 0 0 0 0 0 0 0 0 0 0 0 0 0 0 0 0 0 0 2E-04 2E-04 4E-05 4E-05 0 0 0 0 1E-05 1E-05 1E-05 0 0
0 0 0 0 0 0 0 0 0 0 0 0 0 0 0 0 0 0 0 0 0 0 0 0 0 0 0 0 0 -0 -0 0 0 0 0 1E-05 1E-05 1E-05 0
0 0 0 0 0 0 0 0 0 0 0 0 0 0 0 0 0 0 0 0 0 0 0 0 0 0 0 2E-06 2E-06 0 0 0 0 0 0 0 0 0 0
0 0 0 0 0 0 0 0 0 0 0 0 0 0 0 0 0 0 0 0 0 0 0 0 0 0 0 2E-06 2E-06 0 0 0 0 0 0 0 0 0 0
0 0 0 0 0 0 0 0 0 0 0 0 0 0 0 0 0 0 0 0 0 0 0 0 0 0 0 0 0 0 0 -0 -0 0.002 1E-16 1E-16 0 0 0
0 0 0 0 0 0 0 0 0 0 0 0 0 0 0 0 0 0 0 0 0 0 0 0 0 0 0 0 0 0 0 -0 -0 0.002 1E-16 0 0 0 0
0 0 0 0 0 0 0 0 0 0 0 0 0 0 0 0 0 0 1.206 1.291 1.291 0.237 1.982 2.04 2.356 0.576 0 0 0 0 0 -0 4E-04 0.002 0 0 0 0 0
0 0 0 0 0 0 0 0 0 0 0 0 0 0 0 0 0 1.971 1.206 1.291 1.291 0.237 1.982 2.04 2.356 0.576 0.576 0.576 0 0 0 4E-04 4E-04 0 0 0 0 0 0
0 0 0 0 0 0 0 0 0 0 0 0 0 0 0 3.023 1.292 1.971 1.206 1.291 1.291 0.237 1.982 2.04 2.356 0.576 0.576 2.147 2.147 0 3.85 0 0 0 0 0 0
0 0 0 0 0 0 0 0 0 0 0 0 0 0 3.023 3.023 1.292 1.971 0 0 0 0.237 1.982 3.43 3.669 0.576 0.576 2.147 2.147 3.226 0 0 0.111 0 0 0 0 0 0
0 0 0 0 0 0 0 0 0 0 0 0 2.327 2.327 1.687 1.565 -0 -0 0 0 0 1.665 0.226 0.786 1.724 1.721 1.977 1.26 1.26 3.226 3.226 5E-18 5E-18 0 0 0 0 0 0
0 0 0 0 0 0 0 0 0 0 0 2.327 2.327 2.327 1.687 1.565 -0 -0 0.001 0.001 0.001 1.665 0.226 0.786 1.724 1.721 1.977 1.26 1.26 3.226 0 5E-18 5E-18 0 0 0 0 0
0 0 0 0 0 0 0 0 0 1.303 2.327 4.654 4.654 5.969 0.411 0.246 0 5.182 5.182 5.182 0.067 0.067 0.072 0.072 0 0.49 1.599 0 -0.03 0.345 0.345 5E-18 0 0 0 0 0 0
0 0 0 0 0 0 0 1.303 1.303 9.829 4.654 4.654 1.753 1.753 0.246 0 4.116 4.116 4.116 0.067 0.067 0.072 0.072 0 0.623 1.599 0 -0.03 0.345 0.345 0 0 0 0
0 0 0 0 0 1.303 1.303 1.303 9.829 9.829 4.654 1.753 4.689 0 0 4.116 4.116 4.116 0 0 0 8.084 0.623 0.623 1.739 0.013 0.012 0.012 0.077 0.077 0 0 0 0
0.518 0.518 0.92 0.92 4.336 1.592 1.592 4.269 4.269 2.905 0 0 0.008 0.008 0 0 0 3.335 0 0 0 0.438 0.438 1.739 -0 -0 0.006 0.077 0.077 0 0 0 0 0 0
0 0 0 0.518 0.518 0.518 0.92 4.336 4.336 4.336 1.592 4.269 4.269 2.668 0.424 0.424 0.062 0 0 0 0 0 0 0 0 0.438 1.46 0.013 -0 -0 0.006 0.077 0.077 0 0 0 0 0 0
0 0 0 0.394 0.394 0.394 0.69 0.69 0.69 0.808 0.808 4.269 4.269 2.668 2.668 0.424 0.062 0 0 0 0 0 0 0 0 1.546 1.546 -0 -0 0.028 0.375 0.077 0.077 1.778 1.778 2.801 2.801 0 0
0 0.001 0.001 0.394 0.394 0.394 0.69 0.69 0.69 0.808 3.758 0.683 1.45 0 0 2.008 2.008 2.008 0.234 0.234 0.537 0 1.936 1.936 0.407 0.407 0 0.03 0.03 0.028 0.375 0.077 0.077 1.778 1.778 2.801 2.801 0 0
0 3.232 3.191 2.901 2.901 2.901 0.69 0.69 0.69 10.36 0.683 0.683 1.45 0.676 0.206 0.206 0.25 0.119 2.149 1.594 0.537 0.058 0.25 0 0.012 0.012 0 1E-15 1E-15 -0 0.016 0.077 0.077 1.778 1.778 2.801 2.801 0 0
0 3.232 3.191 2.901 2.901 2.901 2.108 4.849 6.662 10.36 2.447 2.763 2.296 1.432 0 0 0 0 2.149 39.05 2.731 0.132 0.25 0 0.006 0.035 0 0 0 0.016 0 0 0 0 0 0 0 0 0
0 3.232 3.191 2.901 5.4 5.4 4.849 4.849 6.662 10.36 4.23 1.297 4.087 1.432 0 3.748 0 0 0.003 9.1 2.731 0.132 0.529 0.077 0.006 0.035 0 0.016 0 0 0 0 0 0 0 0 0
0 3.781 0 5.4 5.4 5.4 4.849 4.849 7.54 2.158 1.015 0.153 0.013 0.038 0.046 0.338 0.338 0.415 0.415 0.718 89.02 0.063 0.063 0 0 0.016 0 0 0 0 0 0 0 0 0
0 3.781 0 2.402 2.402 1.84 9.124 9.124 7.54 2.158 0.184 0.184 0.225 0.083 0.018 0.018 0.338 0.415 0.415 0.718 0.718 0.252 0.252 0.153 0.153 0 0 0 0 0 0 0 0 0 0 0 0 0
0 3.82 3.82 2.402 2.402 1.84 11.94 11.94 10.32 0.935 0.184 0.184 0.225 0.083 0.018 0.018 0.564 0.564 2.002 107.8 249 10.84 0.573 0.153 0.005 0 0 0 0 0 0 0 0 0 0 0 0 0 0
0 4.569 4.569 2.912 2.912 2.912 9.706 9.706 2.447 2.283 0.013 0.013 0.044 0 0 0.564 1.234 204.3 87.5 0.077 0.127 0 0 0 2.709 0 0 0 0 0 0 0 0 0 0 0
0 0.004 0.004 1.331 1.331 2.912 0 0 0 2.912 0.013 0.013 0.044 0 0 0 0 0.491 0.077 0.224 0.127 0 0 18.28 2.709 0 0 0 0 0 0 0 0 0 0 0
0 0.004 0.004 1.995 1.995 2.912 0.009 0.009 0.009 0.651 3.85 0.03 1E-15 0 0 0 10.25 1.29 0.775 0.491 0.122 0.122 0.127 0 0 18.28 2.709 0 0 0 0 0 0 0 0 0 0 0
0 1.802 1.802 1.995 1.995 1.607 0 0 0 20.04 3.85 0.03 0.107 0 0 13.6 1.29 1.315 0.775 0.491 0.122 0.122 0 0.134 0.134 4.796 12.75 0 0 0 0 0 0 0 0 0 0 0
0 0 2.92 1.482 1.607 1.607 0 0 0 0.004 0.09 0.09 0.016 0.016 0 0 0 0 0.067 1.381 0.234 0.234 0.27 0.27 0.27 1.549 1.307 1.307 4.302 4.302 2.213 4.657 4.657 0 0 0 0 0 0
0 0 0 2.071 2.064 2.064 0 0 0 -0.02 0 0 0.008 0.085 0 0 0.067 0 1.388 0.234 0.141 0.141 1.549 0.51 1.307 1.307 4.302 4.302 2.213 4.657 4.657 0 0 0 0 0 0
0 0 0 2.071 2.064 2.064 0.056 0.056 0.056 0.099 0 0 0 0.02 0.02 0 0 -0 0 1.388 0.008 0 0.141 0.51 10.43 11.7 11.7 4.302 4.302 2.213 4.432 4.657 0 0 0 0 0 0
0 0 0 1.517 0.719 0.719 0.063 0.063 0.04 0 0.051 0.051 0 0 0.02 12.46 12.46 0.109 0.109 2.764 1.865 1.865 0 1.774 10.43 10.43 5.748 5.748 5.775 5.775 3.853 7.056 7.056 0 0 0 0 0 0
0 0 0 1.517 0.719 0.719 0.063 0.063 0.04 0.051 0.051 0 0 0 7.5 0.616 0.109 0.109 2.764 2.523 2.393 1.774 1.979 4.752 4.752 5.748 5.748 5.775 5.775 5.775 7.056 7.056 0 0 0 0 0 0
0 0 0 0.827 0.827 0.719 0.356 1.183 0 0.051 0 0 -0 0.666 0.666 3.595 0.032 4.35 0 0 1.979 0 -0 -0 0.392 0.392 1.422 1.422 5.775 5.775 7.056 0 0 0 0 0 0
0 0 0 0.827 0.827 0.469 0.356 1.183 0 0 0 0.011 0.011 0.005 0 0 0 0 1.078 0 0 0 0 -0 -0 0.392 0.158 1.422 1.422 1.422 0.844 0.844 0 0 0 0 0 0
0 0 0 0.827 0 0.469 0.469 0.531 0.531 0 0 0.011 0.005 0.005 0 0 0 0 1.078 0 0 0 0 -0 -0 0.158 0.158 1.556 1.556 1.556 1.301 0.844 0 0 0 0 0 0
0 0 0 0 0 0.469 0.469 0.469 0.531 0.531 -0 0.011 0.011 0.003 0.003 0 0 0 0 3.721 2.843 2.843 0 0 0 0 0.011 0.158 1.556 1.556 1.556 1.301 1.669 0 0 0 0 0 0
0 0 0 0 0 0.469 0.469 0.827 0.827 0.531 -0 0.084 0 0 0.003 0.002 0.002 0 0 3.721 7.854 7.854 -0.01 -0.01 9.75 5.861 0 -0 1.387 1.387 1.387 1.301 1.669 0 0 0 0 0 0
0 0 0 0 0 0.469 0.827 0.827 0.827 1.43 1.43 1.43 2.157 2.157 2.018 0.017 -0 9.842 0.071 0 15.16 8.256 -0 -0 0.419 2.721 -0 -0 1.403 1.372 1.372 0.826 0.826 0 0 0 0 0 0
0 0 0 0 0 0.219 0.219 0.219 0.874 0.874 1.43 3.37 3.145 2.008 2.008 0.097 0.069 0 0.001 0.001 13.96 8.256 0.011 -0 -0 0.002 -0 -0 1.403 1.372 1.372 0.826 -0 0 0 0 0 0 0
0 0 0 0 0 0.219 0.219 0.874 0.874 0.874 1.43 0.871 1.443 0.714 0.714 0.097 0.097 0.097 0.001 0.001 13.96 8.256 0.011 0 0 0 0.003 0.003 1.403 1.372 1.372 -0 -0 0 0 0 0 0 0
0 0 0 8E-04 8E-04 0.219 0.219 0.719 0.719 17.25 0.871 1.443 0.714 0.714 0.097 0.097 0.097 2.214 0.851 0.851 8.165 8.165 1.099 1.099 0.698 0.698 0.506 0.506 0 0 0 -0 -0 0 0 0 0 0 0
0 0 0 8E-04 8E-04 0.219 0.719 0.719 0.719 0.827 0.827 5.752 5.752 0 1.098 1.098 2.214 2.214 1.82 0.851 8.165 8.165 1.099 1.099 0.698 0.698 0.506 0.506 0 0 0 -0 -0 0 0 0 0 0 0
0 0 0 6E-04 6E-04 6E-04 0.274 2.162 2.162 1.167 1.167 1.167 1.167 0 1.098 1.098 1.495 1.495 -0.04 0.791 10.21 10.21 3.694 3.694 1.437 1.437 0.689 0.689 2E-05 2E-05 2E-05 -0 -0 0 0 0 0 0 0
0 0 0 6E-04 6E-04 6E-04 0.274 1.634 1.634 1.24 1.24 1E-05 0 0 1.098 1.098 2.938 1.025 0.791 0.791 10.21 3.184 2 2 0.177 0.177 0.18 0.18 2E-05 2E-05 2E-05 0 0 0 0 0 0 0 0
0 0 0 6E-04 6E-04 6E-04 0 7E-06 7E-06 0.002 0.002 1E-05 0 4E-05 0 0 7.33 1.025 0.043 9.087 9.087 1.417 0.666 0.666 2E-05 2E-05 -0 -0 8E-05 8E-05 8E-05 4E-05 4E-05 0 0 0 0 0 0
0 0 0 0 0 0 0 7E-06 7E-06 0.002 1E-05 1E-05 0 4E-05 6E-05 6E-05 2E-04 2E-17 0.043 9.087 9.087 1.417 4E-05 4E-05 0 0 0 0 0 0 0 3E-05 3E-05 0 0 0 0 0 0
0 0 0 0 0 0 0 0 0 0 0 0 0 0 0 0 0 0 0 0 0 0 0 0 0 0 0 0 0 0 0 0 0 0 0 0 0 0 0 0 0 0 0 0 0 0 0 0 0 0 0 0 0 0 0 0 0 0 0 0 0 0 0 0 0 0 0 0 0 0 0 0 0 0 0 0 0 0 0
0 0 0 0 0 0 0 0 0 0 0 0 0 0 0 0 0 0 0 0 0 0 0 0 0 0 1E-04 0 0 5E-05 5E-05 0 0 0 0 1E-06 1E-06 1E-06 0 0
0 0 0 0 0 0 0 0 0 0 0 0 0 0 0 0 0 0 0 0 0 0 0 0 0 0 1E-04 0 0 5E-05 5E-05 0 0 1E-04 1E-04 0 0 0 0 0
0 0 0 0 0 0 0 0 0 0 0 0 0 0 0 0 0 0 0 0 0 0 0 0 0 0 0 2E-05 2E-05 0 0 0 0 2E-05 2E-05 0 0 0 0 0
0 0 0 0 0 0 0 0 0 0 0 0 0 0 0 0 0 0 0 0 0 0 0 0 0 0 0 0 0 0 0 1E-05 1E-05 0 0 0 0 0 0 0
0 0 0 0 0 0 0 0 0 0 0 0 0 0 0 0 0 0 0 0 0 0 0 0 0 0 0 7E-04 7E-04 5E-05 5E-05 4E-04 4E-04 0 0 0 0 0 0 0
0 0 0 0 0 0 0 0 0 0 0 0 0 0 0 0 0 0 0 0 0 0 0 0 0 0 0 7E-04 7E-04 1E-04 1E-04 0 0 0 0 4E-05 4E-05 4E-05 0 0
0 0 0 0 0 0 0 0 0 0 0 0 0 0 0 0 0 0 0 0 0 0 0 0 0 0 0 0 0 -0 -0 0 0 0 0 4E-05 4E-05 4E-05 0
0 0 0 0 0 0 0 0 0 0 0 0 0 0 0 0 0 0 0 0 0 0 0 0 0 0 0 2E-06 2E-06 0 0 0 0 0 0 0 0 0 0
0 0 0 0 0 0 0 0 0 0 0 0 0 0 0 0 0 0 0 0 0 0 0 0 0 0 0 2E-06 2E-06 0 0 0 0 0 0 0 0 0 0
0 0 0 0 0 0 0 0 0 0 0 0 0 0 0 0 0 0 0 0 0 0 0 0 0 0 0 0 0 0 0 -0 -0 0.002 0 0 0 0 0
0 0 0 0 0 0 0 0 0 0 0 0 0 0 0 0 0 0 0 0 0 0 0 0 0 0 0 0 0 0 0 -0 -0 0.002 0 0 0 0 0
0 0 0 0 0 0 0 0 0 0 0 0 0 0 0 0 0 0 2.701 1.907 1.907 0.291 2.315 2.813 3.204 1.094 0 0 0 0 0 -0 6E-04 0.002 0 0 0 0 0
0 0 0 0 0 0 0 0 0 0 0 0 0 0 0 0 0 2.259 2.701 1.907 1.907 0.291 2.315 2.813 3.204 1.094 1.094 1.094 0 0 0 6E-04 6E-04 0 0 0 0 0 0
0 0 0 0 0 0 0 0 0 0 0 0 0 0 0 3.045 3.277 2.259 2.701 1.907 1.907 0.291 2.315 2.813 3.204 1.094 1.094 2.916 2.916 0 11.71 0 0 0 0 0 0
0 0 0 0 0 0 0 0 0 0 0 0 0 0 3.045 3.045 3.277 2.259 0 0 0 0.291 2.315 3.31 3.831 1.094 1.094 2.916 2.916 3.693 0 0 0.17 0 0 0 0 0 0
0 0 0 0 0 0 0 0 0 0 0 0 2.782 2.782 3.514 1.571 -0 -0 0 0 0 2.179 0.434 1.228 1.745 1.782 2.305 3.86 3.86 3.693 3.693 2E-17 2E-17 0 0 0 0 0 0
0 0 0 0 0 0 0 0 0 0 0 2.782 2.782 2.782 3.514 1.571 -0 -0 0.001 0.001 0.001 2.179 0.434 1.228 1.745 1.782 2.305 3.86 3.86 3.693 0 2E-17 2E-17 0 0 0 0 0
0 0 0 0 0 0 0 0 0 1.825 2.782 5.564 5.564 5.954 0.411 1.277 0 5.784 5.784 5.784 0.205 0.205 0.156 0.156 0 0.496 1.78 0 -0.03 0.574 0.574 2E-17 0 0 0 0 0 0
0 0 0 0 0 0 0 1.825 1.825 12.71 5.564 5.564 2.787 2.787 1.277 0 4.862 4.862 4.862 0.205 0.205 0.156 0.156 0 0.642 1.78 0 -0.03 0.574 0.574 0 0 0 0
0 0 0 0 0 1.825 1.825 1.825 12.71 12.71 5.564 2.787 9.734 0 0 4.862 4.862 4.862 0 0 0 15.61 0.642 0.642 4.666 0.085 0.082 0.082 0.291 0.291 0 0 0 0
0.798 0.798 0.901 0.901 5.795 3.701 3.701 8.34 8.34 8.599 0 0 0.022 0.022 0 0 0 17.33 0.066 0.057 0.057 0.496 0.496 4.666 0.036 0.036 0.015 0.291 0.291 0 0 0 0 0 0
0 0 0 0.798 0.798 0.798 0.901 5.795 5.795 5.795 3.701 8.34 8.34 3.511 0.423 0.423 0.062 0 0 0 0 0.066 0.066 0.057 0.057 0.496 7.588 0.084 0.036 0.036 0.015 0.291 0.291 0 0 0 0 0 0
0 0 0 0.877 0.877 0.877 1.412 1.412 1.412 1.347 1.347 8.34 8.34 3.511 3.511 0.423 0.062 0 0 0 0 0.113 0.113 0.064 0.064 5.827 5.827 0.044 0.044 0.055 0.546 0.291 0.291 2.468 2.468 5.001 5.001 0 0
0 0.001 0.001 0.877 0.877 0.877 1.412 1.412 1.412 1.347 11.83 0.683 7.533 0 0 10.43 10.43 10.43 0.452 0.452 0.782 0 10.06 10.06 2.112 2.112 0 0.03 0.03 0.055 0.546 0.291 0.291 2.468 2.468 5.001 5.001 0 0
0 3.705 3.501 4.417 4.417 4.417 1.412 1.412 1.412 14.01 0.683 0.683 7.533 3.512 0.206 0.206 0.252 0.159 5.738 8.284 0.782 0.037 0.355 0 0.012 0.012 0 5E-16 5E-16 -0 0.107 0.291 0.291 2.468 2.468 5.001 5.001 0 0
0 3.705 3.501 4.417 4.417 4.417 3.568 7.537 12.98 14.01 4.725 8.059 4.433 1.41 0 0 0 0 5.738 65.24 7.812 0.26 0.355 0 0.006 0.035 0.042 0.056 0.056 0.107 0 0 0 0 0 0 0 0 0
0 3.705 3.501 4.417 8.277 8.277 7.537 7.537 12.98 14.01 13.61 1.297 13.07 1.41 0 19.47 0 0 0.007 34.04 7.812 0.26 0.683 0.077 0.006 0.035 0.056 0.107 0 0 0 0 0 0 0 0 0
0 4.946 0 8.277 8.277 8.277 7.537 7.537 8.492 4.165 1.015 0.179 0.126 0.04 0.222 0.354 0.354 0.692 0.692 1.386 188.3 0.791 0.791 0 0 0.107 0 0 0 0 0 0 0 0 0
0 4.946 0 4.184 4.184 3.064 12.25 12.25 8.492 4.165 0.164 0.164 0.548 0.089 0.059 0.059 0.354 0.692 0.692 1.386 1.386 1.204 1.204 0.167 0.167 0 0 0 0 0 0 0 0 0 0 0 0 0
0 5.094 5.094 4.184 4.184 3.064 15.64 15.64 14.25 0.935 0.164 0.164 0.548 0.089 0.059 0.059 1.467 1.467 1.941 194.8 500.4 32.64 1.071 0.167 0.005 0 0 0 0 0 0 0 0 0 0 0 0 0 0
0 5.285 5.285 3.32 3.32 3.32 12.58 12.58 7.367 11.86 0.013 0.013 0.044 0 0 1.467 2.03 250.4 181.1 0.077 0.146 0.112 0.112 0 7.856 0 0 0 0 0 0 0 0 0 0 0
0 0.004 0.004 1.43 1.43 3.32 0 0 0 4.191 0.013 0.013 0.044 0 0 0 0 0.722 0.077 0.207 0.146 0.112 0.112 24.84 7.856 0 0 0 0 0 0 0 0 0 0 0
0 0.004 0.004 4.156 4.156 3.32 0.009 0.009 0.009 3.38 7.138 0.081 0 0 0 0 10.25 1.446 1.014 0.722 0.421 0.421 0.146 0.112 0.112 24.84 7.856 0 0 0 0 0 0 0 0 0 0 0
0 1.767 1.767 4.156 4.156 1.642 0.011 0.011 0.011 34.86 7.138 0.081 0.113 0 0 13.6 1.446 1.689 1.014 0.722 0.421 0.421 0.4 0.123 0.123 12.58 18.13 0 0 0 0 0 0 0 0 0 0 0
0 0 3.032 1.355 1.642 1.642 0.011 0.011 0.011 0.004 0.107 0.107 0.174 0.174 0 0 0 0.472 0.221 7.177 0.4 0.4 0.396 0.396 0.396 8.047 2.524 2.524 6.357 6.357 6.238 5.847 5.847 0 0 0 0 0 0
0 0 0 2.271 2.213 2.213 0 0 0 -0.02 0 0 0.008 0.085 0 0.472 0.221 0 7.209 0.4 0.252 0.252 8.047 2.651 2.524 2.524 6.357 6.357 6.238 5.847 5.847 0 0 0 0 0 0
0 0 0 2.271 2.213 2.213 0.093 0.093 0.093 0.099 0 0 0 0.211 0.211 0 0.338 -0 0 7.209 0.025 0 0.252 2.651 16.27 16.63 16.63 6.357 6.357 6.238 4.727 5.847 0 0 0 0 0 0
0 0 0 2.304 2.168 2.168 0.063 0.063 0.04 0 0.054 0.054 0 0 0.211 21.56 21.56 0.178 0.178 14.36 9.691 9.691 0 9.217 16.27 16.27 7.127 7.127 7.209 7.209 5.055 7.385 7.385 0 0 0 0 0 0
0 0 0 2.304 2.168 2.168 0.063 0.063 0.04 0.054 0.054 0 0 0 13.5 0.766 0.178 0.178 14.36 7.596 2.328 9.217 10.28 7.796 7.796 7.127 7.127 7.209 7.209 7.209 7.385 7.385 0 0 0 0 0 0
0 0 0 1.484 1.484 2.168 0.393 2.707 0 0.054 0 0 0.208 1.075 1.075 18.68 0.212 22.6 0 0 10.28 0 -0 -0 0.48 0.48 1.528 1.528 7.209 7.209 7.385 0 0 0 0 0 0
0 0 0 1.484 1.484 0.752 0.393 2.707 0 0 0 0.011 0.011 0.005 0 0 0 0 1.078 0 0 0 0 -0 -0 0.48 0.172 1.528 1.528 1.528 1.516 1.516 0 0 0 0 0 0
0 0 0 1.484 4E-18 0.752 0.752 1.101 1.101 0 0 0.011 0.005 0.005 0 0.071 0 0 1.078 0 0 0 0 -0 -0 0.172 0.172 1.734 1.734 1.734 1.949 1.516 0 0 0 0 0 0
0 0 0 4E-18 4E-18 0.752 0.752 0.752 1.101 1.101 -0 0.011 0.011 0.05 0.05 0.071 0.071 0 0 11.69 8.364 8.364 0 0 0 0 0.011 0.172 1.734 1.734 1.734 1.949 1.635 0 0 0 0 0 0
0 0 0 4E-18 0 0.752 0.752 1.484 1.484 1.101 -0 0.084 0 0 0.05 0.002 0.002 0 0 11.69 13.63 13.63 -0.01 -0.01 13.5 5.861 0 -0 2.338 2.338 2.338 1.949 1.635 0 0 0 0 0 0
0 0 0 0 0 0.752 1.484 1.484 1.484 1.414 1.414 1.414 2.626 2.626 3.224 0.017 -0 11.15 0.084 0 21.32 10.62 -0 -0 2.179 5.253 -0 -0 2.351 1.436 1.436 0.888 0.888 0 0 0 0 0 0
0 0 0 0 0 0.701 0.701 0.701 1.47 1.47 1.414 3.413 3.734 1.998 1.998 0.127 0.069 0 0.001 0.001 13.96 10.62 0.011 -0 -0 0.002 -0 -0 2.351 1.436 1.436 0.888 -0 0 0 0 0 0 0
0 0 0 0 0 0.701 0.701 1.47 1.47 1.47 1.414 2.715 2.992 1.371 1.371 0.127 0.127 0.127 0.001 0.001 13.96 10.62 0.011 0 0 0 0.003 0.003 2.351 1.436 1.436 -0 -0 0 0 0 0 0 0
0 0 0 8E-04 8E-04 0.701 0.701 1.134 1.134 21.41 2.715 2.992 1.371 1.371 0.127 0.127 0.127 2.985 0.859 0.859 11 11 2.32 2.32 1.094 1.094 1.582 1.582 0 0 0 -0 -0 0 0 0 0 0 0
0 0 0 8E-04 8E-04 0.701 1.134 1.134 1.134 2.022 2.022 7.14 7.14 0.839 1.34 1.34 2.985 2.985 1.848 0.859 11 11 2.32 2.32 1.094 1.094 1.582 1.582 0 0 0 -0 -0 0 0 0 0 0 0
0 0 0 6E-04 6E-04 6E-04 1.103 2.136 2.136 1.259 1.259 1.259 1.259 0.839 1.34 1.34 4.469 4.469 -0.04 1.119 13.75 13.75 4.87 4.87 1.548 1.548 0.711 0.711 2E-05 2E-05 2E-05 -0 -0 0 0 0 0 0 0
0 0 0 6E-04 6E-04 6E-04 1.103 1.624 1.624 1.78 1.78 1E-05 0 0.839 1.34 1.34 4.074 2.996 1.119 1.119 13.75 3.556 2.992 2.992 0.8 0.8 0.813 0.813 2E-05 2E-05 2E-05 0 0 0 0 0 0 0 0
0 0 0 6E-04 6E-04 6E-04 0 7E-06 7E-06 0.002 0.002 1E-05 0 4E-05 0 0 8.515 2.996 0.222 10.51 10.51 1.526 0.686 0.686 2E-05 2E-05 -0 -0 8E-05 8E-05 8E-05 4E-05 4E-05 0 0 0 0 0 0
0 0 0 0 0 0 0 7E-06 7E-06 0.002 1E-05 1E-05 0 4E-05 6E-05 6E-05 2E-04 2E-17 0.222 10.51 10.51 1.526 4E-05 4E-05 0 0 0 0 0 0 0 3E-05 3E-05 0 0 0 0 0 0
0 0 0 0 0 0 0 0 0 0 0 0 0 0 0 0 0 0 0 0 0 0 0 0 0 0 0 0 0 0 0 0 0 0 0 0 0 0 0
Base Case
High Scenario
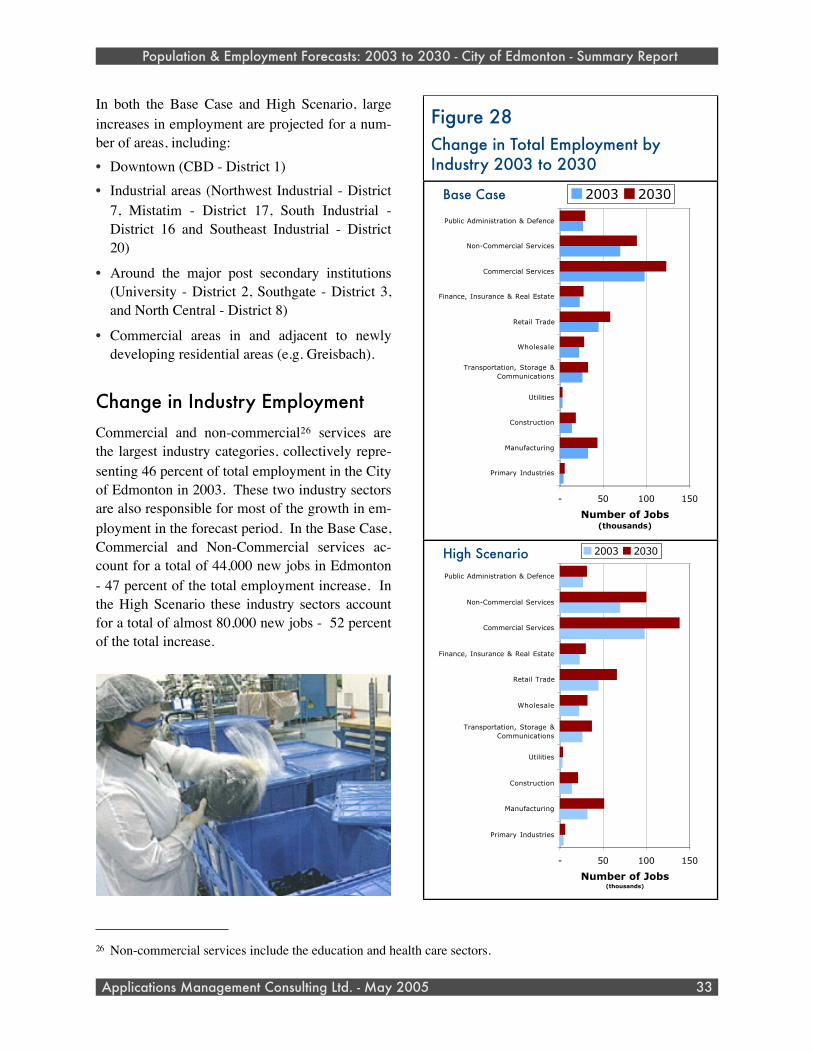
In both the Base Case and High Scenario, large increases in employment are projected for a num-ber of areas, including: • Downtown (CBD - District 1)• Industrial areas (Northwest Industrial - District
7, Mistatim - District 17, South Industrial - District 16 and Southeast Industrial - District 20)
• Around the major post secondary institutions (University - District 2, Southgate - District 3, and North Central - District 8)
• Commercial areas in and adjacent to newly developing residential areas (e.g. Greisbach).
Change in Industry EmploymentCommercial and non-commercial26 services are the largest industry categories, collectively repre-senting 46 percent of total employment in the City of Edmonton in 2003. These two industry sectors are also responsible for most of the growth in em-ployment in the forecast period. In the Base Case, Commercial and Non-Commercial services ac-count for a total of 44,000 new jobs in Edmonton - 47 percent of the total employment increase. In the High Scenario these industry sectors account for a total of almost 80,000 new jobs - 52 percent of the total increase.
Population & Employment Forecasts: 2003 to 2030 - City of Edmonton - Summary Report
Applications Management Consulting Ltd. - May 2005 33
26 Non-commercial services include the education and health care sectors.
Figure 28Change in Total Employment by Industry 2003 to 2030
- 50 100 150
Primary Industries
Manufacturing
Construction
Utilities
Transportation, Storage &Communications
Wholesale
Retail Trade
Finance, Insurance & Real Estate
Commercial Services
Non-Commercial Services
Public Administration & Defence
Number of Jobs(thousands)
2003 2030
- 50 100 150
Primary Industries
Manufacturing
Construction
Utilities
Transportation, Storage &Communications
Wholesale
Retail Trade
Finance, Insurance & Real Estate
Commercial Services
Non-Commercial Services
Public Administration & Defence
Number of Jobs(thousands)
2003 2030High Scenario
Base Case
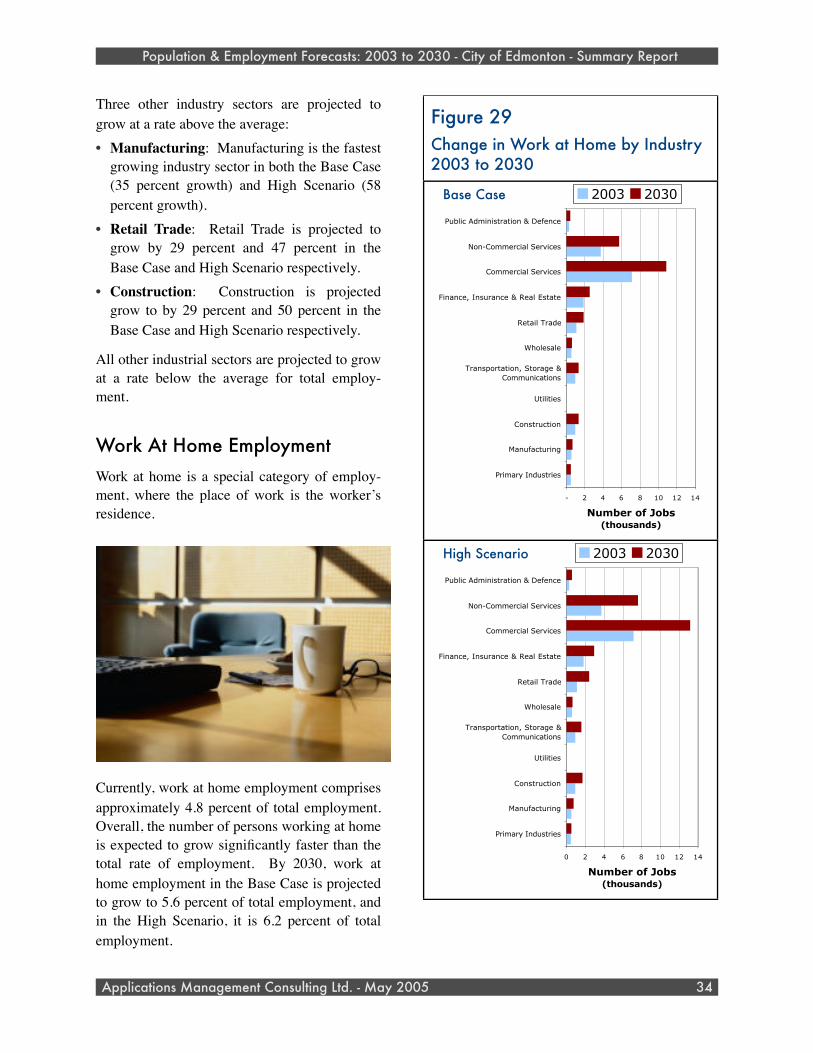
Three other industry sectors are projected to grow at a rate above the average:• Manufacturing: Manufacturing is the fastest
growing industry sector in both the Base Case (35 percent growth) and High Scenario (58 percent growth).
• Retail Trade: Retail Trade is projected to grow by 29 percent and 47 percent in the Base Case and High Scenario respectively.
• Construction: Construction is projected grow to by 29 percent and 50 percent in the Base Case and High Scenario respectively.
All other industrial sectors are projected to grow at a rate below the average for total employ-ment.
Work At Home EmploymentWork at home is a special category of employ-ment, where the place of work is the worker’s residence.
Currently, work at home employment comprises approximately 4.8 percent of total employment. Overall, the number of persons working at home is expected to grow significantly faster than the total rate of employment. By 2030, work at home employment in the Base Case is projected to grow to 5.6 percent of total employment, and in the High Scenario, it is 6.2 percent of total employment.
Population & Employment Forecasts: 2003 to 2030 - City of Edmonton - Summary Report
Applications Management Consulting Ltd. - May 2005 34
Figure 29Change in Work at Home by Industry 2003 to 2030
- 2 4 6 8 10 12 14
Primary Industries
Manufacturing
Construction
Utilities
Transportation, Storage &Communications
Wholesale
Retail Trade
Finance, Insurance & Real Estate
Commercial Services
Non-Commercial Services
Public Administration & Defence
Number of Jobs(thousands)
2003 2030
0 2 4 6 8 10 12 14
Primary Industries
Manufacturing
Construction
Utilities
Transportation, Storage &Communications
Wholesale
Retail Trade
Finance, Insurance & Real Estate
Commercial Services
Non-Commercial Services
Public Administration & Defence
Number of Jobs(thousands)
2003 2030High Scenario
Base Case
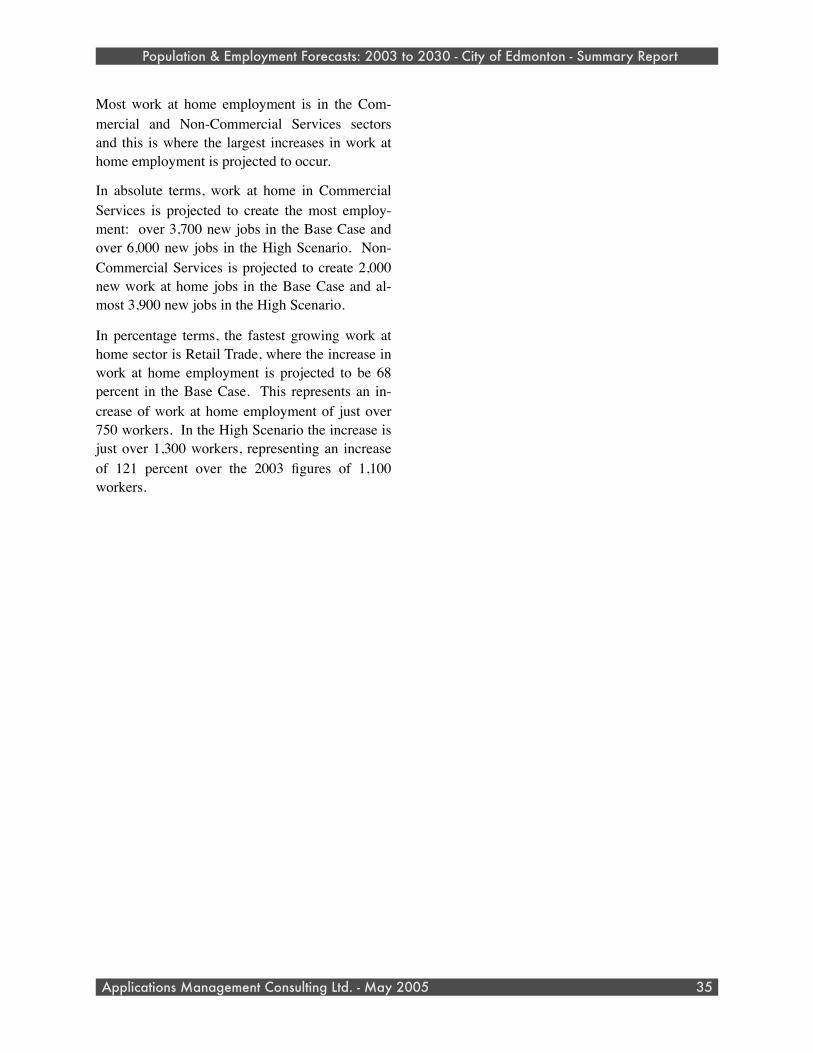
Most work at home employment is in the Com-mercial and Non-Commercial Services sectors and this is where the largest increases in work at home employment is projected to occur.
In absolute terms, work at home in Commercial Services is projected to create the most employ-ment: over 3,700 new jobs in the Base Case and over 6,000 new jobs in the High Scenario. Non-Commercial Services is projected to create 2,000 new work at home jobs in the Base Case and al-most 3,900 new jobs in the High Scenario.
In percentage terms, the fastest growing work at home sector is Retail Trade, where the increase in work at home employment is projected to be 68 percent in the Base Case. This represents an in-crease of work at home employment of just over 750 workers. In the High Scenario the increase is just over 1,300 workers, representing an increase of 121 percent over the 2003 figures of 1,100 workers.
Population & Employment Forecasts: 2003 to 2030 - City of Edmonton - Summary Report
Applications Management Consulting Ltd. - May 2005 35
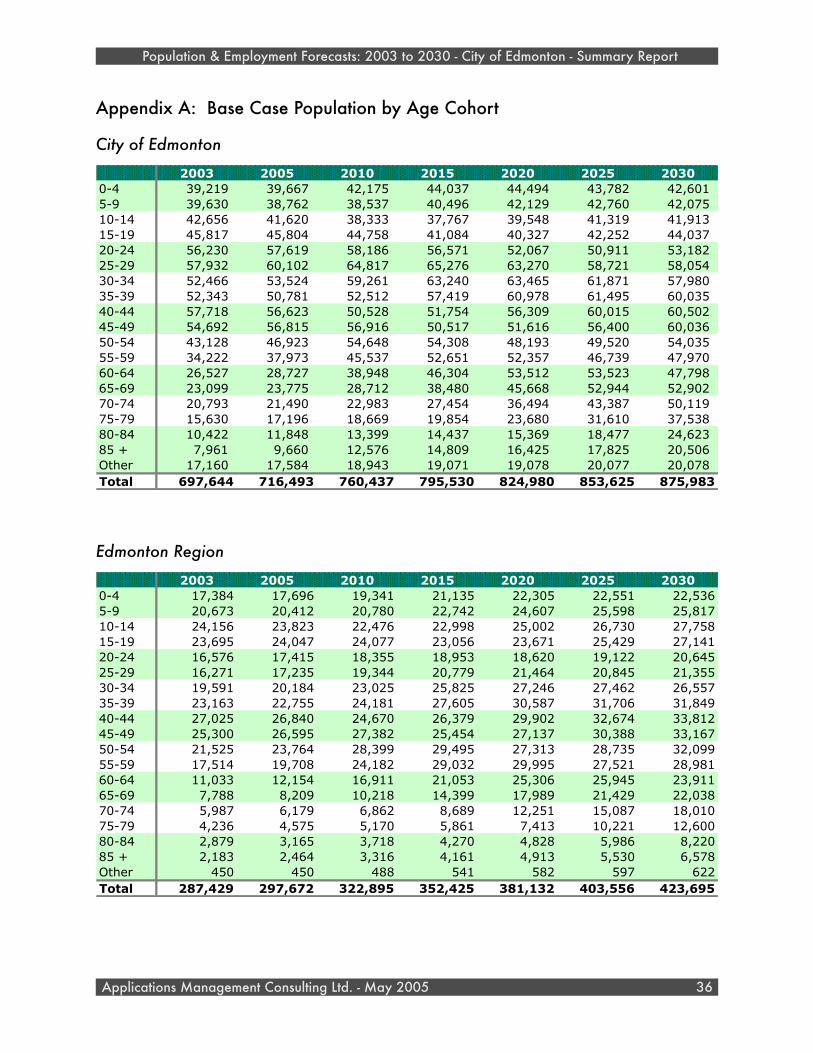
Appendix A: Base Case Population by Age Cohort
City of Edmonton
2003 2005 2010 2015 2020 2025 20300-4 39,219 39,667 42,175 44,037 44,494 43,782 42,601 5-9 39,630 38,762 38,537 40,496 42,129 42,760 42,075 10-14 42,656 41,620 38,333 37,767 39,548 41,319 41,913 15-19 45,817 45,804 44,758 41,084 40,327 42,252 44,037 20-24 56,230 57,619 58,186 56,571 52,067 50,911 53,182 25-29 57,932 60,102 64,817 65,276 63,270 58,721 58,054 30-34 52,466 53,524 59,261 63,240 63,465 61,871 57,980 35-39 52,343 50,781 52,512 57,419 60,978 61,495 60,035 40-44 57,718 56,623 50,528 51,754 56,309 60,015 60,502 45-49 54,692 56,815 56,916 50,517 51,616 56,400 60,036 50-54 43,128 46,923 54,648 54,308 48,193 49,520 54,035 55-59 34,222 37,973 45,537 52,651 52,357 46,739 47,970 60-64 26,527 28,727 38,948 46,304 53,512 53,523 47,798 65-69 23,099 23,775 28,712 38,480 45,668 52,944 52,902 70-74 20,793 21,490 22,983 27,454 36,494 43,387 50,119 75-79 15,630 17,196 18,669 19,854 23,680 31,610 37,538 80-84 10,422 11,848 13,399 14,437 15,369 18,477 24,623 85 + 7,961 9,660 12,576 14,809 16,425 17,825 20,506 Other 17,160 17,584 18,943 19,071 19,078 20,077 20,078 Total 697,644 716,493 760,437 795,530 824,980 853,625 875,983
Edmonton Region
2003 2005 2010 2015 2020 2025 20300-4 17,384 17,696 19,341 21,135 22,305 22,551 22,5365-9 20,673 20,412 20,780 22,742 24,607 25,598 25,81710-14 24,156 23,823 22,476 22,998 25,002 26,730 27,75815-19 23,695 24,047 24,077 23,056 23,671 25,429 27,14120-24 16,576 17,415 18,355 18,953 18,620 19,122 20,64525-29 16,271 17,235 19,344 20,779 21,464 20,845 21,35530-34 19,591 20,184 23,025 25,825 27,246 27,462 26,55735-39 23,163 22,755 24,181 27,605 30,587 31,706 31,84940-44 27,025 26,840 24,670 26,379 29,902 32,674 33,81245-49 25,300 26,595 27,382 25,454 27,137 30,388 33,16750-54 21,525 23,764 28,399 29,495 27,313 28,735 32,09955-59 17,514 19,708 24,182 29,032 29,995 27,521 28,98160-64 11,033 12,154 16,911 21,053 25,306 25,945 23,91165-69 7,788 8,209 10,218 14,399 17,989 21,429 22,03870-74 5,987 6,179 6,862 8,689 12,251 15,087 18,01075-79 4,236 4,575 5,170 5,861 7,413 10,221 12,60080-84 2,879 3,165 3,718 4,270 4,828 5,986 8,22085 + 2,183 2,464 3,316 4,161 4,913 5,530 6,578Other 450 450 488 541 582 597 622Total 287,429 297,672 322,895 352,425 381,132 403,556 423,695
Population & Employment Forecasts: 2003 to 2030 - City of Edmonton - Summary Report
Applications Management Consulting Ltd. - May 2005 36
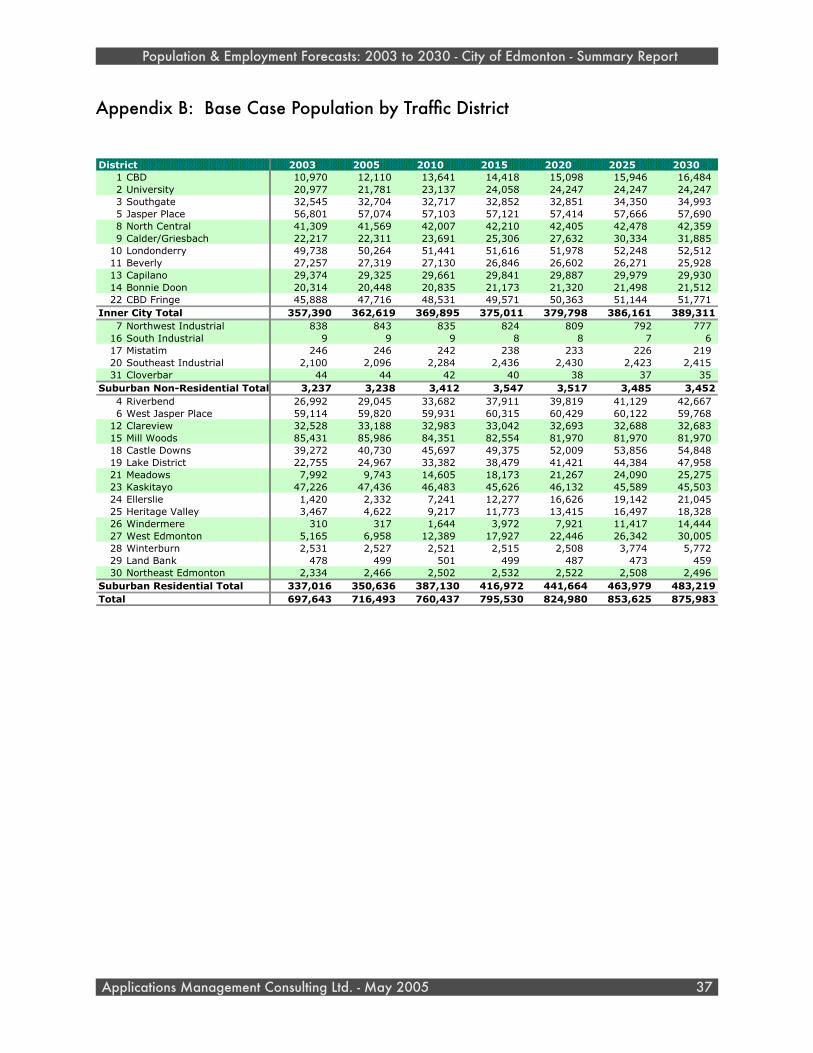
Appendix B: Base Case Population by Traffic District
District 2003 2005 2010 2015 2020 2025 20301 CBD 10,970 12,110 13,641 14,418 15,098 15,946 16,484 2 University 20,977 21,781 23,137 24,058 24,247 24,247 24,247 3 Southgate 32,545 32,704 32,717 32,852 32,851 34,350 34,993 5 Jasper Place 56,801 57,074 57,103 57,121 57,414 57,666 57,690 8 North Central 41,309 41,569 42,007 42,210 42,405 42,478 42,359 9 Calder/Griesbach 22,217 22,311 23,691 25,306 27,632 30,334 31,885
10 Londonderry 49,738 50,264 51,441 51,616 51,978 52,248 52,512 11 Beverly 27,257 27,319 27,130 26,846 26,602 26,271 25,928 13 Capilano 29,374 29,325 29,661 29,841 29,887 29,979 29,930 14 Bonnie Doon 20,314 20,448 20,835 21,173 21,320 21,498 21,512 22 CBD Fringe 45,888 47,716 48,531 49,571 50,363 51,144 51,771
Inner City Total 357,390 362,619 369,895 375,011 379,798 386,161 389,3117 Northwest Industrial 838 843 835 824 809 792 777
16 South Industrial 9 9 9 8 8 7 6 17 Mistatim 246 246 242 238 233 226 219 20 Southeast Industrial 2,100 2,096 2,284 2,436 2,430 2,423 2,415 31 Cloverbar 44 44 42 40 38 37 35
Suburban Non-Residential Total 3,237 3,238 3,412 3,547 3,517 3,485 3,4524 Riverbend 26,992 29,045 33,682 37,911 39,819 41,129 42,667 6 West Jasper Place 59,114 59,820 59,931 60,315 60,429 60,122 59,768
12 Clareview 32,528 33,188 32,983 33,042 32,693 32,688 32,683 15 Mill Woods 85,431 85,986 84,351 82,554 81,970 81,970 81,970 18 Castle Downs 39,272 40,730 45,697 49,375 52,009 53,856 54,848 19 Lake District 22,755 24,967 33,382 38,479 41,421 44,384 47,958 21 Meadows 7,992 9,743 14,605 18,173 21,267 24,090 25,275 23 Kaskitayo 47,226 47,436 46,483 45,626 46,132 45,589 45,503 24 Ellerslie 1,420 2,332 7,241 12,277 16,626 19,142 21,045 25 Heritage Valley 3,467 4,622 9,217 11,773 13,415 16,497 18,328 26 Windermere 310 317 1,644 3,972 7,921 11,417 14,444 27 West Edmonton 5,165 6,958 12,389 17,927 22,446 26,342 30,005 28 Winterburn 2,531 2,527 2,521 2,515 2,508 3,774 5,772 29 Land Bank 478 499 501 499 487 473 459 30 Northeast Edmonton 2,334 2,466 2,502 2,532 2,522 2,508 2,496
Suburban Residential Total 337,016 350,636 387,130 416,972 441,664 463,979 483,219Total 697,643 716,493 760,437 795,530 824,980 853,625 875,983
Population & Employment Forecasts: 2003 to 2030 - City of Edmonton - Summary Report
Applications Management Consulting Ltd. - May 2005 37
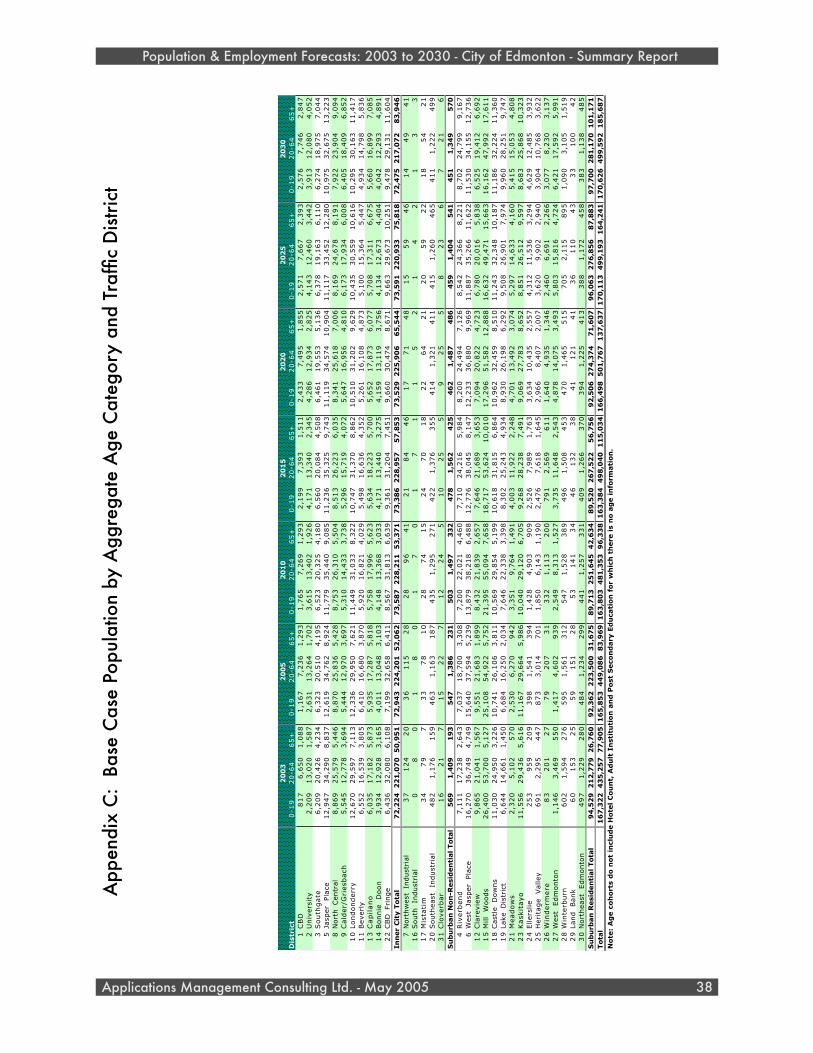
20
03
20
05
20
10
20
15
20
20
20
25
20
30
Dis
tric
t0
-19
20
-64
65+
0-1
92
0-6
465+
0-1
92
0-6
465+
0-1
92
0-6
465+
0-1
92
0-6
465+
0-1
92
0-6
465+
0-1
92
0-6
465+
1C
BD
81
76
,65
01
,08
81
,16
77
,23
61
,29
31
,76
57
,26
91
,29
32
,19
97
,39
31
,51
12
,43
37
,49
51
,85
52
,57
17
,66
72
,39
32
,57
67
,74
62
,84
72
Univ
ers
ity
2,2
09
13
,02
01
,58
72
,63
11
3,2
64
1,7
02
3,6
15
13
,40
21
,92
64
,17
11
3,3
40
2,3
45
4,2
86
12
,93
42
,82
54
,14
31
2,4
60
3,4
42
3,9
13
12
,08
04
,05
23
South
gate
6,2
09
20
,42
64
,23
46
,32
32
0,5
10
4,1
95
6,5
23
20
,32
54
,18
06
,56
02
0,0
84
4,5
08
6,4
61
19
,55
35
,13
66
,37
81
9,1
63
6,1
10
6,2
74
18
,97
57
,04
45
Jasp
er
Pla
ce1
2,9
47
34
,29
08
,83
71
2,6
19
34
,76
28
,92
41
1,7
79
35
,44
09
,08
51
1,2
36
35
,32
59
,74
31
1,1
19
34
,57
41
0,9
04
11
,11
73
3,4
52
12
,28
01
0,9
75
32
,67
51
3,2
23
8N
ort
h C
entr
al
8,8
69
25
,57
95
,44
68
,87
02
5,8
36
5,4
28
8,7
53
26
,31
05
,50
48
,51
32
6,2
23
6,0
35
8,3
41
25
,61
87
,00
68
,16
92
4,6
78
8,1
91
7,9
22
23
,90
49
,09
49
Cald
er/
Gri
esb
ach
5,5
45
12
,77
83
,69
45
,44
41
2,9
70
3,6
97
5,3
10
14
,43
33
,73
85
,29
61
5,7
19
4,0
72
5,6
47
16
,95
64
,81
06
,17
31
7,9
34
6,0
08
6,4
05
18
,40
96
,85
21
0Londonderr
y1
2,6
70
29
,59
77
,11
31
2,3
36
29
,95
07
,62
11
1,4
49
31
,03
38
,32
21
0,7
47
31
,37
08
,86
21
0,5
10
31
,20
29
,62
91
0,4
35
30
,55
91
0,6
16
10
,29
53
0,1
63
11
,41
71
1B
everl
y6
,55
21
6,5
39
3,8
05
6,4
10
16
,68
03
,87
05
,92
01
6,8
21
4,0
29
5,4
98
16
,63
64
,35
25
,26
11
6,1
08
4,8
73
5,1
00
15
,36
45
,44
74
,93
41
4,7
98
5,8
36
13
Cap
ilan
o6
,03
51
7,1
82
5,8
73
5,9
35
17
,28
75
,81
85
,75
81
7,9
96
5,6
23
5,6
34
18
,22
35
,70
05
,65
21
7,8
73
6,0
77
5,7
08
17
,31
16
,67
55
,66
01
6,8
99
7,0
85
14
Bonnie
D
oon
3,9
34
12
,92
83
,16
54
,01
11
3,0
48
3,1
03
4,1
48
13
,36
83
,03
34
,17
11
3,4
40
3,2
75
4,1
59
13
,11
93
,75
64
,13
41
2,6
73
4,4
04
4,0
42
12
,29
34
,89
12
2C
BD
Fr
inge
6,4
36
32
,08
06
,10
87
,19
93
2,6
58
6,4
11
8,5
67
31
,81
36
,63
99
,36
13
1,2
04
7,4
51
9,6
60
30
,47
48
,67
19
,66
32
9,6
73
10
,25
19
,47
82
9,1
31
11
,60
4In
ner
Cit
y T
ota
l7
2,2
24
22
1,0
70
50
,95
17
2,9
43
22
4,2
01
52
,06
27
3,5
87
22
8,2
11
53
,37
17
3,3
86
22
8,9
57
57
,85
37
3,5
29
22
5,9
06
65
,54
47
3,5
91
22
0,9
33
75
,81
87
2,4
75
21
7,0
72
83
,94
67
Nort
hw
est
In
dust
rial
37
12
42
03
61
15
28
28
96
41
21
84
46
17
71
48
15
59
46
14
49
41
16
South
In
dust
rial
08
01
80
17
01
71
15
21
42
13
31
7M
ista
tim
34
79
73
37
81
02
87
41
52
47
01
82
26
42
12
05
92
21
85
42
12
0S
outh
east
In
dust
rial
48
21
,17
61
59
46
31
,16
31
87
43
51
,29
52
71
42
21
,37
63
55
41
41
,32
14
11
41
51
,26
04
65
41
11
,22
24
99
31
Clo
verb
ar
16
21
71
52
27
12
24
51
02
55
92
55
82
36
72
16
Su
bu
rban
Non
-Resi
den
tial Tota
l5
69
1,4
09
19
35
47
1,3
86
23
15
03
1,4
97
33
24
78
1,5
62
42
54
62
1,4
87
48
64
59
1,4
04
54
14
51
1,3
49
57
04
Riv
erb
end
7,1
11
17
,23
82
,64
37
,03
71
8,7
00
3,3
08
7,2
00
22
,02
14
,46
07
,71
02
4,2
16
5,9
84
8,2
00
24
,49
47
,12
68
,54
22
4,3
66
8,2
21
8,7
02
24
,79
99
,16
76
West
Ja
sper
Pla
ce1
6,2
70
36
,74
94
,74
91
5,6
40
37
,59
45
,23
91
3,8
79
38
,21
86
,48
81
2,7
76
38
,04
58
,14
71
2,2
33
36
,88
09
,96
91
1,8
87
35
,26
61
1,6
22
11
,53
03
4,1
55
12
,73
61
2C
lare
vie
w9
,86
52
1,0
41
1,5
67
9,5
51
21
,68
31
,89
98
,43
22
1,8
39
2,6
57
7,6
46
21
,68
93
,65
37
,09
42
0,8
22
4,7
23
6,7
80
20
,01
65
,83
86
,52
51
9,4
12
6,6
92
15
Mill
Woods
26
,40
05
3,7
00
5,1
27
25
,10
85
4,9
22
5,7
52
21
,39
55
5,0
94
7,6
58
18
,71
75
3,6
24
10
,01
01
7,2
96
51
,58
21
2,8
88
16
,63
24
9,4
71
15
,66
31
6,1
62
47
,99
21
7,6
11
18
Cast
le D
ow
ns
11
,03
02
4,9
50
3,2
26
10
,74
12
6,1
06
3,8
11
10
,56
92
9,8
54
5,1
99
10
,61
83
1,8
15
6,8
64
10
,96
23
2,4
59
8,5
10
11
,24
33
2,3
48
10
,18
71
1,1
86
32
,22
41
1,3
60
19
Lake D
istr
ict
6,6
44
14
,66
11
,45
06
,68
41
6,2
50
2,0
34
7,6
46
22
,33
83
,39
88
,30
22
5,2
43
4,9
34
8,9
30
26
,19
86
,29
29
,50
82
6,9
01
7,9
74
9,9
60
28
,25
19
,74
72
1M
eadow
s2
,32
05
,10
25
70
2,5
30
6,2
70
94
23
,35
19
,76
41
,49
14
,00
31
1,9
22
2,2
48
4,7
01
13
,49
23
,07
45
,29
71
4,6
33
4,1
60
5,4
15
15
,05
34
,80
82
3K
ask
itayo
11
,55
62
9,4
36
5,6
16
11
,16
72
9,6
64
5,9
86
10
,04
02
9,1
20
6,7
05
9,2
68
28
,23
87
,49
19
,06
92
7,7
83
8,6
52
8,8
51
26
,51
29
,59
78
,68
32
5,8
68
10
,32
32
4Ellers
lie
25
39
59
20
93
98
1,5
41
39
41
,42
84
,90
39
09
2,5
26
7,9
89
1,7
63
3,6
34
10
,43
52
,55
74
,31
21
1,5
36
3,2
94
4,6
29
12
,48
53
,93
22
5H
eri
tage V
alley
69
12
,29
54
47
87
33
,01
47
01
1,8
50
6,1
43
1,1
90
2,4
76
7,6
18
1,6
45
2,9
66
8,4
07
2,0
07
3,6
20
9,9
02
2,9
40
3,9
04
10
,76
83
,62
22
6W
inderm
ere
83
20
12
77
92
07
31
33
21
,11
32
00
79
12
,56
96
11
1,6
40
4,9
35
1,3
46
2,4
60
6,6
91
2,2
66
3,0
77
8,2
30
3,1
37
27
West
Edm
onto
n1
,14
63
,46
95
50
1,4
17
4,6
02
93
92
,54
98
,31
31
,52
73
,73
51
1,6
48
2,5
43
4,8
78
14
,07
53
,49
35
,80
31
5,8
16
4,7
24
6,4
21
17
,59
25
,99
12
8W
inte
rburn
60
21
,59
42
76
59
51
,56
13
12
54
71
,52
83
89
49
61
,50
84
53
47
01
,46
55
15
70
52
,11
58
95
1,0
90
3,1
05
1,5
19
29
Land
Bank
60
15
32
55
91
51
28
53
14
13
44
61
32
38
41
12
14
13
61
10
43
33
10
04
23
0N
ort
heast
Edm
onto
n4
97
1,2
29
28
04
84
1,2
34
29
94
41
1,2
57
33
14
09
1,2
66
37
03
94
1,2
25
41
33
88
1,1
72
45
83
83
1,1
38
48
5S
ub
urb
an
Resi
den
tial Tota
l9
4,5
29
21
2,7
79
26
,76
09
2,3
62
22
3,5
00
31
,67
58
9,7
13
25
1,6
45
42
,63
48
9,5
20
26
7,5
22
56
,75
69
2,5
06
27
4,3
74
71
,60
79
6,0
63
27
6,8
56
87
,88
39
7,7
00
28
1,1
70
10
1,1
71
Tota
l1
67
,32
24
35
,25
77
7,9
05
16
5,8
53
44
9,0
86
83
,96
91
63
,80
34
81
,35
39
6,3
38
16
3,3
84
49
8,0
40
11
5,0
34
16
6,4
98
50
1,7
67
13
7,6
37
17
0,1
13
49
9,1
93
16
4,2
41
17
0,6
26
49
9,5
92
18
5,6
87
No
te:
Ag
e c
oh
ort
s d
o n
ot
incl
ud
e H
ote
l C
ou
nt,
Ad
ult
In
stit
uti
on
an
d P
ost
Seco
nd
ary
Ed
uca
tio
n f
or
wh
ich
th
ere
is
no
ag
e i
nfo
rmati
on
.
Population & Employment Forecasts: 2003 to 2030 - City of Edmonton - Summary Report
Applications Management Consulting Ltd. - May 2005 38
App
endi
x C
: Ba
se C
ase
Popu
latio
n by
Agg
rega
te A
ge C
ateg
ory
and
Traf
fic D
istric
t
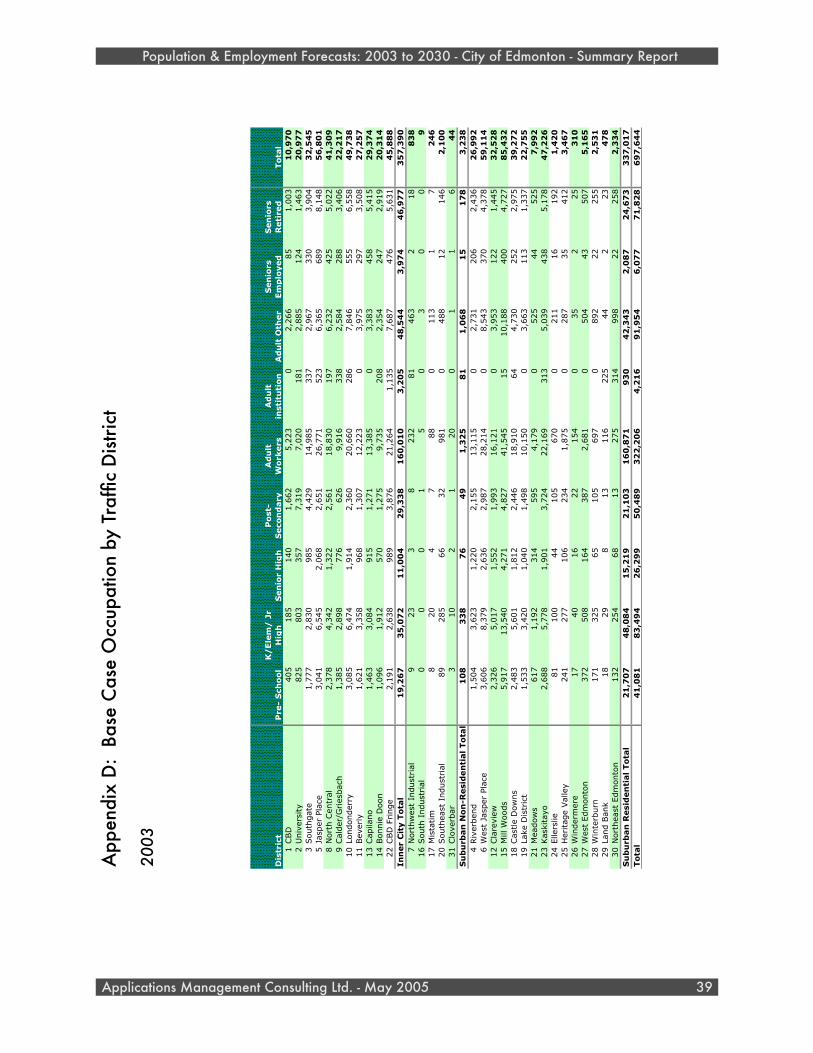
Dis
tric
tP
re-
Sch
oo
lK
/Ele
m/
Jr
Hig
hS
en
ior
Hig
hP
ost
-S
eco
nd
ary
Ad
ult
W
ork
ers
Ad
ult
in
stit
uti
on
Ad
ult
Oth
er
Sen
iors
Em
plo
yed
Sen
iors
R
eti
red
To
tal
1CBD
405
185
140
1,6
62
5,2
23
02,2
66
85
1,0
03
10
,97
02
Univ
ersi
ty825
803
357
7,3
19
7,0
20
181
2,8
85
124
1,4
63
20
,97
73
South
gat
e1,7
77
2,8
30
985
4,4
29
14,9
85
337
2,9
67
330
3,9
04
32
,54
55
Jasp
er P
lace
3,0
41
6,5
45
2,0
68
2,6
51
26,7
71
523
6,3
65
689
8,1
48
56
,80
18
Nort
h C
entr
al2,3
78
4,3
42
1,3
22
2,5
61
18,8
30
197
6,2
32
425
5,0
22
41
,30
99
Cal
der
/Gries
bac
h1,3
85
2,8
98
776
626
9,9
16
338
2,5
84
288
3,4
06
22
,21
710
Londonder
ry3,0
85
6,4
74
1,9
14
2,3
60
20,6
60
286
7,8
46
555
6,5
58
49
,73
811
Bev
erly
1,6
21
3,3
58
968
1,3
07
12,2
23
03,9
75
297
3,5
08
27
,25
713
Cap
ilano
1,4
63
3,0
84
915
1,2
71
13,3
85
03,3
83
458
5,4
15
29
,37
414
Bonnie
Doon
1,0
96
1,9
12
570
1,2
75
9,7
35
208
2,3
54
247
2,9
19
20
,31
422
CBD
Fringe
2,1
91
2,6
38
989
3,8
76
21,2
64
1,1
35
7,6
87
476
5,6
31
45
,88
8In
ner
Cit
y T
ota
l1
9,2
67
35
,07
21
1,0
04
29
,33
81
60
,01
03
,20
54
8,5
44
3,9
74
46
,97
73
57
,39
07
Nort
hw
est
Indust
rial
923
38
232
81
463
218
83
816
South
Indust
rial
00
01
50
30
09
17
Mis
tatim
820
47
88
0113
17
24
620
South
east
Indust
rial
89
285
66
32
981
0488
12
146
2,1
00
31
Clo
verb
ar3
10
21
20
01
16
44
Su
bu
rban
No
n-R
esi
den
tial
To
tal
10
83
38
76
49
1,3
25
81
1,0
68
15
17
83
,23
84
Riv
erben
d1,5
04
3,6
23
1,2
20
2,1
55
13,1
15
02,7
31
206
2,4
36
26
,99
26
Wes
t Ja
sper
Pla
ce3,6
06
8,3
79
2,6
36
2,9
87
28,2
14
08,5
43
370
4,3
78
59
,11
412
Cla
revi
ew2,3
26
5,0
17
1,5
52
1,9
93
16,1
21
03,9
53
122
1,4
45
32
,52
815
Mill
Woods
5,9
17
13,5
40
4,2
71
4,8
27
41,5
45
15
10,1
88
400
4,7
27
85
,43
218
Cas
tle
Dow
ns
2,4
83
5,6
01
1,8
12
2,4
46
18,9
10
64
4,7
30
252
2,9
75
39
,27
219
Lake
Dis
tric
t1,5
33
3,4
20
1,0
40
1,4
98
10,1
50
03,6
63
113
1,3
37
22
,75
521
Mea
dow
s617
1,1
92
314
595
4,1
79
0525
44
525
7,9
92
23
Kas
kita
yo2,6
88
5,7
78
1,9
01
3,7
24
22,1
69
313
5,0
39
438
5,1
78
47
,22
624
Elle
rslie
81
100
44
105
670
0211
16
192
1,4
20
25
Her
itag
e Val
ley
241
277
106
234
1,8
75
0287
35
412
3,4
67
26
Win
der
mer
e17
40
16
22
154
035
225
31
027
Wes
t Edm
onto
n372
508
164
387
2,6
81
0504
43
507
5,1
65
28
Win
terb
urn
171
325
65
105
697
0892
22
255
2,5
31
29
Land B
ank
18
29
813
116
225
44
223
47
830
Nort
hea
st E
dm
onto
n132
254
68
13
275
314
998
22
258
2,3
34
Su
bu
rban
Resi
den
tial
To
tal
21
,70
74
8,0
84
15
,21
92
1,1
03
16
0,8
71
93
04
2,3
43
2,0
87
24
,67
33
37
,01
7To
tal
41
,08
18
3,4
94
26
,29
95
0,4
89
32
2,2
06
4,2
16
91
,95
46
,07
77
1,8
28
69
7,6
44
Population & Employment Forecasts: 2003 to 2030 - City of Edmonton - Summary Report
Applications Management Consulting Ltd. - May 2005 39
App
endi
x D
: Ba
se C
ase
Occ
upat
ion
by T
raffi
c D
istric
t
2003
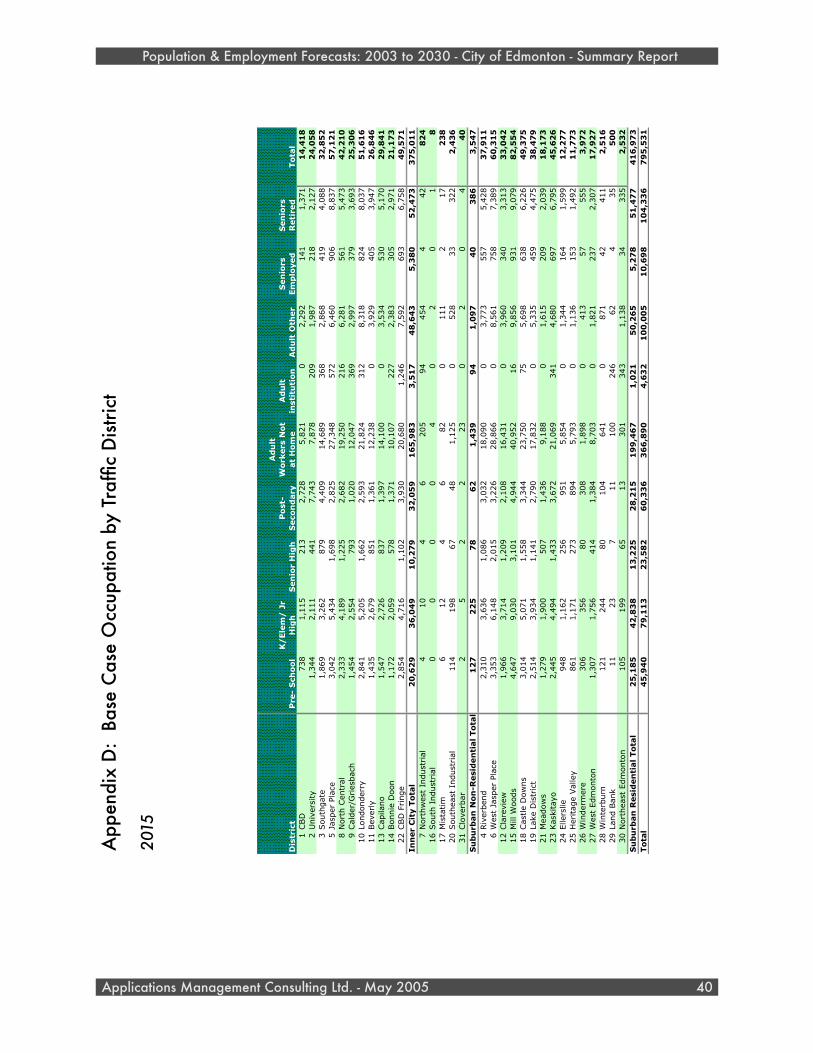
Dis
tric
tP
re-
Sch
oo
lK
/Ele
m/
Jr
Hig
hS
en
ior
Hig
hP
ost
-S
eco
nd
ary
Ad
ult
W
ork
ers
No
t at
Ho
me
Ad
ult
in
stit
uti
on
Ad
ult
Oth
er
Sen
iors
Em
plo
yed
Sen
iors
R
eti
red
To
tal
1CBD
738
1,1
15
213
2,7
28
5,8
21
02,2
92
141
1,3
71
14
,41
82
Univ
ersi
ty1,3
44
2,1
11
441
7,7
43
7,8
78
209
1,9
87
218
2,1
27
24
,05
83
South
gat
e1,8
69
3,2
62
879
4,4
09
14,6
89
368
2,8
68
419
4,0
88
32
,85
25
Jasp
er P
lace
3,0
42
5,4
34
1,6
98
2,8
25
27,3
48
572
6,4
60
906
8,8
37
57
,12
18
Nort
h C
entr
al2,3
33
4,1
89
1,2
25
2,6
82
19,2
50
216
6,2
81
561
5,4
73
42
,21
09
Cal
der
/Gries
bac
h1,4
54
2,5
54
793
1,0
20
12,0
47
369
2,9
97
379
3,6
93
25
,30
610
Londonder
ry2,8
41
5,2
05
1,6
62
2,5
93
21,8
24
312
8,3
18
824
8,0
37
51
,61
611
Bev
erly
1,4
35
2,6
79
851
1,3
61
12,2
38
03,9
29
405
3,9
47
26
,84
613
Cap
ilano
1,5
47
2,7
26
837
1,3
97
14,1
00
03,5
34
530
5,1
70
29
,84
114
Bonnie
Doon
1,1
72
2,0
59
578
1,3
71
10,1
07
227
2,3
83
305
2,9
71
21
,17
322
CBD
Fringe
2,8
54
4,7
16
1,1
02
3,9
30
20,6
80
1,2
46
7,5
92
693
6,7
58
49
,57
1In
ner
Cit
y T
ota
l2
0,6
29
36
,04
91
0,2
79
32
,05
91
65
,98
33
,51
74
8,6
43
5,3
80
52
,47
33
75
,01
17
Nort
hw
est
Indust
rial
410
46
205
94
454
442
82
416
South
Indust
rial
00
00
40
20
18
17
Mis
tatim
612
46
82
0111
217
23
820
South
east
Indust
rial
114
198
67
48
1,1
25
0528
33
322
2,4
36
31
Clo
verb
ar2
52
223
02
04
40
Su
bu
rban
No
n-R
esi
den
tial To
tal
12
72
25
78
62
1,4
39
94
1,0
97
40
38
63
,54
74
Riv
erben
d2,3
10
3,6
36
1,0
86
3,0
32
18,0
90
03,7
73
557
5,4
28
37
,91
16
Wes
t Ja
sper
Pla
ce3,3
53
6,1
48
2,0
15
3,2
26
28,8
66
08,5
61
758
7,3
89
60
,31
512
Cla
revi
ew1,9
66
3,7
14
1,2
09
2,1
08
16,4
31
03,9
60
340
3,3
13
33
,04
215
Mill
Woods
4,6
47
9,0
30
3,1
01
4,9
44
40,9
52
16
9,8
56
931
9,0
79
82
,55
418
Cas
tle
Dow
ns
3,0
14
5,0
71
1,5
58
3,3
44
23,7
50
75
5,6
98
638
6,2
26
49
,37
519
Lake
Dis
tric
t2,5
14
3,9
34
1,1
41
2,7
90
17,8
32
05,3
35
459
4,4
75
38
,47
921
Mea
dow
s1,2
79
1,9
00
507
1,4
36
9,1
88
01,6
15
209
2,0
39
18
,17
323
Kas
kita
yo2,4
45
4,4
94
1,4
33
3,6
72
21,0
69
341
4,6
80
697
6,7
95
45
,62
624
Elle
rslie
948
1,1
62
256
951
5,8
54
01,3
44
164
1,5
99
12
,27
725
Her
itag
e Val
ley
861
1,1
71
273
894
5,7
93
01,1
36
153
1,4
92
11
,77
326
Win
der
mer
e306
356
80
308
1,8
98
0413
57
555
3,9
72
27
Wes
t Edm
onto
n1,3
07
1,7
56
414
1,3
84
8,7
03
01,8
21
237
2,3
07
17
,92
728
Win
terb
urn
121
244
80
104
641
0871
42
411
2,5
16
29
Land B
ank
11
23
711
100
246
62
435
50
030
Nort
hea
st E
dm
onto
n105
199
65
13
301
343
1,1
38
34
335
2,5
32
Su
bu
rban
Resi
den
tial To
tal
25
,18
54
2,8
38
13
,22
52
8,2
15
19
9,4
67
1,0
21
50
,26
55
,27
85
1,4
77
41
6,9
73
To
tal
45
,94
07
9,1
13
23
,58
26
0,3
36
36
6,8
90
4,6
32
10
0,0
05
10
,69
81
04
,33
67
95
,53
1
Population & Employment Forecasts: 2003 to 2030 - City of Edmonton - Summary Report
Applications Management Consulting Ltd. - May 2005 40
App
endi
x D
: Ba
se C
ase
Occ
upat
ion
by T
raffi
c D
istric
t
2015
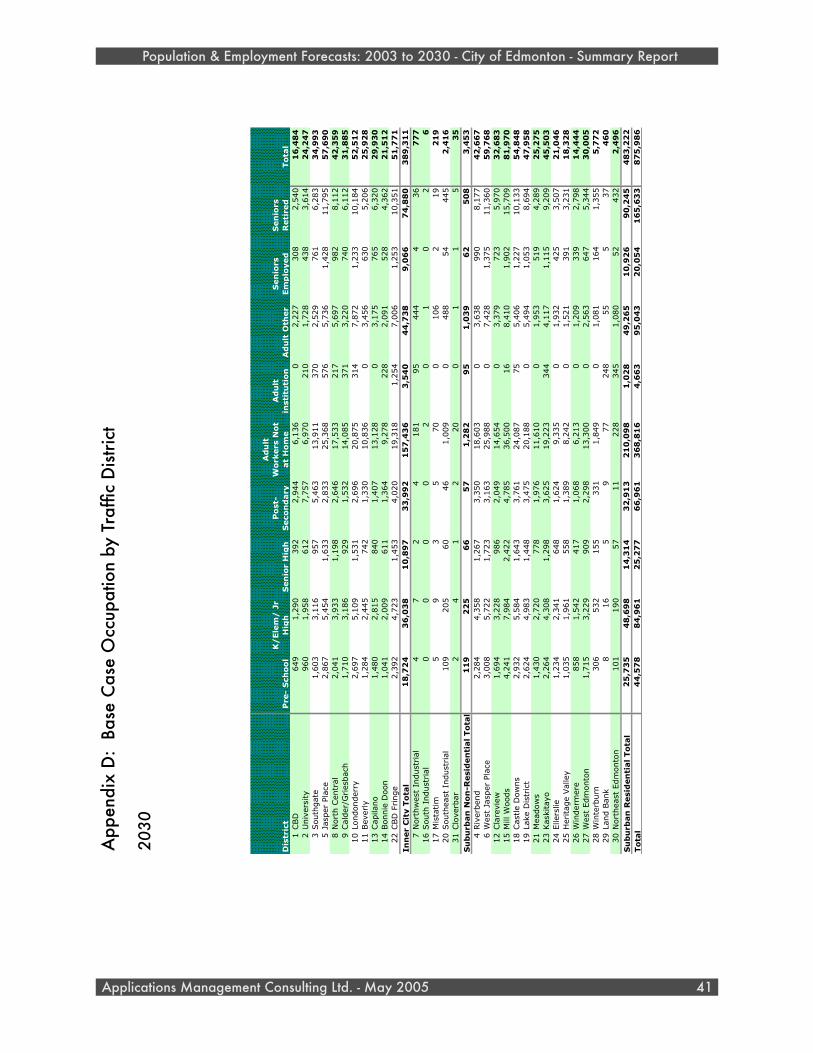
Pre
- S
cho
ol
K/
Ele
m/
Jr
Hig
hS
en
ior
Hig
hP
ost
-S
eco
nd
ary
Ad
ult
W
ork
ers
No
t at
Ho
me
Ad
ult
in
stit
uti
on
Ad
ult
Oth
er
Sen
iors
Em
plo
yed
Sen
iors
R
eti
red
To
tal
1CBD
649
1,2
90
392
2,9
44
6,1
36
02,2
27
308
2,5
40
16
,48
42
Univ
ersi
ty960
1,9
58
612
7,7
57
6,9
70
210
1,7
28
438
3,6
14
24
,24
73
South
gat
e1,6
03
3,1
16
957
5,4
63
13,9
11
370
2,5
29
761
6,2
83
34
,99
35
Jasp
er P
lace
2,8
67
5,4
54
1,6
33
2,8
33
25,3
68
576
5,7
36
1,4
28
11,7
95
57
,69
08
Nort
h C
entr
al2,0
41
3,9
33
1,1
98
2,6
46
17,5
33
217
5,6
97
982
8,1
12
42
,35
99
Cal
der
/Gries
bac
h1,7
10
3,1
86
929
1,5
32
14,0
85
371
3,2
20
740
6,1
12
31
,88
510
Londonder
ry2,6
97
5,1
09
1,5
31
2,6
96
20,8
75
314
7,8
72
1,2
33
10,1
84
52
,51
211
Bev
erly
1,2
84
2,4
45
742
1,3
30
10,8
36
03,4
56
630
5,2
06
25
,92
813
Cap
ilano
1,4
80
2,8
15
840
1,4
07
13,1
28
03,1
75
765
6,3
20
29
,93
014
Bonnie
Doon
1,0
41
2,0
09
611
1,3
64
9,2
78
228
2,0
91
528
4,3
62
21
,51
222
CBD
Fringe
2,3
92
4,7
23
1,4
53
4,0
20
19,3
18
1,2
54
7,0
06
1,2
53
10,3
51
51
,77
11
8,7
24
36
,03
81
0,8
97
33
,99
21
57
,43
63
,54
04
4,7
38
9,0
66
74
,88
03
89
,31
17
Nort
hw
est
Indust
rial
47
24
181
95
444
436
77
716
South
Indust
rial
00
00
20
10
26
17
Mis
tatim
59
35
70
0106
219
21
920
South
east
Indust
rial
109
205
60
46
1,0
09
0488
54
445
2,4
16
31
Clo
verb
ar2
41
220
01
15
35
11
92
25
66
57
1,2
82
95
1,0
39
62
50
83
,45
34
Riv
erben
d2,2
84
4,3
58
1,2
67
3,3
50
18,6
03
03,6
38
990
8,1
77
42
,66
76
Wes
t Ja
sper
Pla
ce3,0
08
5,7
22
1,7
23
3,1
63
25,9
88
07,4
28
1,3
75
11,3
60
59
,76
812
Cla
revi
ew1,6
94
3,2
28
986
2,0
49
14,6
54
03,3
79
723
5,9
70
32
,68
315
Mill
Woods
4,2
41
7,9
84
2,4
22
4,7
85
36,5
00
16
8,4
10
1,9
02
15,7
09
81
,97
018
Cas
tle
Dow
ns
2,9
32
5,5
84
1,6
43
3,7
61
24,0
87
75
5,4
06
1,2
27
10,1
33
54
,84
819
Lake
Dis
tric
t2,6
24
4,9
83
1,4
48
3,4
75
20,1
88
05,4
94
1,0
53
8,6
94
47
,95
821
Mea
dow
s1,4
30
2,7
20
778
1,9
76
11,6
10
01,9
53
519
4,2
89
25
,27
523
Kas
kita
yo2,2
64
4,3
08
1,2
98
3,6
25
19,2
23
344
4,1
17
1,1
15
9,2
09
45
,50
324
Elle
rslie
1,2
34
2,3
41
648
1,6
24
9,3
35
01,9
32
425
3,5
07
21
,04
625
Her
itag
e Val
ley
1,0
35
1,9
61
558
1,3
89
8,2
42
01,5
21
391
3,2
31
18
,32
826
Win
der
mer
e858
1,5
42
417
1,0
68
6,2
13
01,2
09
339
2,7
98
14
,44
427
Wes
t Edm
onto
n1,7
15
3,2
29
909
2,2
98
13,3
00
02,5
63
647
5,3
44
30
,00
528
Win
terb
urn
306
532
155
331
1,8
49
01,0
81
164
1,3
55
5,7
72
29
Land B
ank
816
59
77
248
55
537
46
030
Nort
hea
st E
dm
onto
n101
190
57
11
228
345
1,0
80
52
432
2,4
96
25
,73
54
8,6
98
14
,31
43
2,9
13
21
0,0
98
1,0
28
49
,26
51
0,9
26
90
,24
54
83
,22
24
4,5
78
84
,96
12
5,2
77
66
,96
13
68
,81
64
,66
39
5,0
43
20
,05
41
65
,63
38
75
,98
6
Dis
tric
t
Inn
er
Cit
y T
ota
l
Su
bu
rban
No
n-R
esi
den
tial To
tal
Su
bu
rban
Resi
den
tial To
tal
To
tal
Population & Employment Forecasts: 2003 to 2030 - City of Edmonton - Summary Report
Applications Management Consulting Ltd. - May 2005 41
App
endi
x D
: Ba
se C
ase
Occ
upat
ion
by T
raffi
c D
istric
t
2030
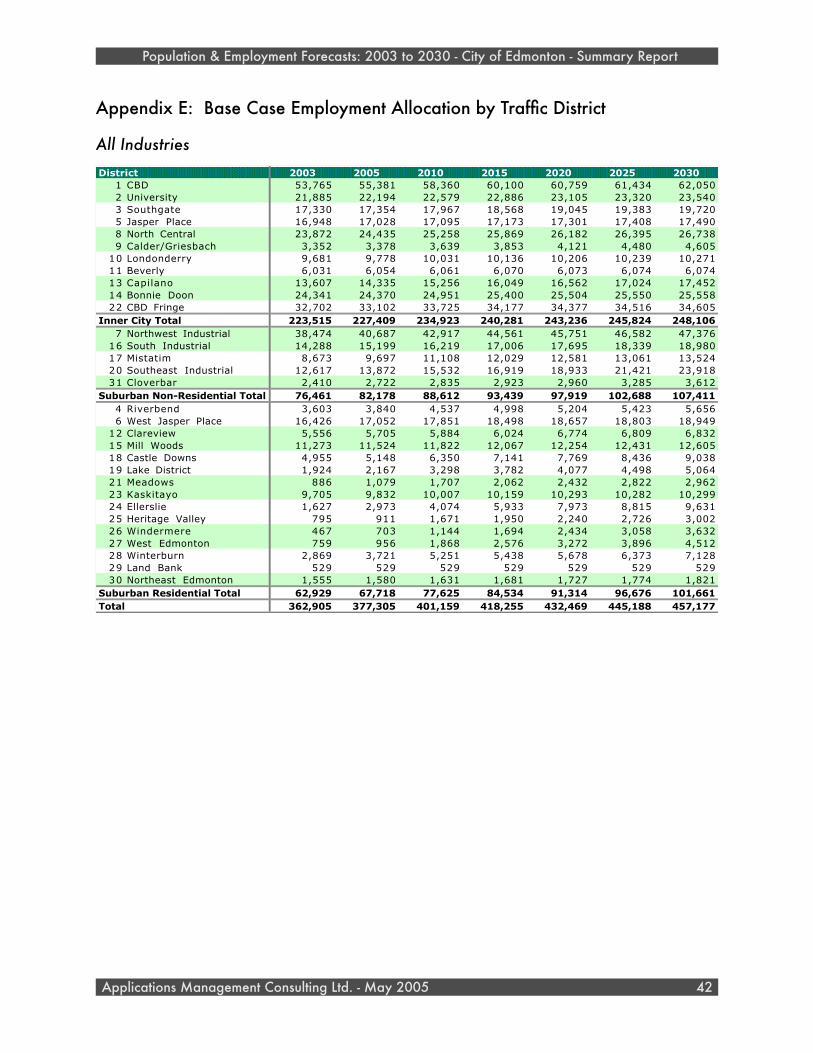
Appendix E: Base Case Employment Allocation by Traffic District
All IndustriesDistrict 2003 2005 2010 2015 2020 2025 2030
1 CBD 53,765 55,381 58,360 60,100 60,759 61,434 62,0502 University 21,885 22,194 22,579 22,886 23,105 23,320 23,5403 Southgate 17,330 17,354 17,967 18,568 19,045 19,383 19,7205 Jasper Place 16,948 17,028 17,095 17,173 17,301 17,408 17,4908 North Central 23,872 24,435 25,258 25,869 26,182 26,395 26,7389 Calder/Griesbach 3,352 3,378 3,639 3,853 4,121 4,480 4,605
10 Londonderry 9,681 9,778 10,031 10,136 10,206 10,239 10,27111 Beverly 6,031 6,054 6,061 6,070 6,073 6,074 6,07413 Capilano 13,607 14,335 15,256 16,049 16,562 17,024 17,45214 Bonnie Doon 24,341 24,370 24,951 25,400 25,504 25,550 25,55822 CBD Fringe 32,702 33,102 33,725 34,177 34,377 34,516 34,605
Inner City Total 223,515 227,409 234,923 240,281 243,236 245,824 248,1067 Northwest Industrial 38,474 40,687 42,917 44,561 45,751 46,582 47,376
16 South Industrial 14,288 15,199 16,219 17,006 17,695 18,339 18,98017 Mistatim 8,673 9,697 11,108 12,029 12,581 13,061 13,52420 Southeast Industrial 12,617 13,872 15,532 16,919 18,933 21,421 23,91831 Cloverbar 2,410 2,722 2,835 2,923 2,960 3,285 3,612
Suburban Non-Residential Total 76,461 82,178 88,612 93,439 97,919 102,688 107,4114 Riverbend 3,603 3,840 4,537 4,998 5,204 5,423 5,6566 West Jasper Place 16,426 17,052 17,851 18,498 18,657 18,803 18,949
12 Clareview 5,556 5,705 5,884 6,024 6,774 6,809 6,83215 Mill Woods 11,273 11,524 11,822 12,067 12,254 12,431 12,60518 Castle Downs 4,955 5,148 6,350 7,141 7,769 8,436 9,03819 Lake District 1,924 2,167 3,298 3,782 4,077 4,498 5,06421 Meadows 886 1,079 1,707 2,062 2,432 2,822 2,96223 Kaskitayo 9,705 9,832 10,007 10,159 10,293 10,282 10,29924 Ellerslie 1,627 2,973 4,074 5,933 7,973 8,815 9,63125 Heritage Valley 795 911 1,671 1,950 2,240 2,726 3,00226 Windermere 467 703 1,144 1,694 2,434 3,058 3,63227 West Edmonton 759 956 1,868 2,576 3,272 3,896 4,51228 Winterburn 2,869 3,721 5,251 5,438 5,678 6,373 7,12829 Land Bank 529 529 529 529 529 529 52930 Northeast Edmonton 1,555 1,580 1,631 1,681 1,727 1,774 1,821
Suburban Residential Total 62,929 67,718 77,625 84,534 91,314 96,676 101,661Total 362,905 377,305 401,159 418,255 432,469 445,188 457,177
Population & Employment Forecasts: 2003 to 2030 - City of Edmonton - Summary Report
Applications Management Consulting Ltd. - May 2005 42
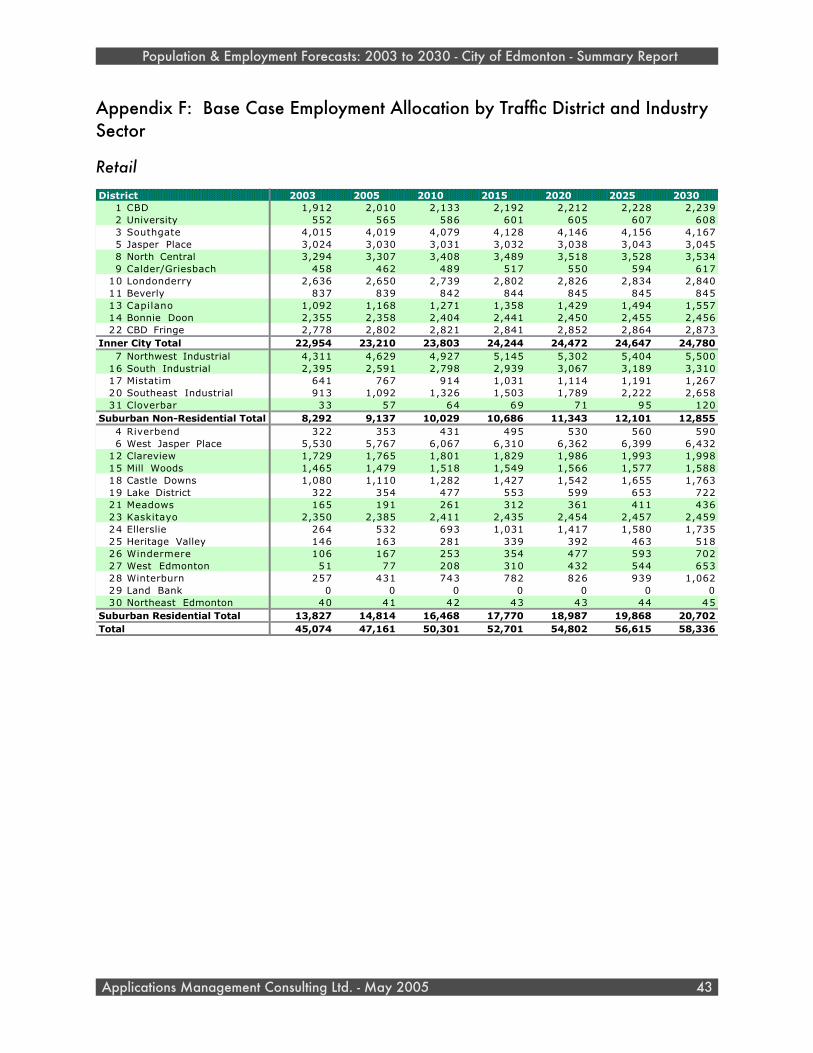
Appendix F: Base Case Employment Allocation by Traffic District and Industry Sector
RetailDistrict 2003 2005 2010 2015 2020 2025 2030
1 CBD 1,912 2,010 2,133 2,192 2,212 2,228 2,2392 University 552 565 586 601 605 607 6083 Southgate 4,015 4,019 4,079 4,128 4,146 4,156 4,1675 Jasper Place 3,024 3,030 3,031 3,032 3,038 3,043 3,0458 North Central 3,294 3,307 3,408 3,489 3,518 3,528 3,5349 Calder/Griesbach 458 462 489 517 550 594 617
10 Londonderry 2,636 2,650 2,739 2,802 2,826 2,834 2,84011 Beverly 837 839 842 844 845 845 84513 Capilano 1,092 1,168 1,271 1,358 1,429 1,494 1,55714 Bonnie Doon 2,355 2,358 2,404 2,441 2,450 2,455 2,45622 CBD Fringe 2,778 2,802 2,821 2,841 2,852 2,864 2,873
Inner City Total 22,954 23,210 23,803 24,244 24,472 24,647 24,7807 Northwest Industrial 4,311 4,629 4,927 5,145 5,302 5,404 5,500
16 South Industrial 2,395 2,591 2,798 2,939 3,067 3,189 3,31017 Mistatim 641 767 914 1,031 1,114 1,191 1,26720 Southeast Industrial 913 1,092 1,326 1,503 1,789 2,222 2,65831 Cloverbar 33 57 64 69 71 95 120
Suburban Non-Residential Total 8,292 9,137 10,029 10,686 11,343 12,101 12,8554 Riverbend 322 353 431 495 530 560 5906 West Jasper Place 5,530 5,767 6,067 6,310 6,362 6,399 6,432
12 Clareview 1,729 1,765 1,801 1,829 1,986 1,993 1,99815 Mill Woods 1,465 1,479 1,518 1,549 1,566 1,577 1,58818 Castle Downs 1,080 1,110 1,282 1,427 1,542 1,655 1,76319 Lake District 322 354 477 553 599 653 72221 Meadows 165 191 261 312 361 411 43623 Kaskitayo 2,350 2,385 2,411 2,435 2,454 2,457 2,45924 Ellerslie 264 532 693 1,031 1,417 1,580 1,73525 Heritage Valley 146 163 281 339 392 463 51826 Windermere 106 167 253 354 477 593 70227 West Edmonton 51 77 208 310 432 544 65328 Winterburn 257 431 743 782 826 939 1,06229 Land Bank 0 0 0 0 0 0 030 Northeast Edmonton 40 41 42 43 43 44 45
Suburban Residential Total 13,827 14,814 16,468 17,770 18,987 19,868 20,702Total 45,074 47,161 50,301 52,701 54,802 56,615 58,336
Population & Employment Forecasts: 2003 to 2030 - City of Edmonton - Summary Report
Applications Management Consulting Ltd. - May 2005 43
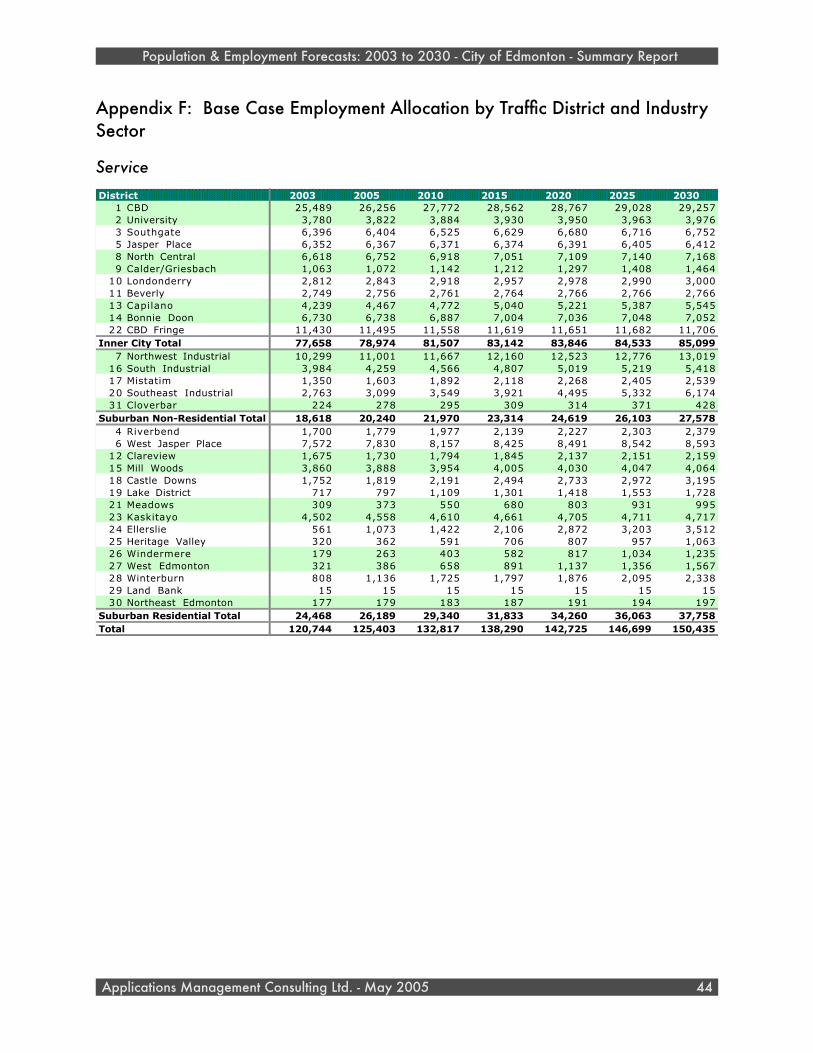
Appendix F: Base Case Employment Allocation by Traffic District and Industry Sector
ServiceDistrict 2003 2005 2010 2015 2020 2025 2030
1 CBD 25,489 26,256 27,772 28,562 28,767 29,028 29,2572 University 3,780 3,822 3,884 3,930 3,950 3,963 3,9763 Southgate 6,396 6,404 6,525 6,629 6,680 6,716 6,7525 Jasper Place 6,352 6,367 6,371 6,374 6,391 6,405 6,4128 North Central 6,618 6,752 6,918 7,051 7,109 7,140 7,1689 Calder/Griesbach 1,063 1,072 1,142 1,212 1,297 1,408 1,464
10 Londonderry 2,812 2,843 2,918 2,957 2,978 2,990 3,00011 Beverly 2,749 2,756 2,761 2,764 2,766 2,766 2,76613 Capilano 4,239 4,467 4,772 5,040 5,221 5,387 5,54514 Bonnie Doon 6,730 6,738 6,887 7,004 7,036 7,048 7,05222 CBD Fringe 11,430 11,495 11,558 11,619 11,651 11,682 11,706
Inner City Total 77,658 78,974 81,507 83,142 83,846 84,533 85,0997 Northwest Industrial 10,299 11,001 11,667 12,160 12,523 12,776 13,019
16 South Industrial 3,984 4,259 4,566 4,807 5,019 5,219 5,41817 Mistatim 1,350 1,603 1,892 2,118 2,268 2,405 2,53920 Southeast Industrial 2,763 3,099 3,549 3,921 4,495 5,332 6,17431 Cloverbar 224 278 295 309 314 371 428
Suburban Non-Residential Total 18,618 20,240 21,970 23,314 24,619 26,103 27,5784 Riverbend 1,700 1,779 1,977 2,139 2,227 2,303 2,3796 West Jasper Place 7,572 7,830 8,157 8,425 8,491 8,542 8,593
12 Clareview 1,675 1,730 1,794 1,845 2,137 2,151 2,15915 Mill Woods 3,860 3,888 3,954 4,005 4,030 4,047 4,06418 Castle Downs 1,752 1,819 2,191 2,494 2,733 2,972 3,19519 Lake District 717 797 1,109 1,301 1,418 1,553 1,72821 Meadows 309 373 550 680 803 931 99523 Kaskitayo 4,502 4,558 4,610 4,661 4,705 4,711 4,71724 Ellerslie 561 1,073 1,422 2,106 2,872 3,203 3,51225 Heritage Valley 320 362 591 706 807 957 1,06326 Windermere 179 263 403 582 817 1,034 1,23527 West Edmonton 321 386 658 891 1,137 1,356 1,56728 Winterburn 808 1,136 1,725 1,797 1,876 2,095 2,33829 Land Bank 15 15 15 15 15 15 1530 Northeast Edmonton 177 179 183 187 191 194 197
Suburban Residential Total 24,468 26,189 29,340 31,833 34,260 36,063 37,758Total 120,744 125,403 132,817 138,290 142,725 146,699 150,435
Population & Employment Forecasts: 2003 to 2030 - City of Edmonton - Summary Report
Applications Management Consulting Ltd. - May 2005 44
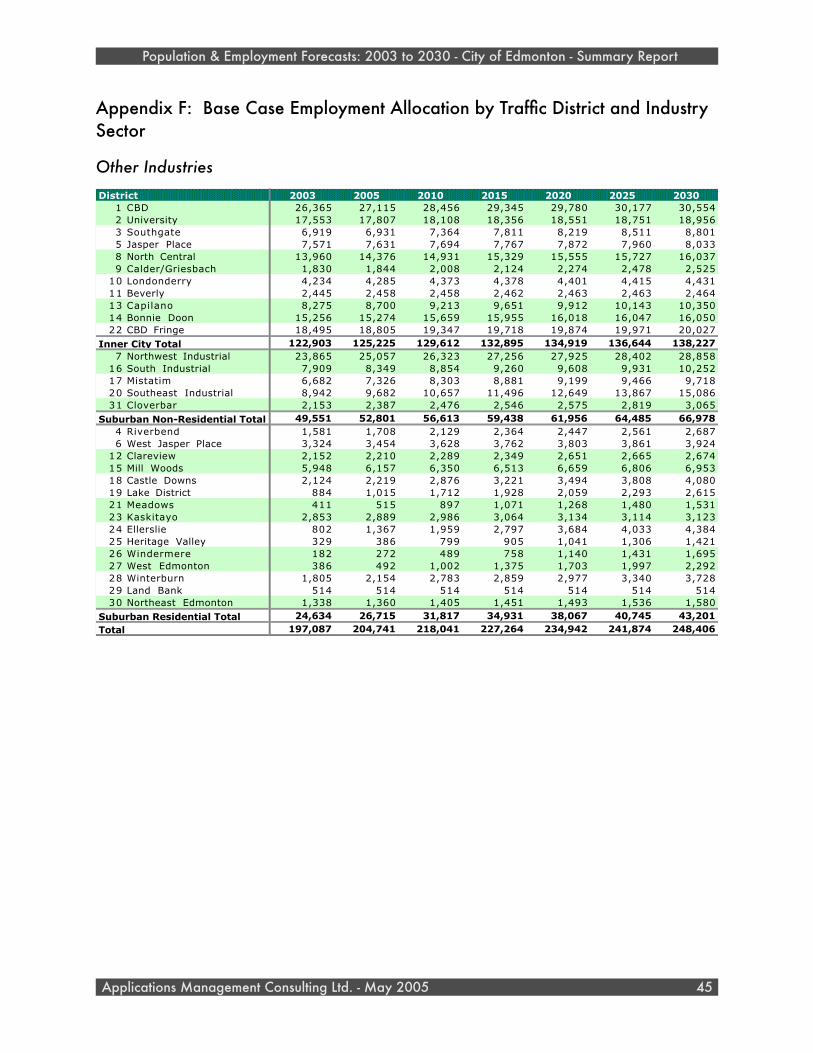
Appendix F: Base Case Employment Allocation by Traffic District and Industry Sector
Other Industries2003 2005 2010 2015 2020 2025 2030
1 CBD 26,365 27,115 28,456 29,345 29,780 30,177 30,5542 University 17,553 17,807 18,108 18,356 18,551 18,751 18,9563 Southgate 6,919 6,931 7,364 7,811 8,219 8,511 8,8015 Jasper Place 7,571 7,631 7,694 7,767 7,872 7,960 8,0338 North Central 13,960 14,376 14,931 15,329 15,555 15,727 16,0379 Calder/Griesbach 1,830 1,844 2,008 2,124 2,274 2,478 2,525
10 Londonderry 4,234 4,285 4,373 4,378 4,401 4,415 4,43111 Beverly 2,445 2,458 2,458 2,462 2,463 2,463 2,46413 Capilano 8,275 8,700 9,213 9,651 9,912 10,143 10,35014 Bonnie Doon 15,256 15,274 15,659 15,955 16,018 16,047 16,05022 CBD Fringe 18,495 18,805 19,347 19,718 19,874 19,971 20,027
122,903 125,225 129,612 132,895 134,919 136,644 138,2277 Northwest Industrial 23,865 25,057 26,323 27,256 27,925 28,402 28,858
16 South Industrial 7,909 8,349 8,854 9,260 9,608 9,931 10,25217 Mistatim 6,682 7,326 8,303 8,881 9,199 9,466 9,71820 Southeast Industrial 8,942 9,682 10,657 11,496 12,649 13,867 15,08631 Cloverbar 2,153 2,387 2,476 2,546 2,575 2,819 3,065
49,551 52,801 56,613 59,438 61,956 64,485 66,9784 Riverbend 1,581 1,708 2,129 2,364 2,447 2,561 2,6876 West Jasper Place 3,324 3,454 3,628 3,762 3,803 3,861 3,924
12 Clareview 2,152 2,210 2,289 2,349 2,651 2,665 2,67415 Mill Woods 5,948 6,157 6,350 6,513 6,659 6,806 6,95318 Castle Downs 2,124 2,219 2,876 3,221 3,494 3,808 4,08019 Lake District 884 1,015 1,712 1,928 2,059 2,293 2,61521 Meadows 411 515 897 1,071 1,268 1,480 1,53123 Kaskitayo 2,853 2,889 2,986 3,064 3,134 3,114 3,12324 Ellerslie 802 1,367 1,959 2,797 3,684 4,033 4,38425 Heritage Valley 329 386 799 905 1,041 1,306 1,42126 Windermere 182 272 489 758 1,140 1,431 1,69527 West Edmonton 386 492 1,002 1,375 1,703 1,997 2,29228 Winterburn 1,805 2,154 2,783 2,859 2,977 3,340 3,72829 Land Bank 514 514 514 514 514 514 51430 Northeast Edmonton 1,338 1,360 1,405 1,451 1,493 1,536 1,580
24,634 26,715 31,817 34,931 38,067 40,745 43,201197,087 204,741 218,041 227,264 234,942 241,874 248,406
Suburban Residential TotalTotal
District
Inner City Total
Suburban Non-Residential Total
Population & Employment Forecasts: 2003 to 2030 - City of Edmonton - Summary Report
Applications Management Consulting Ltd. - May 2005 45

Dis
tric
t
Primary Industries
Manufacturing
Construction
Utilities
Transportation, Storage & Communications
Wholesale
Retail Trade
Finance, Insurance & Real Estate
commercial Services
Non-commercial Services
Public Admin & Defence
Total Employment
1C
BD
34
03
27
38
31
,58
37
,33
95
71
1,9
12
7,7
07
17
,78
24
,66
71
1,1
53
53
,76
52
Univ
ers
ity
40
13
63
35
04
05
11
05
52
40
53
,37
61
6,3
49
17
72
1,8
85
3S
outh
gate
12
58
61
38
90
86
15
66
4,0
15
1,0
47
5,3
50
2,4
77
1,6
40
17
,33
05
Jasp
er
Pla
ce6
51
65
39
91
02
91
19
03
,02
41
,23
75
,11
55
,85
55
96
16
,94
88
Nort
h C
entr
al
27
32
,23
86
83
82
2,2
87
89
43
,29
49
95
5,6
23
5,6
49
1,8
54
23
,87
29
Cald
er/
Gri
esb
ach
15
85
87
01
96
85
45
82
76
78
71
,22
71
35
3,3
52
10
Londonderr
y6
51
61
16
51
01
58
16
52
,63
64
65
2,3
47
3,1
72
33
79
,68
11
1B
everl
y7
02
45
25
82
01
95
20
58
37
13
62
,61
41
,21
12
40
6,0
31
13
Cap
ilan
o2
61
2,1
41
58
91
08
1,0
65
95
51
,09
28
68
3,3
71
2,4
81
67
61
3,6
07
14
Bonnie
D
oon
68
15
,31
51
,83
21
85
1,8
54
3,3
86
2,3
55
1,2
13
5,5
17
1,5
47
45
62
4,3
41
22
CB
D Fr
inge
11
11
,56
76
12
25
08
21
63
12
,77
81
,70
99
,72
01
0,0
73
4,4
31
32
,70
2In
ner
Cit
y T
ota
l2
,04
61
3,2
41
5,7
32
2,2
49
15
,47
37
,76
02
2,9
54
16
,05
76
1,6
01
54
,70
72
1,6
95
22
3,5
15
7N
ort
hw
est
In
dust
rial
19
76
,36
52
,98
71
30
4,8
51
7,8
42
4,3
11
1,7
71
8,5
28
87
26
20
38
,47
41
6S
outh
In
dust
rial
59
52
,95
79
22
12
76
11
,88
12
,39
55
93
3,3
91
27
35
10
14
,28
81
7M
ista
tim
75
2,5
63
60
11
41
1,2
37
1,9
18
64
13
47
1,0
03
10
73
98
,67
32
0S
outh
east
In
dust
rial
55
84
,06
51
,33
31
96
1,3
07
1,3
52
91
32
35
2,5
27
57
73
12
,61
73
1C
loverb
ar
12
11
,27
42
63
78
33
16
93
31
42
10
11
62
,41
0S
ub
urb
an
Non
-Resi
den
tial Tota
l1
,54
71
7,2
24
6,1
06
55
68
,48
71
3,0
62
8,2
92
2,9
60
15
,65
81
,31
11
,25
97
6,4
61
4R
iverb
end
61
92
15
20
53
11
63
22
44
21
,25
81
,02
38
53
,60
36
West
Ja
sper
Pla
ce7
92
73
28
90
48
43
29
5,5
30
1,0
06
6,5
66
1,7
78
92
16
,42
61
2C
lare
vie
w1
22
37
21
76
52
02
18
61
,72
92
97
1,3
77
1,0
80
15
25
,55
61
5M
ill
Woods
70
10
02
27
03
91
11
61
,46
55
88
3,2
73
4,8
69
17
61
1,2
73
18
Cast
le D
ow
ns
36
10
62
49
10
22
31
49
1,0
80
32
61
,42
61
,11
02
40
4,9
55
19
Lake D
istr
ict
11
12
15
30
28
36
13
22
17
25
45
35
01
51
,92
42
1M
eadow
s4
11
78
80
41
11
65
60
25
02
20
48
86
23
Kask
itayo
56
96
15
71
09
81
35
2,3
50
68
23
,82
02
,13
31
68
9,7
05
24
Ellers
lie
54
22
91
40
31
97
10
92
64
70
49
11
10
32
1,6
27
25
Heri
tage V
alley
56
44
78
75
71
46
32
28
81
21
10
79
52
6W
inderm
ere
33
52
19
31
02
31
06
15
16
42
61
54
67
27
West
Edm
onto
n3
14
28
01
03
13
15
13
02
91
15
84
75
92
8W
inte
rburn
77
50
45
30
72
96
33
32
57
11
46
94
47
10
2,8
69
29
Land
Bank
96
27
00
10
10
00
15
03
71
52
93
0N
ort
heast
Edm
onto
n1
52
01
50
25
04
01
01
67
1,0
85
61
1,5
55
Su
bu
rban
Resi
den
tial Tota
l8
66
1,8
32
2,3
95
14
32
,25
01
,60
41
3,8
27
3,8
43
20
,62
51
4,1
10
1,4
34
62
,92
9Tota
l4
,45
93
2,2
97
14
,23
32
,94
82
6,2
10
22
,42
64
5,0
74
22
,86
09
7,8
84
70
,12
72
4,3
88
36
2,9
05
Population & Employment Forecasts: 2003 to 2030 - City of Edmonton - Summary Report
Applications Management Consulting Ltd. - May 2005 46
App
endi
x G
: Ba
se C
ase
Empl
oym
ent b
y Tr
affic
Dist
rict a
nd In
dust
ry
2003
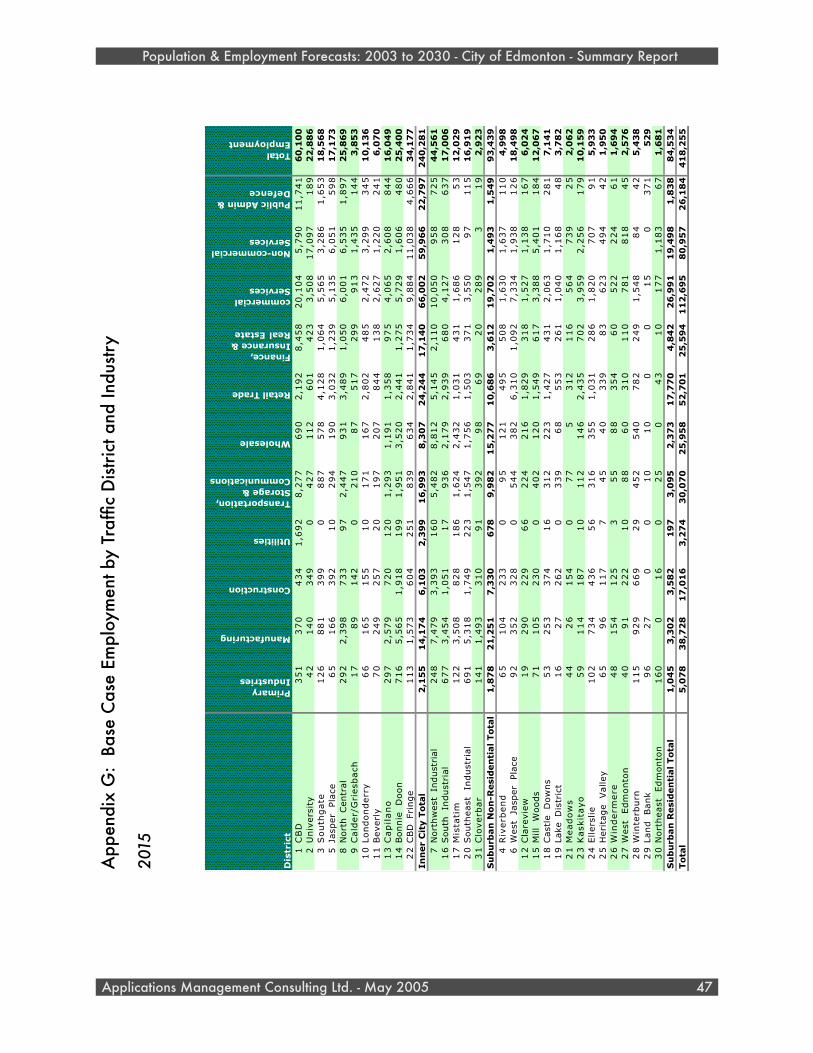
Dis
tric
t
Primary Industries
Manufacturing
Construction
Utilities
Transportation, Storage & Communications
Wholesale
Retail Trade
Finance, Insurance & Real Estate
commercial Services
Non-commercial Services
Public Admin & Defence
Total Employment
1C
BD
35
13
70
43
41
,69
28
,27
76
90
2,1
92
8,4
58
20
,10
45
,79
01
1,7
41
60
,10
02
Univ
ers
ity
42
14
03
49
04
27
11
26
01
42
33
,50
81
7,0
97
18
92
2,8
86
3S
outh
gate
12
68
81
39
90
88
75
78
4,1
28
1,0
64
5,5
65
3,2
86
1,6
53
18
,56
85
Jasp
er
Pla
ce6
51
66
39
21
02
94
19
03
,03
21
,23
95
,13
56
,05
15
98
17
,17
38
Nort
h C
entr
al
29
22
,39
87
33
97
2,4
47
93
13
,48
91
,05
06
,00
16
,53
51
,89
72
5,8
69
9C
ald
er/
Gri
esb
ach
17
89
14
20
21
08
75
17
29
99
13
1,4
35
14
43
,85
31
0Londonderr
y6
61
65
15
51
01
71
16
72
,80
24
85
2,4
72
3,2
99
34
51
0,1
36
11
Beverl
y7
02
49
25
72
01
97
20
78
44
13
82
,62
71
,22
02
41
6,0
70
13
Cap
ilan
o2
97
2,5
79
72
01
20
1,2
93
1,1
91
1,3
58
97
54
,06
52
,60
88
44
16
,04
91
4B
onnie
D
oon
71
65
,56
51
,91
81
99
1,9
51
3,5
20
2,4
41
1,2
75
5,7
29
1,6
06
48
02
5,4
00
22
CB
D Fr
inge
11
31
,57
36
04
25
18
39
63
42
,84
11
,73
49
,88
41
1,0
38
4,6
66
34
,17
7In
ner
Cit
y T
ota
l2
,15
51
4,1
74
6,1
03
2,3
99
16
,99
38
,30
72
4,2
44
17
,14
06
6,0
02
59
,96
62
2,7
97
24
0,2
81
7N
ort
hw
est
In
dust
rial
24
87
,47
93
,39
31
60
5,4
82
8,8
12
5,1
45
2,1
10
10
,05
09
58
72
54
4,5
61
16
South
In
dust
rial
67
73
,45
41
,05
11
79
36
2,1
79
2,9
39
68
04
,12
73
08
63
71
7,0
06
17
Mis
tati
m1
22
3,5
08
82
81
86
1,6
24
2,4
32
1,0
31
43
11
,68
61
28
53
12
,02
92
0S
outh
east
In
dust
rial
69
15
,31
81
,74
92
23
1,5
47
1,7
56
1,5
03
37
13
,55
09
71
15
16
,91
93
1C
loverb
ar
14
11
,49
33
10
91
39
29
86
92
02
89
31
92
,92
3S
ub
urb
an
Non
-Resi
den
tial Tota
l1
,87
82
1,2
51
7,3
30
67
89
,98
21
5,2
77
10
,68
63
,61
21
9,7
02
1,4
93
1,5
49
93
,43
94
Riv
erb
end
65
10
42
33
09
51
21
49
55
08
1,6
30
1,6
37
11
04
,99
86
West
Ja
sper
Pla
ce9
23
52
32
80
54
43
82
6,3
10
1,0
92
7,3
34
1,9
38
12
61
8,4
98
12
Cla
revie
w1
92
90
22
96
62
24
21
61
,82
93
18
1,5
27
1,1
38
16
76
,02
41
5M
ill
Woods
71
10
52
30
04
02
12
01
,54
96
17
3,3
88
5,4
01
18
41
2,0
67
18
Cast
le D
ow
ns
53
25
33
74
16
31
22
23
1,4
27
43
12
,06
31
,71
02
81
7,1
41
19
Lake D
istr
ict
16
27
26
20
33
96
85
53
26
11
,04
01
,16
84
83
,78
22
1M
eadow
s4
42
61
54
07
75
31
21
16
56
47
39
25
2,0
62
23
Kask
itayo
59
11
41
87
10
11
21
46
2,4
35
70
23
,95
92
,25
61
79
10
,15
92
4Ellers
lie
10
27
34
43
65
63
16
35
51
,03
12
86
1,8
20
70
79
15
,93
32
5H
eri
tage V
alley
65
96
11
77
45
40
33
98
36
23
49
44
21
,95
02
6W
inderm
ere
48
15
41
25
35
58
83
54
60
52
22
24
61
1,6
94
27
West
Edm
onto
n4
09
12
22
10
88
60
31
01
10
78
18
18
45
2,5
76
28
Win
terb
urn
11
59
29
66
92
94
52
54
07
82
24
91
,54
88
44
25
,43
82
9La
nd
Bank
96
27
00
10
10
00
15
03
71
52
93
0N
ort
heast
Edm
onto
n1
60
01
60
25
04
31
01
77
1,1
83
67
1,6
81
Su
bu
rban
Resi
den
tial Tota
l1
,04
53
,30
23
,58
21
97
3,0
95
2,3
73
17
,77
04
,84
22
6,9
91
19
,49
81
,83
88
4,5
34
Tota
l5
,07
83
8,7
28
17
,01
63
,27
43
0,0
70
25
,95
85
2,7
01
25
,59
41
12
,69
58
0,9
57
26
,18
44
18
,25
5
Population & Employment Forecasts: 2003 to 2030 - City of Edmonton - Summary Report
Applications Management Consulting Ltd. - May 2005 47
App
endi
x G
: Ba
se C
ase
Empl
oym
ent b
y Tr
affic
Dist
rict a
nd In
dust
ry
2015
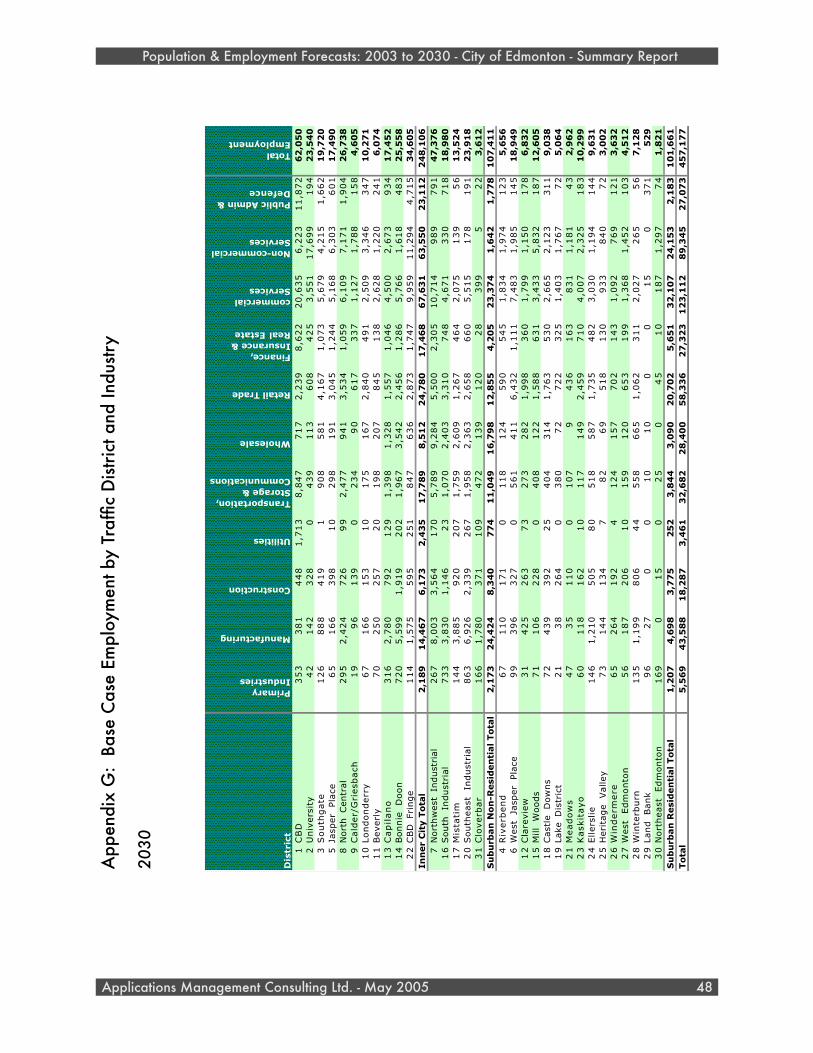
Dis
tric
t
Primary Industries
Manufacturing
Construction
Utilities
Transportation, Storage & Communications
Wholesale
Retail Trade
Finance, Insurance & Real Estate
commercial Services
Non-commercial Services
Public Admin & Defence
Total Employment
1C
BD
35
33
81
44
81
,71
38
,84
77
17
2,2
39
8,6
22
20
,63
56
,22
31
1,8
72
62
,05
02
Univ
ers
ity
42
14
23
28
04
39
11
36
08
42
53
,55
11
7,6
99
19
42
3,5
40
3S
outh
gate
12
68
88
41
91
90
85
81
4,1
67
1,0
73
5,6
79
4,2
15
1,6
62
19
,72
05
Jasp
er
Pla
ce6
51
66
39
81
02
98
19
13
,04
51
,24
45
,16
86
,30
36
01
17
,49
08
Nort
h C
entr
al
29
52
,42
47
26
99
2,4
77
94
13
,53
41
,05
96
,10
97
,17
11
,90
42
6,7
38
9C
ald
er/
Gri
esb
ach
19
96
13
90
23
49
06
17
33
71
,12
71
,78
81
58
4,6
05
10
Londonderr
y6
71
66
15
31
01
75
16
72
,84
04
91
2,5
09
3,3
46
34
71
0,2
71
11
Beverl
y7
02
50
25
72
01
98
20
78
45
13
82
,62
81
,22
02
41
6,0
74
13
Cap
ilan
o3
16
2,7
80
79
21
29
1,3
98
1,3
28
1,5
57
1,0
46
4,5
00
2,6
73
93
41
7,4
52
14
Bonnie
D
oon
72
05
,59
91
,91
92
02
1,9
67
3,5
42
2,4
56
1,2
86
5,7
66
1,6
18
48
32
5,5
58
22
CB
D Fr
inge
11
41
,57
55
95
25
18
47
63
62
,87
31
,74
79
,95
91
1,2
94
4,7
15
34
,60
5In
ner
Cit
y T
ota
l2
,18
91
4,4
67
6,1
73
2,4
35
17
,78
98
,51
22
4,7
80
17
,46
86
7,6
31
63
,55
02
3,1
12
24
8,1
06
7N
ort
hw
est
In
dust
rial
26
78
,00
33
,56
41
70
5,7
89
9,2
84
5,5
00
2,3
05
10
,71
49
89
79
14
7,3
76
16
South
In
dust
rial
73
33
,83
01
,14
62
31
,07
02
,40
33
,31
07
48
4,6
71
33
07
18
18
,98
01
7M
ista
tim
14
43
,88
59
20
20
71
,75
92
,60
91
,26
74
64
2,0
75
13
95
61
3,5
24
20
South
east
In
dust
rial
86
36
,92
62
,33
92
67
1,9
58
2,3
63
2,6
58
66
05
,51
51
78
19
12
3,9
18
31
Clo
verb
ar
16
61
,78
03
71
10
94
72
13
91
20
28
39
95
22
3,6
12
Su
bu
rban
Non
-Resi
den
tial Tota
l2
,17
32
4,4
24
8,3
40
77
41
1,0
49
16
,79
81
2,8
55
4,2
05
23
,37
41
,64
21
,77
81
07
,41
14
Riv
erb
end
67
11
01
71
01
18
12
45
90
54
51
,83
41
,97
41
23
5,6
56
6W
est
Ja
sper
Pla
ce9
93
96
32
70
56
14
11
6,4
32
1,1
11
7,4
83
1,9
85
14
51
8,9
49
12
Cla
revie
w3
14
25
26
37
32
73
28
21
,99
83
60
1,7
99
1,1
50
17
86
,83
21
5M
ill
Woods
71
10
62
28
04
08
12
21
,58
86
31
3,4
33
5,8
32
18
71
2,6
05
18
Cast
le D
ow
ns
72
43
93
92
25
40
43
14
1,7
63
53
02
,66
52
,12
33
11
9,0
38
19
Lake D
istr
ict
21
38
26
40
38
07
27
22
32
51
,40
31
,76
77
25
,06
42
1M
eadow
s4
73
51
10
01
07
94
36
16
38
31
1,1
81
43
2,9
62
23
Kask
itayo
60
11
81
62
10
11
71
49
2,4
59
71
04
,00
72
,32
51
83
10
,29
92
4Ellers
lie
14
61
,21
05
05
80
51
85
87
1,7
35
48
23
,03
01
,19
41
44
9,6
31
25
Heri
tage V
alley
73
14
41
34
78
26
95
18
13
09
33
84
07
23
,00
22
6W
inderm
ere
65
26
41
92
41
24
15
77
02
14
31
,09
27
69
12
13
,63
22
7W
est
Edm
onto
n5
61
87
20
61
01
59
12
06
53
19
91
,36
81
,45
21
03
4,5
12
28
Win
terb
urn
13
51
,19
98
06
44
55
86
65
1,0
62
31
12
,02
72
65
56
7,1
28
29
Land
Bank
96
27
00
10
10
00
15
03
71
52
93
0N
ort
heast
Edm
onto
n1
69
01
50
25
04
51
01
87
1,2
97
74
1,8
21
Su
bu
rban
Resi
den
tial Tota
l1
,20
74
,69
83
,77
52
52
3,8
44
3,0
90
20
,70
25
,65
13
2,1
07
24
,15
32
,18
31
01
,66
1Tota
l5
,56
94
3,5
88
18
,28
73
,46
13
2,6
82
28
,40
05
8,3
36
27
,32
31
23
,11
28
9,3
45
27
,07
34
57
,17
7
Population & Employment Forecasts: 2003 to 2030 - City of Edmonton - Summary Report
Applications Management Consulting Ltd. - May 2005 48
App
endi
x G
: Ba
se C
ase
Empl
oym
ent b
y Tr
affic
Dist
rict a
nd In
dust
ry
2030
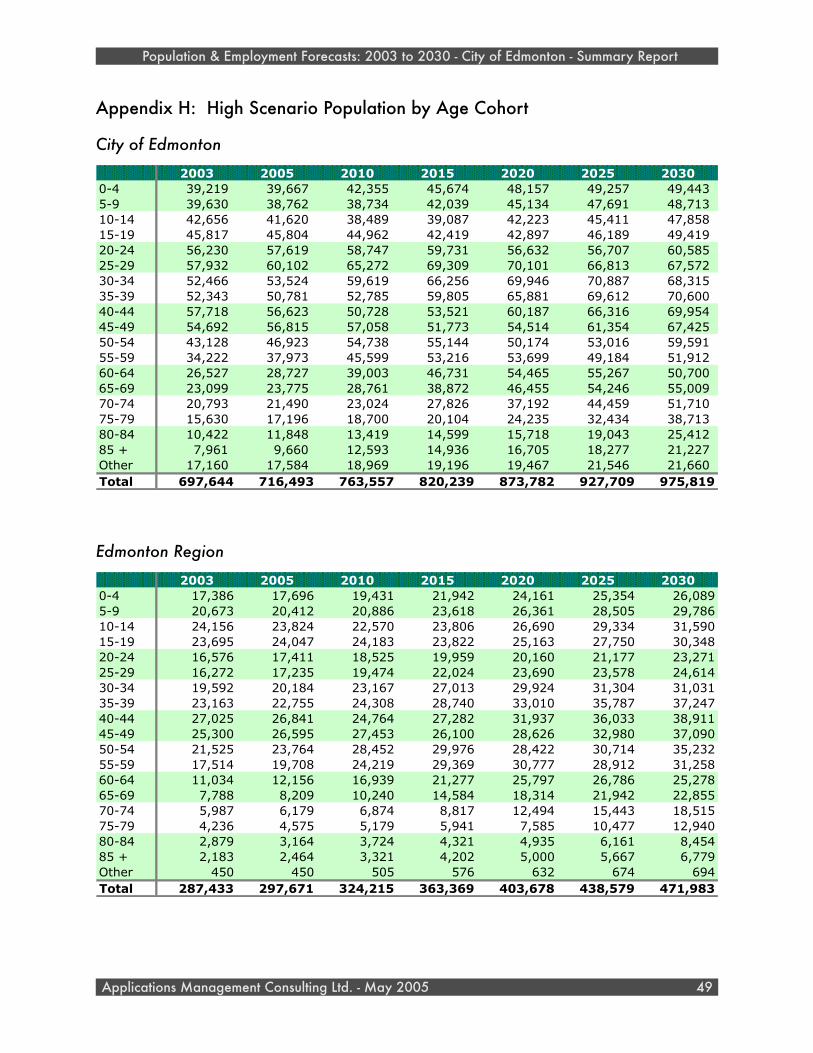
Appendix H: High Scenario Population by Age Cohort
City of Edmonton
2003 2005 2010 2015 2020 2025 20300-4 39,219 39,667 42,355 45,674 48,157 49,257 49,443 5-9 39,630 38,762 38,734 42,039 45,134 47,691 48,713 10-14 42,656 41,620 38,489 39,087 42,223 45,411 47,858 15-19 45,817 45,804 44,962 42,419 42,897 46,189 49,419 20-24 56,230 57,619 58,747 59,731 56,632 56,707 60,585 25-29 57,932 60,102 65,272 69,309 70,101 66,813 67,572 30-34 52,466 53,524 59,619 66,256 69,946 70,887 68,315 35-39 52,343 50,781 52,785 59,805 65,881 69,612 70,600 40-44 57,718 56,623 50,728 53,521 60,187 66,316 69,954 45-49 54,692 56,815 57,058 51,773 54,514 61,354 67,425 50-54 43,128 46,923 54,738 55,144 50,174 53,016 59,591 55-59 34,222 37,973 45,599 53,216 53,699 49,184 51,912 60-64 26,527 28,727 39,003 46,731 54,465 55,267 50,700 65-69 23,099 23,775 28,761 38,872 46,455 54,246 55,009 70-74 20,793 21,490 23,024 27,826 37,192 44,459 51,710 75-79 15,630 17,196 18,700 20,104 24,235 32,434 38,713 80-84 10,422 11,848 13,419 14,599 15,718 19,043 25,412 85 + 7,961 9,660 12,593 14,936 16,705 18,277 21,227 Other 17,160 17,584 18,969 19,196 19,467 21,546 21,660 Total 697,644 716,493 763,557 820,239 873,782 927,709 975,819
Edmonton Region
2003 2005 2010 2015 2020 2025 20300-4 17,386 17,696 19,431 21,942 24,161 25,354 26,0895-9 20,673 20,412 20,886 23,618 26,361 28,505 29,78610-14 24,156 23,824 22,570 23,806 26,690 29,334 31,59015-19 23,695 24,047 24,183 23,822 25,163 27,750 30,34820-24 16,576 17,411 18,525 19,959 20,160 21,177 23,27125-29 16,272 17,235 19,474 22,024 23,690 23,578 24,61430-34 19,592 20,184 23,167 27,013 29,924 31,304 31,03135-39 23,163 22,755 24,308 28,740 33,010 35,787 37,24740-44 27,025 26,841 24,764 27,282 31,937 36,033 38,91145-49 25,300 26,595 27,453 26,100 28,626 32,980 37,09050-54 21,525 23,764 28,452 29,976 28,422 30,714 35,23255-59 17,514 19,708 24,219 29,369 30,777 28,912 31,25860-64 11,034 12,156 16,939 21,277 25,797 26,786 25,27865-69 7,788 8,209 10,240 14,584 18,314 21,942 22,85570-74 5,987 6,179 6,874 8,817 12,494 15,443 18,51575-79 4,236 4,575 5,179 5,941 7,585 10,477 12,94080-84 2,879 3,164 3,724 4,321 4,935 6,161 8,45485 + 2,183 2,464 3,321 4,202 5,000 5,667 6,779Other 450 450 505 576 632 674 694Total 287,433 297,671 324,215 363,369 403,678 438,579 471,983
Population & Employment Forecasts: 2003 to 2030 - City of Edmonton - Summary Report
Applications Management Consulting Ltd. - May 2005 49
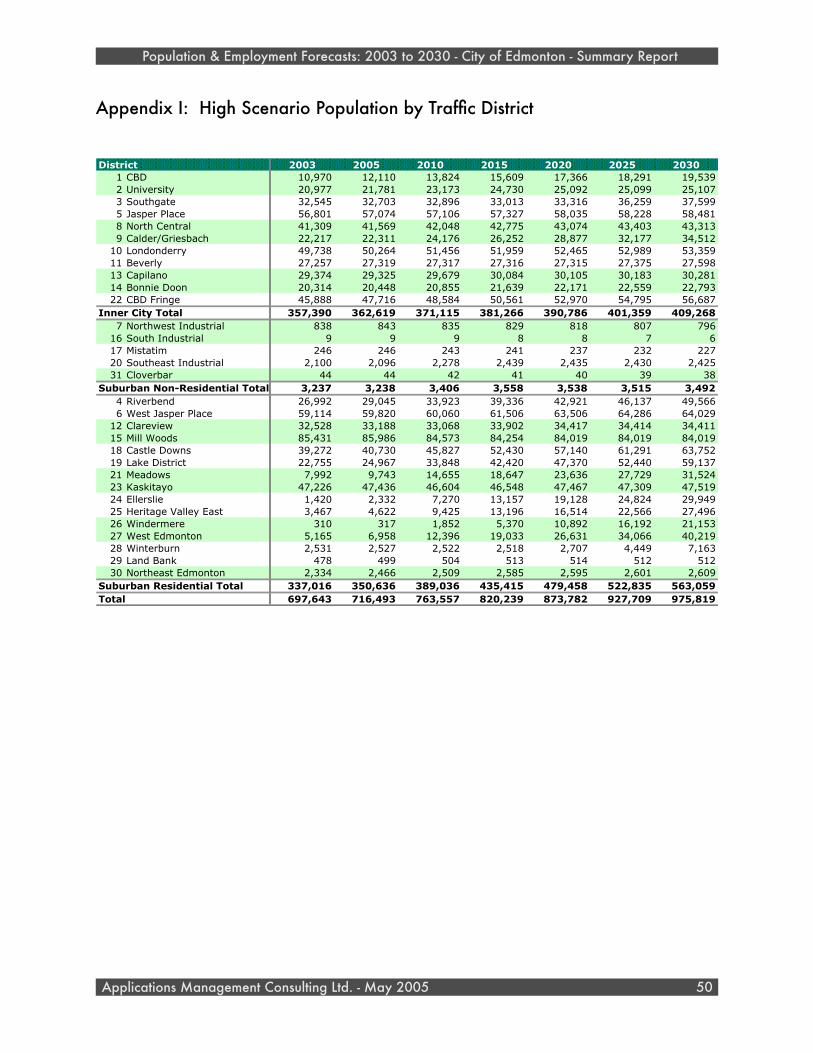
Appendix I: High Scenario Population by Traffic District
District 2003 2005 2010 2015 2020 2025 20301 CBD 10,970 12,110 13,824 15,609 17,366 18,291 19,5392 University 20,977 21,781 23,173 24,730 25,092 25,099 25,1073 Southgate 32,545 32,703 32,896 33,013 33,316 36,259 37,5995 Jasper Place 56,801 57,074 57,106 57,327 58,035 58,228 58,4818 North Central 41,309 41,569 42,048 42,775 43,074 43,403 43,3139 Calder/Griesbach 22,217 22,311 24,176 26,252 28,877 32,177 34,512
10 Londonderry 49,738 50,264 51,456 51,959 52,465 52,989 53,35911 Beverly 27,257 27,319 27,317 27,316 27,315 27,375 27,59813 Capilano 29,374 29,325 29,679 30,084 30,105 30,183 30,28114 Bonnie Doon 20,314 20,448 20,855 21,639 22,171 22,559 22,79322 CBD Fringe 45,888 47,716 48,584 50,561 52,970 54,795 56,687
Inner City Total 357,390 362,619 371,115 381,266 390,786 401,359 409,2687 Northwest Industrial 838 843 835 829 818 807 796
16 South Industrial 9 9 9 8 8 7 617 Mistatim 246 246 243 241 237 232 22720 Southeast Industrial 2,100 2,096 2,278 2,439 2,435 2,430 2,42531 Cloverbar 44 44 42 41 40 39 38
Suburban Non-Residential Total 3,237 3,238 3,406 3,558 3,538 3,515 3,4924 Riverbend 26,992 29,045 33,923 39,336 42,921 46,137 49,5666 West Jasper Place 59,114 59,820 60,060 61,506 63,506 64,286 64,029
12 Clareview 32,528 33,188 33,068 33,902 34,417 34,414 34,41115 Mill Woods 85,431 85,986 84,573 84,254 84,019 84,019 84,01918 Castle Downs 39,272 40,730 45,827 52,430 57,140 61,291 63,75219 Lake District 22,755 24,967 33,848 42,420 47,370 52,440 59,13721 Meadows 7,992 9,743 14,655 18,647 23,636 27,729 31,52423 Kaskitayo 47,226 47,436 46,604 46,548 47,467 47,309 47,51924 Ellerslie 1,420 2,332 7,270 13,157 19,128 24,824 29,94925 Heritage Valley East 3,467 4,622 9,425 13,196 16,514 22,566 27,49626 Windermere 310 317 1,852 5,370 10,892 16,192 21,15327 West Edmonton 5,165 6,958 12,396 19,033 26,631 34,066 40,21928 Winterburn 2,531 2,527 2,522 2,518 2,707 4,449 7,16329 Land Bank 478 499 504 513 514 512 51230 Northeast Edmonton 2,334 2,466 2,509 2,585 2,595 2,601 2,609
Suburban Residential Total 337,016 350,636 389,036 435,415 479,458 522,835 563,059Total 697,643 716,493 763,557 820,239 873,782 927,709 975,819
Population & Employment Forecasts: 2003 to 2030 - City of Edmonton - Summary Report
Applications Management Consulting Ltd. - May 2005 50
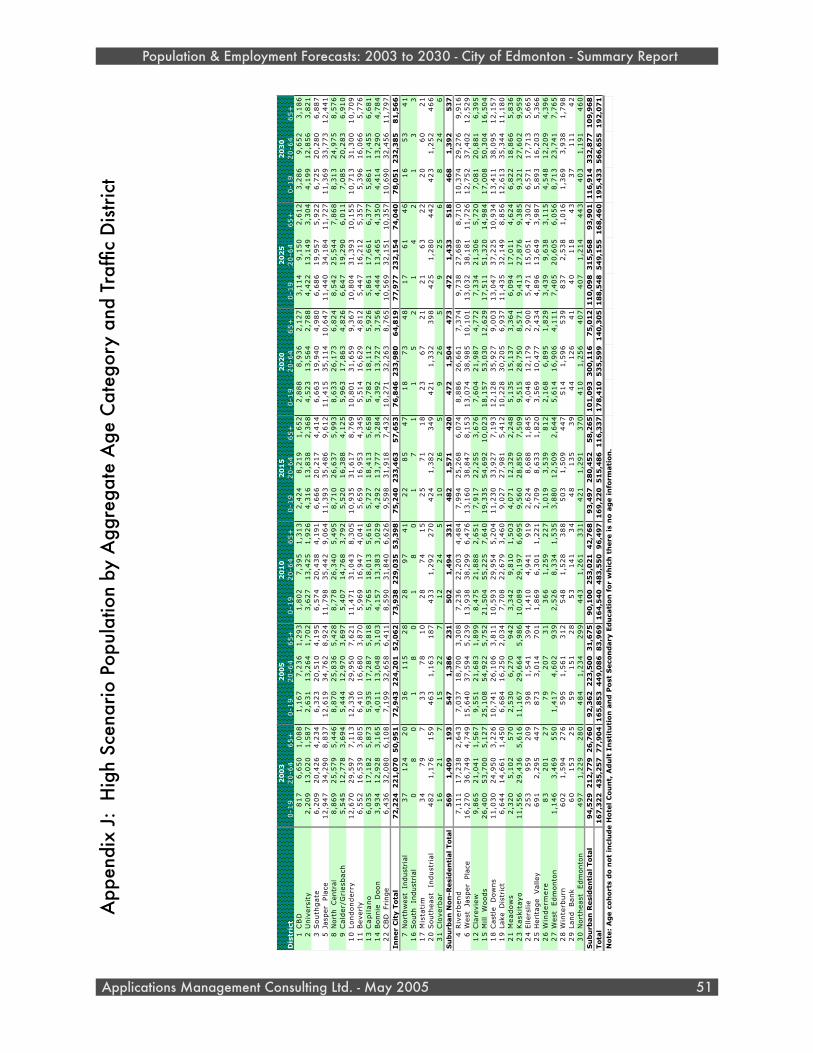
20
03
20
05
20
10
20
15
20
20
20
25
20
30
Dis
tric
t0
-19
20
-64
65+
0-1
92
0-6
465+
0-1
92
0-6
465+
0-1
92
0-6
465+
0-1
92
0-6
465+
0-1
92
0-6
465+
0-1
92
0-6
465+
1C
BD
81
76
,65
01
,08
81
,16
77
,23
61
,29
31
,80
27
,39
51
,31
32
,42
48
,21
91
,65
22
,88
88
,93
62
,12
73
,11
49
,15
02
,61
23
,28
69
,65
23
,18
62
Univ
ers
ity
2,2
09
13
,02
01
,58
72
,63
11
3,2
64
1,7
02
3,6
27
13
,42
51
,92
64
,31
61
3,8
38
2,3
68
4,5
23
13
,56
42
,78
84
,42
21
3,1
49
3,3
04
4,1
99
12
,85
63
,82
13
South
gate
6,2
09
20
,42
64
,23
46
,32
32
0,5
10
4,1
95
6,5
74
20
,43
84
,19
16
,66
62
0,2
17
4,4
14
6,6
63
19
,94
04
,98
06
,68
61
9,9
57
5,9
22
6,7
25
20
,28
06
,88
75
Jasp
er
Pla
ce1
2,9
47
34
,29
08
,83
71
2,6
19
34
,76
28
,92
41
1,7
98
35
,44
29
,06
41
1,3
93
35
,48
69
,61
21
1,4
15
35
,11
41
0,6
47
11
,44
03
4,1
84
11
,72
71
1,3
69
33
,77
31
2,4
41
8N
ort
h C
entr
al
8,8
69
25
,57
95
,44
68
,87
02
5,8
36
5,4
28
8,7
78
26
,34
05
,49
58
,71
02
6,6
37
5,9
93
8,6
33
26
,17
36
,82
48
,54
22
5,5
44
7,8
68
8,3
13
24
,97
58
,57
69
Cald
er/
Gri
esb
ach
5,5
45
12
,77
83
,69
45
,44
41
2,9
70
3,6
97
5,4
07
14
,76
83
,79
25
,52
01
6,3
88
4,1
25
5,9
63
17
,86
34
,82
66
,64
71
9,2
90
6,0
11
7,0
85
20
,28
36
,91
01
0Londonderr
y1
2,6
70
29
,59
77
,11
31
2,3
36
29
,95
07
,62
11
1,4
71
31
,04
38
,30
51
0,9
35
31
,61
78
,76
91
0,8
01
31
,65
99
,36
71
0,8
04
31
,39
31
0,1
55
10
,71
33
1,3
00
10
,70
91
1B
everl
y6
,55
21
6,5
39
3,8
05
6,4
10
16
,68
03
,87
05
,96
91
6,9
47
4,0
41
5,6
59
16
,95
34
,34
55
,51
41
6,6
29
4,8
12
5,4
47
16
,21
25
,35
75
,39
61
6,0
66
5,7
76
13
Cap
ilan
o6
,03
51
7,1
82
5,8
73
5,9
35
17
,28
75
,81
85
,76
51
8,0
13
5,6
16
5,7
27
18
,41
35
,65
85
,78
21
8,1
12
5,9
26
5,8
61
17
,66
16
,37
75
,86
11
7,4
55
6,6
81
14
Bonnie
D
oon
3,9
34
12
,92
83
,16
54
,01
11
3,0
48
3,1
03
4,1
57
13
,38
33
,02
94
,29
21
3,7
77
3,2
84
4,3
92
13
,72
73
,75
64
,44
41
3,4
65
4,3
50
4,4
14
13
,29
04
,78
42
2C
BD
Fr
inge
6,4
36
32
,08
06
,10
87
,19
93
2,6
58
6,4
11
8,5
90
31
,84
06
,62
69
,59
83
1,9
18
7,4
32
10
,27
13
2,2
63
8,7
65
10
,56
93
2,1
51
10
,35
71
0,6
90
32
,45
61
1,7
97
Inn
er
Cit
y T
ota
l7
2,2
24
22
1,0
70
50
,95
17
2,9
43
22
4,2
01
52
,06
27
3,9
38
22
9,0
35
53
,39
87
5,2
40
23
3,4
63
57
,65
37
6,8
46
23
3,9
80
64
,81
97
7,9
77
23
2,1
54
74
,04
07
8,0
51
23
2,3
85
81
,56
67
Nort
hw
est
In
dust
rial
37
12
42
03
61
15
28
28
97
41
22
85
47
18
73
48
17
61
46
16
53
41
16
South
In
dust
rial
08
01
80
18
01
71
15
21
42
13
31
7M
ista
tim
34
79
73
37
81
02
87
41
52
57
11
82
36
72
12
16
32
22
06
02
12
0S
outh
east
In
dust
rial
48
21
,17
61
59
46
31
,16
31
87
43
31
,29
22
70
42
41
,38
23
49
42
11
,33
23
98
42
51
,28
04
42
42
31
,25
24
66
31
Clo
verb
ar
16
21
71
52
27
12
24
51
02
65
92
65
92
56
82
46
Su
bu
rban
Non
-Resi
den
tial Tota
l5
69
1,4
09
19
35
47
1,3
86
23
15
02
1,4
94
33
14
82
1,5
71
42
04
72
1,5
04
47
34
72
1,4
33
51
84
68
1,3
92
53
74
Riv
erb
end
7,1
11
17
,23
82
,64
37
,03
71
8,7
00
3,3
08
7,2
36
22
,20
34
,48
47
,99
42
5,2
68
6,0
74
8,8
86
26
,66
17
,37
49
,73
82
7,6
89
8,7
10
10
,37
42
9,2
76
9,9
16
6W
est
Ja
sper
Pla
ce1
6,2
70
36
,74
94
,74
91
5,6
40
37
,59
45
,23
91
3,9
38
38
,29
96
,47
61
3,1
60
38
,84
78
,15
31
3,0
74
38
,98
51
0,1
01
13
,03
23
8,1
81
11
,72
61
2,7
52
37
,40
21
2,5
29
12
Cla
revie
w9
,86
52
1,0
41
1,5
67
9,5
51
21
,68
31
,89
98
,47
52
1,8
88
2,6
51
7,9
17
22
,25
53
,67
67
,60
42
1,9
87
4,7
72
7,3
34
21
,30
65
,72
07
,08
12
0,8
81
6,3
95
15
Mill
Woods
26
,40
05
3,7
00
5,1
27
25
,10
85
4,9
22
5,7
52
21
,50
45
5,2
25
7,6
40
19
,33
55
4,6
92
10
,02
31
8,1
57
53
,03
01
2,6
29
17
,51
15
1,3
20
14
,98
41
7,0
08
50
,30
41
6,5
04
18
Cast
le D
ow
ns
11
,03
02
4,9
50
3,2
26
10
,74
12
6,1
06
3,8
11
10
,59
32
9,9
54
5,2
04
11
,23
03
3,9
27
7,1
93
12
,12
83
5,9
27
9,0
03
13
,04
73
7,2
25
10
,93
41
3,4
11
38
,09
51
2,1
57
19
Lake D
istr
ict
6,6
44
14
,66
11
,45
06
,68
41
6,2
50
2,0
34
7,7
08
22
,67
93
,46
09
,02
72
7,9
81
5,4
12
10
,22
83
0,2
05
6,9
37
11
,43
53
2,1
49
8,8
56
12
,61
33
5,3
44
11
,18
02
1M
eadow
s2
,32
05
,10
25
70
2,5
30
6,2
70
94
23
,34
29
,81
01
,50
34
,07
11
2,3
29
2,2
48
5,1
35
15
,13
73
,36
46
,09
41
7,0
11
4,6
24
6,8
22
18
,86
65
,83
62
3K
ask
itayo
11
,55
62
9,4
36
5,6
16
11
,16
72
9,6
64
5,9
86
10
,08
92
9,1
97
6,6
95
9,5
60
28
,85
07
,50
99
,51
52
8,7
50
8,5
71
9,4
13
27
,87
69
,38
59
,32
12
7,6
02
9,9
59
24
Ellers
lie
25
39
59
20
93
98
1,5
41
39
41
,41
04
,94
19
19
2,6
24
8,6
88
1,8
45
4,0
48
12
,17
92
,90
05
,47
11
5,0
51
4,3
02
6,5
71
17
,71
35
,66
52
5H
eri
tage V
alley
69
12
,29
54
47
87
33
,01
47
01
1,8
69
6,3
01
1,2
21
2,7
09
8,6
33
1,8
20
3,5
69
10
,47
72
,43
44
,89
61
3,6
49
3,9
87
5,8
93
16
,20
35
,36
62
6W
inderm
ere
83
20
12
77
92
07
31
36
61
,25
92
27
1,0
19
3,5
39
81
22
,16
86
,89
51
,82
93
,43
99
,63
83
,11
54
,54
81
2,2
09
4,3
96
27
West
Edm
onto
n1
,14
63
,46
95
50
1,4
17
4,6
02
93
92
,52
68
,33
41
,53
53
,88
01
2,5
09
2,6
44
5,6
14
16
,90
64
,11
17
,40
52
0,6
05
6,0
56
8,7
13
23
,74
17
,76
52
8W
inte
rburn
60
21
,59
42
76
59
51
,56
13
12
54
81
,52
83
88
50
31
,50
94
47
51
41
,59
65
39
83
72
,53
81
,01
61
,36
93
,93
81
,79
82
9La
nd
Bank
60
15
32
55
91
51
28
53
14
13
44
81
35
39
44
12
64
14
01
18
43
37
11
14
23
0N
ort
heast
Edm
onto
n4
97
1,2
29
28
04
84
1,2
34
29
94
43
1,2
61
33
14
21
1,2
91
37
04
10
1,2
56
40
74
07
1,2
14
44
34
03
1,1
91
46
0S
ub
urb
an
Resi
den
tial Tota
l9
4,5
29
21
2,7
79
26
,76
09
2,3
62
22
3,5
00
31
,67
59
0,1
00
25
3,0
21
42
,76
89
3,4
97
28
0,4
52
58
,26
51
01
,09
33
00
,11
67
5,0
12
11
0,0
98
31
5,5
68
93
,90
11
16
,91
43
32
,87
71
09
,96
8Tota
l1
67
,32
24
35
,25
77
7,9
04
16
5,8
53
44
9,0
86
83
,96
91
64
,54
04
83
,55
09
6,4
97
16
9,2
20
51
5,4
86
11
6,3
37
17
8,4
10
53
5,5
99
14
0,3
05
18
8,5
48
54
9,1
55
16
8,4
60
19
5,4
33
56
6,6
55
19
2,0
71
No
te:
Ag
e c
oh
ort
s d
o n
ot
incl
ud
e H
ote
l C
ou
nt,
Ad
ult
In
stit
uti
on
an
d P
ost
Seco
nd
ary
Ed
uca
tio
n f
or
wh
ich
th
ere
is
no
ag
e i
nfo
rmati
on
.
Population & Employment Forecasts: 2003 to 2030 - City of Edmonton - Summary Report
Applications Management Consulting Ltd. - May 2005 51
App
endi
x J:
Hig
h Sc
enar
io P
opul
atio
n by
Agg
rega
te A
ge C
ateg
ory
and
Traf
fic D
istric
t
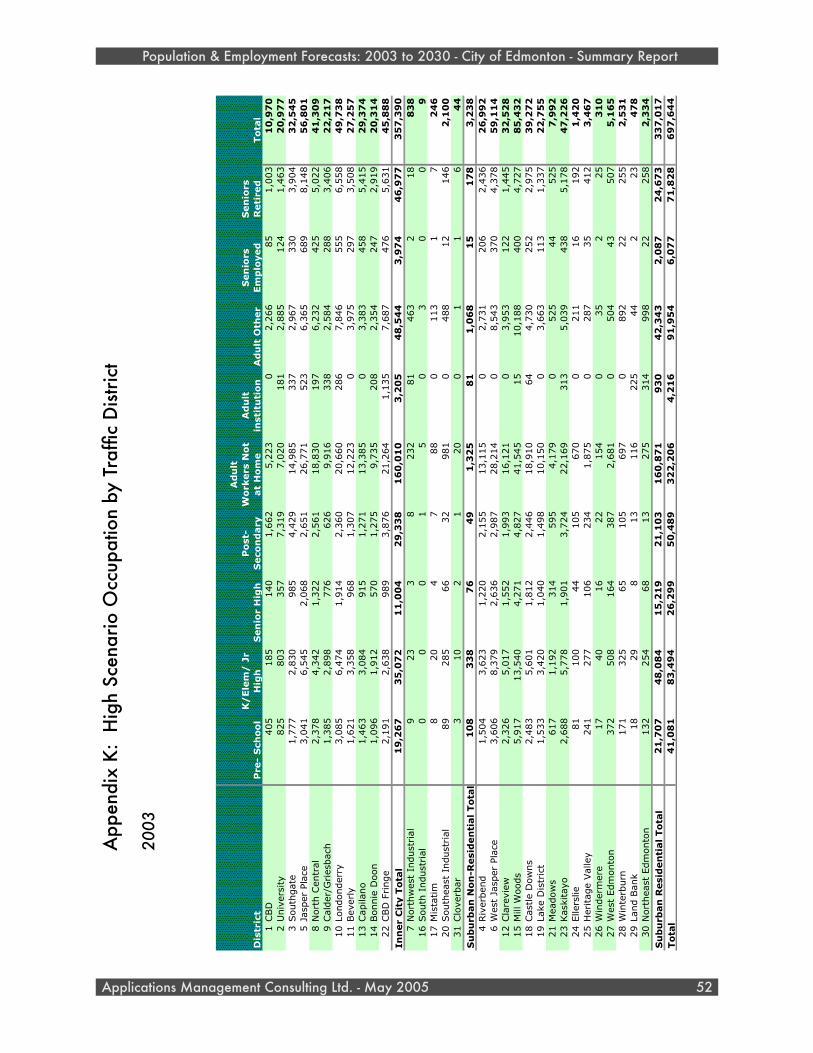
Pre
- S
cho
ol
K/
Ele
m/
Jr
Hig
hS
en
ior
Hig
hP
ost
-S
eco
nd
ary
Ad
ult
W
ork
ers
No
t at
Ho
me
Ad
ult
in
stit
uti
on
Ad
ult
Oth
er
Sen
iors
Em
plo
yed
Sen
iors
R
eti
red
To
tal
1CBD
405
185
140
1,6
62
5,2
23
02,2
66
85
1,0
03
10
,97
02
Univ
ersi
ty825
803
357
7,3
19
7,0
20
181
2,8
85
124
1,4
63
20
,97
73
South
gat
e1,7
77
2,8
30
985
4,4
29
14,9
85
337
2,9
67
330
3,9
04
32
,54
55
Jasp
er P
lace
3,0
41
6,5
45
2,0
68
2,6
51
26,7
71
523
6,3
65
689
8,1
48
56
,80
18
Nort
h C
entr
al2,3
78
4,3
42
1,3
22
2,5
61
18,8
30
197
6,2
32
425
5,0
22
41
,30
99
Cal
der
/Gries
bac
h1,3
85
2,8
98
776
626
9,9
16
338
2,5
84
288
3,4
06
22
,21
710
Londonder
ry3,0
85
6,4
74
1,9
14
2,3
60
20,6
60
286
7,8
46
555
6,5
58
49
,73
811
Bev
erly
1,6
21
3,3
58
968
1,3
07
12,2
23
03,9
75
297
3,5
08
27
,25
713
Cap
ilano
1,4
63
3,0
84
915
1,2
71
13,3
85
03,3
83
458
5,4
15
29
,37
414
Bonnie
Doon
1,0
96
1,9
12
570
1,2
75
9,7
35
208
2,3
54
247
2,9
19
20
,31
422
CBD
Fringe
2,1
91
2,6
38
989
3,8
76
21,2
64
1,1
35
7,6
87
476
5,6
31
45
,88
81
9,2
67
35
,07
21
1,0
04
29
,33
81
60
,01
03
,20
54
8,5
44
3,9
74
46
,97
73
57
,39
07
Nort
hw
est
Indust
rial
923
38
232
81
463
218
83
816
South
Indust
rial
00
01
50
30
09
17
Mis
tatim
820
47
88
0113
17
24
620
South
east
Indust
rial
89
285
66
32
981
0488
12
146
2,1
00
31
Clo
verb
ar3
10
21
20
01
16
44
10
83
38
76
49
1,3
25
81
1,0
68
15
17
83
,23
84
Riv
erben
d1,5
04
3,6
23
1,2
20
2,1
55
13,1
15
02,7
31
206
2,4
36
26
,99
26
Wes
t Ja
sper
Pla
ce3,6
06
8,3
79
2,6
36
2,9
87
28,2
14
08,5
43
370
4,3
78
59
,11
412
Cla
revi
ew2,3
26
5,0
17
1,5
52
1,9
93
16,1
21
03,9
53
122
1,4
45
32
,52
815
Mill
Woods
5,9
17
13,5
40
4,2
71
4,8
27
41,5
45
15
10,1
88
400
4,7
27
85
,43
218
Cas
tle
Dow
ns
2,4
83
5,6
01
1,8
12
2,4
46
18,9
10
64
4,7
30
252
2,9
75
39
,27
219
Lake
Dis
tric
t1,5
33
3,4
20
1,0
40
1,4
98
10,1
50
03,6
63
113
1,3
37
22
,75
521
Mea
dow
s617
1,1
92
314
595
4,1
79
0525
44
525
7,9
92
23
Kas
kita
yo2,6
88
5,7
78
1,9
01
3,7
24
22,1
69
313
5,0
39
438
5,1
78
47
,22
624
Elle
rslie
81
100
44
105
670
0211
16
192
1,4
20
25
Her
itag
e Val
ley
241
277
106
234
1,8
75
0287
35
412
3,4
67
26
Win
der
mer
e17
40
16
22
154
035
225
31
027
Wes
t Edm
onto
n372
508
164
387
2,6
81
0504
43
507
5,1
65
28
Win
terb
urn
171
325
65
105
697
0892
22
255
2,5
31
29
Land B
ank
18
29
813
116
225
44
223
47
830
Nort
hea
st E
dm
onto
n132
254
68
13
275
314
998
22
258
2,3
34
21
,70
74
8,0
84
15
,21
92
1,1
03
16
0,8
71
93
04
2,3
43
2,0
87
24
,67
33
37
,01
74
1,0
81
83
,49
42
6,2
99
50
,48
93
22
,20
64
,21
69
1,9
54
6,0
77
71
,82
86
97
,64
4
Dis
tric
t
Inn
er
Cit
y T
ota
l
Su
bu
rban
No
n-R
esi
den
tial To
tal
Su
bu
rban
Resi
den
tial To
tal
To
tal
Population & Employment Forecasts: 2003 to 2030 - City of Edmonton - Summary Report
Applications Management Consulting Ltd. - May 2005 52
App
endi
x K:
Hig
h Sc
enar
io O
ccup
atio
n by
Tra
ffic
Dist
rict
2003
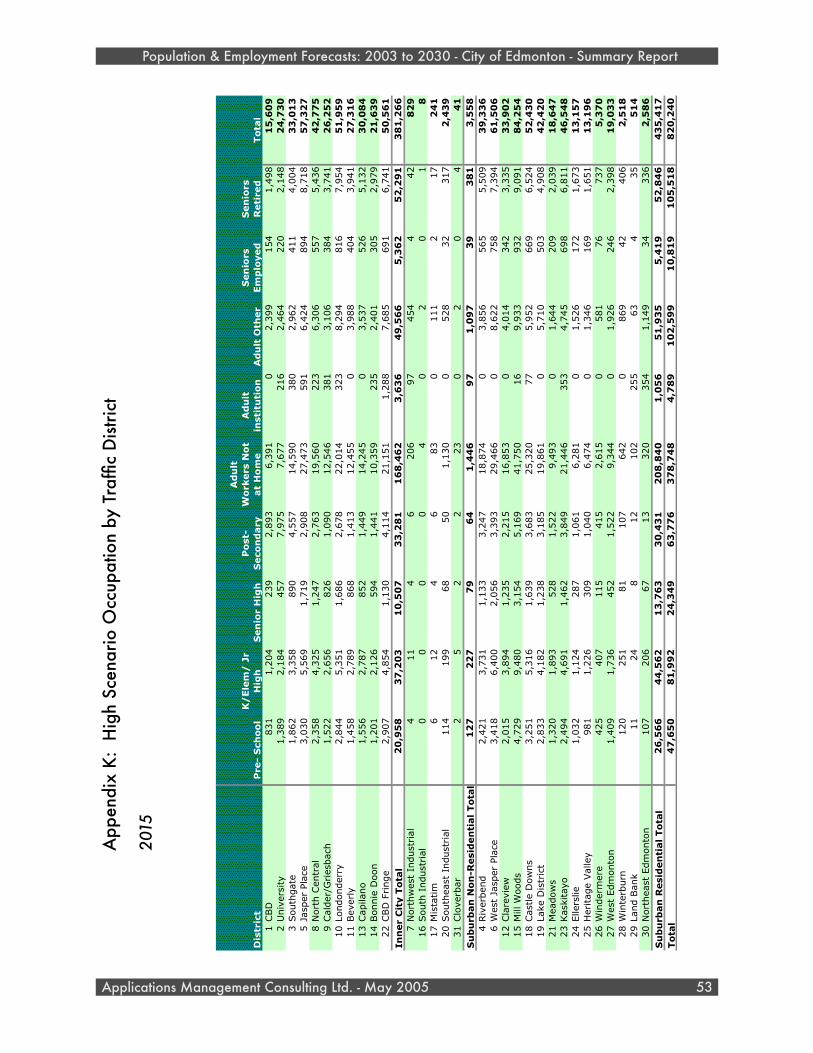
Pre
- S
cho
ol
K/
Ele
m/
Jr
Hig
hS
en
ior
Hig
hP
ost
-S
eco
nd
ary
Ad
ult
W
ork
ers
No
t at
Ho
me
Ad
ult
in
stit
uti
on
Ad
ult
Oth
er
Sen
iors
Em
plo
yed
Sen
iors
R
eti
red
To
tal
1CBD
831
1,2
04
239
2,8
93
6,3
91
02,3
99
154
1,4
98
15
,60
92
Univ
ersi
ty1,3
89
2,1
84
457
7,9
75
7,6
77
216
2,4
64
220
2,1
48
24
,73
03
South
gat
e1,8
62
3,3
58
890
4,5
57
14,5
90
380
2,9
62
411
4,0
04
33
,01
35
Jasp
er P
lace
3,0
30
5,5
69
1,7
19
2,9
08
27,4
73
591
6,4
24
894
8,7
18
57
,32
78
Nort
h C
entr
al2,3
58
4,3
25
1,2
47
2,7
63
19,5
60
223
6,3
06
557
5,4
36
42
,77
59
Cal
der
/Gries
bac
h1,5
22
2,6
56
826
1,0
90
12,5
46
381
3,1
06
384
3,7
41
26
,25
210
Londonder
ry2,8
44
5,3
51
1,6
86
2,6
78
22,0
14
323
8,2
94
816
7,9
54
51
,95
911
Bev
erly
1,4
58
2,7
89
868
1,4
13
12,4
55
03,9
88
404
3,9
41
27
,31
613
Cap
ilano
1,5
56
2,7
87
852
1,4
49
14,2
45
03,5
37
526
5,1
32
30
,08
414
Bonnie
Doon
1,2
01
2,1
26
594
1,4
41
10,3
59
235
2,4
01
305
2,9
79
21
,63
922
CBD
Fringe
2,9
07
4,8
54
1,1
30
4,1
14
21,1
51
1,2
88
7,6
85
691
6,7
41
50
,56
12
0,9
58
37
,20
31
0,5
07
33
,28
11
68
,46
23
,63
64
9,5
66
5,3
62
52
,29
13
81
,26
67
Nort
hw
est
Indust
rial
411
46
206
97
454
442
82
916
South
Indust
rial
00
00
40
20
18
17
Mis
tatim
612
46
83
0111
217
24
120
South
east
Indust
rial
114
199
68
50
1,1
30
0528
32
317
2,4
39
31
Clo
verb
ar2
52
223
02
04
41
12
72
27
79
64
1,4
46
97
1,0
97
39
38
13
,55
84
Riv
erben
d2,4
21
3,7
31
1,1
33
3,2
47
18,8
74
03,8
56
565
5,5
09
39
,33
66
Wes
t Ja
sper
Pla
ce3,4
18
6,4
00
2,0
56
3,3
93
29,4
66
08,6
22
758
7,3
94
61
,50
612
Cla
revi
ew2,0
15
3,8
94
1,2
35
2,2
15
16,8
53
04,0
14
342
3,3
35
33
,90
215
Mill
Woods
4,7
29
9,4
80
3,1
54
5,1
69
41,7
50
16
9,9
33
932
9,0
91
84
,25
418
Cas
tle
Dow
ns
3,2
51
5,3
16
1,6
39
3,6
83
25,3
20
77
5,9
52
669
6,5
24
52
,43
019
Lake
Dis
tric
t2,8
33
4,1
82
1,2
38
3,1
85
19,8
61
05,7
10
503
4,9
08
42
,42
021
Mea
dow
s1,3
20
1,8
93
528
1,5
22
9,4
93
01,6
44
209
2,0
39
18
,64
723
Kas
kita
yo2,4
94
4,6
91
1,4
62
3,8
49
21,4
46
353
4,7
45
698
6,8
11
46
,54
824
Elle
rslie
1,0
32
1,1
24
287
1,0
61
6,2
81
01,5
26
172
1,6
73
13
,15
725
Her
itag
e Val
ley
981
1,2
26
309
1,0
40
6,4
74
01,3
46
169
1,6
51
13
,19
626
Win
der
mer
e425
407
115
415
2,6
15
0581
76
737
5,3
70
27
Wes
t Edm
onto
n1,4
09
1,7
36
452
1,5
22
9,3
44
01,9
26
246
2,3
98
19
,03
328
Win
terb
urn
120
251
81
107
642
0869
42
406
2,5
18
29
Land B
ank
11
24
812
102
255
63
435
51
430
Nort
hea
st E
dm
onto
n107
206
67
13
320
354
1,1
49
34
336
2,5
86
26
,56
64
4,5
62
13
,76
33
0,4
31
20
8,8
40
1,0
56
51
,93
55
,41
95
2,8
46
43
5,4
17
47
,65
08
1,9
92
24
,34
96
3,7
76
37
8,7
48
4,7
89
10
2,5
99
10
,81
91
05
,51
88
20
,24
0
Dis
tric
t
Inn
er
Cit
y T
ota
l
Su
bu
rban
No
n-R
esi
den
tial To
tal
Su
bu
rban
Resi
den
tial To
tal
To
tal
Population & Employment Forecasts: 2003 to 2030 - City of Edmonton - Summary Report
Applications Management Consulting Ltd. - May 2005 53
App
endi
x K:
Hig
h Sc
enar
io O
ccup
atio
n by
Tra
ffic
Dist
rict
2015
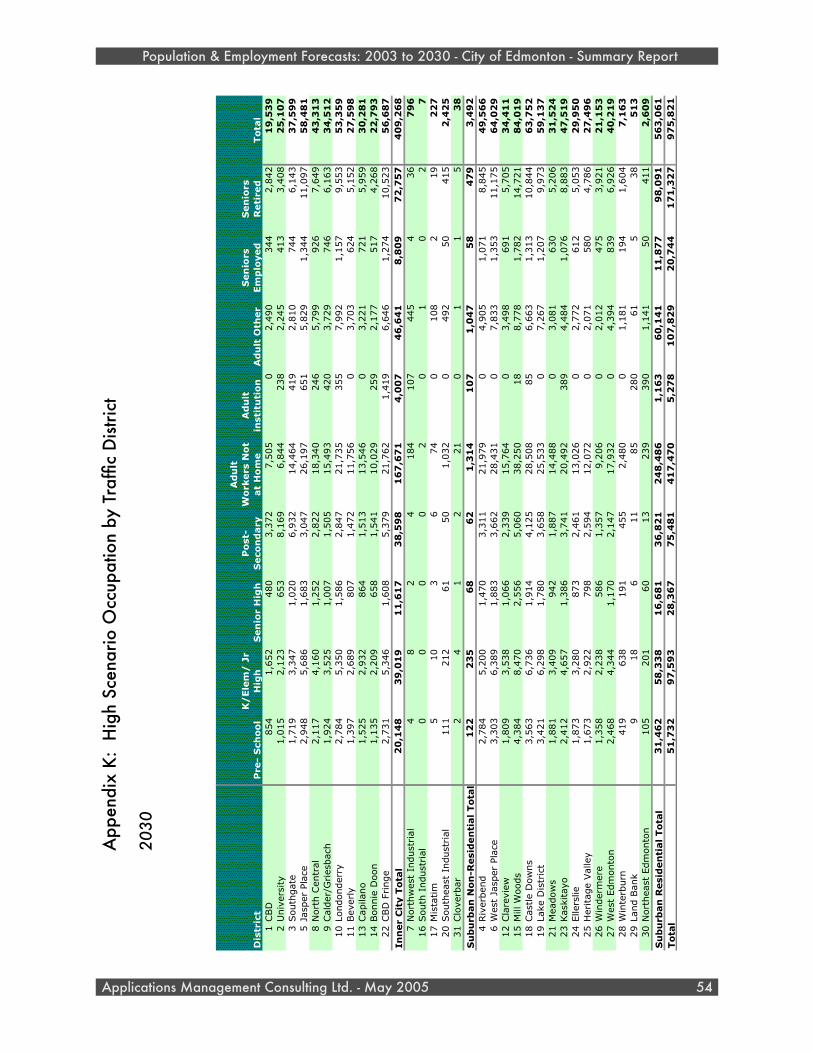
Pre
- S
cho
ol
K/
Ele
m/
Jr
Hig
hS
en
ior
Hig
hP
ost
-S
eco
nd
ary
Ad
ult
W
ork
ers
No
t at
Ho
me
Ad
ult
in
stit
uti
on
Ad
ult
Oth
er
Sen
iors
Em
plo
yed
Sen
iors
R
eti
red
To
tal
1CBD
854
1,6
52
480
3,3
72
7,5
05
02,4
90
344
2,8
42
19
,53
92
Univ
ersi
ty1,0
15
2,1
23
653
8,1
69
6,8
44
238
2,2
45
413
3,4
08
25
,10
73
South
gat
e1,7
19
3,3
47
1,0
20
6,9
32
14,4
64
419
2,8
10
744
6,1
43
37
,59
95
Jasp
er P
lace
2,9
48
5,6
86
1,6
83
3,0
47
26,1
97
651
5,8
29
1,3
44
11,0
97
58
,48
18
Nort
h C
entr
al2,1
17
4,1
60
1,2
52
2,8
22
18,3
40
246
5,7
99
926
7,6
49
43
,31
39
Cal
der
/Gries
bac
h1,9
24
3,5
25
1,0
07
1,5
05
15,4
93
420
3,7
29
746
6,1
63
34
,51
210
Londonder
ry2,7
84
5,3
50
1,5
86
2,8
47
21,7
35
355
7,9
92
1,1
57
9,5
53
53
,35
911
Bev
erly
1,3
97
2,6
89
807
1,4
72
11,7
56
03,7
03
624
5,1
52
27
,59
813
Cap
ilano
1,5
25
2,9
32
864
1,5
13
13,5
46
03,2
21
721
5,9
59
30
,28
114
Bonnie
Doon
1,1
35
2,2
09
658
1,5
41
10,0
29
259
2,1
77
517
4,2
68
22
,79
322
CBD
Fringe
2,7
31
5,3
46
1,6
08
5,3
79
21,7
62
1,4
19
6,6
46
1,2
74
10,5
23
56
,68
72
0,1
48
39
,01
91
1,6
17
38
,59
81
67
,67
14
,00
74
6,6
41
8,8
09
72
,75
74
09
,26
87
Nort
hw
est
Indust
rial
48
24
184
107
445
436
79
616
South
Indust
rial
00
00
20
10
27
17
Mis
tatim
510
36
74
0108
219
22
720
South
east
Indust
rial
111
212
61
50
1,0
32
0492
50
415
2,4
25
31
Clo
verb
ar2
41
221
01
15
38
12
22
35
68
62
1,3
14
10
71
,04
75
84
79
3,4
92
4Riv
erben
d2,7
84
5,2
00
1,4
70
3,3
11
21,9
79
04,9
05
1,0
71
8,8
45
49
,56
66
Wes
t Ja
sper
Pla
ce3,3
03
6,3
89
1,8
83
3,6
62
28,4
31
07,8
33
1,3
53
11,1
75
64
,02
912
Cla
revi
ew1,8
09
3,5
38
1,0
66
2,3
39
15,7
64
03,4
98
691
5,7
05
34
,41
115
Mill
Woods
4,3
84
8,4
70
2,5
56
5,0
60
38,2
50
18
8,7
78
1,7
82
14,7
21
84
,01
918
Cas
tle
Dow
ns
3,5
63
6,7
36
1,9
14
4,1
25
28,5
08
85
6,6
63
1,3
13
10,8
44
63
,75
219
Lake
Dis
tric
t3,4
21
6,2
98
1,7
80
3,6
58
25,5
33
07,2
67
1,2
07
9,9
73
59
,13
721
Mea
dow
s1,8
81
3,4
09
942
1,8
87
14,4
88
03,0
81
630
5,2
06
31
,52
423
Kas
kita
yo2,4
12
4,6
57
1,3
86
3,7
41
20,4
92
389
4,4
84
1,0
76
8,8
83
47
,51
924
Elle
rslie
1,8
73
3,2
80
873
2,4
61
13,0
26
02,7
72
612
5,0
53
29
,95
025
Her
itag
e Val
ley
1,6
73
2,9
22
798
2,5
94
12,0
72
02,0
71
580
4,7
86
27
,49
626
Win
der
mer
e1,3
58
2,2
38
586
1,3
57
9,2
06
02,0
12
475
3,9
21
21
,15
327
Wes
t Edm
onto
n2,4
68
4,3
44
1,1
70
2,1
47
17,9
32
04,3
94
839
6,9
26
40
,21
928
Win
terb
urn
419
638
191
455
2,4
80
01,1
81
194
1,6
04
7,1
63
29
Land B
ank
918
611
85
280
61
538
51
330
Nort
hea
st E
dm
onto
n105
201
60
13
239
390
1,1
41
50
411
2,6
09
31
,46
25
8,3
38
16
,68
13
6,8
21
24
8,4
86
1,1
63
60
,14
11
1,8
77
98
,09
15
63
,06
15
1,7
32
97
,59
32
8,3
67
75
,48
14
17
,47
05
,27
81
07
,82
92
0,7
44
17
1,3
27
97
5,8
21
Dis
tric
t
Inn
er
Cit
y T
ota
l
Su
bu
rban
No
n-R
esi
den
tial To
tal
Su
bu
rban
Resi
den
tial To
tal
To
tal
Population & Employment Forecasts: 2003 to 2030 - City of Edmonton - Summary Report
Applications Management Consulting Ltd. - May 2005 54
App
endi
x K:
Hig
h Sc
enar
io O
ccup
atio
n by
Tra
ffic
Dist
rict
2030
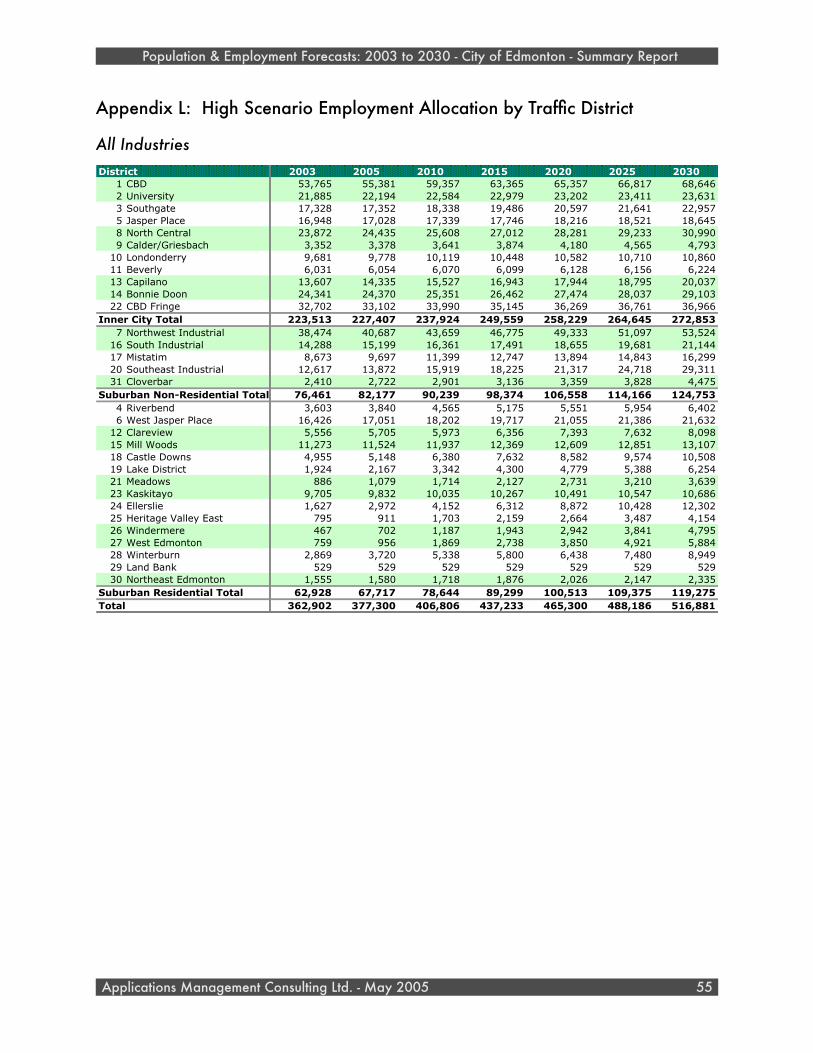
Appendix L: High Scenario Employment Allocation by Traffic District
All IndustriesDistrict 2003 2005 2010 2015 2020 2025 2030
1 CBD 53,765 55,381 59,357 63,365 65,357 66,817 68,6462 University 21,885 22,194 22,584 22,979 23,202 23,411 23,6313 Southgate 17,328 17,352 18,338 19,486 20,597 21,641 22,9575 Jasper Place 16,948 17,028 17,339 17,746 18,216 18,521 18,6458 North Central 23,872 24,435 25,608 27,012 28,281 29,233 30,9909 Calder/Griesbach 3,352 3,378 3,641 3,874 4,180 4,565 4,793
10 Londonderry 9,681 9,778 10,119 10,448 10,582 10,710 10,86011 Beverly 6,031 6,054 6,070 6,099 6,128 6,156 6,22413 Capilano 13,607 14,335 15,527 16,943 17,944 18,795 20,03714 Bonnie Doon 24,341 24,370 25,351 26,462 27,474 28,037 29,10322 CBD Fringe 32,702 33,102 33,990 35,145 36,269 36,761 36,966
Inner City Total 223,513 227,407 237,924 249,559 258,229 264,645 272,8537 Northwest Industrial 38,474 40,687 43,659 46,775 49,333 51,097 53,524
16 South Industrial 14,288 15,199 16,361 17,491 18,655 19,681 21,14417 Mistatim 8,673 9,697 11,399 12,747 13,894 14,843 16,29920 Southeast Industrial 12,617 13,872 15,919 18,225 21,317 24,718 29,31131 Cloverbar 2,410 2,722 2,901 3,136 3,359 3,828 4,475
Suburban Non-Residential Total 76,461 82,177 90,239 98,374 106,558 114,166 124,7534 Riverbend 3,603 3,840 4,565 5,175 5,551 5,954 6,4026 West Jasper Place 16,426 17,051 18,202 19,717 21,055 21,386 21,632
12 Clareview 5,556 5,705 5,973 6,356 7,393 7,632 8,09815 Mill Woods 11,273 11,524 11,937 12,369 12,609 12,851 13,10718 Castle Downs 4,955 5,148 6,380 7,632 8,582 9,574 10,50819 Lake District 1,924 2,167 3,342 4,300 4,779 5,388 6,25421 Meadows 886 1,079 1,714 2,127 2,731 3,210 3,63923 Kaskitayo 9,705 9,832 10,035 10,267 10,491 10,547 10,68624 Ellerslie 1,627 2,972 4,152 6,312 8,872 10,428 12,30225 Heritage Valley East 795 911 1,703 2,159 2,664 3,487 4,15426 Windermere 467 702 1,187 1,943 2,942 3,841 4,79527 West Edmonton 759 956 1,869 2,738 3,850 4,921 5,88428 Winterburn 2,869 3,720 5,338 5,800 6,438 7,480 8,94929 Land Bank 529 529 529 529 529 529 52930 Northeast Edmonton 1,555 1,580 1,718 1,876 2,026 2,147 2,335
Suburban Residential Total 62,928 67,717 78,644 89,299 100,513 109,375 119,275Total 362,902 377,300 406,806 437,233 465,300 488,186 516,881
Population & Employment Forecasts: 2003 to 2030 - City of Edmonton - Summary Report
Applications Management Consulting Ltd. - May 2005 55
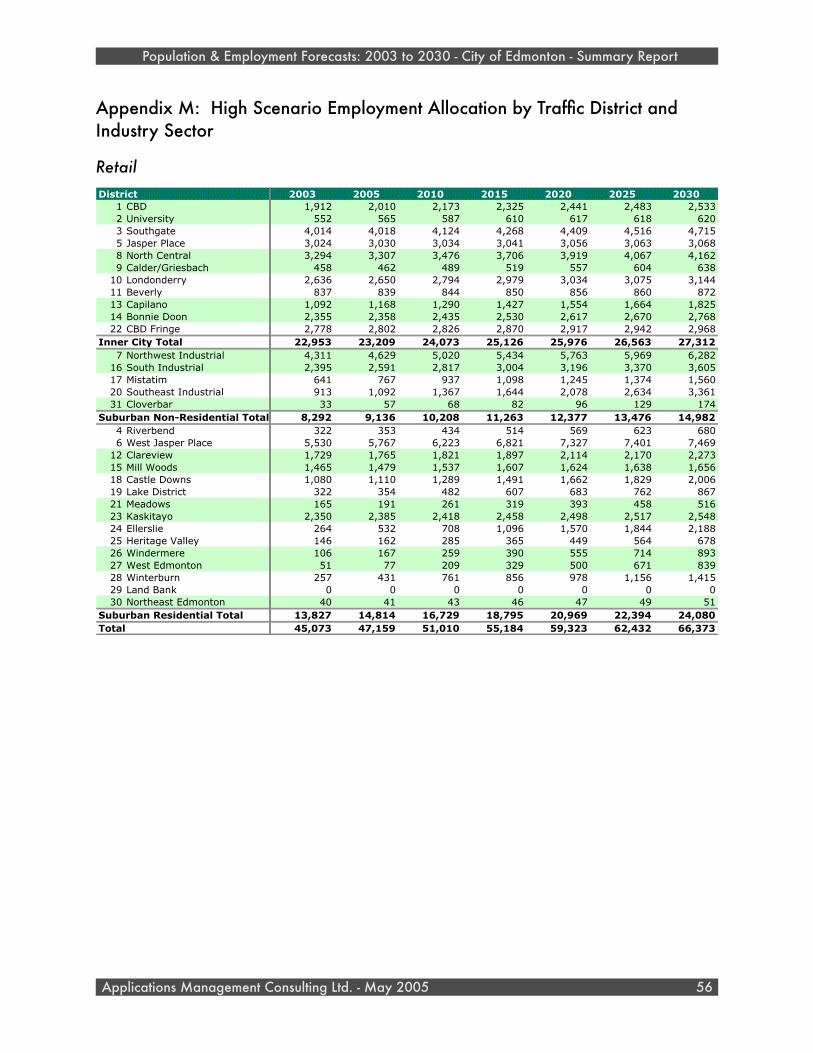
Appendix M: High Scenario Employment Allocation by Traffic District and Industry Sector
RetailDistrict 2003 2005 2010 2015 2020 2025 2030
1 CBD 1,912 2,010 2,173 2,325 2,441 2,483 2,5332 University 552 565 587 610 617 618 6203 Southgate 4,014 4,018 4,124 4,268 4,409 4,516 4,7155 Jasper Place 3,024 3,030 3,034 3,041 3,056 3,063 3,0688 North Central 3,294 3,307 3,476 3,706 3,919 4,067 4,1629 Calder/Griesbach 458 462 489 519 557 604 638
10 Londonderry 2,636 2,650 2,794 2,979 3,034 3,075 3,14411 Beverly 837 839 844 850 856 860 87213 Capilano 1,092 1,168 1,290 1,427 1,554 1,664 1,82514 Bonnie Doon 2,355 2,358 2,435 2,530 2,617 2,670 2,76822 CBD Fringe 2,778 2,802 2,826 2,870 2,917 2,942 2,968
Inner City Total 22,953 23,209 24,073 25,126 25,976 26,563 27,3127 Northwest Industrial 4,311 4,629 5,020 5,434 5,763 5,969 6,282
16 South Industrial 2,395 2,591 2,817 3,004 3,196 3,370 3,60517 Mistatim 641 767 937 1,098 1,245 1,374 1,56020 Southeast Industrial 913 1,092 1,367 1,644 2,078 2,634 3,36131 Cloverbar 33 57 68 82 96 129 174
Suburban Non-Residential Total 8,292 9,136 10,208 11,263 12,377 13,476 14,9824 Riverbend 322 353 434 514 569 623 6806 West Jasper Place 5,530 5,767 6,223 6,821 7,327 7,401 7,469
12 Clareview 1,729 1,765 1,821 1,897 2,114 2,170 2,27315 Mill Woods 1,465 1,479 1,537 1,607 1,624 1,638 1,65618 Castle Downs 1,080 1,110 1,289 1,491 1,662 1,829 2,00619 Lake District 322 354 482 607 683 762 86721 Meadows 165 191 261 319 393 458 51623 Kaskitayo 2,350 2,385 2,418 2,458 2,498 2,517 2,54824 Ellerslie 264 532 708 1,096 1,570 1,844 2,18825 Heritage Valley 146 162 285 365 449 564 67826 Windermere 106 167 259 390 555 714 89327 West Edmonton 51 77 209 329 500 671 83928 Winterburn 257 431 761 856 978 1,156 1,41529 Land Bank 0 0 0 0 0 0 030 Northeast Edmonton 40 41 43 46 47 49 51
Suburban Residential Total 13,827 14,814 16,729 18,795 20,969 22,394 24,080Total 45,073 47,159 51,010 55,184 59,323 62,432 66,373
Population & Employment Forecasts: 2003 to 2030 - City of Edmonton - Summary Report
Applications Management Consulting Ltd. - May 2005 56
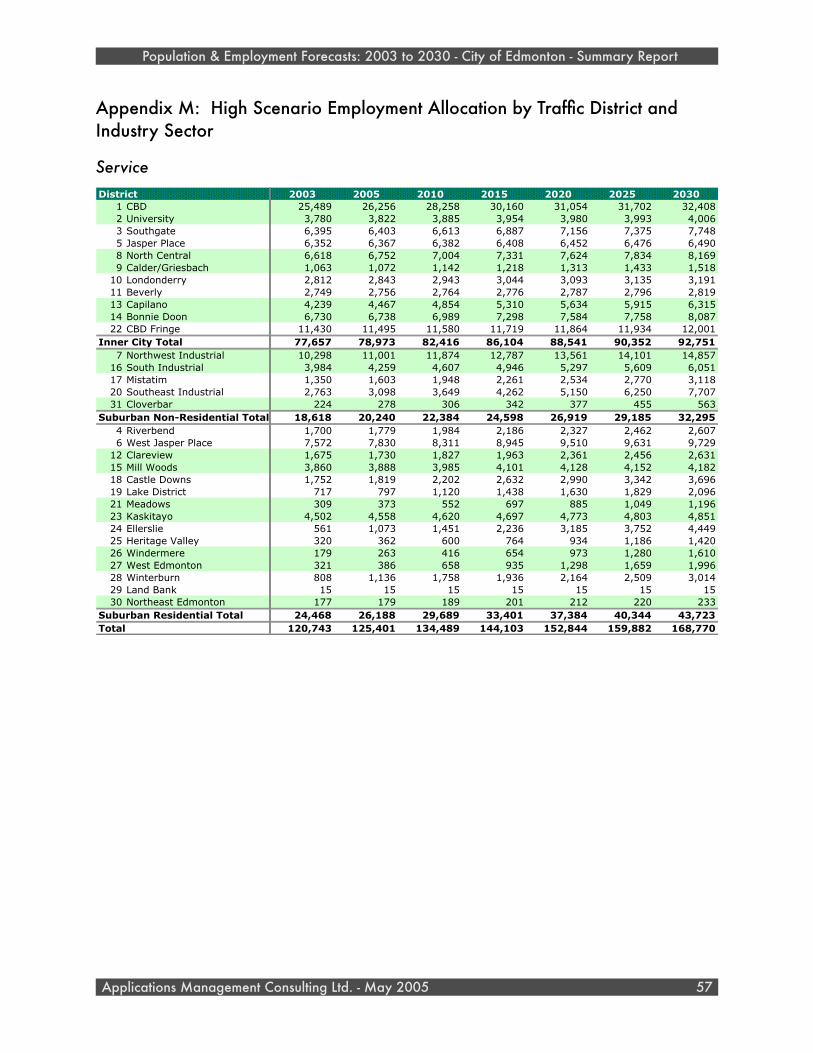
Appendix M: High Scenario Employment Allocation by Traffic District and Industry Sector
ServiceDistrict 2003 2005 2010 2015 2020 2025 2030
1 CBD 25,489 26,256 28,258 30,160 31,054 31,702 32,4082 University 3,780 3,822 3,885 3,954 3,980 3,993 4,0063 Southgate 6,395 6,403 6,613 6,887 7,156 7,375 7,7485 Jasper Place 6,352 6,367 6,382 6,408 6,452 6,476 6,4908 North Central 6,618 6,752 7,004 7,331 7,624 7,834 8,1699 Calder/Griesbach 1,063 1,072 1,142 1,218 1,313 1,433 1,518
10 Londonderry 2,812 2,843 2,943 3,044 3,093 3,135 3,19111 Beverly 2,749 2,756 2,764 2,776 2,787 2,796 2,81913 Capilano 4,239 4,467 4,854 5,310 5,634 5,915 6,31514 Bonnie Doon 6,730 6,738 6,989 7,298 7,584 7,758 8,08722 CBD Fringe 11,430 11,495 11,580 11,719 11,864 11,934 12,001
Inner City Total 77,657 78,973 82,416 86,104 88,541 90,352 92,7517 Northwest Industrial 10,298 11,001 11,874 12,787 13,561 14,101 14,857
16 South Industrial 3,984 4,259 4,607 4,946 5,297 5,609 6,05117 Mistatim 1,350 1,603 1,948 2,261 2,534 2,770 3,11820 Southeast Industrial 2,763 3,098 3,649 4,262 5,150 6,250 7,70731 Cloverbar 224 278 306 342 377 455 563
Suburban Non-Residential Total 18,618 20,240 22,384 24,598 26,919 29,185 32,2954 Riverbend 1,700 1,779 1,984 2,186 2,327 2,462 2,6076 West Jasper Place 7,572 7,830 8,311 8,945 9,510 9,631 9,729
12 Clareview 1,675 1,730 1,827 1,963 2,361 2,456 2,63115 Mill Woods 3,860 3,888 3,985 4,101 4,128 4,152 4,18218 Castle Downs 1,752 1,819 2,202 2,632 2,990 3,342 3,69619 Lake District 717 797 1,120 1,438 1,630 1,829 2,09621 Meadows 309 373 552 697 885 1,049 1,19623 Kaskitayo 4,502 4,558 4,620 4,697 4,773 4,803 4,85124 Ellerslie 561 1,073 1,451 2,236 3,185 3,752 4,44925 Heritage Valley 320 362 600 764 934 1,186 1,42026 Windermere 179 263 416 654 973 1,280 1,61027 West Edmonton 321 386 658 935 1,298 1,659 1,99628 Winterburn 808 1,136 1,758 1,936 2,164 2,509 3,01429 Land Bank 15 15 15 15 15 15 1530 Northeast Edmonton 177 179 189 201 212 220 233
Suburban Residential Total 24,468 26,188 29,689 33,401 37,384 40,344 43,723Total 120,743 125,401 134,489 144,103 152,844 159,882 168,770
Population & Employment Forecasts: 2003 to 2030 - City of Edmonton - Summary Report
Applications Management Consulting Ltd. - May 2005 57
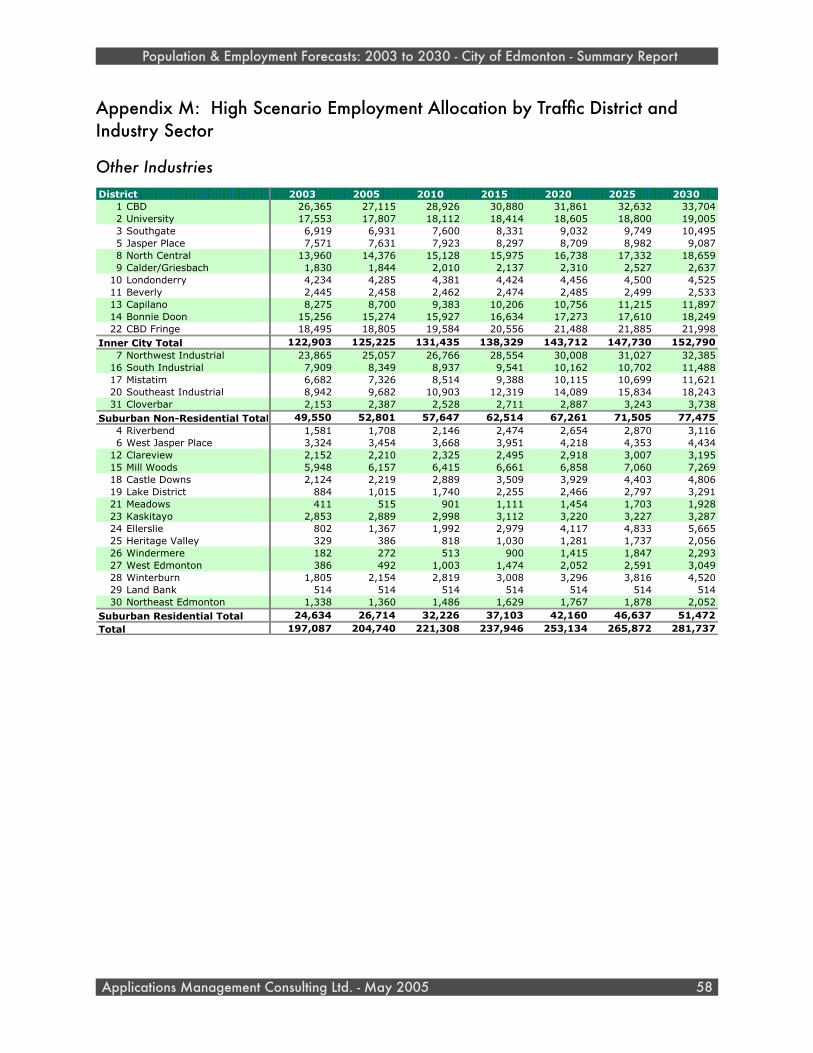
Appendix M: High Scenario Employment Allocation by Traffic District and Industry Sector
Other Industries2003 2005 2010 2015 2020 2025 2030
1 CBD 26,365 27,115 28,926 30,880 31,861 32,632 33,7042 University 17,553 17,807 18,112 18,414 18,605 18,800 19,0053 Southgate 6,919 6,931 7,600 8,331 9,032 9,749 10,4955 Jasper Place 7,571 7,631 7,923 8,297 8,709 8,982 9,0878 North Central 13,960 14,376 15,128 15,975 16,738 17,332 18,6599 Calder/Griesbach 1,830 1,844 2,010 2,137 2,310 2,527 2,637
10 Londonderry 4,234 4,285 4,381 4,424 4,456 4,500 4,52511 Beverly 2,445 2,458 2,462 2,474 2,485 2,499 2,53313 Capilano 8,275 8,700 9,383 10,206 10,756 11,215 11,89714 Bonnie Doon 15,256 15,274 15,927 16,634 17,273 17,610 18,24922 CBD Fringe 18,495 18,805 19,584 20,556 21,488 21,885 21,998
122,903 125,225 131,435 138,329 143,712 147,730 152,7907 Northwest Industrial 23,865 25,057 26,766 28,554 30,008 31,027 32,385
16 South Industrial 7,909 8,349 8,937 9,541 10,162 10,702 11,48817 Mistatim 6,682 7,326 8,514 9,388 10,115 10,699 11,62120 Southeast Industrial 8,942 9,682 10,903 12,319 14,089 15,834 18,24331 Cloverbar 2,153 2,387 2,528 2,711 2,887 3,243 3,738
49,550 52,801 57,647 62,514 67,261 71,505 77,4754 Riverbend 1,581 1,708 2,146 2,474 2,654 2,870 3,1166 West Jasper Place 3,324 3,454 3,668 3,951 4,218 4,353 4,434
12 Clareview 2,152 2,210 2,325 2,495 2,918 3,007 3,19515 Mill Woods 5,948 6,157 6,415 6,661 6,858 7,060 7,26918 Castle Downs 2,124 2,219 2,889 3,509 3,929 4,403 4,80619 Lake District 884 1,015 1,740 2,255 2,466 2,797 3,29121 Meadows 411 515 901 1,111 1,454 1,703 1,92823 Kaskitayo 2,853 2,889 2,998 3,112 3,220 3,227 3,28724 Ellerslie 802 1,367 1,992 2,979 4,117 4,833 5,66525 Heritage Valley 329 386 818 1,030 1,281 1,737 2,05626 Windermere 182 272 513 900 1,415 1,847 2,29327 West Edmonton 386 492 1,003 1,474 2,052 2,591 3,04928 Winterburn 1,805 2,154 2,819 3,008 3,296 3,816 4,52029 Land Bank 514 514 514 514 514 514 51430 Northeast Edmonton 1,338 1,360 1,486 1,629 1,767 1,878 2,052
24,634 26,714 32,226 37,103 42,160 46,637 51,472197,087 204,740 221,308 237,946 253,134 265,872 281,737
Suburban Residential TotalTotal
District
Inner City Total
Suburban Non-Residential Total
Population & Employment Forecasts: 2003 to 2030 - City of Edmonton - Summary Report
Applications Management Consulting Ltd. - May 2005 58

Dis
tric
t
Primary Industries
Manufacturing
Construction
Utilities
Transportation, Storage & Communications
Wholesale
Retail Trade
Finance, Insurance & Real Estate
commercial Services
Non-commercial Services
Public Admin & Defence
Total Employment
1CBD
340
327
383
1,5
83
7,3
39
571
1,9
12
7,7
07
17,7
82
4,6
67
11,1
53
53
,76
52
Univ
ersi
ty40
136
335
0405
110
552
405
3,3
76
16,3
49
177
21
,88
53
South
gat
e125
861
389
0861
566
4,0
14
1,0
47
5,3
49
2,4
77
1,6
40
17
,32
85
Jasp
er P
lace
65
165
399
10
291
190
3,0
24
1,2
37
5,1
15
5,8
55
596
16
,94
88
Nort
h C
entr
al273
2,2
38
683
82
2,2
87
894
3,2
94
995
5,6
23
5,6
49
1,8
54
23
,87
29
Cal
der
/Gries
bac
h15
85
87
0196
85
458
276
787
1,2
27
135
3,3
52
10
Londonder
ry65
161
165
10
158
165
2,6
36
465
2,3
47
3,1
72
337
9,6
81
11
Bev
erly
70
245
258
20
195
205
837
136
2,6
14
1,2
11
240
6,0
31
13
Cap
ilano
261
2,1
41
589
108
1,0
65
955
1,0
92
868
3,3
71
2,4
81
676
13
,60
714
Bonnie
Doon
681
5,3
15
1,8
32
185
1,8
54
3,3
86
2,3
55
1,2
13
5,5
17
1,5
47
456
24
,34
122
CBD
Fringe
111
1,5
67
612
250
821
631
2,7
78
1,7
09
9,7
20
10,0
73
4,4
31
32
,70
2In
ner
Cit
y T
ota
l2
,04
61
3,2
41
5,7
32
2,2
49
15
,47
37
,76
02
2,9
53
16
,05
76
1,6
00
54
,70
72
1,6
95
22
3,5
13
7N
ort
hw
est
Indust
rial
197
6,3
65
2,9
87
130
4,8
50
7,8
42
4,3
11
1,7
71
8,5
28
872
620
38
,47
416
South
Indust
rial
595
2,9
57
922
12
761
1,8
81
2,3
95
593
3,3
91
273
510
14
,28
817
Mis
tatim
75
2,5
63
603
141
1,2
35
1,9
18
641
347
1,0
03
107
39
8,6
73
20
South
east
Indust
rial
558
4,0
65
1,3
33
196
1,3
07
1,3
52
913
235
2,5
27
57
73
12
,61
731
Clo
verb
ar121
1,2
74
263
78
331
69
33
14
210
116
2,4
10
Su
bu
rban
No
n-R
esi
den
tial To
tal
1,5
47
17
,22
46
,10
85
56
8,4
85
13
,06
28
,29
22
,96
01
5,6
58
1,3
11
1,2
59
76
,46
14
Riv
erben
d61
92
152
053
116
322
442
1,2
58
1,0
23
85
3,6
03
6W
est
Jasp
er P
lace
79
273
289
0484
329
5,5
30
1,0
06
6,5
66
1,7
78
92
16
,42
612
Cla
revi
ew12
237
217
65
202
186
1,7
29
297
1,3
77
1,0
80
152
5,5
56
15
Mill
Woods
70
100
227
0391
116
1,4
65
588
3,2
73
4,8
69
176
11
,27
318
Cas
tle
Dow
ns
36
106
249
10
223
149
1,0
80
326
1,4
26
1,1
10
240
4,9
55
19
Lake
Dis
tric
t11
12
153
0283
61
322
172
545
350
15
1,9
24
21
Mea
dow
s41
17
88
041
1165
60
250
220
48
86
23
Kas
kita
yo56
96
157
10
98
135
2,3
50
682
3,8
20
2,1
33
168
9,7
05
24
Elle
rslie
54
229
140
31
97
109
264
70
491
110
32
1,6
27
25
Her
itag
e Val
ley
56
44
78
75
7146
32
288
121
10
79
526
Win
der
mer
e33
52
19
310
23
106
15
164
26
15
46
727
Wes
t Edm
onto
n31
42
80
10
31
31
51
30
291
158
47
59
28
Win
terb
urn
77
504
530
7296
333
257
114
694
47
10
2,8
69
29
Land B
ank
96
27
00
10
10
00
15
0371
52
930
Nort
hea
st E
dm
onto
n152
015
025
040
10
167
1,0
85
61
1,5
55
Su
bu
rban
Resi
den
tial To
tal
86
61
,83
22
,39
51
43
2,2
50
1,6
04
13
,82
73
,84
32
0,6
25
14
,11
01
,43
46
2,9
28
To
tal
4,4
59
32
,29
61
4,2
35
2,9
48
26
,20
82
2,4
26
45
,07
32
2,8
60
97
,88
37
0,1
27
24
,38
83
62
,90
2
Population & Employment Forecasts: 2003 to 2030 - City of Edmonton - Summary Report
Applications Management Consulting Ltd. - May 2005 59
App
endi
x N
: H
igh
Scen
ario
Em
ploy
men
t by
Traf
fic D
istric
t and
Indu
stry
2003

Dis
tric
t
Primary Industries
Manufacturing
Construction
Utilities
Transportation, Storage & Communications
Wholesale
Retail Trade
Finance, Insurance & Real Estate
commercial Services
Non-commercial Services
Public Admin & Defence
Total Employment
1CBD
360
388
456
1,8
25
8,8
41
744
2,3
25
8,8
60
21,3
00
6,2
05
12,0
61
63
,36
52
Univ
ersi
ty42
141
368
0429
112
610
426
3,5
28
17,1
31
190
22
,97
93
South
gat
e127
907
407
1909
593
4,2
68
1,0
84
5,8
03
3,7
23
1,6
64
19
,48
65
Jasp
er P
lace
65
166
403
10
299
190
3,0
41
1,2
43
5,1
65
6,5
62
603
17
,74
68
Nort
h C
entr
al305
2,5
33
777
105
2,5
66
961
3,7
06
1,0
85
6,2
46
6,8
07
1,9
21
27
,01
29
Cal
der
/Gries
bac
h17
89
147
0211
87
519
300
918
1,4
43
144
3,8
74
10
Londonder
ry66
167
165
10
178
167
2,9
79
495
2,5
48
3,3
21
349
10
,44
811
Bev
erly
71
254
258
20
199
209
850
139
2,6
36
1,2
21
241
6,0
99
13
Cap
ilano
311
2,7
58
772
124
1,3
89
1,2
79
1,4
27
1,0
10
4,2
99
2,6
57
916
16
,94
314
Bonnie
Doon
748
5,7
96
2,0
02
216
2,0
55
3,6
67
2,5
30
1,3
41
5,9
57
1,6
47
502
26
,46
222
CBD
Fringe
116
1,5
77
636
252
848
638
2,8
70
1,7
46
9,9
73
11,5
23
4,9
66
35
,14
5In
ner
Cit
y T
ota
l2
,22
71
4,7
77
6,3
92
2,5
63
17
,92
58
,64
82
5,1
26
17
,73
06
8,3
74
62
,24
02
3,5
57
24
9,5
59
7N
ort
hw
est
Indust
rial
261
7,8
63
3,5
58
166
5,7
42
9,2
11
5,4
34
2,2
25
10,5
61
1,0
00
752
46
,77
516
South
Indust
rial
694
3,5
49
1,0
83
18
978
2,2
63
3,0
04
697
4,2
49
314
642
17
,49
117
Mis
tatim
130
3,7
19
881
196
1,7
15
2,5
59
1,0
98
451
1,8
10
132
56
12
,74
720
South
east
Indust
rial
734
5,7
04
1,8
69
240
1,6
62
1,8
79
1,6
44
404
3,8
58
106
124
18
,22
531
Clo
verb
ar149
1,5
86
330
97
418
109
82
22
320
320
3,1
36
Su
bu
rban
No
n-R
esi
den
tial To
tal
1,9
69
22
,42
27
,72
17
16
10
,51
41
6,0
22
11
,26
33
,79
92
0,7
98
1,5
56
1,5
94
98
,37
44
Riv
erben
d66
105
267
099
121
514
516
1,6
71
1,7
04
112
5,1
75
6W
est
Jasp
er P
lace
97
382
362
0575
402
6,8
21
1,1
43
7,8
03
1,9
95
139
19
,71
712
Cla
revi
ew23
333
255
68
240
239
1,8
97
333
1,6
31
1,1
62
175
6,3
56
15
Mill
Woods
71
109
235
0407
123
1,6
07
635
3,4
66
5,5
24
191
12
,36
918
Cas
tle
Dow
ns
56
269
465
16
326
232
1,4
91
450
2,1
82
1,8
55
290
7,6
32
19
Lake
Dis
tric
t18
31
369
0352
69
607
281
1,1
56
1,3
60
56
4,3
00
21
Mea
dow
s44
27
167
078
5319
118
579
764
26
2,1
27
23
Kas
kita
yo60
125
196
10
116
153
2,4
58
705
3,9
91
2,2
68
184
10
,26
724
Elle
rslie
106
777
476
58
335
376
1,0
96
304
1,9
32
755
96
6,3
12
25
Her
itag
e Val
ley
66
101
154
751
42
365
91
673
563
46
2,1
59
26
Win
der
mer
e49
163
165
462
94
390
69
584
296
67
1,9
43
27
Wes
t Edm
onto
n41
94
255
10
93
62
329
117
818
873
48
2,7
38
28
Win
terb
urn
120
989
688
32
474
570
856
268
1,6
68
89
46
5,8
00
29
Land B
ank
96
27
00
10
10
00
15
0371
52
930
Nort
hea
st E
dm
onto
n172
017
025
046
11
191
1,3
38
76
1,8
76
Su
bu
rban
Resi
den
tial To
tal
1,0
86
3,5
31
4,0
71
20
43
,24
42
,49
81
8,7
95
5,0
41
28
,36
02
0,5
46
1,9
22
89
,29
9To
tal
5,2
82
40
,73
11
8,1
85
3,4
83
31
,68
22
7,1
68
55
,18
42
6,5
71
11
7,5
32
84
,34
12
7,0
74
43
7,2
33
Population & Employment Forecasts: 2003 to 2030 - City of Edmonton - Summary Report
Applications Management Consulting Ltd. - May 2005 60
App
endi
x N
: H
igh
Scen
ario
Em
ploy
men
t by
Traf
fic D
istric
t and
Indu
stry
2015
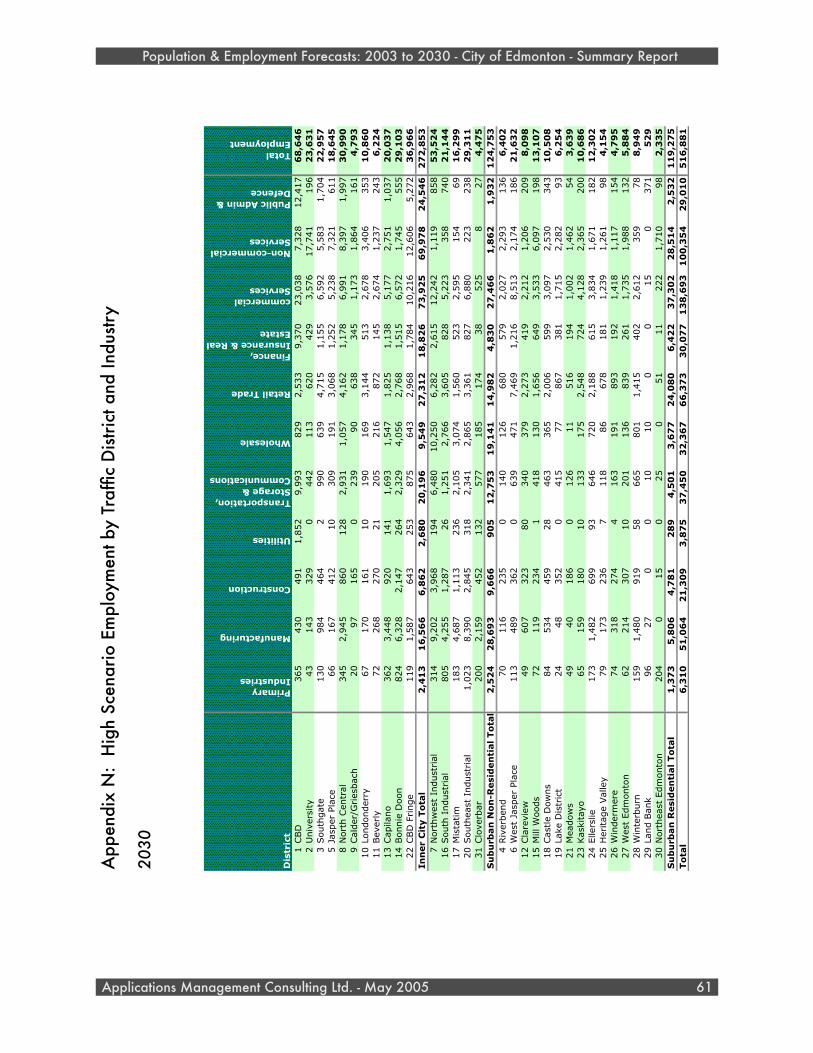
Dis
tric
t
Primary Industries
Manufacturing
Construction
Utilities
Transportation, Storage & Communications
Wholesale
Retail Trade
Finance, Insurance & Real Estate
commercial Services
Non-commercial Services
Public Admin & Defence
Total Employment
1CBD
365
430
491
1,8
52
9,9
93
829
2,5
33
9,3
70
23,0
38
7,3
28
12,4
17
68
,64
62
Univ
ersi
ty43
143
329
0442
113
620
429
3,5
76
17,7
41
196
23
,63
13
South
gat
e130
984
464
2990
639
4,7
15
1,1
55
6,5
92
5,5
83
1,7
04
22
,95
75
Jasp
er P
lace
66
167
412
10
309
191
3,0
68
1,2
52
5,2
38
7,3
21
611
18
,64
58
Nort
h C
entr
al345
2,9
45
860
128
2,9
31
1,0
57
4,1
62
1,1
78
6,9
91
8,3
97
1,9
97
30
,99
09
Cal
der
/Gries
bac
h20
97
165
0239
90
638
345
1,1
73
1,8
64
161
4,7
93
10
Londonder
ry67
170
161
10
190
169
3,1
44
513
2,6
78
3,4
06
353
10
,86
011
Bev
erly
72
268
270
21
205
216
872
145
2,6
74
1,2
37
243
6,2
24
13
Cap
ilano
362
3,4
48
920
141
1,6
93
1,5
47
1,8
25
1,1
38
5,1
77
2,7
51
1,0
37
20
,03
714
Bonnie
Doon
824
6,3
28
2,1
47
264
2,3
29
4,0
56
2,7
68
1,5
15
6,5
72
1,7
45
555
29
,10
322
CBD
Fringe
119
1,5
87
643
253
875
643
2,9
68
1,7
84
10,2
16
12,6
06
5,2
72
36
,96
6In
ner
Cit
y T
ota
l2
,41
31
6,5
66
6,8
62
2,6
80
20
,19
69
,54
92
7,3
12
18
,82
67
3,9
25
69
,97
82
4,5
46
27
2,8
53
7N
ort
hw
est
Indust
rial
314
9,2
02
3,9
68
194
6,4
80
10,2
50
6,2
82
2,6
15
12,2
42
1,1
19
858
53
,52
416
South
Indust
rial
805
4,2
55
1,2
87
26
1,2
51
2,7
66
3,6
05
828
5,2
23
358
740
21
,14
417
Mis
tatim
183
4,6
87
1,1
13
236
2,1
05
3,0
74
1,5
60
523
2,5
95
154
69
16
,29
920
South
east
Indust
rial
1,0
23
8,3
90
2,8
45
318
2,3
41
2,8
65
3,3
61
827
6,8
80
223
238
29
,31
131
Clo
verb
ar200
2,1
59
452
132
577
185
174
38
525
827
4,4
75
Su
bu
rban
No
n-R
esi
den
tial To
tal
2,5
24
28
,69
39
,66
69
05
12
,75
31
9,1
41
14
,98
24
,83
02
7,4
66
1,8
62
1,9
32
12
4,7
53
4Riv
erben
d70
116
235
0140
126
680
579
2,0
27
2,2
93
136
6,4
02
6W
est
Jasp
er P
lace
113
489
362
0639
471
7,4
69
1,2
16
8,5
13
2,1
74
186
21
,63
212
Cla
revi
ew49
607
323
80
340
379
2,2
73
419
2,2
12
1,2
06
209
8,0
98
15
Mill
Woods
72
119
234
1418
130
1,6
56
649
3,5
33
6,0
97
198
13
,10
718
Cas
tle
Dow
ns
84
534
459
28
463
365
2,0
06
599
3,0
97
2,5
30
343
10
,50
819
Lake
Dis
tric
t24
48
352
0415
77
867
381
1,7
15
2,2
82
93
6,2
54
21
Mea
dow
s49
40
186
0126
11
516
194
1,0
02
1,4
62
54
3,6
39
23
Kas
kita
yo65
159
180
10
133
175
2,5
48
724
4,1
28
2,3
65
200
10
,68
624
Elle
rslie
173
1,4
82
699
93
646
720
2,1
88
615
3,8
34
1,6
71
182
12
,30
225
Her
itag
e Val
ley
79
173
236
7118
86
678
181
1,2
39
1,2
61
98
4,1
54
26
Win
der
mer
e74
318
274
4163
191
893
192
1,4
18
1,1
17
154
4,7
95
27
Wes
t Edm
onto
n62
214
307
10
201
136
839
261
1,7
35
1,9
88
132
5,8
84
28
Win
terb
urn
159
1,4
80
919
58
665
801
1,4
15
402
2,6
12
359
78
8,9
49
29
Land B
ank
96
27
00
10
10
00
15
0371
52
930
Nort
hea
st E
dm
onto
n204
015
025
051
11
222
1,7
10
98
2,3
35
Su
bu
rban
Resi
den
tial To
tal
1,3
73
5,8
06
4,7
81
28
94
,50
13
,67
72
4,0
80
6,4
22
37
,30
22
8,5
14
2,5
32
11
9,2
75
To
tal
6,3
10
51
,06
42
1,3
09
3,8
75
37
,45
03
2,3
67
66
,37
33
0,0
77
13
8,6
93
10
0,3
54
29
,01
05
16
,88
1
Population & Employment Forecasts: 2003 to 2030 - City of Edmonton - Summary Report
Applications Management Consulting Ltd. - May 2005 61
App
endi
x N
: H
igh
Scen
ario
Em
ploy
men
t by
Traf
fic D
istric
t and
Indu
stry
2030

Acknowledgments
Acknowledgments
The consulting team would like to express its sincere appreciation for the help and guidance provided by the Project Steering Committee. Steering Committee members are:Alan Brownlee (Chair)Director of Evaluation & MonitoringTransportation and Streets Department Jong Huang (Project Manager)Chief EconomistPlanning and Development Department Bob IshaniTransportation Engineering SpecialistAlberta Infrastructure and Transportation Robert HigginsPrincipal PlannerPlanning and Development Department Paul HoffartSenior EngineerAsset Management and Public Works Department Stephanie McCabeTransportation EngineerTransportation and Streets Department Rod KeithStrategic Planning OfficerCommunity Services Department Steve CressyTransportation TechnicianTransportation and Streets Department
Population & Employment Forecasts: 2003 to 2030 - City of Edmonton - Summary Report
Applications Management Consulting Ltd. - May 2005 62