Embed Size (px)
Citation preview

Population Estimate for Humpback Chub (Gila cypha) and Roundtail Chub (Gila robusta)
in Westwater Canyon, Colorado River, Utah 2003-2005
Julie A. Jackson
Utah Division of Wildlife Resources 1165 S. Hwy 191 Suite 4
Moab, UT 84532
Final Report January 2010
Upper Colorado River Endangered Fish Recovery Program
Project # 22c

ii
ACKNOWLEDGEMENT AND DISCLAIMER I would like to acknowledge those who lent their considerable biological expertise to various portions of this study. I would like to specifically thank Kevin Bestgen, Tom Chart and Steve Ross who provided an in depth review and critique of this report. Finally I would like to thank the numerous technicians and volunteers without whom this study would not have been possible. This study was funded by the Recovery Implementation Program for the Endangered Fish Species in the Upper Colorado River Basin. The Recovery Program is a joint effort of the U.S. Fish and Wildlife Service, U.S. Bureau of Reclamation, Western Area Power Administration, states of Colorado, Utah, and Wyoming, Upper Basin water users, environmental organizations, the Colorado River Energy Distributors Association, and the National Park Service. Mention of trade names or commercial products does not constitute endorsement or recommendation for use by the authors, the U.S. Fish and Wildlife Service, U.S. Department of Interior, or members of the Recovery Implementation Program.

iii
TABLE OF CONTENTS TABLE OF CONTENTS ............................................................................................................ iii EXECUTIVE SUMMARY ...........................................................................................................v LIST OF TABLES ...................................................................................................................... vii LIST OF FIGURES ..................................................................................................................... ix LIST OF KEY WORDS .............................................................................................................. xi INTRODUCTION..........................................................................................................................1 METHODS .....................................................................................................................................2 Study Area ..........................................................................................................................2 Field Sampling....................................................................................................................3 Data Analysis ......................................................................................................................4 Population Estimate.................................................................................................4 Catch Rates ..............................................................................................................5 River Discharge and Water Temperature................................................................6 RESULTS .......................................................................................................................................6 Population Estimates .........................................................................................................6 Humpback chub .......................................................................................................6 Roundtail chub .........................................................................................................7 Gila spp ....................................................................................................................7 Catch Rates.........................................................................................................................7 Humpback chub .......................................................................................................7 Roundtail chub .........................................................................................................8 Catch Rate Comparisons...................................................................................................9 Length-Frequency..............................................................................................................9 Movement ...........................................................................................................................9 Length-weight Relationship ............................................................................................10 Comparison of Abundance and Catch Rate ..................................................................10 River discharge and Water Temperature......................................................................11

iv
TABLE OF CONTENTS (continued) DISCUSSION ...............................................................................................................................11 Model Selection ................................................................................................................11 Assumptions of Models....................................................................................................11 Identification of Gila spp. ................................................................................................12 Population Estimates and Catch Rates ..........................................................................12 Condition and Recruitment ............................................................................................14 Catch Rates and Population Estimate Comparisons ....................................................15 Handling Concerns ..........................................................................................................16 CONCLUSIONS ..........................................................................................................................16 RECOMMENDATIONS.............................................................................................................17 LITERATURE CITED ...............................................................................................................18 APPENDICES ..............................................................................................................................34
v
EXECUTIVE SUMMARY Mark-recapture sampling was conducted in Westwater Canyon on the Colorado River to estimate the population size of humpback chub (Gila cypha) and roundtail chub (Gila robusta). Three sampling passes were conducted during the fall months from 2003 to 2005. Based on closed population estimate models, a decline in humpback chub populations was determined, while roundtail chub populations remained stable. Confidence limits during the study period did overlap for humpback chub, yet when added to the trends from earlier population estimates (1998-2000), confidence intervals between the first and last year did not overlap, indicating a significant decline. Estimates of the humpback chub population in Westwater Canyon coupled with the most recent estimates in Black Rocks (making up a core population) hover near and perhaps below the minimum viable population estimated in the 2002 humpback chub recovery goals. Population estimates for humpback chub in 2003 were 2,973 (CI, 1,710 to 6,042), declined in 2004 to 1,729 (CI, 1,121 to 2,967), and declined further in 2005 to 1,210 (CI, 880-1,769). Roundtail chub population estimates remained stable and increased slightly from 3,288 (CI, 2,963 to 65,760) in 2003, to 3,867 (CI, 3,124 to 4,912) in 2004, to 4,273 (CI, 3,356 to 5,613) in 2005. Insufficient numbers of juvenile humpback chub collected during the study period precluded a population estimate based on mark-recapture data for that size class. Instead, estimates based on a percentage of first year adults taken from the adult estimates, provided recruit estimates of 253, 104, and 89 from 2003 to 2005, respectively. Estimates of juvenile roundtail chub were conducted in the same fashion and resulted in 446, 168, and 679 from 2003 to 2005, respectively. Electrofishing in 2005 boosted numbers of juvenile roundtail chub collected and an estimate from mark-recapture data resulted in 1,003 individuals 150-199 mm. Trammel net catch rates were variable among passes for both humpback and roundtail chub during the study period. Humpback chub catch rates declined significantly from 1998 to 2004, while catch rates in 2005 increased slightly. Roundtail chub catch rates remained stable from 1998 to 2005, except for a significant decline in 2000. Catch rate data comparable to previous ISMP (interagency standardized monitoring program) data for humpback chub illustrated that trends have steadily declined since 1988 with the lowest catch rates in 2000 and 2003. Roundtail chub ISMP catch rates have remained relatively consistent. A positive relationship and consistent correlation was identified when abundance estimates and catch rates were compared for humpback chub. The existence of this relationship for humpback chub indicates that it may be possible to eventually conduct less intensive monitoring while retaining the ability to assess the status of the population. However a negative relationship was found to exist between abundance estimates and catch rates of roundtail chub and are likely due to bias in the catch indices. Overall declining trends of humpback chub are not easily explained, but recruitment is likely a significant factor. Analyses of length-frequency suggest that the population consists of older individuals with few younger recruits. Length-weight relationships

vi
further indicate that the majority of adults are larger compared to earlier years of ISMP sampling when catch rates were higher (1992-1996). These data suggest that fewer young humpback chub have recruited into the adult population, while roundtail chub have continued to recruit well. Drought conditions present just prior to and during this study may have played a significant role in the declining trend of humpback chub while providing more favorable conditions for roundtail chub in Westwater Canyon. However, significant relationships were not identified when comparisons of abundance and catch rate were made as a function of river stage. It is likely that there is a combined carrying capacity for these species, which occupy similar habitats, within Westwater Canyon. Continuation and refinement of population estimates for both humpback chub and roundtail chub is recommended for Westwater Canyon. Electrofishing each pass in 2005 provided for many of the recaptures of humpback chub. Electrofishing also boosted the number of roundtail juvenile captures needed to estimate recruitment and should be continued in future sampling. Inclusion of a radio-telemetry component into the sampling regime would assist in understanding general behavior of humpback and roundtail chub in Westwater Canyon and may be beneficial in determining methods to increase captures of the two species. Many years of fish tagging conducted in Westwater Canyon provides valuable data for analysis of survival rates that would further the understanding of the demographics of the two Gila species coexisting in the canyon.

vii
LIST OF TABLES Table 1. Population estimate (N) for adult humpback chub (> 200 mm) in
Westwater Canyon 1998-2005. Population estimates generated within program CAPTURE. Standard error (SE), profile likelihood interval (PLI), coefficient of variation (CV), and probability of capture (p-hat) are included with the respective population estimates. ...............................................21
Table 2. Population estimate (N-hat) of first year adult humpback chub (200-220
mm) in Westwater Canyon 2003-2005, with respective 95% confidence interval. .................................................................................................................21
Table 3. Population estimate (N) for adult roundtail chub (> 200 mm) in Westwater
Canyon 1998-2005. Population estimates generated within program CAPTURE. Standard error (SE), profile likelihood interval (PLI), coefficient of variation (CV), and probability of capture (p-hat) are included with the respective population estimates. ...............................................22
Table 4. Population estimate (N-hat) of first year adult roundtail chub (200-220
mm) in Westwater Canyon 2003-2005, with respective 95% confidence interval. ..................................................................................................................22
Table 5. Population estimate (N) for adult Gila spp. (> 200 mm) in Westwater
Canyon 1998-2005. Population estimates generated within program CAPTURE. Standard error (SE), profile likelihood interval (PLI), coefficient of variation (CV), and probability of capture (p-hat) are included with the respective population estimates. ...............................................23
Table 6. Mean total length (TL), standard deviation (SD) and sample size (n) of
adult humpback chub and adult roundtail chub in Westwater Canyon from 1998-2000 and 2003-2005. ....................................................................................23
Table 7. Regression analysis of several different parameters taken for humpback
chub, roundtail chub and all Gila combined in Westwater Canyon. Parameters abbreviations are catch per unit effort per pass in each year (CPUE), river discharge in cubic feet per second (CFS), water temperature in oC (T), abundance estimate for each year (ABD), average annual CFS taken from the corresponding water year (ann CFS), average summer CFS (sum CFS), average spring CFS (spr CFS)............................................................24

viii
Appendix Table 1. Summary of humpback chub and roundtail chub captures by method
during each year of the study used to generate population estimates.…………………………………………………………………34
Appendix Table 2. Summary of population estimates generated within Program CAPTURE
for adult humpback chub in Westwater Canyon, 1998-2000 and 2003-2005………………………………………………………………………35
Appendix Table 3. Summary of population estimates generated within Program CAPTURE
for adult roundtail chub in Westwater Canyon, 1998-2000 and 2003–2005………………………………………………………………………37
Appendix Table 4. Summary of population estimates generated within Program CAPTURE
for Gila spp. in Westwater Canyon, 1998-2000 and 2003–2005………………………………………………………………………39
Appendix Table 5. Electrofishing CPUE (number of fish/hour) for all juvenile humpback
chub (HBC), roundtail chub (RTC) and intermediate or unidentifiable chub (CH) captured during each year of the study period in Westwater Canyon.…………………………………………………………………..40
Appendix Table 6. Fin ray count (dorsal/anal) percentages for humpback chub (HBC),
roundtail chub (RTC) and intermediate or unidentifiable chub (CH) captured during each year of the study period in Westwater Canyon..………………………………………………………………….40

ix
LIST OF FIGURES Figure 1. Map of study area...................................................................................................25 Figure 2. Abundance (N-hat) of humpback chub adults in Westwater Canyon, 1998 to 2005. ........................................................................................................26 Figure 3. Abundance (N-hat) of roundtail chub adults in Westwater Canyon, 1998 to 2005. .........................................................................................................26 Figure 4. Trammel net catch rate (CPUE) of humpback chub (all size classes
combined) during each sampling pass in Westwater Canyon from 2003 to 2005........................................................................................................................27
Figure 5. Trammel net catch rate (CPUE) of roundtail chub (all size classes
combined) during each sampling pass in Westwater Canyon from 2003 to 2005........................................................................................................................27
Figure 6. Numbers and electrofishing catch rate (CPUE) of adult humpback chub
and adult roundtail chub collected in Westwater Canyon from 2003 to 2005........................................................................................................................28
Figure 7. Catch rate (CPUE, three passes combined) of humpback chub, roundtail
chub and all Gila spp. combined (all size classes combined) in Westwater Canyon from 1998 to 2005. ...................................................................................29
Figure 8. Long-term catch rate (CPUE) of humpback chub and roundtail chub in
Westwater Canyon, 1988-2005. Note that data from 1998-2005 has been lifted from larger population estimate sampling data to be comparable to previous ISMP sampling data. ...............................................................................29
Figure 9. Length-frequency histograms for humpback chub in Westwater Canyon
from 2003-2005. ....................................................................................................30 Figure 10. Length-frequency histograms for roundtail chub in Westwater Canyon
from 2003-2005. ....................................................................................................31 Figure 11. Persistence of humpback chub originally marked prior to the study period
in Westwater Canyon and recaptured during the study period. .............................32 Figure 12. Persistence of roundtail chub originally marked prior to the study period in
Westwater Canyon and recaptured during the study period. .................................32 Figure 13. Length-weight relationships for humpback chub and roundtail chub
collected in Westwater Canyon 1998-2000 and 2003-2005. .................................33

x
LIST OF KEY WORDS humpback chub, Gila cypha, roundtail chub, Gila robusta, Westwater Canyon, Colorado River, population estimate, growth, movement
1
INTRODUCTION Westwater Canyon is home to one of five upper Colorado River Basin populations of endangered humpback chub. Other populations of humpback chub occur in Yampa/Whirlpool Canyon and Desolation/Gray Canyon on the Green River, and Cataract Canyon and Black Rocks on the Colorado River. In the lower Colorado River Basin, the largest population of humpback chub occurs in the Little Colorado River and Grand Canyon (Valdez and Clemmer 1982). The humpback chub was first described in 1946 (Miller 1946) and was included in the first list of endangered species in 1967 (32 FR 4001). It is currently protected under the Endangered Species Act of 1973, as amended (ESA, 16 U.S.C. 1531 et. seq.). Alterations in the physical and biological characteristics of the Colorado River system by water-development projects, introductions of nonnative fishes and other human induced activities are primarily responsible for the decline of the humpback chub (Miller 1961, Minckley 1973). Other factors including parasitism, hybridization, pesticides and pollutants are considered to have contributed to the decline as well (USFWS 2002). An amendment and supplement to the 1990 recovery goals for humpback chub (USFWS 1990) was finalized in 2002 that identified objective, measurable recovery criteria to downlist and delist this species in both the upper and lower Colorado River Basin (USFWS 2002). Within the upper Colorado River Basin, one of the criteria to downlist humpback chub is the maintenance of a core population with a minimum viable population of 2,100 adults for five consecutive years. Humpback chub in Westwater/Black Rocks Canyon are considered the core population in the upper Colorado River Basin. The adult humpback chub population is determined via point estimates in 2-3 of every five years to measure progress toward achieving and maintaining the minimum viable population. While humpback chub distribution is limited, current distribution of roundtail chub is much broader yet have also experienced a decrease in range (Bezzerides and Bestgen 2002). Roundtail chub are widespread and abundant in the few river reaches where humpback chub still occur. Because these two species are closely related and overlap in habitat exists, an understanding of the status of these sympatric populations is valuable. Furthermore, understanding roundtail chub dynamics in Westwater Canyon provides useful information that may be applied to areas where their populations have declined. The roundtail chub is not currently listed as threatened or endangered under the ESA. However, this species is listed on the Utah Sensitive Species List (UDWR 2006a), is considered a sensitive species by the U.S. Forest Service, Rocky Mountain Region (USFS 2006), and is listed as a Species of Special Concern by the National Park Service, Southeast Utah Group (NPS 2006). A multi-state, multi-agency conservation agreement was recently developed and implemented to take steps toward conservation of this sensitive species (UDWR 2006b). Estimates were first conducted for humpback chub and roundtail chub in Westwater Canyon from 1998 to 2000 (Hudson and Jackson 2003). During that series of population estimates, point estimates for humpback chub indicated a non-significant downward

2
trend, while point estimates for roundtail chub were stable and indicated little change. In addition to point estimates conducted for both species, other parameters were assessed including long-term catch rates, growth and movement. Humpback chub and roundtail chub populations have been monitored by Utah Division of Wildlife Resources (UDWR) since 1988 through catch rate trends. Hudson and Jackson (2003) demonstrated that these long-term catch rates for humpback chub had significantly decreased over time, while roundtail chub long-term catch rates remained stable. Some recommendations from that study were incorporated into the 2003-2005 sampling regime including an increase in sample sites and an increase in overall sampling effort. Additional recommendations from that report not incorporated included an additional sampling pass, and a radiotelemetry component for humpback chub to provide resolution of movement and site fidelity within and among current sampling sites. This report documents the second series of estimates conducted for humpback chub and roundtail chub in Westwater Canyon from 2003 to 2005. The goal of this project was to obtain unbiased and precise abundance estimates of humpback chub in Westwater Canyon. Specific objectives were: 1) to obtain a population estimate of adult humpback chub ($200 mm) in Westwater Canyon and 2) to determine mean estimated recruitment of naturally produced subadult humpback chub (150-199 mm) in Westwater Canyon.
METHODS Study Area Westwater Canyon is located on the Colorado River downstream of the Colorado-Utah border (Fig. 1). The length of the canyon extends approximately twelve miles (RM 124.5-112.5). It is characterized by the black Proterozoic gneiss and granite complex that comprises the inner gorge. The habitat in the upper section of the canyon consists of runs, eddies, and pools interspersed between riffles and rapids. The steepest part of Westwater Canyon is the middle section (RM 119.5-116.5). This portion of the canyon was not sampled due to the turbulent flows and Class III-IV rapids. However, U.S. Fish and Wildlife Service sampled the middle section of Westwater Canyon during 1979-1981 and found that humpback chub were present (Valdez et al. 1982). The lower section of Westwater Canyon is a confined canyon reach with a reduced gradient that is primarily composed of a homogenous run where chubs are scarce (Chart and Lentch 1999, this study). Humpback chub sampling occurred at four sites in the upper portion of Westwater Canyon. Three of those sites were previously established for the Interagency Standardized Monitoring Program (ISMP): Miners Cabin (RM 124.1-123.8), Lower Cougar Bar (RM 121.5-121.0), and Hades Bar (RM 120.0-119.8). The fourth site was located at Upper Cougar Bar (RM 122.5-121.6). In 2003, Big Hole (RM 116.3-116.1) was sampled during the first pass to once again determine if any chub inhabited this area below the rapids. This site was sampled during the evening and morning. Very few fish of any kind were collected at this location. A notable exception was a 425 mm TL

3
roundtail chub. Depth measurements collected in 1994 for the ISMP sites resulted in maximum depths of 21.8 m at Miners Cabin, 19.5 m at Cougar Bar, and 10.6 m at Hades Bar (Chart and Lentch 1999). Each of these deep canyon habitats is bounded by a riffle area. Field Sampling Humpback chub sampling in Westwater Canyon occurred from September through November throughout the three-year study. Three passes were conducted during each year. In 2003, sampling was conducted from mid-September to mid-November with approximately 25 days in between passes. In 2004, the first two passes were conducted in October, and the last in November, with approximately eight days in between passes. In 2005, sampling occurred from the end of September to the end of October with approximately 6 days in between passes. A sampling pass constituted seven nights of trammel netting and electrofishing. During each pass, Miners Cabin, Upper Cougar Bar and Lower Cougar Bar were sampled for two nights each and Hades Bar was sampled for one night. Multi-filament trammel nets (23 m x 2 m; 2.5 cm and 1.25 cm mesh each) and boat electrofishing (pulsed DC Smith-Root® electrofisher mounted on an inflatable sport boat) were used to collect fish. Hoop nets were used intermittently in 2003 and 2004, and opportunistic cast netting was conducted in 2005 on the first pass. Sporadic use of these methods and resultant limited data precluded reporting in-depth results. Captures by these methods were included in the population estimates and are detailed in Appendix I. Five to eight trammel nets were set at each site depending on availability of habitat. Nets were set in mid-afternoon and checked every one and a half to two hours until approximately midnight, at which time they were pulled. Nets were reset before or at dawn and allowed to fish until mid to late morning, while being checked at similar time intervals as evening sets. Trammel nets were set to target adult and juvenile chubs. Trammel nets were primarily set in deep eddies off boulder or rock faces. Nets were occasionally set in relatively shallow riffle/run areas off in-channel boulders. In 2003 and 2004 all chub were removed from the net and placed in a holding pen until processing at the end of each 18-hour sampling period. In 2005, all chub were removed from the net and processed in camp immediately and released. Due to this protocol, some chub were recaptured during the same 18-hour sampling period. During the first pass of 2005, a storm event washed large amounts of debris into the river and precluded the use of trammel nets for approximately 36 hours. Electrofishing was conducted during a single pass in 2003 and 2004, and on each pass in 2005. Single pass electrofishing was previously established under ISMP protocol. Increased electrofishing was conducted in 2005 in attempt to catch more chub to strengthen population estimates. The majority of electrofishing occurred at the three upper sites, little electrofishing was conducted at Hades Bar any year because of the shallow depth along shorelines and short sampling distance (0.2 river miles). Shoreline habitats were electrofished within each site. Electrofishing occurred prior to nets being set in late afternoon and subsequent to nets being pulled at night. Electrofishing was conducted to target smaller chub in addition to the late juvenile/adult component of the

4
population and to increase overall captures. In 2005, electrofishing was conducted more frequently than in previous years within passes, due to the river conditions described above. During this time electrofishing was conducted in lieu of trammel netting. All adult humpback chub and roundtail chub collected during electrofishing were used in their respective population estimates. Electrofishing data was also used in determining catch rates, length-frequency analysis, and movement determinations of chub in Westwater Canyon. Chub were identified to species using a suite of diagnostic qualitative characters (i.e., degree of frontal depression, presence of scales on nuchal hump, the line of the angle of the anal fin base relative to the upper section of the caudal fin lobe, etc; Douglas et al. 1989 and 1998). In some cases fin ray counts aided in the identification of fish, but mostly bolstered identifications based on the other criteria described above. Identifications were seldom based on ray counts alone. Information collected from all chub captures included total length (mm) weight (g), and dorsal and anal fin ray counts. Recaptured chub PIT tag numbers were recorded. Initial chub captures of fish greater than 150 mm received a PIT tag and the number was recorded. Information collected for all fish species captured included total and standard length and weight. Information collected for other endangered species captured included total and standard length, weight and PIT tag number. Data Analysis Population Estimate Population estimates were determined for adult humpback chub and roundtail chub (>200 mm TL) in Westwater Canyon using closed population models within Program CAPTURE (Otis et al. 1978, White et al. 1982, Rexstad and Burnham 1991). Program CAPTURE was used for model selection to help determine the most appropriate estimator. Models were ultimately determined by considering selection results generated in Program CAPTURE and other data available (i.e. capture probabilities, catch rate variability, and number of passes conducted). The null Mo and Darroch Mt models were used and a separate adult population estimate was calculated for each year. During the second pass in 2003, researchers ran short of PIT tags and did not tag all roundtail chub. Therefore, the estimate for 2003 includes only two passes and was derived by the Darroch Mt model only. Program CAPTURE was used to determine confidence intervals around all estimates, coefficients of variation, and probabilities of capture. Confidence intervals were determined for all estimators. Profile likelihood intervals were provided in lieu of 95% confidence intervals for the Mt model. The profile likelihood interval helps to account for model selection uncertainty by providing wider confidence intervals (David R. Anderson and Gary C. White, Colorado State University, Fort Collins, Colorado personal communication). In addition, these intervals tend to give more correct confidence intervals for small samples (Ross Moore, Mathematics Department, Macquarie University, Sydney, Australia personal communication).

5
Population estimates for juvenile humpback chub (150-199 mm TL) were not attempted using mark-recapture data due to extremely low numbers of this size class being collected throughout all study years. Mark-recapture population estimates for juvenile roundtail chub were conducted in 2005. To determine mean recruitment for humpback chub juveniles into the adult population, we assumed that individuals from 200-220 mm would be first year adults. This assumption was determined by taking growth rate data from Westwater, Deso/Gray and Cataract canyons. Length at age data presented in the humpback chub recovery goals for defining adults and juveniles was considered as well (USFWS 2002). By recovery goal standards, 200 mm TL constitutes an adult humpback chub. In Westwater Canyon, Chart and Lentch (1999) determined that humpback chub 140-210 mm TL were age 4 based on cohorts tracked by length-frequency, and recapture data illustrated humpback chub 200-250 grew 13 mm/year. Hudson and Jackson (2003) found that humpback chub less than 260 mm TL grew an average of 10 mm/year in Westwater Canyon. Jackson and Hudson (2005) found that two recaptured humpback chub 216 mm TL grew and average of 22 mm/year after one and two years each in Deso/Gray Canyon. In Cataract Canyon, Valdez (1990) found that age 4 humpback chub were 200 mm TL and age 5 humpback chub were 250 mm TL. Recapture data from Westwater Canyon (this study) illustrated that humpback chub grew an average of 8 mm/year (all size classes combined). Estimates for this size class were derived by taking the proportion of these fish relative to total numbers used for the adult estimate. From that proportion, confidence intervals were generated by the following formulas: p= (# 200-220 mm)/total caught 200+ mm) q=1-p SE=√ (p*q/n), where n is the total caught 95% CI: p+/- (SE) * 1.96 Catch Rates Catch rates for chub collected by trammel net were determined by the number of fish caught per hour a net was fished. Catch rates for chub collected by electrofishing were determined by the number of fish caught per electrofishing hour. CPUE was compared between passes within and among years using nonparametric Kruskal-Wallis ANOVA along with pairwise multiple comparisons (Dunn’s Method ) to examine the equality of samples. Total annual CPUE comparisons were tested between years using the same analyses. All statistical tests were performed using SigmaStat 3.0, (SPSS Inc). Point estimates of humpback chub, roundtail chub and all Gila spp. combined were compared to trammel net catch rates (CPUE). Catch rates during each year were combined to include all three passes and only adult fish data were used to be compatible with adult population point estimates. Correlations between the two data sets were run to identify relationships.

6
Catch rate data (CPUE for trammel nets) for humpback chub and roundtail chub from 1998-2000 and 2003-2005 was compared to ISMP data at the three previous ISMP sites. Data from one pass each year, and from ISMP sites only, were used in the comparisons. Since population estimate sampling often occurred later in the year than previous ISMP sampling, the pass conducted nearest to ISMP dates were chosen. More specifically, data from the first week of September was used in 1988, 1989 and 1995; data from the second week of September was used in 1993, 1994, 1996, and 2000; data from the third week of September was used in 2003; data from the end of September and beginning of October in 1998 and 1999; and mid-October data was used in 2004 and 2005. Catch rate comparisons among years were standardized by considering the number of fish caught per hour a net was fished. Net lengths varied somewhat during the earlier sampling years (prior to 1998). River Discharge and Water Temperature River flow over the three-year study period in late summer and fall in Westwater Canyon was relatively consistent. Discharge was compared to catch rates of humpback chub and roundtail chub to determine relationships between these variables through linear regression. Annual, spring, and summer discharge and discharge at time of sampling were all analyzed. Water temperature was measured each trip and varied considerably between passes within years in some cases. Linear regression was performed on water temperature data at time of sampling and catch rates to identify relationships.
RESULTS Population Estimates Humpback chub Based on trends in point estimates over time, abundance of adult humpback chub demonstrated an apparent decline during the 2003-2005 sampling period. This downward trend was greater when point estimates were included from the 1998-2000 sampling period. Point estimates from 2003 to 2005 were: 2,973 (SE = 941), 1,729 (SE = 424), and 1,210 (SE = 213), respectively (Table 1). Coefficients of variation decreased from 31% in 2003 to 17% in 2005. Point estimates from 1998 to 2000 were: 4,744 (SE = 1,089), 2,215 (SE = 624), and 2,201 (SE = 626), respectively (Hudson and Jackson 2003). Regression analysis of abundance as a function of time from 1998 to 2005 (N=6) indicated a declining but insignificant trend (r2 = 0.48, p = 0.12, SE=995), while non-overlapping confidence intervals between the 1998 point estimate and the 2005 point estimate suggest a statistically significant decline in abundance of humpback chub (Fig 2). Population estimates for juvenile humpback chub (150-199 mm) were not attempted based on mark-recapture data due to low numbers of this size class being collected throughout all study years. Instead, we assumed that individuals from 200-220 mm would be first year adults, and we could then estimate mean recruitment for juveniles into the adult population. Numbers of humpback chub juveniles collected by all methods during

7
the study period were: 6 in 2003, 24 in 2004 and 8 in 2005. Numbers of individuals 200-220 mm from 2003 to 2005 were 24, 17, and 21, respectively. Therefore, estimates of first year adults were 253 (SE = 0.015) for 2003, 104 (SE = 0.013) for 2004, and 89 (SE = 0.015) for 2005 (Table 2). Roundtail chub Point estimates of the adult roundtail chub population during the 2003-2005 sampling period were more precise (except in 2003) but essentially the same as point estimates from the 1998-2000 sampling period (Fig 3). Point estimates from 2003 to 2005 were: 3,288 (SE = 507), 3,867 (SE = 444), and 4,273 (SE = 565), respectively. Coefficients of variation from 2003 to 2005 were relatively good at 15%, 11% and 13%, respectively. Point estimates from 1998 to 2000 were: 5,005 (SE = 1,500), 4,234 (SE = 973), and 4,971 (SE = 1,249), respectively (Hudson and Jackson 2003). Precision of these estimates was substantially inferior to the precision of the 2003-2005 estimates at 23-28% (Table 3). Population estimates for juvenile roundtail chub (150-199 mm) were not attempted by mark-recapture data in 2003 and 2004 due to low numbers of this size class being collected, however, the juvenile population could be estimated in 2005. The point estimate for juvenile roundtail chub in 2005 was 1,003 (SE = 353) and profile likelihood intervals were from 550 to 2,246. Mean recruitment for juvenile roundtail chub was estimated similarly as for humpback chub in 2003-2005. Numbers of roundtail chub juveniles collected by all methods during the study period were: 23 in 2003, 101 in 2004 and 144 in 2005. Numbers of individuals 200-220 mm from 2003 to 2005 were 68, 35, and 119, respectively. Therefore, estimates of first year adults were 446 (SE = 0.013) for 2003, 168 (SE = 0.007) for 2004, and 679 (SE = 0.013) for 2005 (Table 4). Gila spp. Population estimates for abundance of all Gila spp. combined (humpback chub, roundtail chub and intermediates) were conducted for comparison to the estimates of individual species. Estimates from 1998-2005 of all Gila spp. combined demonstrated a decline from 1998 to 2005 of 14,598 (SE = 3,339) individuals to 5,576 (SE = 589) individuals (Table 5). Catch Rates Humpback chub 2003- Catch rates of humpback chub in trammel nets varied among sampling passes (Fig. 4). A total of 290 humpback chub were captured in 1,700 total hours of trammel netting; four of these were juveniles (194-199 mm). Mean catch rates of humpback chub in trammel nets were highest during the second pass and nearly equivalent on the first and third passes. Electrofishing was conducted during the second pass at Miner’s Cabin and Lower Cougar Bar (Fig 6). Eighteen humpback chub were collected in 1.76 hours of

8
electrofishing (8.5 fish/hr); two of these were juveniles (190 and 198 mm). An additional 31 juvenile chub (125-187 mm), not identified to species because of size or intermediate characteristics, were collected. 2004- Catch rates of humpback chub in trammel nets varied among the first sampling pass from the second and third (Fig. 4). A total of 297 humpback chub were captured in 1,823.6 hours of trammel netting; seven of these were juveniles (124-197 mm). An additional eight juvenile chub (110-152 mm) and three adult chub (230-304 mm), not identified to species because of size or intermediate characteristics, were collected. Electrofishing was conducted at Miner’s Cabin, Upper Cougar Bar and Lower Cougar Bar on the first pass only (Fig.6). Twenty-eight humpback chub were collected in 4.05 hours of electrofishing (3.7 fish/hr); 15 of these were juveniles (151 and 188 mm). An additional 25 juvenile chub (70-191 mm) and one adult chub, not identified to species because of size or intermediate characteristics, were collected. 2005- Catch rates of humpback chub in trammel nets were relatively consistent among sampling passes in 2005 (Fig. 4). A total of 230 humpback chub were captured in 1,142.3 hours of trammel netting; two of these were juveniles (182 and 197 mm). An additional eighteen juvenile chub (115-185 mm) and four adult chub (230-277 mm), not identified to species because of size or intermediate characteristics, were collected. Electrofishing was conducted during each pass and at the first three of the four sampling sites (Fig. 6). One hundred seventeen humpback chub were collected in 29.8 hours of electrofishing (pass a,b,c, respectively: 2.8, 0.64, 2.8 fish/hr); six of these were juveniles (165-199 mm). An additional 240 juvenile chub (40-197 mm) and seven adult chub, not identified to species because of size or intermediate characteristics, were collected. Roundtail chub 2003- Mean catch rates of roundtail chub in trammel nets increased from the first to second and third passes (Fig.5). A total of 810 roundtail chub were captured in 1,700 hours of trammel netting; eight of these were juveniles (111-199 mm). Electrofishing in 2003 was conducted during the second pass at Miner’s Cabin and Lower Cougar Bar (Fig 6). Sixty-nine roundtail chub were collected in 1.76 hours of electrofishing (30.7 fish/hr); fourteen of these were juveniles (171 and 199 mm). 2004- Catch rates of roundtail chub in trammel nets dropped during the second pass and were roughly equivalent on the first and third pass (Fig. 5). A total of 896 roundtail chub were captured in 1,823.6 hours of trammel netting, 43 of these were juveniles (112-199 mm). Electrofishing was conducted at Miner’s Cabin, Upper Cougar Bar and Lower Cougar Bar on the first pass only in 2004 (Fig 6). Ninety-six rountail chub were collected in 4.05 hours of electrofishing (12.1 fish/hr); 55 of these were juveniles (127 and 198 mm). 2005- Catch rates of roundtail chub in trammel nets did not change significantly among passes (Fig. 5). A total of 483 roundtail chub were captured in 1,142.3 hours of trammel netting; five of these were juveniles (177 and 196 mm). Electrofishing was conducted

9
during each pass at the first three of the four sampling sites (Fig 6). Five hundred sixteen roundtail chub were collected in 29.8 hours of electrofishing (pass a,b,c, respectively: 9.9, 15.7, 16.3 fish/hr); 141 of these were juveniles (119-199 mm). Catch Rate Comparisons Catch rates of humpback chub during population estimate sampling (1998-2005, all passes combined) was significantly higher in 1998 than 2000, 2003 and 2004 (p < 0.05; Fig 7). Catch rates of roundtail chub during the same sampling periods were significantly lower in 2000 than 2003 and 2004 (p < 0.05) and higher overall from 2003-2005 compared to 1998-2000. Catch rates of all Gila spp. (humpback chub, roundtail chub and intermediates) during population estimate sampling (1998-2005) demonstrated a drop in 2000, relative to other years. Catch rates (ISMP pass only) of humpback chub, during the 1998-2000 and 2003-2005 study periods compared to previous ISMP data, with the lowest catch rates during 2000 and 2003 (Fig 8). Regressions of humpback chub catch rate over time (1988-2005, n = 16) indicated a steady significant decline as well (r2 = 0.47, SE = 0.22, p = 0.002). Catch rates of roundtail chub have remained relatively consistent since sampling began in 1988. Regressions for roundtail chub catch rate over time (1988-2005, n = 16) illustrated virtually no change (r2 = 0.04, SE = 0.14, p = 0.43). Length-Frequency Based on length frequency analyses, size structure of the adult portion of the humpback chub population remained relatively consistent (265-269 mm mean TL; Fig. 9) from 2003 to 2005. Mean TL of the adult portion of the roundtail population was smaller (254 mm) in 2005 than previous years (Fig 10). Mean TL of the adult portion of humpback chub from 2003 to 2005 was approximately 15 mm smaller than those from 1998 to 2000 (Table 6). Movement The majority of long-term recaptures (marked prior to the study period) of humpback chub, caught during the study period, were marked in 2000 (Fig. 11). In 2003, an equal number of 1992 marked humpback chub and 1998 marked humpback chub were recaptured. There were no recaptures of 1993 marked humpback chub during any year of the study, even though the number marked was slightly lower yet comparable to other years (n=114). Overall, very few long-term recaptures were handled during the study period excluding the 1992 marked fish. Long-term recaptures of humpback chub illustrated that fish in general tend to demonstrate site fidelity. Approximately 85% of humpback chub recaptured four to 13 years after their original marking event (long-term recaptures) were recaptured at the same sample location, the majority of the remaining 15% moved upstream to other sites within Westwater Canyon. Original capture events for approximately 15% of long-term

10
recaptured humpback chub could not be found within the UDWR database. Identification numbers (PIT tags) may have been recorded incorrectly or other researchers may have originally marked these fish. Previous researchers have documented humpback chub and roundtail chub movement between Black Rocks and Westwater Canyon as well (Hudson and Jackson 2003, Chart and Lentch 1999, Kaeding et al. 1990, Valdez and Clemmer 1982). Long-term recaptures for roundtail chub were lower than for humpback chub (Fig. 12). This indicates that roundtail chub are probably more migratory, moving into and out of Westwater Canyon frequently or are not as long lived as humpback chub. Chart and Lentch (1999) surmised that there was significant replacement of roundtail chub adults on an annual basis. Approximately 26% of long-term recaptures from this study were caught at a different location than that at which they were originally marked. During the 2003-2005 study period, one 1995 marked fish was captured; the remaining were from the 1998-2000 study period. In 2005, approximately half of the long-term recaptured roundtail chub were from 1998. Original capture location of approximately 11% of long-term roundtail chub recaptures collected during the study period could not be determined. This is likely due to the same reasons humpback chub original captures could not be identified (see above). Length-Weight Relationships Length-weight relationships for humpback chub and roundtail chub were developed for the 1998 to 2000 and 2003 to 2005 study periods (Fig. 13). Regression coefficients for humpback chub length weight regression equations during both study periods were nearly equal at 2.9. Regression coefficients from the 1992-1996 study period (Chart and Lentsch 1999) were 2.75, indicating a decrease in the slope of the relationship from previous years (1987-1989) that were in excess of 3, and a decrease in weight at a particular length. The slope of length weight regression equations for roundtail chub during the 2003-2005 study period was 2.9, indicating a slight increase from the 1998-2000 study period exponent of 2.7, and therefore a slight increase in the weight of a fish at a particular length. Regression coefficients from the 1992-1996 study period were similar to those of the 2003-2005 study period yet again lower than those from earlier years (1987-1989; Chart and Lentsch 1999). Comparison of Abundance and Catch Rate Point estimates for humpback chub appeared to track relatively well with catch rate data (trammel net only; three passes combined) from 1998 to 2005 (N=6), and suggested a moderately strong relationship (r = 0.77, p = 0.07). A moderately strong negative relationship was identified between point estimates and catch rates for roundtail chub from 1998 to 2005 (r = -0.87, p = 0.02). When all Gila spp. were combined, no significant relationships were detected between point estimates and catch rates (r = -0.007, p = 0.99).

11
Catch rate data (ISMP data lifted from population estimate data) from 1998-2005 compared to abundance estimates identified weak positive relationships for both humpback chub and roundtail chub (r = 0.52, p = 0.28; r = 0.48, p = 0.33, respectively). River Discharge and Water Temperature Regression analyses performed between abundance and catch rate of humpback chub against river discharge and water temperature did not identify any strong relationships (Table 7). Regressions for roundtail chub against the same parameters identified a moderate but insignificant relationship between abundance and annual discharge (r2 = 0.51, p = 0.11). When all Gila spp. were combined and regressed against the same parameters no relationships were found.
DISCUSSION Model Selection Due to the variability in capture probabilities in 2003 and 2004, I chose the Darroch Mt model for the humpback chub population estimates. Program CAPTURE chose the Mt model in 2003, the Mtb model in 2004, and Mo model in 2005. Since the model selection tool in CAPTURE does not perform well with sparse data such as these, it appears that the best models for the data are the Mo and Mt models. Additionally, heterogeneity (Mh) and behavior (Mb) components are difficult to model when data are sparse. In 2005, the Mo model ranked highest yet the Darroch Mt was used to be consistent among years and the difference in the actual estimates was negligible (1,210 vs. 1,231). During the 1998-2000 study we chose the null model based on model selection in program CAPTURE and little variance in capture probabilities between passes. Assumptions of Models Some closed-model assumptions were likely violated to a small degree during the study period. Due to the nature of Westwater Canyon and our limited ability to sample within it, it is likely that the entire population of humpback chub was not represented. Fish that tend to stay within approximately a mile of sampling sites were likely to be more available for capture. Movement data collected during this study and previous sampling in Westwater Canyon illustrated that humpback chub tend to exhibit site fidelity especially for shorter periods of time. Long-term recaptures (those captured previous to 2001) of humpback chub, with original-captures as far back as 1992, revealed that two out of the six fish recaptured eleven years later had moved one to four miles upstream while the other two were recaptured at their original capture location. It is likely, based on previous data (Valdez et al. 1982) that a portion of the humpback chub population resides in the rapids section of the canyon that is not available for sampling. Demographic closure assumptions were probably met since sampling was conducted in short time periods, making the likelihood of fish moving out of the sampling area low. One humpback chub and one roundtail chub had moved from Black Rocks to Westwater Canyon between 1999 and 2003 but no within-year movement was documented (Chuck

12
McAda, personal communication). Approximately 2% of humpback chub and 3% of roundtail chub caught per pass were identified as having a recent pit tag scar but no detectable tag; indicating some tag loss. Finally, approximately 8% of recaptured humpback chub collected from 2003 to 2005 could not be located in the database. This discrepancy was likely the result of an error in recording the tag number or in recording whether a fish was indeed a recapture. Identification of Gila spp. Even though the Westwater Canyon humpback chub populations morphological characteristics are more easily distinguishable from roundtail chub, than, for example, Desolation/Gray populations, 11% of long-term recaptures (marked prior to 2001) were identified differently from their original capture event or their recapture event. This discrepancy was probably due to the presence of some fish that express both humpback and roundtail chub characteristics. Fin ray data was often used to bolster identifications of chub based on other morphological characteristics mentioned previously. Chub that were not assigned to a species had varying ray counts and researchers were not confident in basing identifications on fin ray counts alone. In many cases a fish identified as a humpback chub would have a count of 9/9; conversely, in fewer cases fish that were obviously roundtail chub would have a ray count of 9/10. Furthermore, many fish had ray counts beyond the typical counts observed (e.g., 7/9, 8/11, etc.). Overall, fin ray counts varied considerably for humpback chub while roundtail chub ray counts were primarily 9/9 each year. During the study period, less than 1% of adult fish were identified as chub (not assigned to a species); and 26 % of juvenile fish were identified as chub. Adult fish with differing identifications may more realistically fall into the intermediate category. During the study period recaptured humpback chub and roundtail chub identifications were considered since 1998 but not prior to that period. Population Estimates and Catch Rates From 2003 to 2005, humpback chub in Westwater Canyon appear to have undergone a decline in population size. Inclusion of estimates from 1998 to 2000 enhanced the slope of this decline and illustrated that confidence intervals from 1998 and 2005 did not overlap, suggesting statistical significance. Furthermore, the proportion of humpback chub making up the catch of all Gila spp. declined from 55% in 1998 to 36% in 1999 to 27% in 2005. Analysis of null model estimates only for the two study periods between 1998 and 2005 demonstrated a similar steep downward trend and non-overlapping confidence intervals (both 95% CI’s and profile likelihood intervals). Darroch Mt models only for the two study periods illustrated a less steep yet downward trend and non-overlapping confidence intervals as well. Further investigation of the 1998 to 2005 data illustrated a slight increase in the estimates between the two study periods (2000 and 2003), when researchers were not conducting estimates. Roundtail chub population estimates in Westwater Canyon were fairly stable between 1998 and 2005, while estimates of the total Gila spp. complex in 2004 and 2005 were about half of those from the 1998-2000 period. Previous population estimates (Chart and Lentsch 1999; Nesler 2000) while not as robust, indicated that the humpback chub population in Westwater Canyon is highly variable.

13
Chart and Lentsch (1999) determined the population to be 5,621 individuals in 1994, 10,148 individuals in 1995, and 5,186 individuals in 1996. Nesler determined the Westwater Canyon humpback chub population to be anywhere from 5,719 in 1993 to 1,164 in 1997. Hudson and Jackson (2003) suggested that point estimates in Westwater Canyon for 1999 and 2000 could be indicative of a leveling off prior to a rebound in the humpback chub population. In 2003 the estimated population of humpback chub in Black Rocks was 478 individuals (McAda 2007). Estimates conducted during 2004 were unreliable and in 2005 were not conducted. Based on the 2003 estimates the humpback chub population (making up the Westwater Canyon/Black Rocks core population) may be below or near the minimum viable population of 2,100 adults identified in the 2002 recovery goals. Precision of estimates increased since 1998, and in 2005 was the highest since population estimate sampling in Westwater Canyon began. In 2003, the Upper Cougar site was added to the protocol and sampled for two nights, increasing coverage of the canyon. Increased precision was a result of more fish being recaptured on subsequent passes, especially in 2005. In that year, electrofishing was conducted for almost 30 hours in contrast to approximately two to four hours in previous years. Electrofishing conducted during the study period proved to be effective in collecting humpback and roundtail chub and was particularly effective in collecting juveniles. Prior to 2005, electrofishing was conducted during one pass to be consistent with ISMP sampling protocol. In 2005, electrofishing was conducted on every pass to increase capture and recaptures of fish. Thirty-six percent of humpback chub individuals caught only once throughout the study were collected by electrofishing and fifty percent of recaptured humpback chub individuals were initially caught, recaptured, or both, by electrofishing. Humpback chub trammel net catch rates continued to decline along with abundance estimates, while roundtail chub trammel net catch rates remained stable. Since abundance estimates began in Westwater in 1998, the Southwestern United States has experienced drought conditions. Humpback chub catch rates during the 1998 to 2005 population estimate sampling period demonstrated an overall declining trend, with the lowest catch rate in 2000. Roundtail chub catch rates were also lowest in 2000. Regressions of catch rate as a function of river discharge did not identify any strong relationships. However, it is likely that reduced river discharge during that year played a role in low catch rates for both species. Declines of other upper Colorado Basin fish have been documented during recent years as well, including humpback chub in Desolation/Gray Canyon on the Green River (Jackson and Hudson 2004), humpback chub in Black Rocks on the Colorado River (McAda 2002) and Colorado pikeminnow in the Green River (Bestgen et al. 2007). Chart and Lentsch (1999) found limited availability of backwater habitat during spring peaks in Westwater Canyon. In their study, higher densities of roundtail chub young-of-year (YOY) were collected in backwaters upstream of the canyon. They proposed that opportunistic use of low velocity areas along shorelines, more typical within Westwater Canyon during high flow years, is likely a life history strategy more common of

14
humpback chub YOY, while roundtail chub are more likely to thrive in low water conditions consisting of slower, shallower shorelines and backwaters. Correspondingly, researchers in Grand Canyon (AZGF 1996) found higher percentages of humpback YOY occupying similar low velocity shoreline habitats and fewer in backwaters. Based on length at age data (Hendrickson 1993), many of the humpback chub adults in 2005 would have been spawned in 2000, suggesting persistence despite unfavorable conditions. Roundtail chub appear to have survived well during the low water conditions as well and may have supplemented the population from outside the canyon. Chart and Lentsch (1999), found that chub reproductive success was maximized when the Colorado River peaked near 30,000 cfs in 1996. In 1998 and 2003, spring flows came close to a high of 30,000 cfs. Humpback chub population estimates in 2003 were around 3,000 individuals, the second highest of the six years of sampling since 1998. Many of these individuals were likely spawned in 1998 (age 5 and approximately 250 mm TL); length frequencies appear to support this as well. Furthermore, Hudson and Jackson (2003) reported an increase in the numbers of age 2 chub in 2000. In 2005, a large number of age 2 chub were collected (approximately 125 mm TL presumably spawned in 2003). It is not clear if this large collection identifies a large year class or is an artifact of the increased electrofishing effort. In either case, it is possible that many of these were humpback chub and will be identified as such in 2007 and 2008, when they will be four and five years of age and likely included in the adult population estimate. Condition and Recruitment Mean total lengths of humpback chub during the 2003-2005 study period decreased slightly from those observed during the 1998-2000 study period. Data from earlier sampling show the adult portion of the humpback chub population was smallest in 1992 (253.2 mm mean TL), and largest in 1995 (287.3 mm mean TL). These most recent decreasing values suggest that recruiting fish may slowly be replacing larger individuals. Length-weight relationships for humpback chub condition were nearly equal during the 1998-2000 and 2003-2005 study periods. These relationships suggest that even though humpback chub catch rates were lower from 1998 to 2005 than from 1992 to 1996, overall condition of humpback chub was higher. During the 1992-1996 study period, roundtail chub were smallest in 1992 at 236.8 mm. Roundtail chub mean TL (254.3 mm) observed in 2005 indicates the presence of many more young adults than in any other year from 1998-2005. Overall condition of roundtail chub has remained relatively good since 1992. Survival estimates were not conducted during the study period, but would greatly benefit the understanding of the humpback and roundtail chub populations in Westwater Canyon. Valdez and Ryel 1995 found that estimates for annual survival of humpback chub (> 200 mm TL) were about 75% in Grand Canyon and the Little Colorado River. It could then be inferred that from the most recent population estimates for humpback chub in Westwater Canyon, a population of 2,973 adults (as in 2003), approximately 728 fish would be lost to mortality. Based on the estimate of first year adults at 253 individuals, approximately three times as many recruits would be needed to make up for adult losses.

15
Survival estimates of other long-lived fish such as Colorado pikeminnow in the Colorado River (Osmundson 1997) were found to be approximately 85%; even at this survival rate humpback chub recruitment would not be sufficient to stabilize the population. Estimates of the juvenile portion of the humpback chub population may continue to be precluded by a limited number of fish collected from this size class. A significant increase in electrofishing effort in 2005 elicited the collection of many more fish yet juvenile humpback chub captures were insufficient for abundance estimations. Part of this insufficiency may be attributed to twenty-six percent of juveniles not being identified to species and therefore not being included in the humpback chub or roundtail chub counts. In the absence of sufficient numbers of juvenile captures and accurate identifications, estimations of recruitment for humpback chub may be unattainable by mark-recapture methods. However, future recapture data from previous juvenile captures will allow for further analysis. Roundtail chub first year adult estimates (200-220 mm TL fish) do not appear much better than for humpback chub, assuming a 25% mortality rate. If estimates are correct, roundtail chub mortality rates should be lower than humpback chub based on the relatively stable population estimates and catch rates, but it may be that roundtail chub are moving in from outside areas to supplement the population or replace themselves more rapidly. In 2005, the first year adult estimate for roundtail chub comprised 13% of the total population, while the estimate from mark-recapture data of the juvenile roundtail chub (150-199 mm TL fish) comprised 23% of the total population and may be sufficient to make up for adult losses in that year. The discrepancy between the juvenile recruit estimate and the first year adult estimate may indicate limited utility of the latter method, but may provide further insight into both Gila spp. populations by identifying a reasonable measure of mortality between juveniles and first year adults. Since direct comparisons of the 2005 juvenile estimates and first year adults are not possible, future estimates will be useful in further analyses. Catch Rates and Population Estimate Comparisons Humpback chub catch rate trends correlated well with abundance estimates during 1998-2005. Yet, a fairly strong negative correlation was found between roundtail chub abundance estimates and catch rates. Bestgen et al. (2007) found a strong positive relationship between Colorado pikeminnow abundance estimates and catch rate on the Green River. Osmundson (2002) did not detect a strong relationship between Colorado pikeminnow abundance and catch rate on the Colorado River. Inability to detect positive relationships and detection of negative relationships between these two measures may be due to bias in the estimates or catch indices since the trend assessment is based mostly on the estimates themselves. For example, negative relationships may have resulted from the utilization of trammel net data only while population estimates included fish caught by all gear types.

16
Handling Concerns and Long-term Recaptures McAda (2002) expressed concern of handling mortality by researchers as a possible cause of the decline observed for humpback chub in Black Rocks just upstream of Westwater Canyon from 1998 to 2000. This concern has been widespread among upper Colorado River Basin researchers and should be considered. Declines in humpback chub estimates within each of the two study periods, and a slight increase in the population estimate between study periods raises the question of handling induced mortality. Immediate mortalities of humpback chub were low, while more mortalities of roundtail chub were observed during the study period. Approximately 0.6 % of humpback chub and 0.4-1% roundtail chub immediate mortalities were observed each year of the study period. Mortalities of roundtail chub may have been even higher since up 0.2-3% were released immediately due to stress (and not tagged). Year-to-year recaptures within the study period were high. Long-term recapture rates (fish recaptured in 2003-2005 marked prior to 2001) of humpback chub were relatively high, usually around 20% each year (1998-2005); and in 2003 six individuals from 1992 were collected. Continual recapture of these relatively old marked fish is perhaps an indication of low resultant mortality. A decrease in the number of long-term recaptures within the study period is not easily explained but may illustrate the limited ability of researchers to effectively sample the habitats where humpback chub reside. Five of the 2003 recaptures were marked in 1998 or prior and had never been recaptured before. Additionally, five of the 2005 recaptures had been marked in 2000 but had never been recaptured until 2005. McAda (2007) presented similar information of humpback chub individuals marked and not recaptured for several years despite their likely continual persistence in Black Rocks.
CONCLUSIONS Population estimates of humpback chub in Westwater Canyon declined during the
study period (2003-2005) but confidence intervals did overlap. However, non-overlapping confidence limits between the 1998 point estimate and the 2005 point estimate indicated a significant decline. Furthermore, based on the 2004 estimates in Black Rocks, the Westwater/Black Rocks core population is likely hovering near or below the minimum viable number of 2,100 adults.
Population estimates for roundtail chub in Westwater Canyon remained stable
during the study period (2003-2005). The trend line for roundtail chub population estimates conducted from 1998-2000 indicated a stable population from 1998 to 2005.
Few captures of juvenile humpback chub precluded estimating that portion of the
population. Instead, estimates were conducted on first year recruits into the adult population. Based on humpback chub mortality rates in Grand Canyon, roughly only one third of juveniles needed to replace adult losses would be recruiting in Westwater Canyon. Potential bias in estimates of recruitment in this fashion make estimates based on juvenile recapture data more desirable but may continue to be difficult to obtain.

17
During the first two years of the study period, juvenile roundtail chub captures
were too low to conduct population estimates for that size class. Instead, estimation of first year adult recruits was conducted and based on those estimates recruits would not offset the mortality of adults. In 2005, an estimate based on juvenile recapture data and was possible and recruitment appeared to be sufficient to replace lost adults. Furthermore, roundtail chub may replace themselves faster than humpback chub and probably move in from outside of the canyon to supplement the population.
Catch rates of humpback chub declined significantly from 1998 to 2004. Catch
rates of humpback chub in 2005 remained low but not significantly compared to 1998. Catch rates of roundtail chub remained relatively unchanged from 1998 to 2005, except for a drop that occurred in 2000.
Humpback chub ISMP catch rates from 1988 to 2005 indicated a steady
significant decline with all time lows in 2000 and 2003. Roundtail chub ISMP catch rates during the same time period indicated no significant change.
Humpback chub abundance estimates and catch rates were positively correlated
from 1998-2005. While a bias in the catch indices was likely responsible for a strong negative correlation between abundance estimates and catch rates of roundtail chub.
RECOMMENDATIONS Estimates of survival and mortality would greatly benefit the further
understanding of the demographics of humpback chub and roundtail chub populations in Westwater Canyon.
Electrofishing should continue to be conducted during every pass to maximize the
number of marked and recaptured fish (which will increase precision of estimates) and to collect the juvenile portion of the humpback chub population.
Inclusion of a radio-telemetry component within the sampling regime would
allow for tracking movements of humpback chub within sites to better determine general behavior of fish and differences in catch rates between passes.
Extra care should be taken in the placement, detection and recording of PIT tags
within fish to prevent mortality and to insure little violation of assumptions of closed models.

18
LITERATURE CITED Arizona Game and Fish Department. 1996. Ecology of Grand Canyon Backwaters. Final Report. Coop Agreement 9-FC-40-07940. AZGFD, Phoenix, Arizona. Bestgen, K.R., J.A. Hawkins, G.C. White, K. Christopherson, M. Hudson, M.H. Fuller, D.C. Kitcheyan, R. Brunson, P. Badame, G.B. Haines, J. Jackson, C.D. Walford, T.A. Sorenson, and T.B. Williams. 2005. Population status of Colorado pikeminnow in the Green River Basin, Utah and Colorado. Transactions of American Fisheries Society 136: 1356-1380. Chart, T.E. and L. Lentsch. 1999. Flow effects on humpback chub (Gila cypha) in Westwater Canyon. Final Report of Utah Division of Wildlife Resources to Upper Colorado River Endangered Fish Recovery Program, Denver, Colorado. Douglas M.E., W.L. Minckley, and H.M. Tyus. 1989. Qualitative characters, identification of Colorado River chubs (Cyprinidae; Genus Gila) and the “art of seeing well”. Copeia. 1989: 653-662. Douglas M.E., R.R. Miller, and W.L. Minckley. 1998. Multivariate discrimination of Colorado plateau Gila spp.: the “art of seeing well” revisited. Transactions of American Fisheries Society 127:163-173. Hendrickson, D.A. 1993. Progress report on study of the utility of data obtainable from otoliths to management of humpback chub (Gila cypha) in the Grand Canyon. Non-Game and Endangered Wildlife Program, Arizona Game and Fish Department, Phoenix. Hudson, M.J. and J.A. Jackson. 2003. Population estimates for humpback chub (Gila cypha) and roundtail chub (Gila robusta) in Westwater Canyon, Colorado River, Utah, 1998-2000. Final report for the Upper Colorado River Basin Endangered Fish Recovery Program Project 22c, Denver, Colorado. Jackson, J.A. and M.J. Hudson. 2005. Population estimates for humpback chub (Gila cypha) and roundtail chub (Gila robusta) in Desolation and Gray Canyons, Green River, Utah, 2001-2003. Final report for the Upper Colorado River Basin Endangered Fish Recovery Program Project 22k, Denver, Colorado. Kaeding, L.R., B.D. Burdick, P.A. Schrader, and C.W. McAda. 1990. Temporal and spatial relations between the spawning of humpback chub and roundtail chub in the upper Colorado River. Transactions of the American Fisheries Society 119:135-144. McAda, C.W. 2002. Population size and structure of humpback chub in Black Rocks, 1998-2000. U.S. Fish and Wildlife Service, Colorado River Fisheries Project Office, Grand Junction, Colorado. McAda, C.W. 2007. Population size and structure of humpback chub Gila cypha in Black Rocks, Colorado River, Colorado 2003-2004.

19
Miller, R.R. 1946. Gila cypha, a remarkable new species of cyprinid fish from the Colorado River in Grand Canyon, Arizona. Journal of the Washington Academy of Sciences 36:409-415. Miller, R.R. 1961. Man and the changing fish fauna of the American Southwest. Papers of the Michigan Academy of Science, Arts and Letters 46:365-404. Minckley, W.L. 1973. Fishes of Arizona. Sims Printing Company, Phoenix, Arizona. NPS 2006. Threatened, endangered and species of concern list. National Park Service. Southeast Utah Group. Nesler T.P. 2000. Recovery of the Colorado River endangered fishes: biological recovery goals and criteria for Colorado pikeminnow, humpback chub, razorback sucker, and bonytail. Colorado Division of Wildlife, Fort Collins, Colorado. Osmundson, D.B., R.J. Ryel, V.L. Lamarra, and J. Pitlick. 2002. Flow-sediment-biota relations: implications for river regulation effects on native fish abundance. Ecological Applications 12:1719-1739. Otis, D.L., K.P Burnham, G.C. White, and D.R. Anderson. 1978. Statistical inference from capture data on closed animal populations. Wildlife Monographs. 62:1-135. Rexstad, E. and K. Burnham. 1991. User’s guide for interactive program CAPTURE. Unpublished report, Colorado Cooperative Fish and Wildlife Research Unit, Colorado State University, Fort Collins, Colorado. UDWR 2006a. Utah sensitive species list. Utah Division of Wildlife Resources. Salt Lake City, Utah. UDWR 2006b. Range-wide conservation agreement for roundtail chub (Gila robusta), bluehead sucker (Catostomus discobolus), and flannelmouth sucker (Catostomus latippinus). Final report for the Colorado River Fish and Wildlife Council, Utah Division of Wildlife Resources, Salt Lake City, Utah. USFS 2006. Sensitive species list. U.S. Forest Service. Rocky Mountain Region (Region 2). USFWS 2002. Humpback chub (Gila cypha) recovery goals: amendment and supplement to the humpback chub recovery plan. U.S. Fish and Wildlife Service, Mountain-Prairie Region 6, Denver, Colorado. Valdez, R.A. and G.C. Clemmer 1982. Life history and prospects for recovery of the humpback chub and bonytail chub. Pages 109-119 in W.H. Miller, H.M. Tyus, and C.A. Carlson (eds.). Fishes of the upper Colorado River system: present and future. Western Division, American Fisheries Society, Bethesda, Maryland.

20
Valdez, R.A., P. Mangan, R. Smith, and B. Nilson. 1982. Part 2 Colorado River Fishery Project Final Report Field Investigations. U.S. Fish and Wildlife Service and U.S. Bureau of Reclamation, Salt Lake City, Utah. White, G.C., D.R. Anderson, K.P. Burnham, and D.L. Otis. 1982. Capture-recapture and removal methods for sampling closed populations. Los Alamos National Laboratory, LA-8787-NERP, Los Alamos, New Mexico.

21
Table 1. Population estimate (N) for adult humpback chub (> 200 mm) in Westwater Canyon 1998-2005. Population estimates generated within program CAPTURE. Standard error (SE), profile likelihood interval (PLI), coefficient of variation (CV), and probability of capture (p-hat) are included with the respective population estimates.
Table 2. Population estimate (N-hat) of first year adult humpback chub (200-220 mm TL) in Westwater Canyon 2003-2005, with respective 95% confidence interval.
Year Number of
HBC 200-220 mm TL
Total HBC collected Estimate 95 % Confidence
Interval
2003 24 284 253 156-350
2004 17 283 104 56-152
2005 21 282 89 53-126
Year Model Estimate SE PLI CV p-hat
1998 Mo 4,744 1,089 3,760-14,665 0.23 0.035
1999 Mo 2,215 624 1,608-7,508 0.28 0.041
2000 Mo 2,201 626 1,335-4,124 0.28 0.041
2003 Mt 2,973 941 1,710-6,042 0.31 0.03, 0.05, 0.02
2004 Mt 1,729 424 1,121-2,967 0.24 0.10, 0.03, 0.04
2005 Mt 1,210 213 880-1,769 0.17 0.06, 0.10, 0.10

22
Table 3. Population estimate (N) for adult roundtail chub (> 200 mm) in Westwater Canyon 1998-2005. Population estimates generated within program CAPTURE. Standard error (SE), profile likelihood interval (PLI), coefficient of variation (CV), and probability of capture (p-hat) are included with the respective population estimates. Note: 2003 estimate includes two passes only due to limited marking of fish.
Year Model Estimate SE PLI CV p-hat
1998 Mo 5,005 1,500 3,586-19,781 0.30 0.026
1999 Mo 4,234 973 3,349-12,917 0.23 0.037
2000 Mo 4,971 1,249 3,824-16,641 0.25 0.031
2003 Mt 3,288 507 2,963-65,760 0.15 0.06, 0.09
2004 Mt 3,867 444 3,124-4,912 0.11 0.09, 0.05, 0.08
2005 Mt 4,273 558 3,356-5,613 0.11 0.05, 0.06, 0.07 Table 4. Population estimate (N-hat) of first year adult roundtail chub (200-220 mm) in Westwater Canyon 2003-2005, with respective 95% confidence interval.
Year Number of
RTC 200-220 mm TL
Total RTC collected Estimate 95% Confidence
Interval
2003 68 501 446 348-545
2004 35 806 168 114-222
2005 119 757 679 567-791

23
Table 5. Population estimate (N) for adult Gila spp. (> 200 mm) in Westwater Canyon 1998-2005. Population estimates generated within program CAPTURE. Standard error (SE), profile likelihood interval (PLI), coefficient of variation (CV), and probability of capture (p-hat) are included with the respective population estimates. Note: 2003 estimate includes two passes only due to limited marking of fish.
Year Model Estimate SE PLI CV p-hat
1998 Mo 14,598 3,340 9,675-23,894 0.23 0.02
1999 Mo 10,318 2,349 6,850-16,838 0.23 0.02
2000 Mo 10,575 2,480 6,944-17,546 0.23 0.02
2003 Mt 15,523 5,457 8,505-33,512 0.34 0.02, 0.03
2004 Mt 5,613 586 4,623-6,973 0.10 0.10, 0.04, 0.07
2005 Mt 5,515 589 4,584-6,946 0.11 0.05, 0.07, 0.08 Table 6. Mean total length (TL), standard deviation (SD) and sample size (n) of adult humpback chub and adult roundtail chub in Westwater Canyon from 1998-2000 and 2003-2005.
HB RT
Year n Mean TL (SD) n Mean TL (SD)
2005 294 269.5 (40.3) 763 254.3 (34.1)
2004 290 265.8 (35.1) 817 265.8 (30.1)
2003 301 269.5 (43.0) 863 263.1 (32.5)
2000 270 290.0 (46.6) 466 274.6 (35.0)
1999 278 292.6 (43.3) 470 279.0 (34.3)
1998 482 278.6 (40.2) 384 266.0 (33.5)

24
Table 7. Regression analysis of several different parameters taken for humpback chub, roundtail chub and all Gila spp. combined in Westwater Canyon. Parameters abbreviations are catch per unit effort per pass in each year (CPUE), river discharge in cubic feet per second (CFS), water temperature in oC (T), abundance estimate for each year (ABD), average annual CFS taken from the corresponding water year (ann CFS), average summer CFS (sum CFS), average spring CFS (spr CFS). N=6 for all parameters.
Year Parameters Humpback chub Roundtail chub All Gila spp.
2003 - 2005 CPUE vs CFS r2 = 0.006, p = 0.83 r2 = 0.21, p = 0.21 r2 = 0.05, p = 0.53
2003 - 2005 CPUE vs T r2 = 0.31, p = 0.12 r2 = 0.01, p = 0.74 r2 = 0.04, p = 0.56
1998 - 2005 ABD vs ann CFS r2 = 0.15, p = 0.44 r2 = 0.51, p = 0.11 r2 = 0.40, p = 0.24
1998 - 2005 ABD vs sum CFS r2 = 0.001, p = 0.93 r2 = 0.11, p = 0.50 r2 = 0.09, p = 0.62
1998 - 2005 ABD vs spr CFS r2 = 0.11, p = 0.51 r2 = 0.38, p = 0.18 r2 = 0.16, p = 0.50

25
Figure 1. Map of the study area.

26
Humpback Chub
0
2000
4000
6000
8000
10000
12000
14000
1998 1999 2000 2003 2004 2005
Year
N-h
at
Figure 2. Abundance (N-hat) of humpback chub adults in Westwater Canyon, 1998 to 2005. Error bars represent profile likelihood intervals.
Roundtail Chub
0
5000
10000
15000
20000
25000
30000
1998 1999 2000 2003 2004 2005
Year
N-h
at
Figure 3. Abundance (N-hat) of roundtail chub adults in Westwater Canyon, 1998 to 2005. Error bars represent profile likelihood intervals. Note: 2003 error bars shown are 95% intervals, actual profile likelihood intervals are 2,963-65,760.

27
Humpback Chub
0
0.1
0.2
0.3
0.4
0.5
2003
A
2003
B
2003
C
2004
A
2004
B
2004
C
2005
A
2005
B
2005
C
Year
CPU
E (fi
sh/tr
amm
el n
et h
our)
Figure 4. Trammel net catch rate (CPUE) of humpback chub (all size classes combined) during each sampling pass in Westwater Canyon from 2003 to 2005. Error bars represent + 1 SE.
Roundtail Chub
0
0.2
0.4
0.6
0.8
1
2003
A
2003
B
2003
C
2004
A
2004
B
2004
C
2005
A
2005
B
2005
C
Year
CPU
E (fi
sh/tr
amm
el n
et
hour
)
Figure 5. Trammel net catch rate (CPUE) of roundtail chub (all size classes combined) during each sampling pass in Westwater Canyon from 2003 to 2005. Error bars represent + 1 SE.

28
0
20
40
60
80
100
120
140
2003A 2004A 2005A 2005B 2005C
Num
ber o
f fis
h
0
5
10
15
20
25
30
35
CPU
E (fi
sh/h
our)
#HB #RT HB cpe RT cpe
Figure 6. Numbers and electrofishing catch rate (CPUE) of adult humpback chub and adult roundtail chub collected in Westwater Canyon from 2003 to 2005.
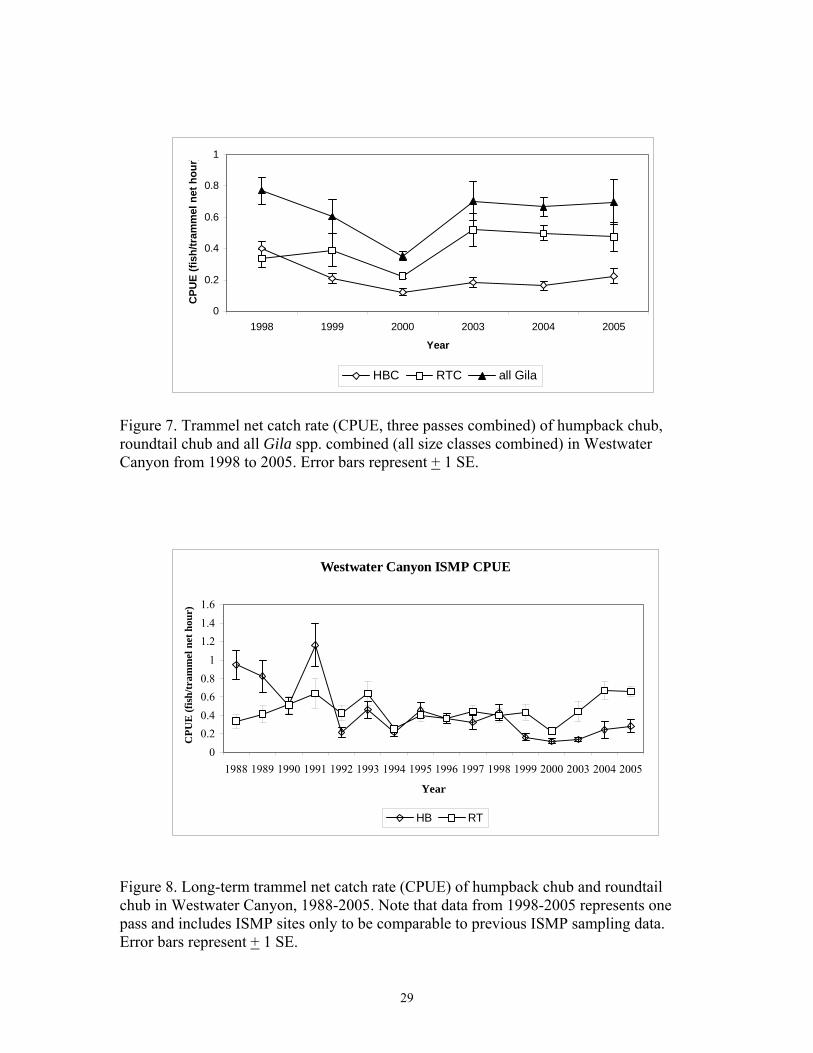
29
0
0.2
0.4
0.6
0.8
1
1998 1999 2000 2003 2004 2005
Year
CPU
E (fi
sh/tr
amm
el n
et h
our)
HBC RTC all Gila
Figure 7. Trammel net catch rate (CPUE, three passes combined) of humpback chub, roundtail chub and all Gila spp. combined (all size classes combined) in Westwater Canyon from 1998 to 2005. Error bars represent + 1 SE.
Westwater Canyon ISMP CPUE
00.20.40.60.8
11.21.41.6
1988 1989 1990 1991 1992 1993 1994 1995 1996 1997 1998 1999 2000 2003 2004 2005
Year
CPU
E (f
ish/
tram
mel
net
hou
r)
HB RT
Figure 8. Long-term trammel net catch rate (CPUE) of humpback chub and roundtail chub in Westwater Canyon, 1988-2005. Note that data from 1998-2005 represents one pass and includes ISMP sites only to be comparable to previous ISMP sampling data. Error bars represent + 1 SE.

30
Figure 9. Length-frequency histograms for humpback chub in Westwater Canyon from 2003-2005. Fish too small to identify to species or intermediates are denoted as CH.
2005 Humpack chub
0
10
20
30
40
25 50 75 100
125
150
175
200
225
250
275
300
325
350
375
400
Total Length (mm)
Freq
uenc
y (n
)
HB CH
2004 Humpback chub
0
10
20
30
40
25 50 75 100
125
150
175
200
225
250
275
300
325
350
375
400
Total Length (mm)
Freq
uenc
y (n
)
HB CH
2003 Humpback chub
0
10
20
30
40
25 50 75 100
125
150
175
200
225
250
275
300
325
350
375
400
Total Length (mm)
Freq
uenc
y (n
)
HB CH

31
Figure 10. Length-frequency histograms for roundtail chub in Westwater Canyon from 2003-2005. Fish too small to identify to species or intermediates are denoted as CH.
2005 Roundtail chub
0
20
40
60
80
100
25 50 75 100
125
150
175
200
225
250
275
300
325
350
375
400
Total Length (mm)
Freq
uenc
y (n
)
RT CH
2004 Roundtail chub
0
20
40
60
80
100
25 50 75 100
125
150
175
200
225
250
275
300
325
350
375
400
Total Length (mm)
Freq
uenc
y (n
)
RT CH
2003 Roundtail chub
0
20
40
60
80
100
25 50 75 100
125
150
175
200
225
250
275
300
325
350
375
400
Total Length (mm)Fr
eque
ncy
(n)
RT CH

32
0%
20%
40%
60%
80%
100%
2003 2004 2005
1992 n=1321994 n=1881995 n=1471996 n=1601998 n=5011999 n=2782000 n=277
Figure 11. Persistence of humpback chub originally marked prior to the study period in Westwater Canyon and recaptured during the study period. Sample size represented parenthetically. Sample size in the legend refers to the number of humpback chub captured and marked during each of those years. Note: 1993 and 1997 are not represented in the chart because no fish were recaptured from that year; sample sizes from 1993 and 1997 were 114 and 51, respectively.
0%
20%
40%
60%
80%
100%
2003 2004 2005
1995 n=1931998 n=3971999 n=4812000 n=521
Figure 12. Persistence of roundtail chub originally marked prior to the study period in Westwater Canyon and recaptured during the study period. Sample size represented parenthetically. Sample size in the legend refers to the number of roundtail chub captured and marked during each of those years. Note: 1992-1994, 1996, 1997 are not represented in the chart because no fish were recaptured from those years; sample sizes were 271, 292, 127, 126, and 126 respectively.
(26) (13) (7)
(12) (8) (6)

33
Figure 13. Length-weight relationships for humpback chub and roundtail chub collected in Westwater Canyon 1998-2000 and 2003-2005. Regression statistics of log 10 transformed data are included.
2003-2005 WW HBC
0100200
300400500600
0 100 200 300 400 500
Total Length (mm)
Wei
ght (
g)
1998-2000 WW HBC
0100200300400500600
0 100 200 300 400 500
Total Length (mm)
Wei
ght (
g)
Log10W= -4.88 + 2.90 log10L R2 = 0.92 n=1033
Log10W= -4.90 + 2.91 log10L R2= 0.88 n=941
2003-2005 WW RTC
0100200300400500600
0 100 200 300 400 500
Total Length (mm)W
eigt
h (g
)
1998-2000 WW RTC
0100200300400500600
0 100 200 300 400 500
Total Length (mm)
Wei
ght (
g)
Log10W= -4.60 + 2.78 log10L R2= 0.83 n=1383
Log10W= -4.92 + 2.91 log10L R2= 0.90 n=2379

34
-Appendix Table 1. Summary of humpback chub and roundtail chub captures by method during each year of the study used to generate population estimates. Original captures are fish that were caught only once throughout the study period. Recaptures include fish caught two to three times throughout the study period. Methods of capture include HN/CN= hoop or cast net, TR= trammel net, EL = electrofishing, both = trammel netting and electrofishing. * Total captures of RTC for 2003 include fish from pass one and two used in the population estimate. Electrofishing was conducted during the second pass in 2003, the first pass in 2004 and all passes in 2005.
Total captures Original captures Recaptures HBC HN/CN TR EL TR EL Both 2005 284 1 166 94 8 4 11 2004 283 0 257 12 14 - - 2003 282 1 257 14 8 - 2
RTC 2005 757 0 398 312 14 12 21 2004 806 7 706 43 50 - - 2003 501* 7 431 59 3 1 -

-Appendix Table 2. Summary of population estimates generated within Program CAPTURE for adult humpback chub in Westwater Canyon, 1998-2000 and 2003-2005. Information for comparison within each year among estimators considered includes the abundance estimate, 95% confidence intervals, coefficient of variation (CV), probability of capture (p-hat). *Values in parentheses are profile likelihood intervals for each point estimate. See Table 1 for selected model.
Year Estimator N 95%
Confidence Interval*
CV p-hat
Mo 4,744 3,085–7,462 (3,760–14,665) 0.23 0.035
Darroch Mt 3,190 2,427–4,251 (2,860–24,710) 0.14 0.05, 0.05, 0.05 1998
Chao Mt 6,243 3,770–10,579 0.27 0.03, 0.03, 0.03
Mo 2,215 1,322–3,863 (1,608–7,508) 0.28 0.041
Darroch Mt 2,670 1,551–4,766 (1,673–6,613) 0.30 0.04, 0.04, 0.02 1999
Chao Mt 2,699 1,502–5,057 0.32 0.04, 0.04, 0.02
Mo 2,201 1,308–3,855 (1,335–4,124) 0.28 0.041
Darroch Mt 1,713 1,116–2,728 (1,218–3,978) 0.23 0.04, 0.04, 0.08 2000
Chao Mt 1,862 1,134–3,199 0.27 0.03, 0.04, 0.07
Mo 3,236 1,803-6,029 (1,857-6,598) 0.32 0.03
Mh 567 525-617 0.04 0.18
Chao Mh 4,645 2,504-8,837 0.33 0.02
Mb 1,558 496-8,113 (578-31,160) 0.95 0.07
Mbh 1,558 496-8,113 (578-31,160) 0.95 0.07
Mth 3,365 1,822-6,463 0.34 0.02, 0.05, 0.02
Mtb 353 305-544 (308-7,060) 0.15 0.22, 0.55, 0.48
Darroch Mt 2,973 1,667-5,521 (1,710-6,042) 0.31 0.03, 0.05, 0.02
2003
Chao Mt 2,676 1,538-4,851 0.30 0.03, 0.06, 0.02
35

-Appendix Table 2. Cont.
Year Estimator N 95%
Confidence Interval*
CV p-hat
Mo 2,016 1,276-3,309 (1,295-3,475) 0.25 0.04
Mh 544 503-592 0.04 0.18
Chao Mh 2,807 1,716-4,729 0.27 0.03
Mb 328 306-369 (305-370) 0.05 0.47
Mbh 328 306-369 (305-370) 0.00 0.47
Mth 2,164 1,305-3,747 0.28 0.08, 0.02, 0.03
Mtb 467 326-9,340 0.44 0.37, 0.17, 0.24
Darroch Mt 1,729 1,108-2,821 (1,121-2,967) 0.24 0.10, 0.03, 0.04
2004
Chao Mt 1,578 1,023-2,548 0.24 0.11, 0.03, 0.04
Mo 1,231 891-1,764 (895-1,803) 0.18 0.08
Mh 540 500-588 0.04 0.19
Chao Mh 1,754 1,202-2,638 0.20 0.06
Mth 1,340 856-2,234 0.25 0.06, 0.09, 0.09
Mtb 3,540 304-542,621 (438-70,800) 27.70 0.02, 0.03, 0.03
Darroch Mt 1,210 877-1,730 (880-1,769) 0.17 0.06, 0.10, 0.10
2005
Chao Mt 1,202 860-1,747 0.18 0.06, 0.10, 0.10
36

-Appendix Table 3. Summary of population estimates generated within Program CAPTURE for adult roundtail chub in Westwater Canyon, 1998-2000 and 2003-2005. Information for comparison within each year among estimators considered includes the abundance estimate, 95% confidence intervals, coefficient of variation (CV), probability of capture (p-hat). *Values in parentheses are profile likelihood intervals for each point estimate. See Table 3 for selected model. Note: 2003 includes two passes only due to limited marking of fish.
Year Estimator N 95%
Confidence Interval*
CV p-hat
Mo 5,005 2,869-8,980 (3,586-19,781) 0.30 0.03
Darroch Mt 2,553 1,824-3,651 (2,180-27,386) 0.18 0.01, 0.06, 0.09 1998
Chao Mt 5,121 2,738-9,922 0.34 0, 0.03, 0.04
Mo 4,234 2,754-6,665 (3,349-12,917) 0.23 0.04
Darroch Mt 2,999 2,231-4,100 (2,662-16,739) 0.16 0.03, 0.05, 0.07 1999
Chao Mt 5,129 3,115-8,673 0.27 0.02, 0.03, 0.04
Mo 4,971 3,107-8,144 (3,824-16,641) 0.25 0.03
Darroch Mt 5,038 3,266-7,929 (3,718-14,667) 0.23 0.03, 0.02, 0.05 2000
Chao Mt 6,116 3,544-10,831 0.29 0.02, 0.02, 0.04
Mo - - - -
Darroch Mt 3,288 2,458-4,469 (2,963-65,760) 0.15 0.06, 0.09 2003
Chao Mt - - - -
37

-Appendix Table 3. Cont.
Year Estimator N 95%
Confidence Interval*
CV p-hat
Mo 3,345 2,750-4,121 (3,041-5,490) 0.10 0.08
Mh 1,542 1471-1621 0.02 0.19
Chao Mh 5,522 4,327-7,124 0.13 0.05
Mb 2,336 1,552-3,947 (1629-5205) 0.25 0.13
Mbh 2,336 1,552-3,947 (1629-5205) 0.22 0.13
Mth 3,058 3,058-5,311 0.19 0.09, 0.05, 0.08
Mtb 2,384 1,213-6,946 (1,346-47,680) 0.52 0.15, 0.08, 0.15
Darroch Mt 3,867 3,112-4,868 (3,124-4,912) 0.11 0.09, 0.05, 0.08
2004
Chao Mt 3,780 3,027-4,788 0.11 0.09, 0.05, 0.08
Mo 4,317 3,371-5,608 (3,390-5,673) 0.13 0.06
Mh 1,459 1,390-1,536 0.03 0.18
Mth 4,841 3,441-6,974 0.18 0.05, 0.06, 0.07
Mtb 33,733 1,070-3,482,086 (1,433-674,660) 0.01, 0.01, 0.01
Darroch Mt 4,273 3,338-5,547 (3,356-5,613) 0.11 0.05, 0.06, 0.07
2005
Chao Mt 4,366 3,368-5,745 0.14 0.05, 0.06, 0.07
38
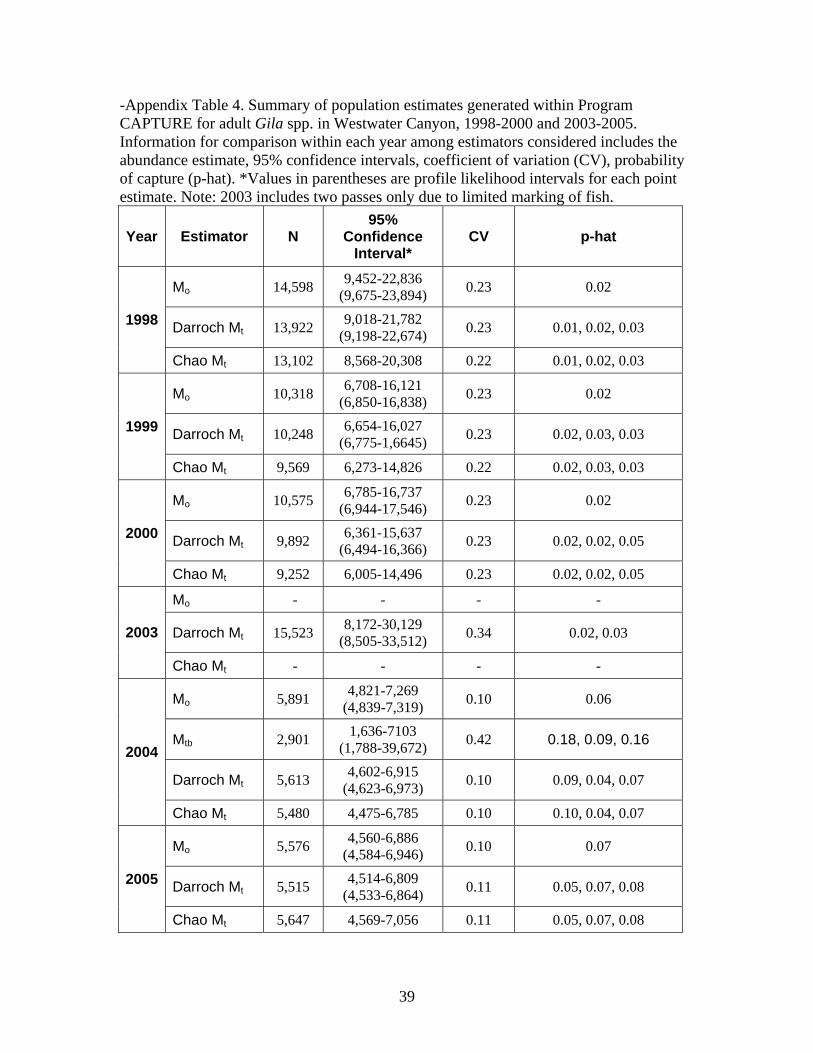
39
-Appendix Table 4. Summary of population estimates generated within Program CAPTURE for adult Gila spp. in Westwater Canyon, 1998-2000 and 2003-2005. Information for comparison within each year among estimators considered includes the abundance estimate, 95% confidence intervals, coefficient of variation (CV), probability of capture (p-hat). *Values in parentheses are profile likelihood intervals for each point estimate. Note: 2003 includes two passes only due to limited marking of fish.
Year Estimator N 95%
Confidence Interval*
CV p-hat
Mo 14,598 9,452-22,836 (9,675-23,894) 0.23 0.02
Darroch Mt 13,922 9,018-21,782 (9,198-22,674) 0.23 0.01, 0.02, 0.03 1998
Chao Mt 13,102 8,568-20,308 0.22 0.01, 0.02, 0.03
Mo 10,318 6,708-16,121 (6,850-16,838) 0.23 0.02
Darroch Mt 10,248 6,654-16,027 (6,775-1,6645) 0.23 0.02, 0.03, 0.03 1999
Chao Mt 9,569 6,273-14,826 0.22 0.02, 0.03, 0.03
Mo 10,575 6,785-16,737 (6,944-17,546) 0.23 0.02
Darroch Mt 9,892 6,361-15,637 (6,494-16,366) 0.23 0.02, 0.02, 0.05 2000
Chao Mt 9,252 6,005-14,496 0.23 0.02, 0.02, 0.05
Mo - - - -
Darroch Mt 15,523 8,172-30,129 (8,505-33,512) 0.34 0.02, 0.03 2003
Chao Mt - - - -
Mo 5,891 4,821-7,269 (4,839-7,319) 0.10 0.06
Mtb 2,901 1,636-7103 (1,788-39,672) 0.42 0.18, 0.09, 0.16
Darroch Mt 5,613 4,602-6,915 (4,623-6,973) 0.10 0.09, 0.04, 0.07
2004
Chao Mt 5,480 4,475-6,785 0.10 0.10, 0.04, 0.07
Mo 5,576 4,560-6,886 (4,584-6,946) 0.10 0.07
Darroch Mt 5,515 4,514-6,809 (4,533-6,864) 0.11 0.05, 0.07, 0.08 2005
Chao Mt 5,647 4,569-7,056 0.11 0.05, 0.07, 0.08

40
-Appendix Table 5. Electrofishing CPUE (number of fish/hour) for all juvenile humpback chub (HBC), roundtail chub (RTC) and intermediate or unidentifiable chub (CH) captured during each year of the study period in Westwater Canyon.
Electrofish hours HBC RTC CH
2003 1.76 1.14 7.95 17.61
2004 4.05 3.70 13.58 6.17
2005 29.8 0.20 4.73 8.05
-Appendix Table 6. Fin ray count (dorsal/anal) percentages for humpback chub (HBC), roundtail chub (RTC) and intermediate or unidentifiable chub (CH) captured during each year of the study period in Westwater Canyon.
Dorsal/Anal 2003 2004 2005
9/9 35 49 38
HBC 9/10 57 40 45
Other 8 11 17
9/9 77 75 65
RTC 9/10 18 14 16
Other 5 11 19
9/9 83 37 77
CH 9/10 17 25 11
Other 0 38 12