Embed Size (px)
Citation preview
Population Geography Distribution of World Population Population Statistics Population Pyramids Demographic Transition Model Population Control Overpopulation (Malthus and Neo-
Malthusians
PalestinianTerritories
Fertility Rate
1975-1980 7.39
1980-1985 7.00
1985-1990 6.43
1990-1995 6.46
1995-2000 5.99
2000-2005 5.57
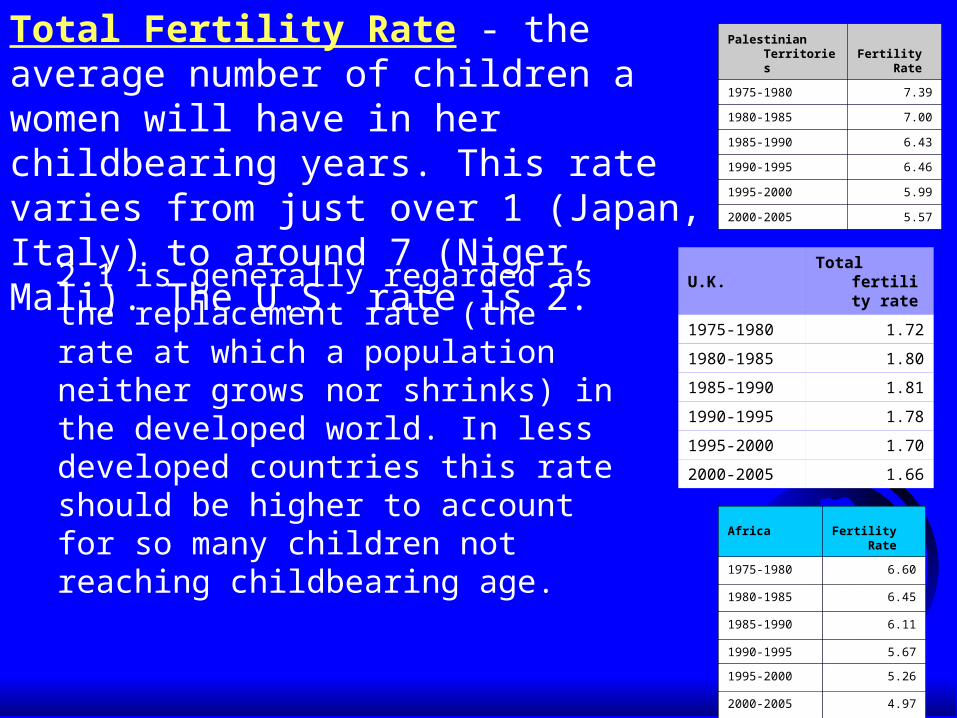
2.1 is generally regarded as the replacement rate (the rate at which a population neither grows nor shrinks) in the developed world. In less developed countries this rate should be higher to account for so many children not reaching childbearing age.
Africa Fertility Rate
1975-1980 6.60
1980-1985 6.45
1985-1990 6.11
1990-1995 5.67
1995-2000 5.26
2000-2005 4.97
U.K.Total
fertility rate
1975-1980 1.72
1980-1985 1.80
1985-1990 1.81
1990-1995 1.78
1995-2000 1.70
2000-2005 1.66
Total Fertility Rate - the average number of children a women will have in her childbearing years. This rate varies from just over 1 (Japan, Italy) to around 7 (Niger, Mali). The U.S. rate is 2.

Infant Mortality Rate – the number of deaths of children under the age of one per thousand live births. The rate ranges from as low as 3 (Singapore, Iceland) to as much as 150 (Sierra Leone, Afghanistan). The U.S. rate is just over 6. High infant mortality tends to result in higher fertility rates as families seek “insurance” for the loss of children.
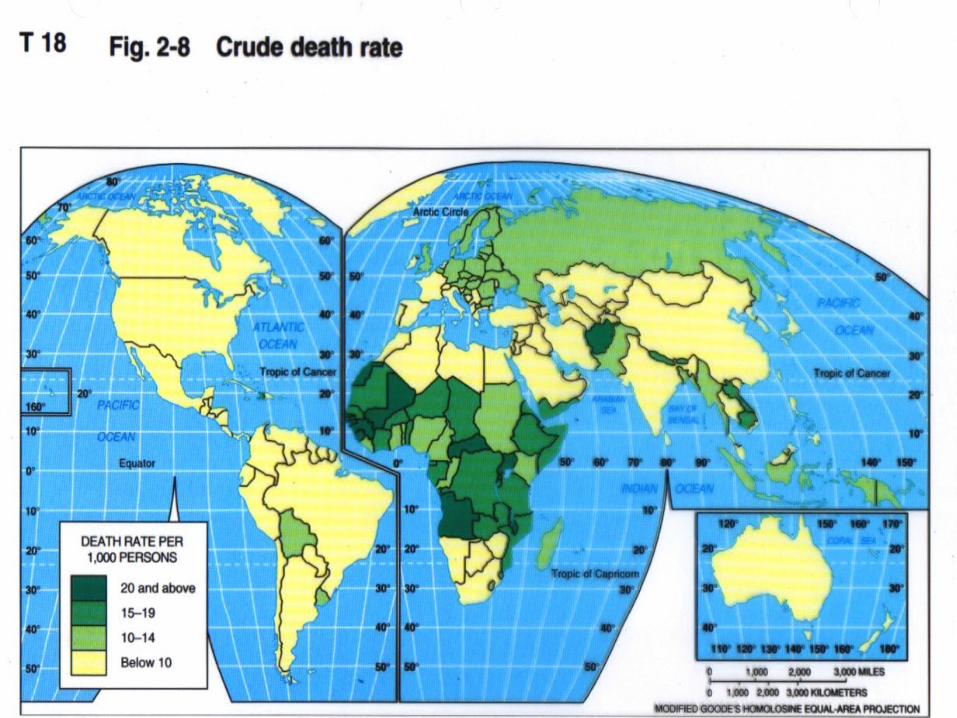
World Death Rates
Infectious diseases– HIV/AIDS– SARS
Degenerative diseases– Obesity– Tobacco use
Epidemiology Epidemiological transition
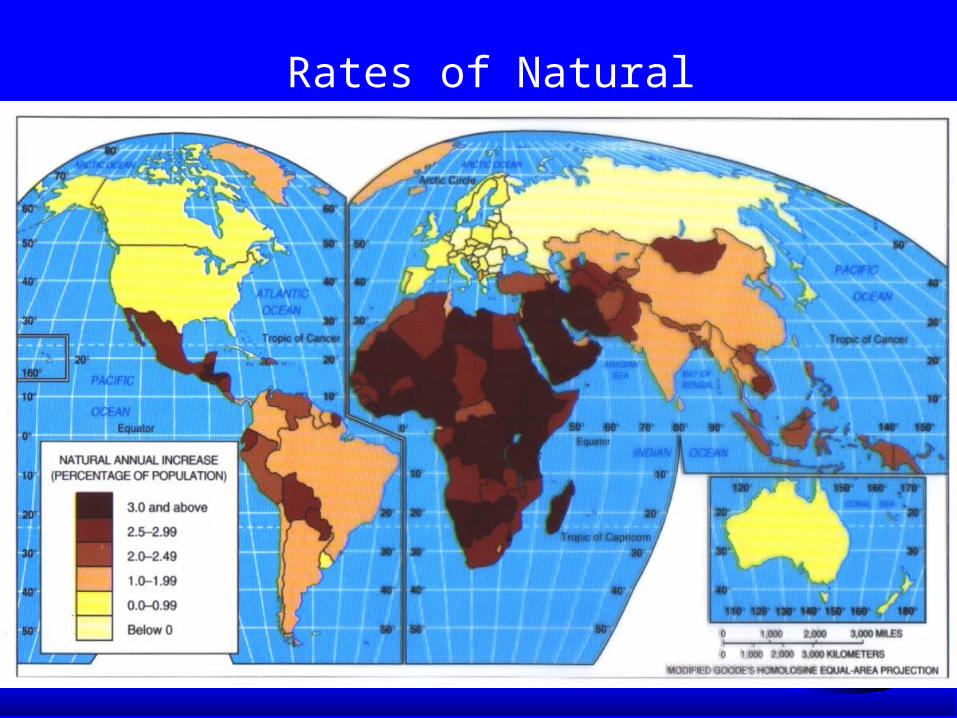
Rates of Natural Increase

Demographic Transition Model
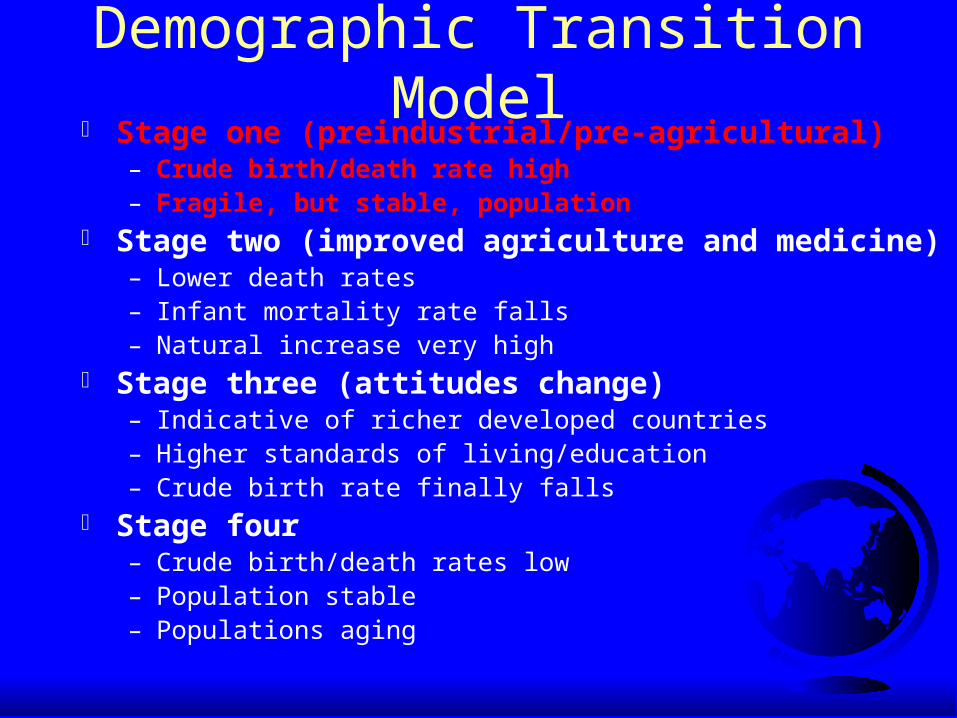
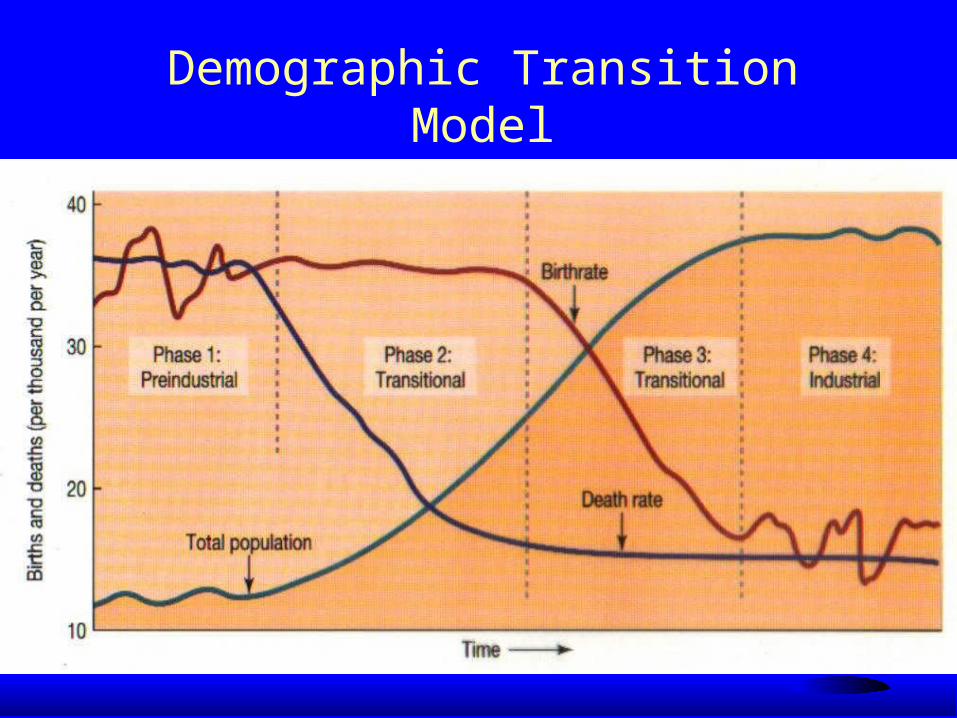
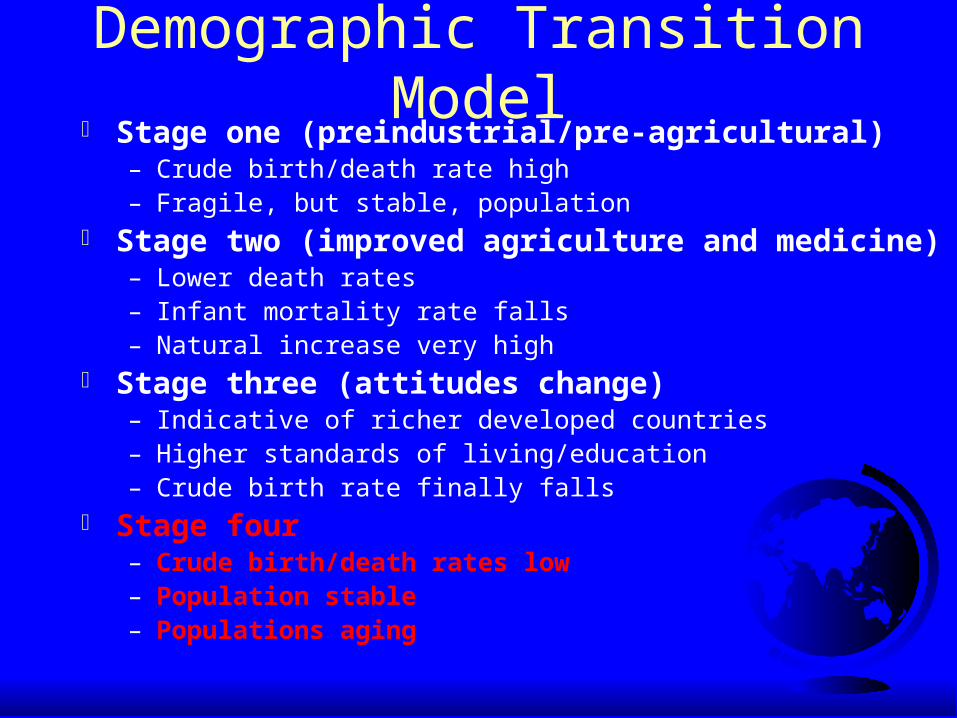
Demographic Transition Model
Stage one (preindustrial/pre-agricultural)– Crude birth/death rate high– Fragile, but stable, population
Stage two (improved agriculture and medicine)– Lower death rates– Infant mortality rate falls– Natural increase very high
Stage three (attitudes change)– Indicative of richer developed countries– Higher standards of living/education– Crude birth rate finally falls
Stage four – Crude birth/death rates low– Population stable– Populations aging

First stage
Stage OneHigh StationaryPre-industrial
stage
First StageHigh Birth RateHigh Death RatePopulation Stationary

Demographic Transition Model

Demographic Transition Model
Stage one (preindustrial/pre-agricultural)– Crude birth/death rate high– Fragile, but stable, population
Stage two (improved agriculture and medicine)– Lower death rates– Infant mortality rate falls– Natural increase very high
Stage three (attitudes change)– Indicative of richer developed countries– Higher standards of living/education– Crude birth rate finally falls
Stage four – Crude birth/death rates low– Population stable– Populations aging
Second Stage
Stage twoEarly expandingEarly industrial
Second Stage Industrial revolution Migration to urban Increase in health,
people live longerBetter sewage, food,
water

Demographic Transition Model
Demographic Transition Model
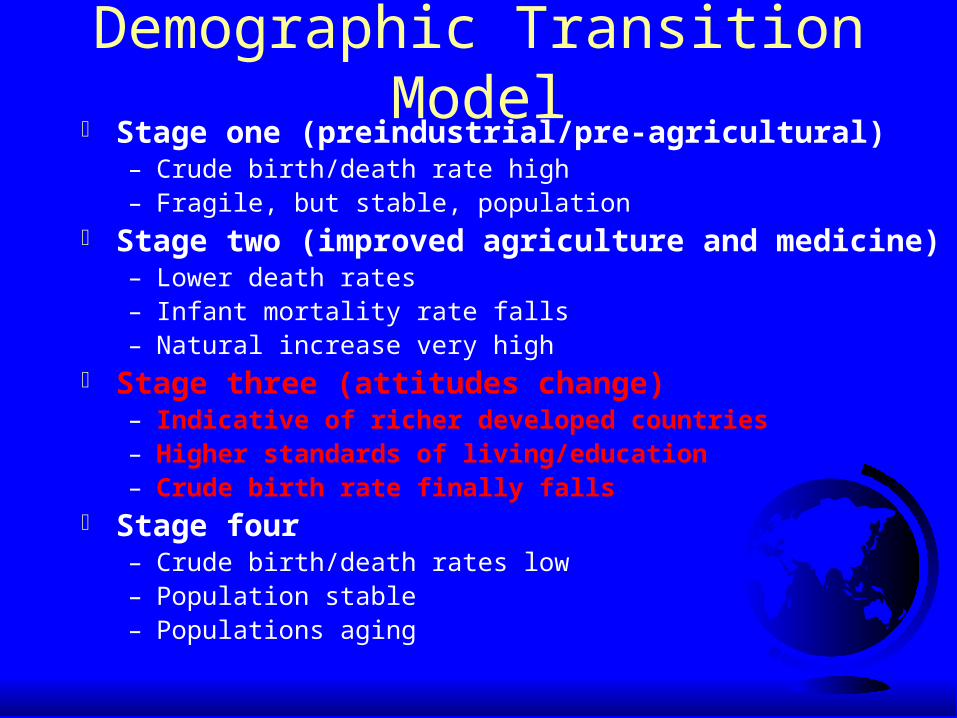
Stage one (preindustrial/pre-agricultural)– Crude birth/death rate high– Fragile, but stable, population
Stage two (improved agriculture and medicine)– Lower death rates– Infant mortality rate falls– Natural increase very high
Stage three (attitudes change)– Indicative of richer developed countries– Higher standards of living/education– Crude birth rate finally falls
Stage four – Crude birth/death rates low– Population stable– Populations aging

Third Stage
Stage threeLate expandingLate industrial
Third Stage Industrial revolution Migration to urban
Fewer farmer, more machines,
Children become a liability Less need for children,
drop in births
Third StagePopulation continues
to growOlder baby boom must age enough to
get old enough to die
Demographic Transition Model
Demographic Transition Model
Stage one (preindustrial/pre-agricultural)– Crude birth/death rate high– Fragile, but stable, population
Stage two (improved agriculture and medicine)– Lower death rates– Infant mortality rate falls– Natural increase very high
Stage three (attitudes change)– Indicative of richer developed countries– Higher standards of living/education– Crude birth rate finally falls
Stage four – Crude birth/death rates low– Population stable– Populations aging

Fourth StageStage Four
Low stationaryPost industrial

Fourth StageBirth and death rates
lowPopulation stable
Less need for childrenMore educated women

Demographic Transition Model

Stage FiveService SectorPost industrial
Stage FiveDeath rate stable
Birth rates fallPopulation drops

Exceptions to model
DiseaseGovernment
Culture
Problems with the Demographic Transition
Model
• based on European experience, assumes all countries will progress to complete industrialization
• many countries reducing growth rate dramatically without increase in wealth
• on the other hand, some countries “stuck” in stage 2 or stage 3