Embed Size (px)
Citation preview
Geoforum 9172 7
Population of the USSR - Changes in Its Demographic, Social, and Ethnic Structure
Die BevSlkerung der UdSSR - Vergnderungen ihrer demographischen, sozialen und ethnischen Struktur
La population de I’URSS - changements de sa structure dbmographique, sociale et ethnique
S. I. BROOK, Moscow*
Abstract: The article brings under consideration the changes in the composition of the population of the USSR and its
distribution by Union and Autonomous Republics. The analysis is based on census data (especially on the two latest
censuses - that of 1959 and 1970). The components of natural population change are shown (birth and death rates, etc.),
changes in the sex and age structure, and in the conditions of reproduction as a whole; as are trends in ethnic composi-
tion and linguistic affiliation, in educational levels, and other indices.
Zusammenfassung: Der Aufsatz behandelt die Verfnderungen in der Bevolkerungszusammensetzung der UdSSR, aufge-
schliisselt nach Unions- und Autonomen Republiken. Die Analyse griindet sich auf Zensusdaten, vor allem auf die beiden
letzten Volkszahlungen von 1959 und 1970. Aufgezeigt werden die Merkmale der natiirlichen Bevolkerungsbewegung
(Geburts- und Sterberaten), Veranderungen in der Geschlechts- und Altersstruktur, sowie der Bevolkerungsentwicklung
im allgemeinen. Schlieglich werden Tendenzen der ethnischen Zusammensetzung, der sprachlichen Zugehorigkeit, des
Bildungsniveaus und anderer lndizes beleuchtet.
Resume: L’article Ctudie les changements dans la composition demographique de la population de I’URSS, par republique
fed&de et par rdpublique autonome. L’analyse s’appuie sur des donnees de recensements, en particulier sur celles des
deux derniers, de 1959 et 1970. Sont prdsente’es les caractdristiques du mouvement nature1 de la population (taux de
natalitd et de mortalite), les changements dans la composition par sexe et par age, ainsi que le developpement de la
population en g&&al. L’ktude Porte dgalement sur I’evolution d’autres indices, parmi lesquels, la composition ethnique
et linguistique ainsi que le niveau de culture.
In the Soviet period, the population of the USSR has under-
gone radical changes both as to numbers and territorial
distribution. The percentages of urban and rural popula-
tion have also changed. As a result of socialist reconstruc-
tion, radical changes have taken place in the class and
social structure of the population and in educational stand-
ards. Owing to new conditions prevailing in the country,
demographic processes (reproduction of the population,
migrations) have taken a new course. In this paper, we
shall try to trace some aspects of those changes drawing
widely for our conclusions upon data from the recent
population census in the USSR.
Here and below all data on the population of the USSR refer
to the present-day boundaries of the USSR; only for 1926,
data is given within the boundaries that existed prior to Septem-
ber 17, 1939.
Prof. Dr. Solomon I. BROOK, institute of Ethnography,
USSR Academy of Sciences, Dmitriya Ulianova 19, Moscow
V-36, USSR
In the last one hundred years, the population of the USSR
has changed as follows (in millions).l)
Jan. I,1870 . . . . . . . . . . . . . . . . . . 86.3
Jan. I,1897 . . . . . . . . . . . . . . . . . . 124.6
Endof 1913 . . . . . . . . . . . . . . . . _. 159.2
Ian. I,1940 . . . . . . . . . . . . . . . . . . 194.1
Jan. I,1950 . . . . . . . . . . . . . . . . . . 178.5
Jan. 151959 . . . . . . . . . . . . . . . . . . 208.8
Ian. T5,1970 . . . . . . . . . . . . . . . . . . 241.7
In spite of great population losses suffered during two
world wars and the Civil War, the population of the country
has been growing at a fairly rapid rate. In one hundred
years it grew 2.8 times, and it doubled in approximately
75 years. In 1970, the population of the USSR exceeded
that of prerevolutionary Russia by 82.5 million or by
51.9 %. In the last twenty years, it increased by 63.2
million or by 35.4 % (during the same period of time the
population of the rest of Europe increased only by 17.9 %).
8 Geoforum 9/72
During the eleven years since the 1959 census, the popula-
tion of our country has grown by 32.9 million (15.8 %)
with an average annual population growth rate of almost
3 million or 1.34 % (for comparison it may be noted that
during the same period the population growth rate in the
USA was 1.27 %, while in Great Britain, France, the Federal
Republic of Germany, and Japan this rate varied within
0.6-l .l % limits).
In comparison with the prerevolutionary period, the popu-
lation of the Middle Asian Union republics and Kazakhstan
increased more than 2.5 times, and in the Transcaucasian
republics it more than doubled. At the same time, the
population in all the western republics of the USSR was
growing more slowly (lo-40 %). The only exceptions are
the Moldavian SSR, where the population increased by
73.6 %, and the Latvian SSR, where it even decreased a
little.
Population trends also vary considerably within the large
republics of the USSR. During 1940-1970 in the Russian
Federation, the population increased by 44.3 % in the
Ural area, by 32.0 % in West Siberia, by 51.9 % in East
Siberia, by 83.2 % in the Far East, and by 36.1 % in North
Caucasus; at the same time the population of the Volga-
Vyatka economic region decreased by 6.0 %, and in the
Central Black Earth economic region by as much as 13.7 %.
As for the Ukrainian SSR, population in the southern
region of the republic increased by 28.4 %, while the in-
crease for the southwestern region was only 3.6 %.
In the autonomous republics of the various nationalities,
population growth was also uneven, but on the average the
rates in these republics were somewhat higher than that for
the country as a whole. During 1959-l 970, population
grew by 18.0 % in the autonomous republics, by 16.9 %
in the autonomous oblasts, and by 33.2 % in the national
districts; its increase was most rapid in the Checheno-
lngush ASSR, the Nakhichevan ASSR, and the Kabardino-
Balkarsk ASSR (40-50 %), and most slow in the autono-
mous republics of the Volga region and in the Karelian
ASSR. (In these republics population growth amounted
only to 3-l 1 %). The Khanti-Mansi and the Chukotsk
national districts hold a “record” in population growth;
their population more than doubled in the last eleven years.
Uneven population increases in various regions of the
country can be attributed to a wide variety of reasons.
With the beginning of industrialization of the country’s
economy, population started migrating to poorly devel-
oped eastern and southeastern regions of the country. The
Great Patriotic War has also left its aftereffects. As is well
known, the western regions of the country suffered most
severely, having lost a considerable percentage of their
population in the course of military operations and during
the temporary occupation of these regions by the German
fascist troops; in addition, a part of the population moved
to the central and eastern regions of the country. In the
fifties and sixties, a considerable contingent of the popula-
tion moved from these regions to the virgin and long-
fallow lands. Nevertheless, for most USSR regions, dif-
ferences in the population growth rates depend first of
all upon the characteristics of population reproduction,
i. e., upon the correlation of birth and death rates (see be-
low).
Average population density in the USSR in 1970 was
10.9 persons per km2 ; density slightly exceeded 30 per-
sons per km* in the European part of the country and was
only 3 persons per km2 in the Asian part.
Average population density (per km*) in the Union re-
publics of the USSR as of January 15, 1970 is shown
below.
Russian Federation - 7.6
Ukrainian SSR - 78.1
Byelorussian SSR - 43.4
Uzbek SSR _ 26.6
Kazakh SSR _ 4.7
Georgian SSR - 67.3
Azerbaijan SSR _ 59.0
Lithuanian SSR _ 48.0
Moldavian SSR - 106.0
Latvian SSR _ 37.1
Kirghiz SSR ~ 14.8
Tajik SSR _ 20.3
Armenian SSR _ 83.7
Turkmen SSR _ 4.4
Estonian SSR _ 30.1
Central regions of the European part of the USSR, es-
pecially those between the Volga and the Oka rivers, as
well as regions of the Donets basin and the right-bank
Ukraine, the Moldavian SSR, and many regions of Trans-
caucasia and Middle Asia are the most densely populated
areas of the USSR. According to the recent population
census, the average population density in the most densely
populated oblasts of the country was: in Moscow oblast
(city of Moscow included) ~ 273.1 persons per km’, in
Andizhan oblast - 246.5, in Fergana oblast - 187.4, in
Donets oblast - 184.7, in Tashkent oblast (city of Tash-
kent included) - 183.6; in Khorezm oblast - 123.2, in
Kiev oblast (city of Kiev included) - 119.6, in Lvov ob-
last - 111.4, in Namangan oblast - 108.6, in Tchernowitsi
oblast - 104.3 persons per sq. km. The population density
was lowest in the national districts: the Evenk district -
0.02 persons per sq. km, Taimyr (Dolgano- Nenets) dis- trict - 0.04, Koriyak, Chukotsk, and Yamal-Nenets dis-
tricts - 0.1 each, Nenets district - 0.2, Khanti-Mansi district
- 0.5 persons per sq. km. Very low population density is
shown by the Yakut ASSR --. 0.2 persons per sq. km,
Magadan, the Kamchatka, and the Tiumen oblasts ~ 0.3,
0.6, and 1 .O persons per sq. km respectively, by Kras-
noyarsk Kray - 1.2, the Tuva ASSR - 1.4, the Gorno-
Badakhshan autonomous oblast ~ 1.5 persons per km*.
Geoforum 9/72 9
The bulk of the rural population lives in the southern and
central regions of the European part of the USSR with the
highest densities (over 100 persons per km2) in the
Dniester valley and some regions of the Ukraine. The rural
population density is much lower in the taiga forest zone
and especially in the tundra zone of the European North,
where the population is almost exclusively concentrated
in the valleys of the major rivers; rural population is also
rather sparse in the arid steppes and semideserts of the
southeastern area of the European part of the USSR. In
the Caucasus, the river valleys and the Black Sea coast are
densely populated (over 150 persons per km2). In the
Asian part of the USSR, the regions along the Transsiberian
railway, the foothills of the Ural, and the Altay mountains,
the Amur river region, the southern part of, the Primorye
territory, as well as the valleys and the foothills in the
Middle Asian republics (these latter feature the highest
rural population density in the USSR - over 200 persons
per km2) are comparatively densely populated; as to the
rest of the USSR territory - the taiga and tundra zones of
Siberia and the Far East, the deserts and semideserts of
Middle Asia, and the arid steppes of Kazakhstan - popula-
tion is extremely sparse (less than one person per km2).
The proportion of urban population is steadily rising in
the USSR; it increased from 18 % in 1926 to 56 % in 1970.
An actual numerical decrease in rural population was
registered as early as the 1939 census; this was a result of
rural-urban migration.
In 1961, the urban population of the USSR first outnum-
bered the rural population.2)
The highest percentage of urban population is characteristic,
on the one hand, of the old industrial regions (Leningrad
oblast including the city of Leningrad - 90 %, Donets
oblast - 87 %, Moscow oblast including the city of Moscow
- 86 %, Voroshilovgrad oblast - 83 %, Sverdlovsk oblast
- 81 %, Cheliabinsk oblast - 78 %, Dniepropetrovsk
oblast - 76 %) and, on the other hand, of the northern
and eastern regions of the USSR where industrial develop-
ment began in the postrevolutionary period (Murmansk
oblast - 89 %, Kemerovo oblast - 82 %, Karaganda oblast
- 81 %, Sakhalin oblast - 78 %, Khabarovsk Kray - 78 %,
Kamchatka oblast - 76 %, Magadan oblast - 75 %). At the
same time in oblasts where agriculture predominates, the
urban population does not exceed a quarter of the total
(Surkhandaria oblast, Kashkadaria oblast, Khorezem oblast,
Syrdaria oblast and Andijan oblast of the Uzbek SSR,
Ternopol oblast and Vinnitsa oblast of Ukrainian SSR).
In 1970, the number of urban settlements in the USSR
reached 5,500. This number as well as urban population
numbers are steadily increasing. There is quite a number
of towns that have come into being in the Soviet period
2) For details see papers by V. V. POKSHISHEVSKY and S. A.
KOVALEV published in this issue of Geoforum
where no habitation existed before, mainly as a result of
the development of various industries. Only in the post-
World War I I period, 25 cities of over 50,000 population
each have sprung up in the USSR. Two of these cities
(Togliatti and Angarsk) now number over 200,000 popula-
tion each; five more (Bratsk, Volzhskiy, Salavat, Nakhodka,
Novokuibishevsk) have each over 100,000 inhabitants. Old
cities have also grown larger, especially capitals of the
Union republics, autonomous republics, and autonomous
oblasts.3) The largest industrial centres have as a rule not
less than doubled in comparison with the prewar period
(1939); population in Kuibishev, Cheliabinsk, Krasnoyarsk,
Krivoi-Rog, Karaganda, Ulyanovsk, Ryazan, Tiumen,
Chimkent, Vladimir, and Orsk has been more than tripled;
in Lipetsk and Kurgan it increased more than fourfold; in
Cherepovets almost six times and in Ust-Kamenogorsk -
11.5 times.
Urbanization has profoundly influenced demographic and
ethnic processes. In urban places the birth and natural in-
crease rates are, as a rule, somewhat lower than in the
countryside; this results in a smaller percentage of children
in urban regions. Urban population is more ethnically
mixed owing to the inflow of population from various
regions of the country. In urban centres, processes of
ethnic mixing take place more rapidly owing to close con-
tacts, characteristic of urban population, and to higher
social mobility.3
1. Demographic Characteristics
1 .I. Population reproduction
The most important demographic characteristics of popula-
tion reproduction (birth rate, death rate, rate of natural
increase) exert a very strong influence upon trends and
distribution of population, upon changes in the composi-
tion of population by nationality, and upon a number of
other characteristics. Therefore, in Soviet population
statistics great attention is paid to reproduction processes
(Table 1).
Before the October Revolution, a high rate of natural in-
crease (one of the highest in the world at that time) was
characteristic of the Russian Empire; this was the result
of a very high birth rate and high death rate. After the
Revolution, natural increase became even higher mainly
owing to the rapid drop in the death rate (the birth rate
For example, the population of Alma-Ata increased from 1939
to 1970 more than three times, that of Erevan and Minsk al-
most four times, of Frunze - 4.5 times, of Elista, Syktyvkar,
Nukus - 5-7 times.
Ethnic processes taking place in the USSR at present are spe-
cially discussed in V. I. KOZLOV’s paper published in this issue
of Geoforum.
10 Geoforum 9172
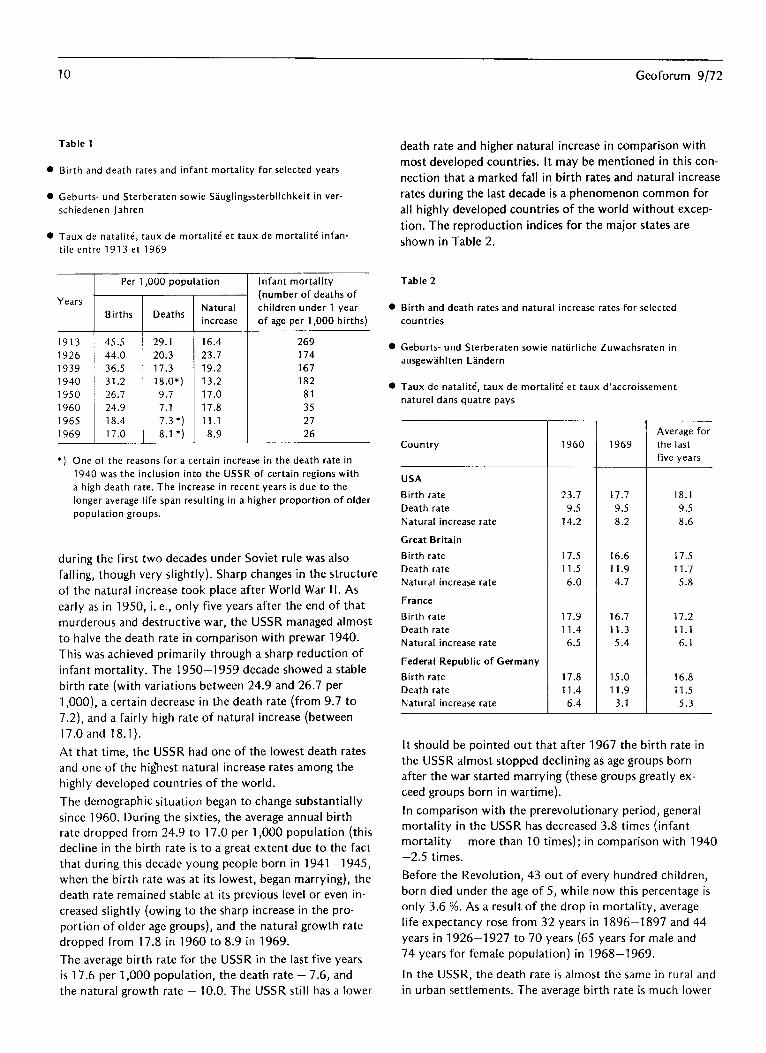
Table 1
Birth and death rates and infant mortality for selected years
Geburts- und Sterberaten sowie S;iuglingssterblichkeit in ver-
schiedenen Jahren
Taux de nataliti, taux de mortalit& et taux de mortalite’ infan.
tile entre 1913 et 1969
Years
1913
1926
1939
1940
1950
1960
1965
1969
Per 1,000 population l- Births
45.5
44.0
36.5
31.2
26.7
24.9
18.4
17.0
Deaths Natural
increase
Infant mortality
(number of deaths of
children under 1 year
of age per 1,000 births)
29.1 16.4 269
20.3 23.7 174
17.3 19.2 167
18.0*) 13.2 182
9.7 17.0 81
7.1 17.8 35
7.3 ‘) 11.1 27
8.1 *) 8.9 26
*) One of the reasons for a certain increase in the death rate in
1940 was the inclusion into the USSR of certain regions with
a high death rate. The increase in recent years is due to the
longer average life span resulting in a higher proportion of older
population groups.
during the first two decades under Soviet rule was also
falling, though very slightly). Sharp changes in the structure
of the natural increase took place after World War I I. As
early as in 1950, i. e., only five years after the end of that
murderous and destructive war, the USSR managed almost
to halve the death rate in comparison with prewar 1940.
This was achieved primarily through a sharp reduction of
infant mortality. The 1950-l 959 decade showed a stable
birth rate (with variations between 24.9 and 26.7 per
1 ,OOO), a certain decrease in the death rate (from 9.7 to
7.2), and a fairly high rate of natural increase (between
17.0 and 18.1).
At that time, the USSR had one of the lowest death rates
and one of the highest natural increase rates among the
highly developed countries of the world.
The demographic situation began to change substantially
since 1960. During the sixties, the average annual birth
rate dropped from 24.9 to 17.0 per 1,000 population (this
decline in the birth rate is to a great extent due to the fact
that during this decade young people born in 1941-1945,
when the birth rate was at its lowest, began marrying), the
death rate remained stable at its previous level or even in-
creased slightly (owing to the sharp increase in the pro-
portion of older age groups), and the natural growth rate
dropped from 17.8 in 1960 to 8.9 in 1969.
The average birth rate for the USSR in the last five years
is 17.6 per 1,000 population, the death rate - 7.6, and
the natural growth rate - 10.0. The USSR still has a lower
death rate and higher natural increase in comparison with
most developed countries. It may be mentioned in this con-
nection that a marked fall in birth rates and natural increase
rates during the last decade is a phenomenon common for
all highly developed countries of the world without excep-
tion. The reproduction indices for the major states are
shown in Table 2.
Table 2
Birth and death rates and natural increase rates for selected
countries
Geburts- und Sterberaten sowie natiirliche Zuwachsraten in
ausgewahlten Lindern
Taux de natalitd, taux de mortalitd et taux d’accroissement
nature1 dans quatre pays
Country
USA
Birth rate
Death rate
Natural increase rate
Great Britain
Birth rate
Death rate
Natural increase rate
France
Birth rate
Death rate
Natural increase rate
Federal Republic of Germany
Birth rate
Death rate
Natural increase rate
,,,I,,,, I
23.7 17.7 18.1
9.5 9.5 9.5
14.2 8.2 8.6
17.5 16.6 17.5
11.5 11.9 11.7
6.0 , 4.7 5.8
Average for
the last
five years
17.2
11.1
6.1
16.8
11.5
5.3
It should be pointed out that after 1967 the birth rate in
the USSR almost stopped declining as age groups born
after the war started marrying (these groups greatly ex-
ceed groups born in wartime).
In comparison with the prerevolutionary period, general
mortality in the USSR has decreased 3.8 times (infant
mortality - more than IO times); in comparison with 1940
-2.5 times.
Before the Revolution, 43 out of every hundred children,
born died under the age of 5, while now this percentage is
only 3.6 %. As a result of the drop in mortality, average
life expectancy rose from 32 years in 1896-l 897 and 44
years in 1926-l 927 to 70 years (65 years for male and
74 years for female population) in 1968-l 969.
In the USSR, the death rate is almost the same in rural and
in urban settlements. The average birth rate is much lower
Geoforum 9172 11
Table 3
Urban and rural birth rates for selected years
Geburtsraten in Stadt und Land in verschiedenen Jahren
Taux de natalitk pour la population urbaine et pour la popula-
tion rurale entre 1913 et 1969
Years
1913
1926
1940
1950
1960
1965
1969
T Birth rate per 1,000 population
I Total
45.5
44.0
31.2
26.7
24.9
18.4
17.0
Urban Rural
30.2 48.8
34.1 46.1
30.5 31.5
26.0 27.1
22.1 27.7
16.3 20.8
15.9 18.3
in the cities, but in the 1940-l 950 period this difference
was considerably reduced (Table 3).
The biggest cities show particularly low birth rates. In 1969,
this rate was as follows: Moscow - 11.2 births per 1,000
population, Leningrad - 11.9, Riga - 13.1, Kharkov -
13.3, Kuibishev - 13.5, Gorky - 13.7. But big cities of
Middle Asia differ in this respect. Their birth rates are as
follows: Frunze - 19.9, Tashkent - 20.0, Ashkhabad -
21.9, Dushanbe - 22.2 per 1,000.
Differences in the birth rate between Union republics are
much greater (Table 4).
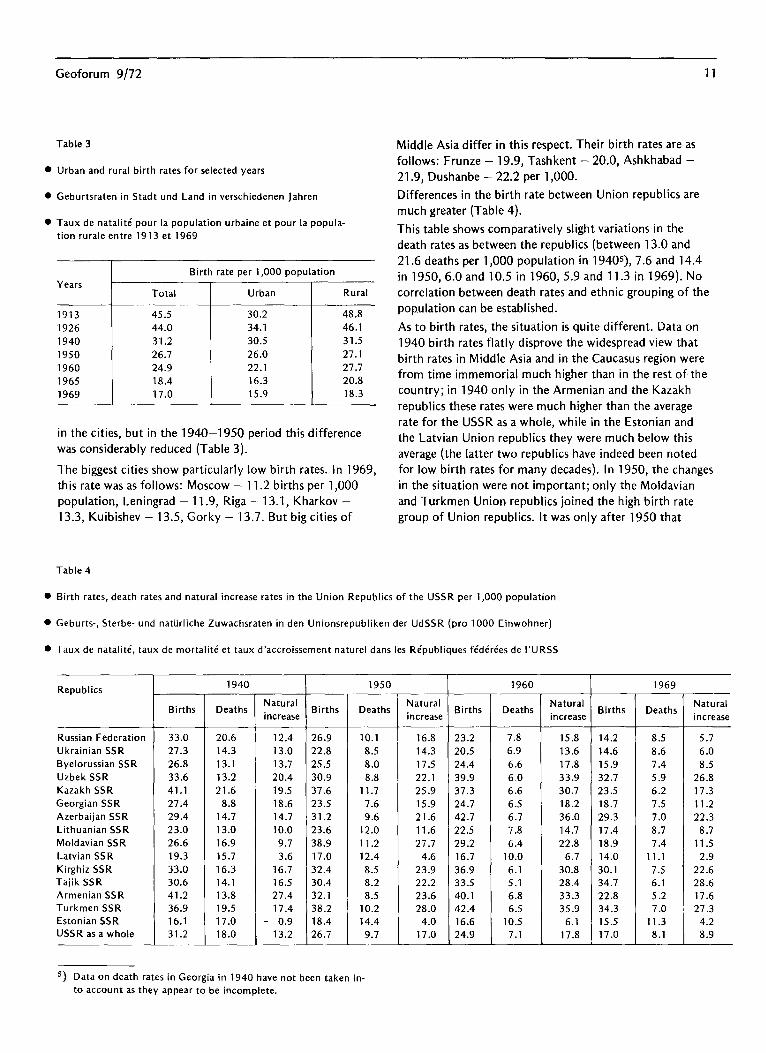
This table shows comparatively slight variations in the
death rates as between the republics (between 13.0 and
21.6 deaths per 1,000 population in 194Os), 7.6 and 14.4
in 1950, 6.0 and 10.5 in 1960, 5.9 and 11.3 in 1969). No
correlation between death rates and ethnic grouping of the
pop.ulation can be established.
As to birth rates, the situation is quite different. Data on
1940 birth rates flatly disprove the widespread view that
birth rates in Middle Asia and in the Caucasus region were
from time immemorial much higher than in the rest of,the
country; in 1940 only in the Armenian and the Kazakh
republics these rates were much higher than the average
rate for the USSR as a whole, while in the Estonian and
the Latvian Union republics they were much below this
average (the latter two republics have indeed been noted
for tow birth rates for many decades). In 1950, the changes
in the situation were not important; only the Moldavian
and Turkmen Union republics joined the high birth rate
group of Union republics. It was only after 1950 that
Table 4
Birth rates, death rates and natural increase rates in the Union Republics of the USSR per 1,000 population
Geburts-, Sterbe- und natiirliche Zuwachsraten in den Unionsrepubliken der UdSSR (pro 1000 Einwohner)
Taux de natalitd. taux de mortalit et taux d’accroissement nature1 dans les Re’publiques fe’de’re’es de I’URSS
Republics
Russian Federation 33.0 20.6 12.4 26.9 10.1 16.8 23.2 7.8 15.8 14.2 8.5 5.7
Ukrainian SSR 21.3 14.3 13.0 22.8 8.5 14.3 20.5 6.9 13.6 14.6 8.6 6.0
Byelorussian SSR 26.8 13.1 13.7 25.5 8.0 17.5 24.4 6.6 17.8 15.9 7.4 8.5
Uzbek SSR 33.6 13.2 20.4 30.9 8.8 22.1 39.9 6.0 33.9 32.7 5.9 26.8
Kazakh SSR 41.1 21.6 19.5 37.6 11.7 25.9 37.3 6.6 30.7 23.5 6.2 17.3
Georgian SSR 27.4 8.8 18.6 23.5 7.6 15.9 24.7 6.5 18.2 18.7 7.5 11.2
Azerbaijan SSR 29.4 14.7 14.7 31.2 9.6 21.6 42.7 6.7 36.0 29.3 7.0 22.3
Lithuanian SSR 23.0 13.0 10.0 23.6 12.0 11.6 22.5 7.8 14.7 17.4 8.7 8.7
Moldavian SSR 26.6 16.9 9.7 38.9 11.2 27.7 29.2 6.4 22.8 18.9 7.4 11.5
Latvian SSR 19.3 15.7 3.6 17.0 12.4 4.6 16.7 10.0 6.7 14.0 11.1 2.9
Kirghiz SSR 33.0 16.3 16.7 32.4 8.5 23.9 36.9 6.1 30.8 30.1 7.5 22.6 Tajik SSR 30.6 14.1 16.5 30.4 8.2 22.2 33.5 5.1 28.4 34.7 6.1 28.6 Armenian SSR 41.2 13.8 27.4 32.1 8.5 23.6 40.1 6.8 33.3 22.8 5.2 17.6 Turkmen SSR 36.9 19.5 17.4 38.2 10.2 28.0 42.4 6.5 35.9 34.3 7.0 27.3 Estonian SSR 16.1 17.0 - 0.9 18.4 14.4 4.0 16.6 10.5 6.1 15.5 11.3 4.2 USSR as a whole 31.2 18.0 13.2 26.7 9.7 17.0 24.9 7.1 17.8 17.0 8.1 8.9
r Births Deaths
1940
Natural
increase
T
Births Deaths
1950
Natural
increase Births Deaths
1960 1969
Natural
increase Births Deaths
Natural
increase
“) Data on death rates in Georgia in 1940 have not been taken in-
to account as they appear to be incomplete.
12 Geoforum 9/72
there arose a sharp differentiation in birth rates between
the Middle Asian and Transcaucasian republics (except the
Georgian SSR which never featured particularly high birth
rates) and all other regions of the USSR; in the former,
these rates continue to grow, in the latter they tend to
decline.
limitations on sexual relations) as well as on the attitude of
the marriage partners and the social environment towards
marriage, fertility, childlessness, etc.
After 1960, there began a general decline in the birth rates,
but in the first group of Union republics this decline pro-
ceeds at a much slower rate. As a result, in 1969 the birth
rates in the Middle Asian Union republics and in Azerbaijan
were twice as high as in the rest of the Union republics
(in Armenia the birth rates have sharply declined recently).
According to the birth rates in the last decade, all the
Union republics of the USSR may be divided into four
major groups (Table 5).
1.2. Age and sex composition
Since the establishment of a regular scientific system of
population statistics, women have always outnumbered
men in prerevolutionary Russia and in the USSR (Table 6).
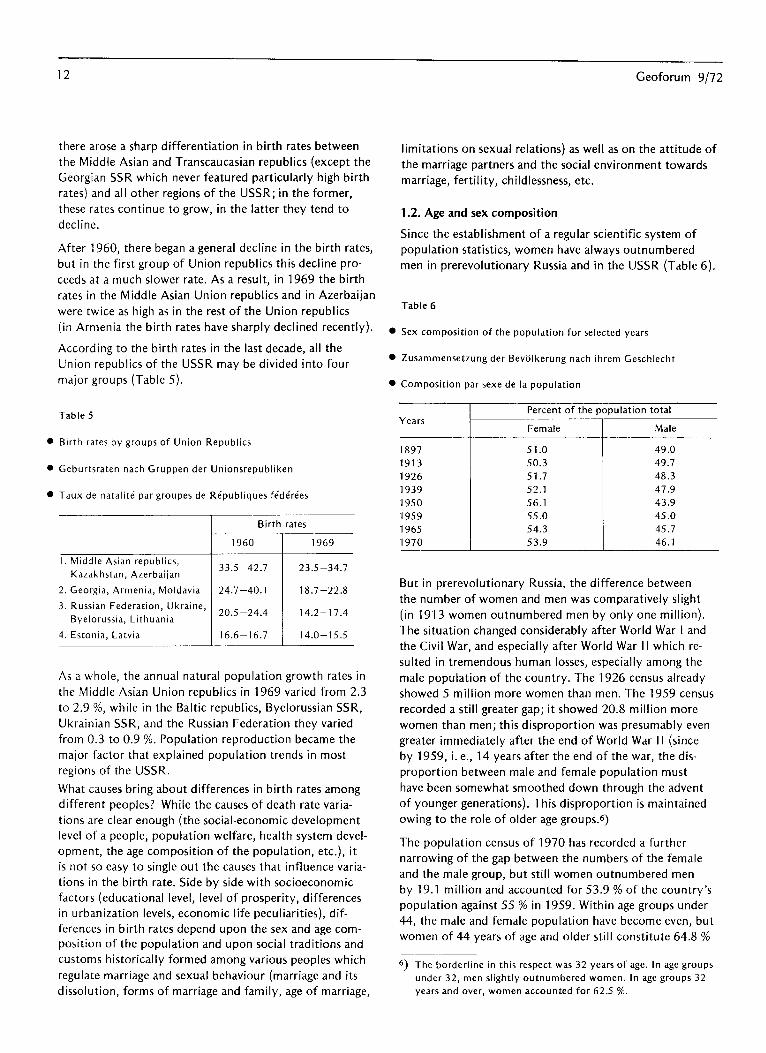
Table 6
Sex composition of the population for selected years
Zusammensetzung der BevGlkerung nach ihrem Geschlecht
Composition par sexe de la population
Table 5
Birth rates by groups of Union Republics
Geburtsraten nach Gruppen der Unionsrepubliken
Taux de natalitd par groupes de RCpubliques fe’de’re’es
Birth rates
1960 1969
1. Middle Asian republics,
Kazakhstan, Azerbaijan 33.5-42.7 23.5-34.7
2. Georgia, Armenia, Moldavia 1 24.7-40.1 1 18.7-22.8
3. Russian Federation, Ukraine,
Byelorussia, Lithuania
2. 5_24 4 . . 14.2-17.4
4. Estonia, Latvia 16.6-16.7 14.0-15s
As a whole, the annual natural population growth rates in
the Middle Asian Union republics in 1969 varied from 2.3
to 2.9 %, while in the Baltic republics, Byelorussian SSR,
Ukrainian SSR, and the Russian Federation they varied
from 0.3 to 0.9 %. Population reproduction became the
major factor that explained population trends in most
regions of the USSR.
What causes bring about differences in birth rates among
different peoples? While the causes of death rate varia-
tions are clear enough (the social-economic development
level of a people, population welfare, health system devel-
opment, the age composition of the population, etc.), it
is not so easy to single out the causes that influence varia-
tions in the birth rate. Side by side with socioeconomic
factors (educational level, level of prosperity, differences
in urbanization levels, economic life peculiarities), dif-
ferences in birth rates depend upon the sex and age com- position of the population and upon social traditions and
customs historically formed among various peoples which
regulate marriage and sexual behaviour (marriage and its
dissolution, forms of marriage and family, age of marriage,
Years Percent of the population total
1897
1913
1926
1939
1950
1959
1965
1970
Female Male
51.0 49.0
50.3 49.7
51.7 48.3
52.1 47.9
56.1 43.9
55.0 45.0
54.3 45.7
53.9 46.1
But in prerevolutionary Russia, the difference between
the number of women and men was comparatively slight
(in 1913 women outnumbered men by only one million).
The situation changed considerably after World War I and
the Civil War, and especially after World War I I which re-
sulted in tremendous human losses, especially among the
male population of the country. The 1926 census already
showed 5 million more women than men. The 1959 census
recorded a still greater gap; it showed 20.8 million more
women than men; this disproportion was presumably even
greater immediately after the end of World War I I (since
by 1959, i. e., 14 years after the end of the war, the dis-
proportion between male and female population must
have been somewhat smoothed down through the advent
of younger generations). This disproportion is maintained
owing to the role of older age groups.6)
The population census of 1970 has recorded a further
narrowing of the gap between the numbers of the female
and the male group, but still women outnumbered men
by 19.1 million and accounted for 53.9 % of the country’s
population against 55 % in 1959. Within age groups under
44, the male and female population have become even, but
women of 44 years of age and older still constitute 64.8 %
6) The borderline in this respect was 32 years of age. In age groups
under 32, men slightly outnumbered women. In age groups 32
years and over, women accounted for 62.5 %.
Geoforum 9172 13
of the population of this age group. This disproportion, as
we already pointed out above, is the result of the last war.‘)
In urban places, the male population percentage is slightly
higher than in the countryside (46.3 % and 45.8 % re-
spectively). Regions with highly developed heavy industries
show a higher male population percentage, while it is
usually somewhat lower in regions where agriculture and
light industries predominate. Male population percentage
is particularly high in the northern and eastern regions of
the country. In the Komi ASSR and the Yakut SSR, and
in the Kamchatka and Magadan oblasts men have already
outnumbered women as early as 1959.
Rather interesting regularities can be detected if one con-
siders the sex composition of population in each Union
republic (Table 7).
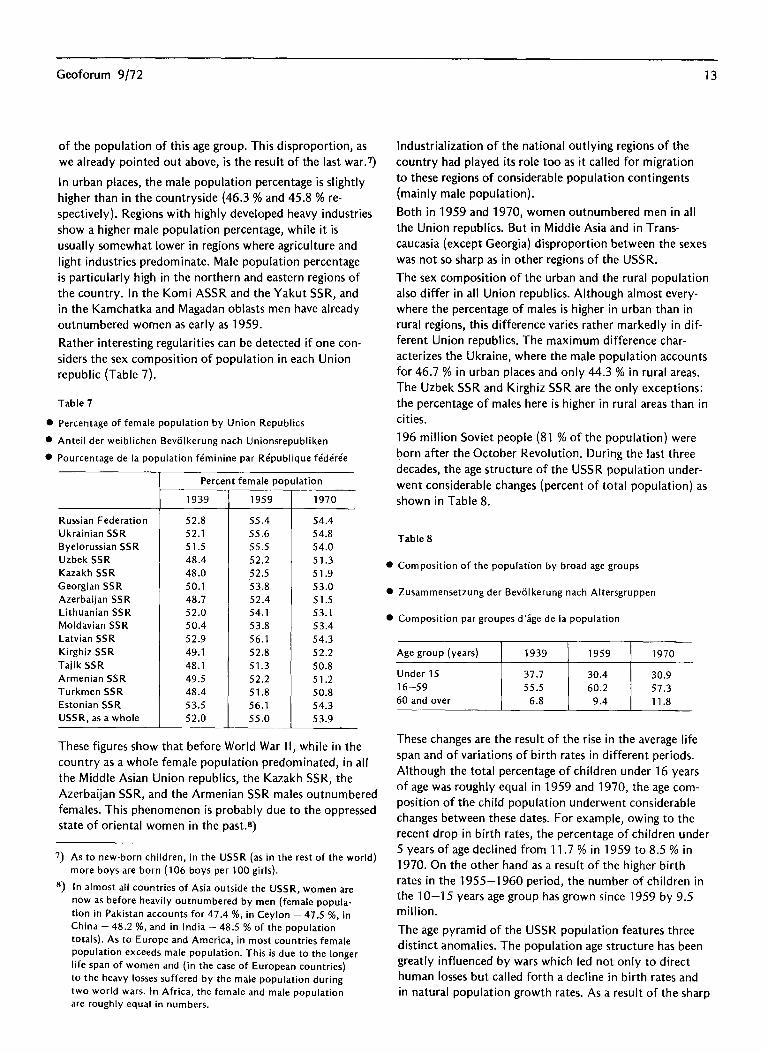
Table 7
0 Percentage of female population by Union Republics
l Anteil der weiblichen Bevolkerung nach Unionsrepubliken
l Pourcentage de la population feminine par Republique fed&e
Russian Federation 52.8 55.4 54.4
Ukrainian SSR 52.1 55.6 54.8
Byelorussian SSR 51.5 55.5 54.0
Uzbek SSR 48.4 52.2 51.3
Kazakh SSR 48.0 52.5 51.9
Georgian SSR 50.1 53.8 53.0
Azerbaijan SSR 48.7 52.4 51.5
Lithuanian SSR 52.0 54.1 53.1
Moldavian SSR 50.4 53.8 53.4
Latvian SSR 52.9 56.1 54.3
Kirghiz SSR 49.1 52.8 52.2
Tajik SSR 48.1 51.3 50.8
Armenian SSR 49.5 52.2 51.2 Turkmen SSR 48.4 51.8 50.8 Estonian SSR 53.5 56.1 54.3 USSR, as a whole 52.0 55.0 53.9
Percent female oooulation
1939
.
1959 1970
These figures show that before World War I I, while in the
country as a whole female population predominated, in all
the Middle Asian Union republics, the Kazakh SSR, the
Azerbaijan SSR, and the Armenian SSR males outnumbered
females. This phenomenon is probably due to the oppressed
state of oriental women in the past.8)
7) As to new-born children, in the USSR (as in the rest of the world)
more boys are born (106 boys per 100 girls).
8, ln almost all countries of Asia outside the USSR, women are
now as before heavily outnumbered by men (female popula-
tion in Pakistan accounts for 47.4 %, in Ceylon - 47.5 %, in
China - 48.2 %, and in India - 48.5 % of the population
totals). As to Europe and America, in most countries female
population exceeds male population. This is due to the longer
life span of women and (in the case of European countries)
to the heavy losses suffered by the male population during
two world wars. In Africa, the female and male population
are roughly equal in numbers.
Industrialization of the national outlying regions of the
country had played its role too as it called for migration
to these regions of considerable population contingents
(mainly male population).
Both in 1959 and 1970, women outnumbered men in all
the Union republics. But in Middle Asia and in Trans-
caucasia (except Georgia) disproportion between the sexes
was not so sharp as in other regions of the USSR.
The sex composition of the urban and the rural population
also differ in all Union republics. Although almost every-
where the percentage of males is higher in urban than in
rural regions, this difference varies rather markedly in dif-
ferent Union republics. The maximum difference char-
acterizes the Ukraine, where the male population accounts
for 46.7 % in urban places and only 44.3 % in rural areas.
The Uzbek SSR and Kirghiz SSR are the only exceptions:
the percentage of males here is higher in rural areas than in
cities.
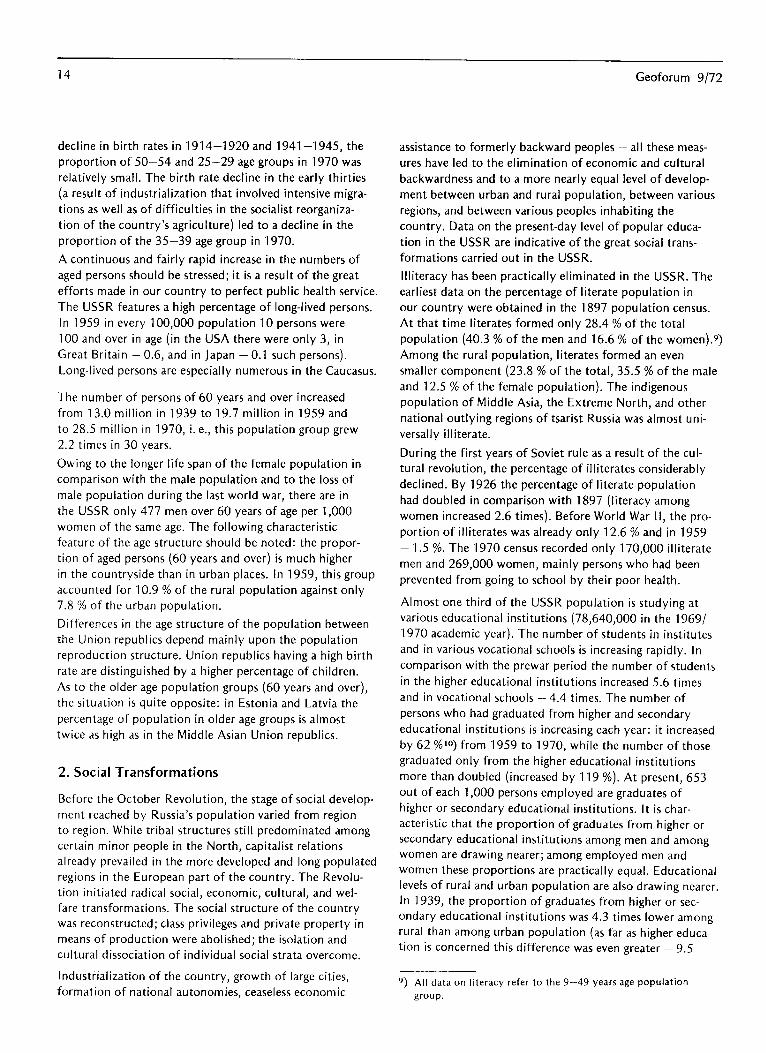
196 million Soviet people (81 % of the population) were
born after the October Revolution. During the last three
decades, the age structure of the USSR population under-
went considerable changes (percent of total population) as
shown in Table 8.
Table 8
l Composition of the population by broad age groups
l Zusammensetzung der Bevolkerung nach Altersgruppen
l Composition par groupes d’ige de la population
These changes are the result of the rise in the average life
span and of variations of birth rates in different periods.
Although the total percentage of children under 16 years
of age was roughly equal in 1959 and 1970, the age com-
position of the child population underwent considerable
changes between these dates. For example, owing to the
recent drop in birth rates, the percentage of children under
5 years of age declined from 11.7 % in 1959 to 8.5 % in
1970. On the other hand as a result of the higher birth
rates in the 1955-l 960 period, the number of children in
the 10-l 5 years age group has grown since 1959 by 9.5 million.
The age pyramid of the USSR population features three
distinct anomalies. The population age structure has been
greatly influenced by wars which led not only to direct
human losses but called forth a decline in birth rates and in natural population growth rates. As a result of the sharp
14 Geoforum 9/72
decline in birth rates in 1914-1920 and 1941-1945, the
proportion of 50-54 and 25-29 age groups in 1970 was
relatively small. The birth rate decline in the early thirties
(a result of industrialization that involved intensive migra-
tions as well as of difficulties in the socialist reorganiza-
tion of the country’s agriculture) led to a decline in the
proportion of the 35-39 age group in 1970.
A continuous and fairly rapid increase in the numbers of
aged persons should be stressed; it is a result of the great
efforts made in our country to perfect public health service.
The USSR features a high percentage of long-lived persons.
In 1959 in every 100,000 population 10 persons were
100 and over in age (in the USA there were only 3, in
Great Britain - 0.6, and in Japan - 0.1 such persons).
Long-lived persons are especially numerous in the Caucasus.
The number of persons of 60 years and over increased
from 13.0 million in 1939 to 19.7 million in 1959 and
to 28.5 million in 1970, i.e., this population group grew
2.2 times in 30 years.
Owing to the longer life span of the female population in
comparison with the male population and to the loss of
male population during the last world war, there are in
the USSR only 477 men over 60 years of age per 1,000
women of the same age. The following characteristic
feature of the age structure should be noted: the propor-
tion of aged persons (60 years and over) is much higher
in the countryside than in urban places. In 1959, this group
accounted for 10.9 % of the rural population against only
7.8 % of the urban population.
Differences in the age structure of the population between
the Union republics depend mainly upon the population
reproduction structure. Union republics having a high birth
rate are distinguished by a higher percentage of children.
As to the older age population groups (60 years and over),
the situation is quite opposite: in Estonia and Latvia the
percentage of population in older age groups is almost
twice as high as in the Middle Asian Union republics.
2. Social Transformations
Before the October Revolution, the stage of social develop-
ment reached by Russia’s population varied from region
to region. While tribal structures still predominated among
certain minor people in the North, capitalist relations
already prevailed in the more developed and long populated
regions in the European part of the country. The Revolu-
tion initiated radical social, economic, cultural, and wel-
fare transformations. The social structure of the country
was reconstructed; class privileges and private property in
means of production were abolished; the isolation and
cultural dissociation of individual social strata overcome.
Industrialization of the country, growth of large cities,
formation of national autonomies, ceaseless economic
assistance to formerly backward peoples - all these meas-
ures have led to the elimination of economic and cultural
backwardness and to a more nearly equal level of develop-
ment between urban and rural population, between various
regions, and between various peoples inhabiting the
country. Data on the present-day level of popular educa-
tion in the USSR are indicative of the great social trans-
formations carried out in the USSR.
Illiteracy has been practically eliminated in the USSR. The
earliest data on the percentage of literate population in
our country were obtained in the 1897 population census.
At that time literates formed only 28.4 % of the total
population (40.3 % of the men and 16.6 % of the women).g)
Among the rural population, literates formed an even
smaller component (23.8 % of the total, 35.5 % of the male
and 12.5 % of the female population). The indigenous
population of Middle Asia, the Extreme North, and other
national outlying regions of tsarist Russia was almost uni-
versally illiterate.
During the first years of Soviet rule as a result of the cul-
tural revolution, the percentage of illiterates considerably
declined. By 1926 the percentage of literate population
had doubled in comparison with 1897 (literacy among
women increased 2.6 times). Before World War II, the pro-
portion of illiterates was already only 12.6 % and in 1959
~ 1.5 %. The 1970 census recorded only 170,000 illiterate
men and 269,000 women, mainly persons who had been
prevented from going to school by their poor health.
Almost one third of the USSR population is studying at
various educational institutions (78,640,OOO in the 1969/
1970 academic year). The number of students in institutes
and in various vocational schools is increasing rapidly. In
comparison with the prewar period the number of students
in the higher educational institutions increased 5.6 times
and in vocational schools - 4.4 times. The number of
persons who had graduated from higher and secondary
educational institutions is increasing each year: it increased
by 62 %‘O) from 1959 to 1970, while the number of those
graduated only from the higher educational institutions
more than doubled (increased by 119 %). At present, 653
out of each 1,000 persons employed are graduates of
higher or secondary educational institutions. It is char-
acteristic that the proportion of graduates from higher or
secondary educational institutions among men and among
women are drawing nearer; among employed men and
women these proportions are practically equal. Educational
levels of rural and urban population are also drawing nearer.
In 1939, the proportion of graduates from higher or sec-
ondary educational institutions was 4.3 times lower among
rural than among urban population (as far as higher educa-
tion is concerned this difference was even greater ~ 9.5
9) All data on literacy refer to the 9-49 years age population
group.
Geoforum 9/72 15
times). By 1970, among the rural population the percentage
of graduates from higher or secondary educational institu- tions increased 6.4 times (from higher institutions - 7
times), and the difference in educational levels of rural and
urban population has markedly smoothed down (though the countryside still lags behind with regard to the pro-
portion of population graduated from higher educational
institutions).
In the Soviet period and especially after World War II, the
educational level of formerly backward national regions of
the country rose sharply. In 1970 the number of persons
graduated from higher and secondary educational institu- tions increased in comparison with 1939 as follows: in the
Tajik SSR - 10.5 times, in the Kirghiz SSR - 9.8 times,
in the Uzbek SSR - 8.3 times, in the Turkmen SSR - 7.3
times, in the Moldavian SSR - 7.0 times, in the Kazakh
SSR - 5.7 times, in the Byelorussian and Lithuanian SSR - 4.7 times, in the Russian Federation - 4.5 times, in Azerbaijan SSR - 4.2 times, in the Ukrainian SSR - 4.1 times, in the Armenian SSR - 4.0 times, in the Georgian
SSR - 3.4 times, in the Estonian SSR - 3.1 times, in the Latvian SSR - 2.9 times (the average increase for the
Soviet Union as a whole was 4.5 times).
As for the autonomous republics, more than half of them
now show a higher educational level of the employed population in comparison with the USSR as a whole. This
level is especially high in the Adjar, Abkhazian, North Ossetian, Tatar, Komi, and Karelian autonomous republics.
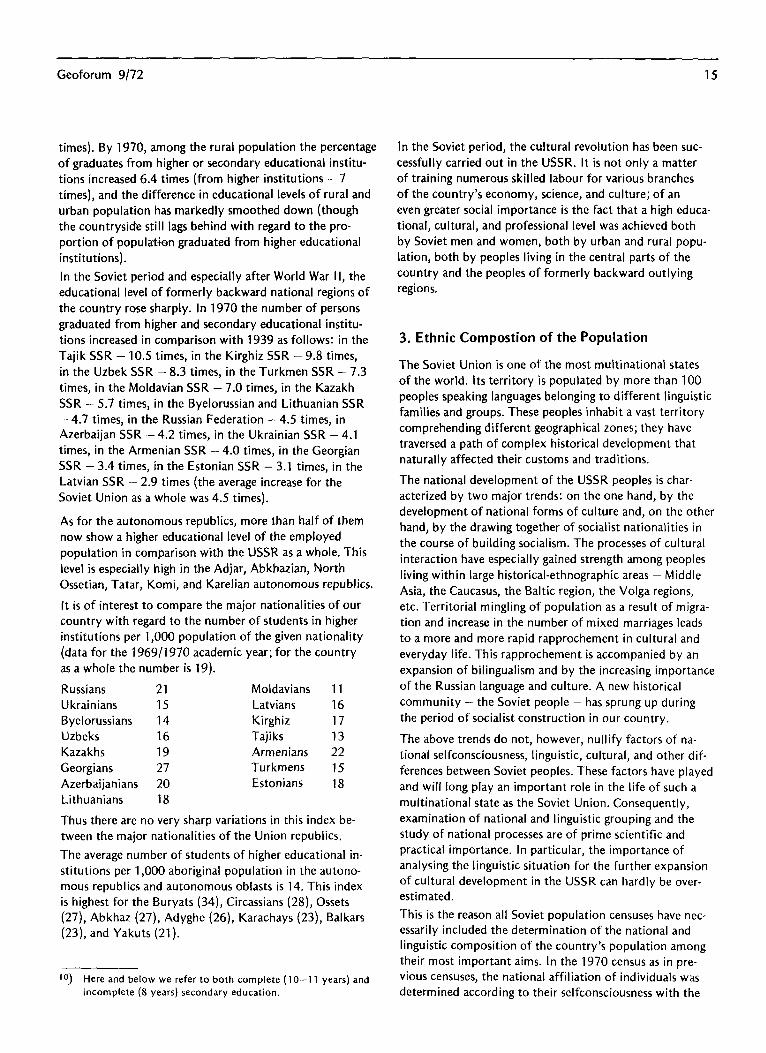
It is of interest to compare the major nationalities of our country with regard to the number of students in higher institutions per 1,000 population of the given nationality
(data for the 1969/l 970 academic year; for the country
as a whole the number is 19).
Russians 21 Moldavians 11
Ukrainians 15 Latvians 16
Byelorussians 14 Kirghiz 17
Uzbeks 16 Tajiks 13
Kazakhs 19 Armenians 22
Georgians 27 Turkmens 15
Azerbaijanians 20 Estonians 18
Lithuanians 18
Thus there are no very sharp variations in this index be-
tween the major nationalities of the Union republics.
The average number of students of higher educational in-
stitutions per 1,000 aboriginal population in the autono-
mous republics and autonomous oblasts is 14. This index
is highest for the Buryats (34), Circassians (28), Ossets
(27), Abkhaz (27), Adyghe (26), Karachays (23), Balkars
(23), and Yakuts (21).
‘0) Here and below we refer to both complete (1 O-l 1 years) and
incomplete (8 years) secondary education.
In the Soviet period, the cultural revolution has been suc-
cessfully carried out in the USSR. It is not only a matter
of training numerous skilled labour for various branches
of the country’s economy, science, and culture; of an
even greater social importance is the fact that a high educa-
tional, cultural, and professional level was achieved both
by Soviet men and women, both by urban and rural popu-
lation, both by peoples living in the central parts of the
country and the peoples of formerly backward outlying
regions.
3. Ethnic Compostion of the Population
The Soviet Union is one of the most multinational states
of the world. Its territory is populated by more than 100
peoples speaking languages belonging to different linguistic
families and groups. These peoples inhabit a vast territory
comprehending different geographical zones; they have
traversed a path of complex historical development that
naturally affected their customs and traditions.
The national development of the USSR peoples is char-
acterized by two major trends: on the one hand, by the
development of national forms of culture and, on the other
hand, by the drawing together of socialist nationalities in
the course of building socialism. The processes of cultural
interaction have especially gained strength among peoples
living within large historical-ethnographic areas - Middle
Asia, the Caucasus, the Baltic region, the Volga regions,
etc. Territorial mingling of population as a result of migra-
tion and increase in the number of mixed marriages leads
to a more and more rapid rapprochement in cultural and
everyday life. This rapprochement is accompanied by an
expansion of bilingualism and by the increasing importance
of the Russian language and culture. A new historical
community - the Soviet people - has sprung up during
the period of socialist construction in our country.
The above trends do not, however, nullify factors of na-
tional selfconsciousness, linguistic, cultural, and other dif-
ferences between Soviet peoples. These factors have played
and will long play an important role in the life of such a
multinational state as the Soviet Union. Consequently,
examination of national and linguistic grouping and the
study of national processes are of prime scientific and
practical importance. In particular, the importance of
analysing the linguistic situation for the further expansion
of cultural development in the USSR can hardly be over-
estimated.
This is the reason all Soviet population censuses have nec-
essarily included the determination of the national and
linguistic composition of the country’s population among
their most important aims. In the 1970 census as in pre-
vious censuses, the national affiliation of individuals was
determined according to their selfconsciousness with the
16 Geoforum 9/72
aid of a direct question on national affiliation. The na-
tionality of children was determined by their parents;
only if the mother and father were of different nationali-
ties and found it difficult to determine the nationality of
their child, it was recommended by the census takers to
give preference to the mother’s nationality. The linguistic
composition of the population was determined by a question
on mother tongue. If an individual found it difficult to
name any language as his mother tongue, then the language
this individual spoke best or the one commonly used in
his family was registered as his mother tongue. As to chil-
dren who could not yet speak, the language usually spoken
in the family was entered as their mother tongue. A second
language (common in the USSR) if fluently spoken by an
individual was also registered.“)
The 1959 population census showed 109 nationalities in
the USSR. The list of peoples in the 1970 census differs
only slightly from the 1959 list. Up to the present, data on
91 peoples numbering over 10,000 persons each have been
published; in addition, a number of small peoples are in-
cluded in the “other nationalities” column.
The number of nationalities (peoples) recorded by censuses
markedly decreased during the postrevolutionary period.
This decrease reflects a natural and progressive march of
events, i. e., intensive processes of ethnic consolidation and
assimilation. These processes consist of the merging of
territorial, tribal, and other population groups closely re-
lated to each other in origin, language, and culture, into
larger nationalities and nations. They also consist of the
loss by individual groups of certain peoples, living in the
midst of another people and having prolonged contacts
with that people, of peculiar features of their national cul-
ture and way of life, and the adoption of the other people’s
culture and language. Such groups cease to recognize their
affiliation with their former ethnic community.
Such large nations as the Kazakhs, the Kirghiz, and the
Turkmens and such comparatively small nationalities as
11 > During the population census it was not unusual for individuals
to claim affiliation not with a nationality but with some ethno-
graphic group forming part of a nationality. They also some-
times recognized a dialect as their mother tongue. Sometimes
census takers were given an obsolete or inaccurate denomina-
tion of a nationality. In order to reduce all these replies to a
common denominator, the Central Statistical Bureau of the
USSR in conjunction with appropriate scientific bodies (In-
stitute of Ethnography, Institute of Linguistics of the USSR
Academy of Sciences, etc.) prepared a list of nationalities and
languages and of widespread ethnic and linguistic denomina-
tions before each census. The list prepared for the 1970 census
covered over 800 ethnic denominations corresponding to 122
major nationalities, and over 300 linguistic and dialectal de-
nominations corresponding to 114 languages spoken by the
peoples of the USSR. Thus the census takers record all (with-
out exception) denominations suggested by the individuals
being interviewed; for processing, use is made of the official
list of denominations of the nationalities and languages.
the Altayans and the Khakass were formed from separate
tribal groups. The Megrels, the Svans, the Laz, and the
Adjars have merged with the Georgians; the Kipchaks, the
Turki, and the Kurama have been dissolved among the
Uzbek people. National processes in Dalghestan are very
complex in their character. The Andi-Tsezi are intensively
merging with the Avars; the Kaitaks and the Kubachins
with the Dargins; at the same time there exists also a trend
towards the merging of all the Daghestan peoples into a
single ethnic community.
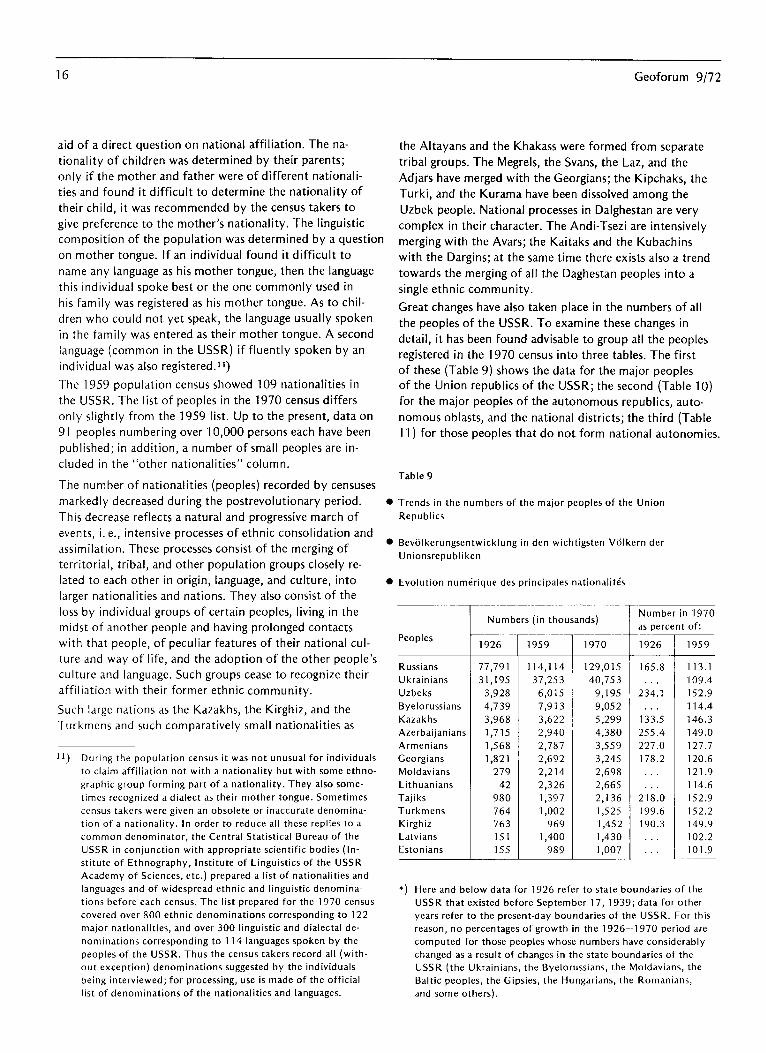
Great changes have also taken place in the numbers of all
the peoples of the USSR. To examine these changes in
detail, it has been found advisable to group all the peoples
registered in the 1970 census into three tables. The first
of these (Table 9) shows the data for the major peoples of the Union republics of the USSR; the second (Table 10)
for the major peoples of the autonomous republics, auto-
nomous oblasts, and the national districts; the third (Table
11) for those peoples that do not form national autonomies.
Table 9
Trends in the numbers of the major peoples of the Union
Republics
Bevijlkerungsentwicklung in den wichtigsten Vdlkern der
Unionsrepubliken
Evolution nume’rique des principales nationalites
Peoples 1926 1959 1970
Russians 77,791 114,114 129,015
Ukrainians 31,195 37,253 40,753
Uzbeks 3,928 6,015 9,195
Byelorussians 4,739 7,913 9,052
Kazakhs 3,968 3,622 5,299
Azerbaijanians 1,715 2,940 4,380
Armenians 1,568 2,787 3,559
Georgians 1,821 2,692 3,245
Moldavians 279 2,214 2,698
Lithuanians 42 2,326 2,665
Tajiks 980 1,397 2,136
Turkmens 764 1,002 1,525 Kirghiz 763 969 1,452
Latvians 151 1,400 1,430
Estonians 155 989 1,007
Numbers (in thousands) i
Number in 1970
as percent of:
1926
165.8
. .
234.1
. .
133.5
255.4
227.0
178.2
.
.
218.0
199.6
190.3
.
1959
113.1
109.4
152.9
114.4
146.3
149.0
127.7
120.6
121.9
114.6
152.9
152.2
149.9
102.2
101.9
*) Here and below data for 1926 refer to state boundaries of the
USSR that existed before September 17, 1939; data for other
years refer to the present-day boundaries of the USSR. For this
reason, no percentages of growth in the 1926-l 970 period are
computed for those peoples whose numbers have considerably
changed as a result of changes in the state boundaries of the
USSR (the Ukrainians, the Byelorussians, the Moldavians, the
Baltic peoples, the Gipsies, the Hungarians, the Romanians,
and some others).
Geoforum 9172 17
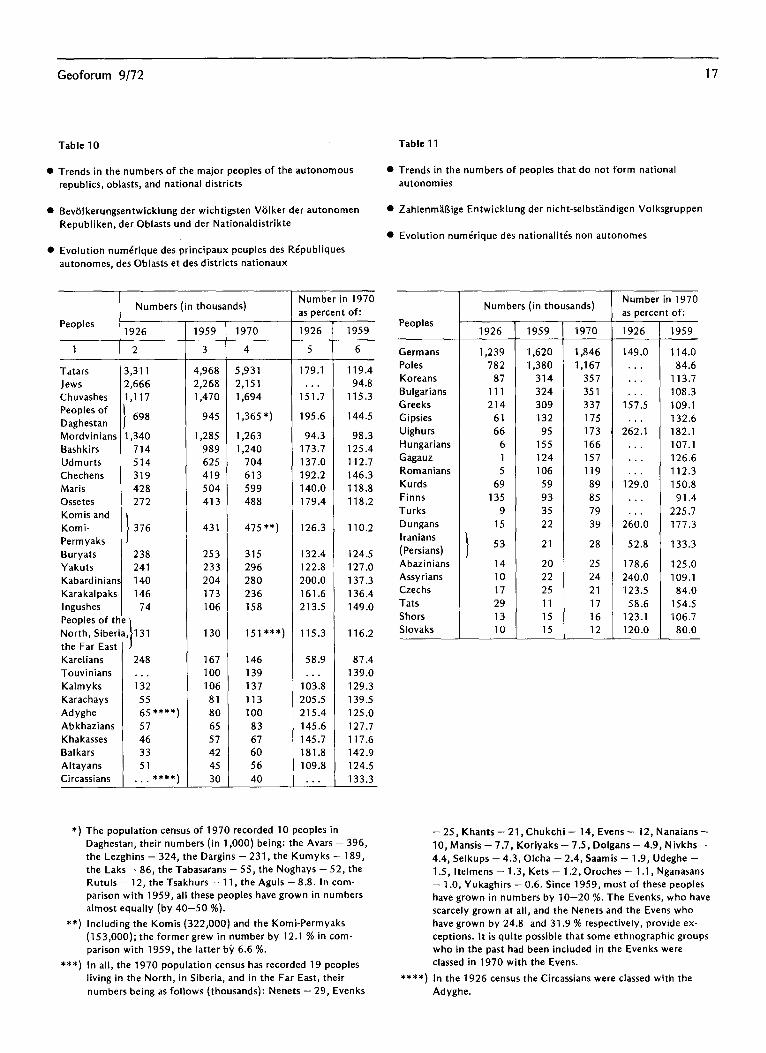
Table 10 Table 11
l Trends in the numbers of the major peoples of the autonomous l Trends in the numbers of peoples that do not form national
republics, oblasts, and national districts autonomies
l Bevolkerungsentwicklung der wichtigsten Volker der autonomen
Republiken, der Oblasts und der Nationaldistrikte
l ZahlenmaBige Entwicklung der nicht-selbstandigen Volksgruppen
l Evolution nume’rique des nationalitis non autonomes
l Evolution numerique des principaux peuples des Republiques
autonomes, des Oblasts et des districts nationaux
Peoples
1
Tatars
Jews
Chuvashes
Peoples of
Daghestan
Mordvinians
Bashkirs
Udmurts
Chechens
Maris
Ossetes
Komis and
Komi-
Permyaks
Buryats
Yakuts
Kabardinian
Karakalpaks
lngushes
Peoples of tl
r
the Far Eas
Karelians
Touvinians
Kalmyks
Karachays
Adyghe
Abkhazians
Khakasses
Bal kars
Altayans
Circassians
Numbers (in thousands)
1926
3,311
2,666
1,117
698
4,968 5,931
2,268 2,151
1,470 1,694
119.4
94.8
115.3
945 1,365*)
1,340 1,285 1,263
714 989 1,240
514 625 704
319 419 613
428 504 599
272 413 488
179.1
. . . 151.7
195.6
94.3
173.7
137.0
192.2
140.0
179.4
144.5
98.3
125.4
112.7
146.3
118.8
118.2
376 431 475 **) 126.3 110.2
238 253 315 132.4 124.5
241 233 296 122.8 127.0
140 204 280 200.0 137.3
146 173 236 161.6 136.4
74 106 158 213.5 149.0
131 130 151***) 115.3 116.2
248
. . . 132
55
65 ****)
57
46
33
51
. . . ****)
1959
3
1970
4
167 146
100 139
106 137
81 113
80 100
65 83
57 67
42 60
45 56
30 40
T Number in 1970
as percent of: L
1926
5
58.9
. . . 103.8
205.5
215.4
145.6
145.7
181.8
109.8
. . .
1959
6
87.4
139.0
129.3
139.5
125.0
127.7
117.6
142.9
124.5
133.3
*)
**I
***)
The population census of 1970 recorded 10 peoples in
Daghestan, their numbers (in 1,000) being: the Avars - 396,
the Lezghins - 324, the Dargins - 231, the Kumyks - 189,
the Laks - 86, the Tabasarans - 55, the Noghays - 52, the
Rutuls - 12, the Tsakhurs - 11, the Aguls - 8.8. In com-
parison with 1959, all these peoples have grown in numbers
almost equally (by 40-50 %).
Including the Komis (322,000) and the Komi-Permyaks
(153,000); the former grew in number by 12.1 % in com-
parison with 1959, the latter by 6.6 %.
In all, the 1970 population census has recorded 19 peoples
living in the North, in Siberia, and in the Far East, their
numbers being as follows (thousands): Nenets - 29, Evenks
Peoples
Germans
Poles
Koreans
Bulgarians
Greeks
Gipsies
Uighurs
Hungarians
Gagauz
Romanians
Kurds
Finns
Turks
Dungans
Iranians
(Persians)
Abazinians
Assyrians
Czechs
Tats
Shors
Slovaks
T Numbers (in thousands)
1926 1959 1970
1,239 1,620 1,846
782 1,380 1,167
87 314 357
111 324 351
214 309 337
61 132 175
66 95 173
6 155 166
1 124 157
5 106 119
69 59 89
135 93 85
9 35 79
15 22 39
t 53
14
10
17
29
13
10
21 28
20 25
22 24
25 21
11 17
15 16 15 12
Number in 1970
as percent of.
1926
149.0
. . .
. . .
. . . 157.5
. . . 262.1
. . .
. . . . .
129.0
. . .
. . . 260.0
52.8
178.6
240.0
123.5
58.6
123.1
120.0
1959
114.0
84.6
113.7
108.3
109.1
132.6
182.1
107.1
126.6
112.3
150.8
91.4
225.7
177.3
133.3
125.0
109.1
84.0
154.5
106.7
80.0
- 25, Khants - 21,Chukchi - 14, Evens - 12, Nanaians -
10, Mansis - 7.7, Koriyaks - 7.5, Dolgans - 4.9, Nivkhs -
4.4, Selkups - 4.3, Olcha - 2.4, Saamis - 1.9, Udeghe -
1.5, ltelmens - 1.3, Kets - 1.2, Oroches - 1.1, Nganasans
- 1.0, Yukaghirs - 0.6. Since 1959, most of these peoples
have grown in numbers by IO-20 %. The Evenks, who have
scarcely grown at all, and the Nenets and the Evens who
have grown by 24.8 and 31.9 % respectively, provide ex-
ceptions. It is quite possible that some ethnographic groups
who in the past had been included in the Evenks were
classed in 1970 with the Evens.
****) In the 1926 census the Circassians were classed with the
Adyghe.
18 Geoforum 9172
From Tables 9-l 1 it may be seen that the Azerbaijanians,
Uzbeks, Armenians, Pajiks, Ingushes, and Karachays more
than doubled their numbers from 1926 to 1970; the
Turkmens, Kirghizes, Georgians, Kabardinians, Daghestan
peoples, Chechens, Balkars, Ossetes, and Tatars increased
by 75-f 00 %; the Russians, Bashkirs, Karakalpaks, Adyghe,
and Chuvashes by 50-75 %; the Kazakhs,la) Khakasses,
Abkhazians, Maris, Udmurts, and Buryats by 25-50 %; the Komis and Komi-Permyaks, Yakuts, and peoples of North,
Siberia and the Far East by IO-25 %; the Altayans and
Kalmyks by less than 10 %; the Karelians, Mordvinians,
Jews, Poles, Tats, and some other peoples decreased in
numbers in this period.
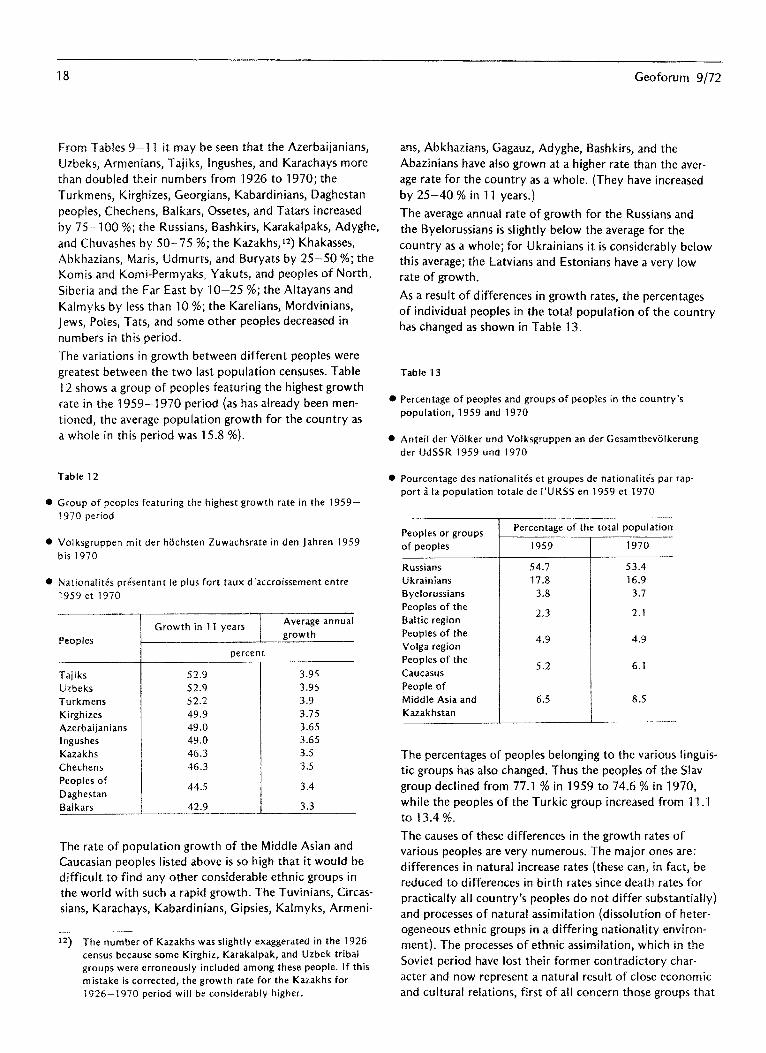
The variations in growth between different peoples were
greatest between the two last population censuses. Table
12 shows a group of peoples featuring the highest growth
rate in the 1959-l 970 period (as has already been men-
tioned, the average population growth for the country as
a whole in this period was 15.8 %).
Table 12
0 Group of peoples featuring the highest growth rate in the 1959-
1970 period
l Volksgruppen mit der hochsten Zuwachsrate in den Jahren 1959
bis 1970
l Nationalhe’s prksentant le plus fort taux d’accroissement entre
1959 et 1970
Peoples
Growth in 11 years / itzghe annua’
percent
Tajiks
Uzbeks
Turkmens
Kirghizes
Azerbaijanians
lngushes
Kazakhs
Chechens
Peoples of
Daghestan
Balkars
52.9
52.9
52.2
49.9
49.0
49.0
46.3
46.3
44.5
42.9
3.95
3.95
3.9
3.75
3.65
3.65
3.5
3.5
3.4
3.3
The rate of population growth of the Middle Asian and
Caucasian peoples listed above is so high that it would be
difficult to find any other considerable ethnic groups in
the world with such a rapid growth. The Tuvinians, Circas-
sians, Karachays, Kabardinians, Gipsies, Kalmyks, Armeni-
12) The number of Kazakhs was slightly exaggerated in the 1926
census because some Kirghiz, Karakalpak, and Uzbek tribal
groups were erroneously included among these people. If this
mistake is corrected, the growth rate for the Kazakhs for
1926-1970 period will be considerably higher.
ans, Abkhazians, Gagauz, Adyghe, Bashkirs, and the
Abazinians have also grown at a higher rate than the aver-
age rate for the country as a whole. (They have increased
by 2.5-40 % in I1 years.)
The average annual rate of growth for the Russians and
the Byelorussians is slightly below the average for the
country as a whole; for Ukrainians it is considerably below
this average; the Latvians and Estonians have a very low
rate of growth.
As a result of differences in growth rates, the percentages
of individual peoples in the total population of the country
has changed as shown in Table 13.
Table 13
l Percentage of peoples and groups of peoples in the country’s
population, 1959 and 1970
l Anteil der Vijlker und Volksgruppen an der Gesamtbevolkerung
der UdSSR 1959 und 1970
l Pourcentage des nationalites et groupes de nationalitds par rap-
port i la population totale de I’URSS en 1959 et 1970
Peoples or groups
of peoples
Russians
Ukrainians
Byelorussians
Peoples of the
Baltic region
Peoples of the
Volga region
Peoples of the
Caucasus
People of
Middle Asia and
Kazakhstan
T L
Percentage of the total population
1959
54.7 53.4
17.8 16.9
3.8 3.7
2.3 2.1
4.9
5.2
6.5
4.9
6.1
8.5
1970
The percentages of peoples belonging to the various linguis-
tic groups has also changed. Thus the peoples of the Slav
group declined from 77.1 % in 1959 to 74.6 % in 1970,
while the peoples of the Turkic group increased from 11 .l
to 13.4 %.
The causes of these differences in the growth rates of
various peoples are very numerous. The major ones are:
differences in natural increase rates (these can, in fact, be
reduced to differences in birth rates since death rates for
practically all country’s peoples do not differ substantially)
and processes of natural assimilation (dissolution of heter-
ogeneous ethnic groups in a differing nationality environ-
ment). The processes of ethnic assimilation, which in the
Soviet period have lost their former contradictory char-
acter and now represent a natural result of close economic
and cultural relations, first of all concern those groups that
Geoforum 9/72 19
have been dispersed or isolated from their ethnic bulk and
live among other peoples. Assimilation processes take an
especially rapid course in urban localities where mixed
marriages are more common and people shift more easily
from one language to another.
The uneven growth of peoples is to a certain extent con-
ditioned by the aftereffects of World War II. Peoples living
on territory temporarily occupied by the Hitlerite invaders
suffered especially heavy losses. A considerable part of
civil population in these regions was annihilated; in addition,
birth rates in these regions declined while the death rates
rose considerably. In the postwar period, an unfavourable
sex and age composition of the population prevailed in
these regions for a long time, and as a result the birth rate
here was lower than in other regions of the USSR.
“Exchange” repatriation of population between the border
regions of the USSR and the countries of Eastern Europe,
as well as the repatriation of 200,000 Armenians from the
Near East countries and Europe have also led to changes
in the numbers of the peoples concerned.
New censuses frequently introduce emendations into the
national affiliations of certain groups of population. We
have already mentioned the erroneous classification of
certain groups of neighbouring peoples as Kazakhs in 1926.
In the same census, the Kamchadals, who in fact are an
ethnographic group of the Russian people, were included
among the Itelmens. A part of the population of the
western regions of the Byelorussian SSR and the Ukrainian
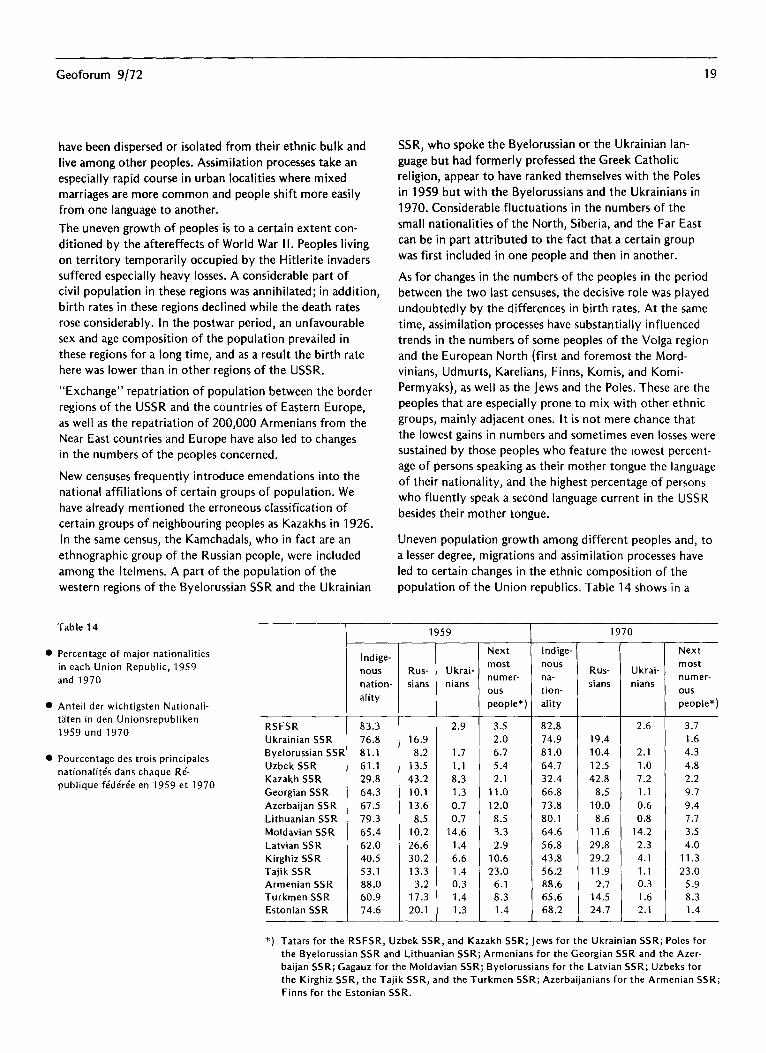
Table 14 T
l Percentage of major nationalities
in each Union Republic, 1959
and 1970
l Anteil der wichtigsten Nationali-
taten in den Unionsrepubliken
1959und 1970
l Pourcentage des trois principales
nationalite’s dans chaque R&
publique fe’de’rde en 1959 et 1970
RSFSR
Ukrainian SSR
Byelorussian SSF
Uzbek SSR
Kazakh SSR
Georgian SSR
Azerbaijan SSR
Lithuanian SSR
Moldavian SSR
Latvian SSR
Kirghiz SSR
Tajik SSR
Armenian SSR
Turkmen SSR
Estonian SSR
Rus-
sians
U krai- Rus-
sians
I nd ige- Next Indige- Next
most nous most nous Ukrai-
nation- numer- na- numer-
ality ous tion-
nians ous
people*) ality people*)
83.3 2.9 3.5 82.8 2.6 3.7
76.8 2.0 74.9 19.4 1.6
1 81.1 1.7 6.7 81.0 10.4 2.1 4.3
61.1 1.1 5.4 64.7 12.5 1 .o 4.8
29.8 8.3 2.1 32.4 42.8 7.2 2.2
64.3 1.3 11.0 66.8 8.5 1.1 9.7
67.5 0.1 12.0 73.8 10.0 0.6 9.4
79.3 0.7 8.5 80.1 8.6 0.8 7.7
65.4 14.6 3.3 64.6 11.6 14.2 3.5
62.0 1.4 2.9 56.8 29.8 2.3 4.0
40.5 6.6 10.6 43.8 29.2 4.1 11.3
53.1 1.4 23.0 56.2 11.9 1.1 23.0
88.0 0.3 6.1 88.6 2.7 0.3 5.9
60.9 1.4 8.3 65.6 14.5 1.6 8.3
74.6 1.3 1.4 68.2 24.1 2.1 1.4
16.9
8.2
13.5
43.2
10.1
13.6
8.5
10.2
26.6
30.2
13.3
3.2
17.3
20.1
SSR, who spoke the Byelorussian or the Ukrainian lan-
guage but had formerly professed the Greek Catholic
religion, appear to have ranked themselves with the Poles
in 1959 but with the Byelorussians and the Ukrainians in
1970. Considerable fluctuations in the numbers of the
small nationalities of the North, Siberia, and the Far East
can be in part attributed to the fact that a certain group
was first included in one people and then in another.
As for changes in the numbers of the peoples in the period
between the two last censuses, the decisive role was played
undoubtedly by the differences in birth rates. At the same
time, assimilation processes have substantially influenced
trends in the numbers of some peoples of the Volga region
and the European North (first and foremost the Mord-
vinians, Udmurts, Karelians, Finns, Komis, and Komi-
Permyaks), as well as the Jews and the Poles. These are the
peoples that are especially prone to mix with other ethnic
groups, mainly adjacent ones. It is not mere chance that
the lowest gains in numbers and sometimes even losses were
sustained by those peoples who feature the lowest percent-
age of persons speaking as their mother tongue the language
of their nationality, and the highest percentage of persons
who fluently speak a second language current in the USSR
besides their mother tongue.
Uneven population growth among different peoples and, to
a lesser degree, migrations and assimilation processes have
led to certain changes in the ethnic composition of the
population of the Union republics. Table 14 shows in a
1959
*) Tatars for the RSFSR, Uzbek SSR, and Kazakh SSR; Jews for the Ukrainian SSR; Poles for
the Byelorussian SSR and Lithuanian SSR; Armenians for the Georgian SSR and the Azer-
baijan SSR; Gagauz for the Moldavian SSR; Byelorussians for the Latvian SSR; Uzbeks for
the Kirghiz SSR, the Tajik SSR, and the Turkmen SSR; Azerbaijanians for the Armenian SSR;
Finns for the Estonian SSR.
r 1970
20 Geoforum 9172
generalized form data on the proportion of four major
nationalities of each republic (three for RSFSR and the
Ukraine): the indigenous nationality, the Russians, the
Ukrainians, and the next most numerous people (in per-
cent of the total population of each republic).
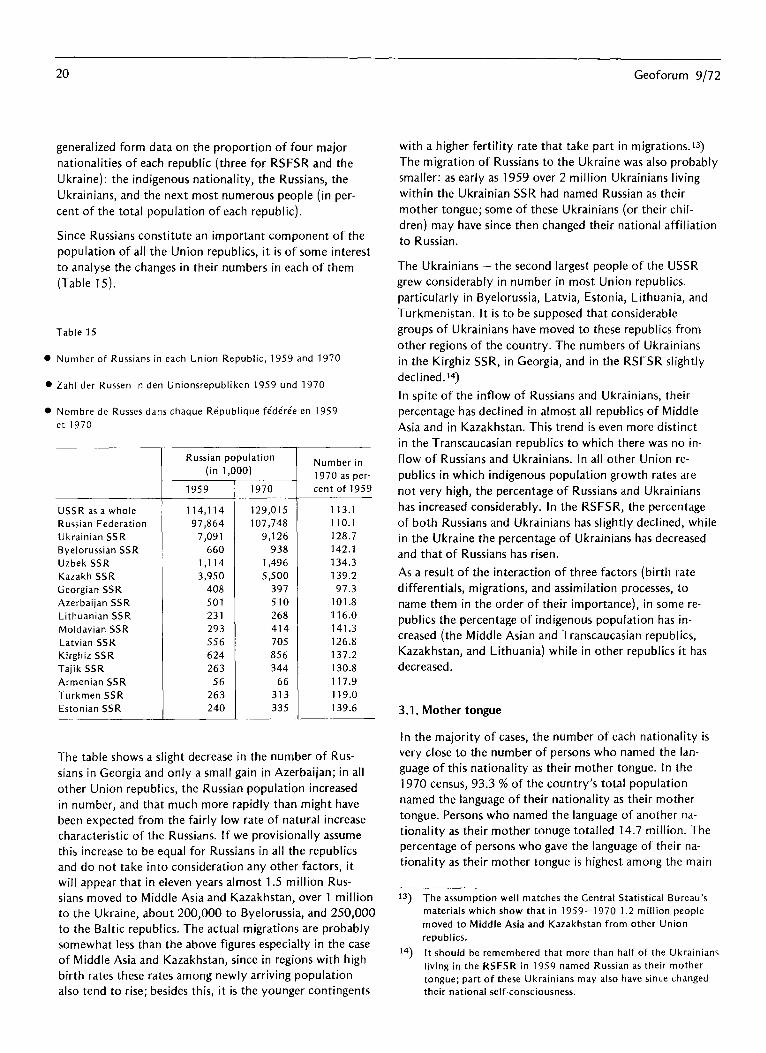
Since Russians constitute an important component of the
population of all the Union republics, it is of some interest
to analyse the changes in their numbers in each of them
(Table 15).
Table 15
l Number of Russians in each Union Republic, 1959 and 1970
l Zahl der Russen in den Unionsrepubliken 1959 und 1970
l Nombre de Russes dans chaque Republique fede’re’e en 1959
et 1970
USSR as a whole 114,114 129,015 113.1
Russian Federation 97,864 107,748 110.1
Ukrainian SSR 7,091 9,126 128.7
Byelorussian SSR 660 938 142.1
Uzbek SSR 1,114 1,496 134.3
Kazakh SSR 3,950 5,500 139.2
Georgian SSR 408 397 97.3
Azerbaijan SSR 501 510 101.8
Lithuanian SSR 231 268 116.0
Moldavian SSR 293 414 141.3
Latvian SSR 556 705 126.8
Kirghiz SSR 624 856 137.2
Tajik SSR 263 344 130.8
Armenian SSR 56 66 117.9
Turkmen SSR 263 313 119.0
Estonian SSR 240 335 139.6
Russian population
(in 1,000)
1959 1970
Number in
1970 as per-
cent of 1959
The table shows a slight decrease in the number of Rus-
sians in Georgia and only a small gain in Azerbaijan; in all
other Union republics, the Russian population increased
in number, and that much more rapidly than might have
been expected from the fairly low rate of natural increase
characteristic of the Russians. If we provisionally assume
this increase to be equal for Russians in all the republics
and do not take into consideration any other factors, it
will appear that in eleven years almost 1.5 million Rus-
sians moved to Middle Asia and Kazakhstan, over 1 million
to the Ukraine, about 200,000 to Byelorussia, and 250,000
to the Baltic republics. The actual migrations are probably
somewhat less than the above figures especially in the case
of Middle Asia and Kazakhstan, since in regions with high
birth rates these rates among newly arriving population
also tend to rise; besides this, it is the younger contingents
with a higher fertility rate that take part in migrations.13)
The migration of Russians to the Ukraine was also probably
smaller: as early as 1959 over 2 million Ukrainians living
within the Ukrainian SSR had named Russian as their
mother tongue; some of these Ukrainians (or their chil-
dren) may have since then changed their national affiliation
to Russian.
The Ukrainians - the second largest people of the USSR
grew considerably in number in most Union republics.
particularly in Byelorussia, Latvia, Estonia, Lithuania, and
Turkmenistan. It is to be supposed that considerable
groups of Ukrainians have moved to these republics from
other regions of the country. The numbers of Ukrainians
in the Kirghiz SSR, in Georgia, and in the RSFSR slightly
declined.14)
In spite of the inflow of Russians and Ukrainians, their
percentage has declined in almost all republics of Middle
Asia and in Kazakhstan. This trend is even more distinct
in the Transcaucasian republics to which there was no in-
flow of Russians and Ukrainians. In all other Union re-
publics in which indigenous population growth rates are
not very high, the percentage of Russians and Ukrainians
has increased considerably. In the RSFSR, the percentage
of both Russians and Ukrainians has slightly declined, while
in the Ukraine the percentage of Ukrainians has decreased
and that of Russians has risen.
As a result of the interaction of three factors (birth rate
differentials, migrations, and assimilation processes, to
name them in the order of their importance), in some re-
publics the percentage of indigenous population has in-
creased (the Middle Asian and Transcaucasian republics,
Kazakhstan, and Lithuania) while in other republics it has
decreased.
3.1. Mother tongue
In the majority of cases, the number of each nationality is
very close to the number of persons who named the lan-
guage of this nationality as their mother tongue. In the
1970 census, 93.3 % of the country’s total population
named the language of their nationality as their mother
tongue. Persons who named the language of another na-
tionality as their mother tonuge totalled 14.7 million. The
percentage of persons who gave the language of their na-
tionality as their mother tongue is highest among the main
q
14 1
The assumption well matches the Central Statistical Bureau’s
materials which show that in 1959-1970 1.2 million people
moved to Middle Asia and Kazakhstan from other Union
republics.
It should be remembered that more than half of the Ukrainians
living in the RSFSR in 1959 named Russian as their mother
tongue; part of these Ukrainians may also have since changed
their national self-consciousness.
Geoforum 9/72 21
peoples of the Union republics (usually it exceeds 95 %).
Among Armenians (of whom almost two fifths live out-
side their republic), this percent is only 91.4, while for
Byelorussians and Ukrainians it is as low as 80.6 and 85.7 %
respectively.
The percentage of persons speaking the language of their
nationality as their mother tongue among the main peoples
of the autonomous republics and autonomous oblasts
varies within a wide’range, but, as a rule, it is fairly high
(only in case of the Bashkirs, Karelians, Mordvinians,
Udmurts, Khakass, the Komis and the Komi-Permyaks
does this percentage drop below 85 %). The situation is
quite different in case of those peoples who are dispersed
over the territory of the country. Only 17.7 % of the Jews
(only a small fraction of them lives in the Jewish autono-
mous oblast) recognize the language of their nationality as
their mother tongue; this percentage is 32.5 % for the
Poles, 39.3 % for the Greeks, 51 % for the Finns, etc.
Thirteen million non-Russians named Russian as their
mother tongue’s) in the 1970 census. An additional 41.9
million Soviet citizens indicated Russian as the second
mother tongue which they speak fluently. Thus 54.9 mil-
lion Soviet citizens or a half of the non-Russian population
of the USSR are in perfect command of Russian. In all
76 % of the USSR population speak Russian well.
It is interesting to note that these two phenomena - the
shift to another language and knowledge of a second lan-
guage -are closely related to each other. Those peoples
who feature a high percentage of persons who had shifted
to another language also show a high percentage of popula-
tion perfectly speaking some second language. Both these
indices, which are lowest in the case of the major peoples
of the Union republics, and higher in the case of the major
peoples of the autonomous republics and oblasts, reach
their highest value among the remaining peoples of the
Soviet Union (especially high among people who are
geographically dispersed and are especially liable to as-
similation).
The Russian language plays an important role for the rap-
prochement of the USSR peoples. Besides, knowledge of
this language helps all the peoples of our country to gain
access to achievements of modern science and culture.
15 ) In spite of the growing use of Russian, data on the correlation
between nationality and mother tongue underwent little
change in the last 11 years. This is apparently due to the fact
that in 1970 the question on the second language was inserted
into the questionnaire for the first time. Those interviewed
enjoyed, as it were, more freedom of choice and were able to
claim the language of their nationality as their mother tongue
even in cases where they spoke it less fluently than Russian.