Embed Size (px)
Citation preview
Seabury Maritime PFRA LLC and Michael Fusillo Ph.D. Commissioned by Diamond State Port Corporation
Abstract The Port of Wilmington makes important economic contributions to the local area, the State of Delaware and the regional and even national economies. Future growth and associated economic impact growth is constrained by the limited ability to fun capital expenditures for growth and maintenance
PORT OF WILMINGTON
ECONOMIC IMPACT STUDY
Findings February 2018
A p p e n d i x 19 - 1 | W i l m i n g t o n H a r b o r - E d g e m o o r E x p a n s i o n E n v i r o n m e n t a l A s s e s s m e n t T e c h n i c a l D o c u m e n t
Executive Summary
This report provides estimates of the economic impacts of the Port of Wilmington (POW) on the region,
including the U.S. Census-defined Philadelphia – Wilmington – Camden Metropolitan Statistical Area
(MSA), and on the State of Delaware separate from the MSA. The following summary highlights the key
findings.
In fiscal year 2017, a total of 5,802,000 short tons moved in and out of Port of Wilmington facilities, an
average annual expansion of 5.4 percent from 2010. There were:
2.5 million short tons of containerized cargoes,
1.4 million tons of dry bulk cargoes,
1.4 million tons of liquid bulk cargoes, and
451,000 tons of non-containerized cargoes which include vehicles break-bulk and project
cargoes.
MSA Region Key Impacts
In 2017, the annual economic impacts to the MSA region associated with operations at POW include:
5,717 total jobs; 2,951 direct jobs and 2,766 indirect and induced jobs,
$363.5 million or $67.65 per ton of cargo in payments to labor.
POW-related jobs in the MSA region pay an average of $30.57 per hour and an average annual salary
exclusive of fringe benefits of $63,592.
Region-wide, the port generated
$508.8 million or $87.70 per cargo ton in value-added
$922.2 million or $158.94 per cargo ton in total output/final demand
$35.6 million or $6.13 per cargo ton in tax revenue
Delaware State Key Impacts
The 2017 key economic impacts of POW operations on the State of Delaware were found to be the
following:
5,390 total jobs (2,951 direct jobs and 2,439 indirect and induced jobs) amounting to 0.93 jobs
per thousand cargo tons,
$330.0 million in payments to labor or $56.88 per ton of cargo.
A p p e n d i x 19 - 2 | W i l m i n g t o n H a r b o r - E d g e m o o r E x p a n s i o n E n v i r o n m e n t a l A s s e s s m e n t T e c h n i c a l D o c u m e n t
POW-related jobs pay an average of $29.44 per hour in the State of Delaware and an average annual
salary exclusive of fringe benefits of $61,230.
Across the direct jobs generated by POW:
56.9 percent were associated with the break-bulk trade (e.g., fruit, vehicles, project cargo);
24.0 percent were in the container trade;
6.8 percent in dry bulk;
5.4 percent were allocated to liquid bulk (petroleum and fruit juice) and,
6.9 percent were jobs categorized as “other”.
Truck drivers (45.3%) accounted for the majority of the 2,951 occupations directly associated with POW
operations followed by:
Auto processing workers (16.7%),
In-port and out-port warehousing workers (9.3%),
Longshoremen (7.9%),
Port operations workers (6.1%),
Rail crews (3.8%),
Other stevedoring (0.8%), and
“Not allocated” employment is 10.2 percent of the total.
For the State of Delaware, POW generated:
$462.9 million or $79.78 per cargo ton in value-added,
$838.6 million or $144.53 per cargo ton in total output/final demand,
$26.7 million or $4.61 per cargo ton in tax revenue.
Future growth Forecasts
The POW cargo forecast and associated jobs and economic impact growth is severely constrained by
capacity and the inability of the DSPC and State of Delaware to provide significant capital investment as
outlined by the 2016 Master Plan.
===================
A p p e n d i x 19 - 3 | W i l m i n g t o n H a r b o r - E d g e m o o r E x p a n s i o n E n v i r o n m e n t a l A s s e s s m e n t T e c h n i c a l D o c u m e n t
PORT OF WILMINGTON ECONOMIC IMPACT STUDY 2017
Background
The Port of Wilmington (POW) is a full-service deep-water port that is under the management of
Diamond State Port Corporation (DSPC), a corporation owned by the State of Delaware. The port is
located on the banks of the Delaware River 65 miles from the Atlantic Ocean. POW handles
containerized, break bulk, dry and liquid bulk cargoes and is especially known for managing trade in
perishable cargoes such as fruits and vegetables. It connects to its inland markets via truck and rail.
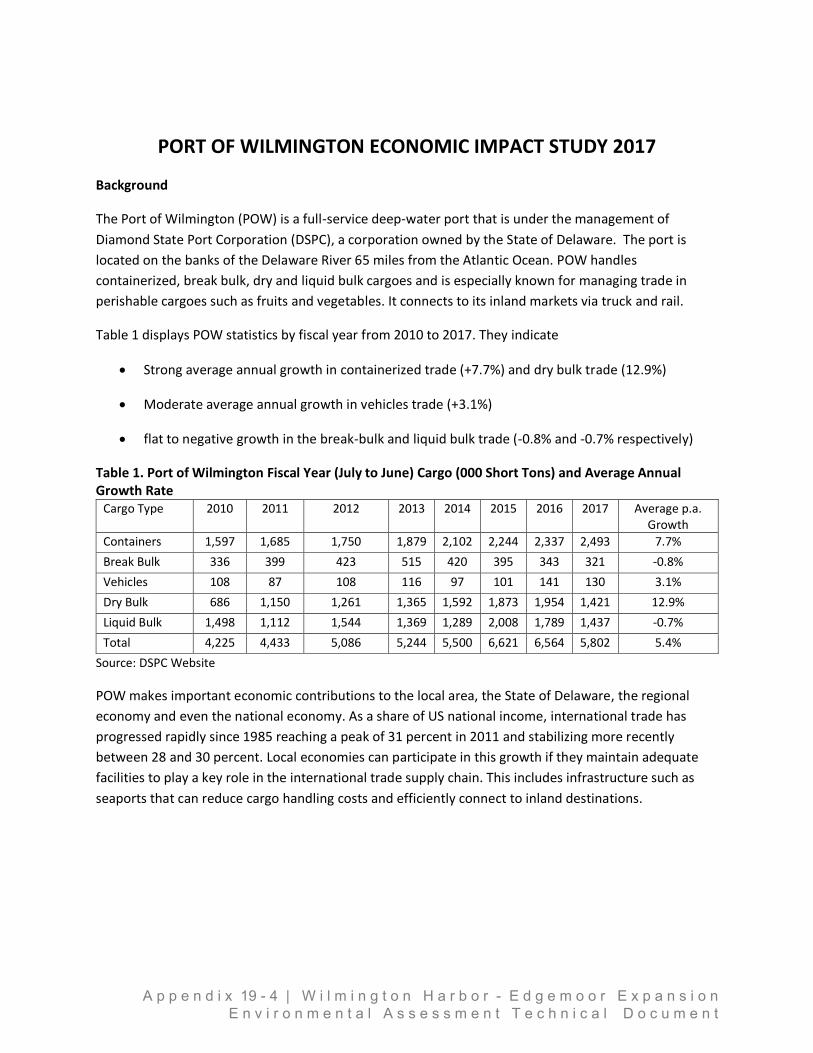
Table 1 displays POW statistics by fiscal year from 2010 to 2017. They indicate
Strong average annual growth in containerized trade (+7.7%) and dry bulk trade (12.9%)
Moderate average annual growth in vehicles trade (+3.1%)
flat to negative growth in the break-bulk and liquid bulk trade (-0.8% and -0.7% respectively)
Table 1. Port of Wilmington Fiscal Year (July to June) Cargo (000 Short Tons) and Average Annual Growth Rate
Cargo Type 2010 2011 2012 2013 2014 2015 2016 2017 Average p.a. Growth
Containers 1,597 1,685 1,750 1,879 2,102 2,244 2,337 2,493 7.7%
Break Bulk 336 399 423 515 420 395 343 321 -0.8%
Vehicles 108 87 108 116 97 101 141 130 3.1%
Dry Bulk 686 1,150 1,261 1,365 1,592 1,873 1,954 1,421 12.9%
Liquid Bulk 1,498 1,112 1,544 1,369 1,289 2,008 1,789 1,437 -0.7%
Total 4,225 4,433 5,086 5,244 5,500 6,621 6,564 5,802 5.4%
Source: DSPC Website
POW makes important economic contributions to the local area, the State of Delaware, the regional
economy and even the national economy. As a share of US national income, international trade has
progressed rapidly since 1985 reaching a peak of 31 percent in 2011 and stabilizing more recently
between 28 and 30 percent. Local economies can participate in this growth if they maintain adequate
facilities to play a key role in the international trade supply chain. This includes infrastructure such as
seaports that can reduce cargo handling costs and efficiently connect to inland destinations.
A p p e n d i x 19 - 4 | W i l m i n g t o n H a r b o r - E d g e m o o r E x p a n s i o n E n v i r o n m e n t a l A s s e s s m e n t T e c h n i c a l D o c u m e n t
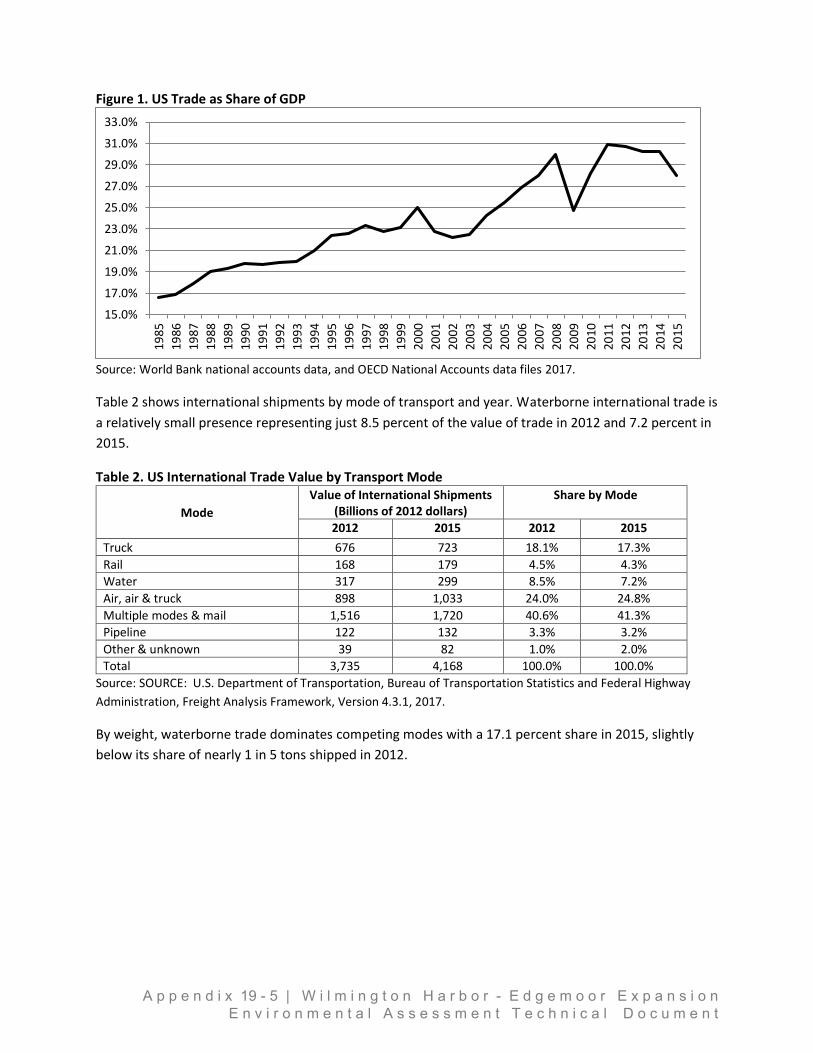
Figure 1. US Trade as Share of GDP
Source: World Bank national accounts data, and OECD National Accounts data files 2017.
Table 2 shows international shipments by mode of transport and year. Waterborne international trade is
a relatively small presence representing just 8.5 percent of the value of trade in 2012 and 7.2 percent in
2015.
Table 2. US International Trade Value by Transport Mode
Mode
Value of International Shipments (Billions of 2012 dollars)
Share by Mode
2012 2015 2012 2015
Truck 676 723 18.1% 17.3%
Rail 168 179 4.5% 4.3%
Water 317 299 8.5% 7.2%
Air, air & truck 898 1,033 24.0% 24.8%
Multiple modes & mail 1,516 1,720 40.6% 41.3%
Pipeline 122 132 3.3% 3.2%
Other & unknown 39 82 1.0% 2.0%
Total 3,735 4,168 100.0% 100.0%
Source: SOURCE: U.S. Department of Transportation, Bureau of Transportation Statistics and Federal Highway
Administration, Freight Analysis Framework, Version 4.3.1, 2017.
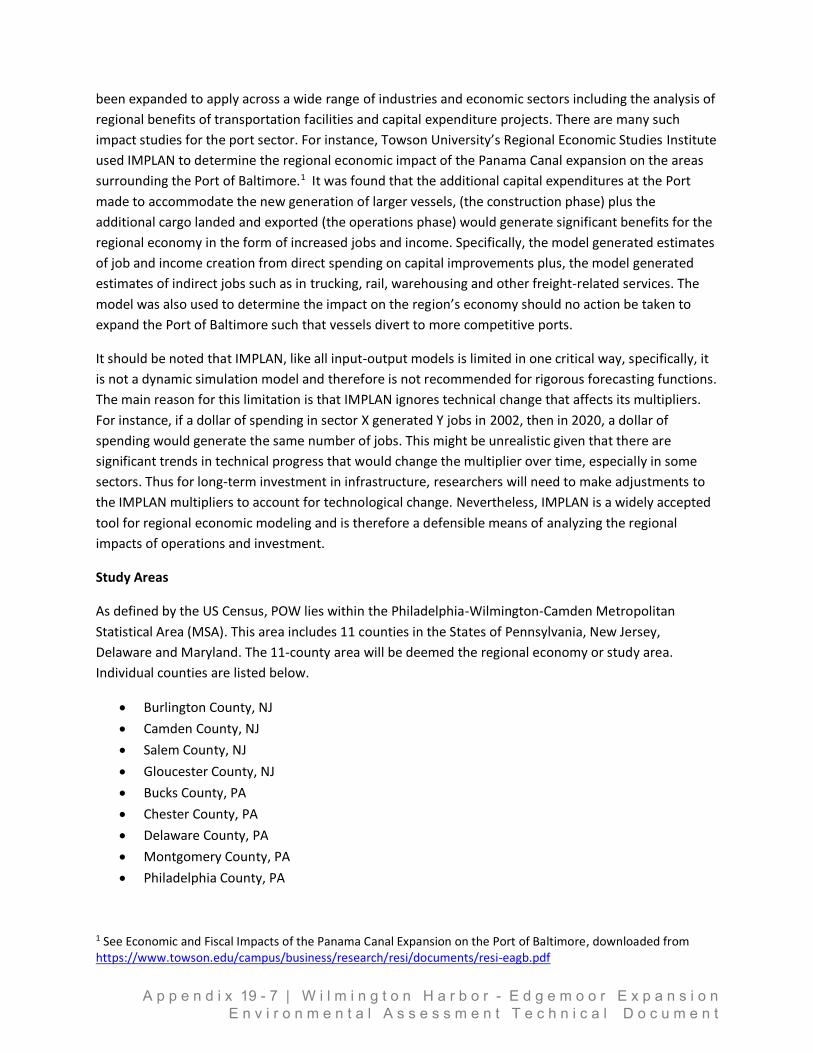
By weight, waterborne trade dominates competing modes with a 17.1 percent share in 2015, slightly
below its share of nearly 1 in 5 tons shipped in 2012.
15.0%
17.0%
19.0%
21.0%
23.0%
25.0%
27.0%
29.0%
31.0%
33.0%
1985
1986
1987
1988
1989
1990
1991
1992
1993
1994
1995
1996
1997
1998
1999
2000
2001
2002
2003
2004
2005
2006
2007
2008
2009
2010
2011
2012
2013
2014
2015
A p p e n d i x 19 - 5 | W i l m i n g t o n H a r b o r - E d g e m o o r E x p a n s i o n E n v i r o n m e n t a l A s s e s s m e n t T e c h n i c a l D o c u m e n t
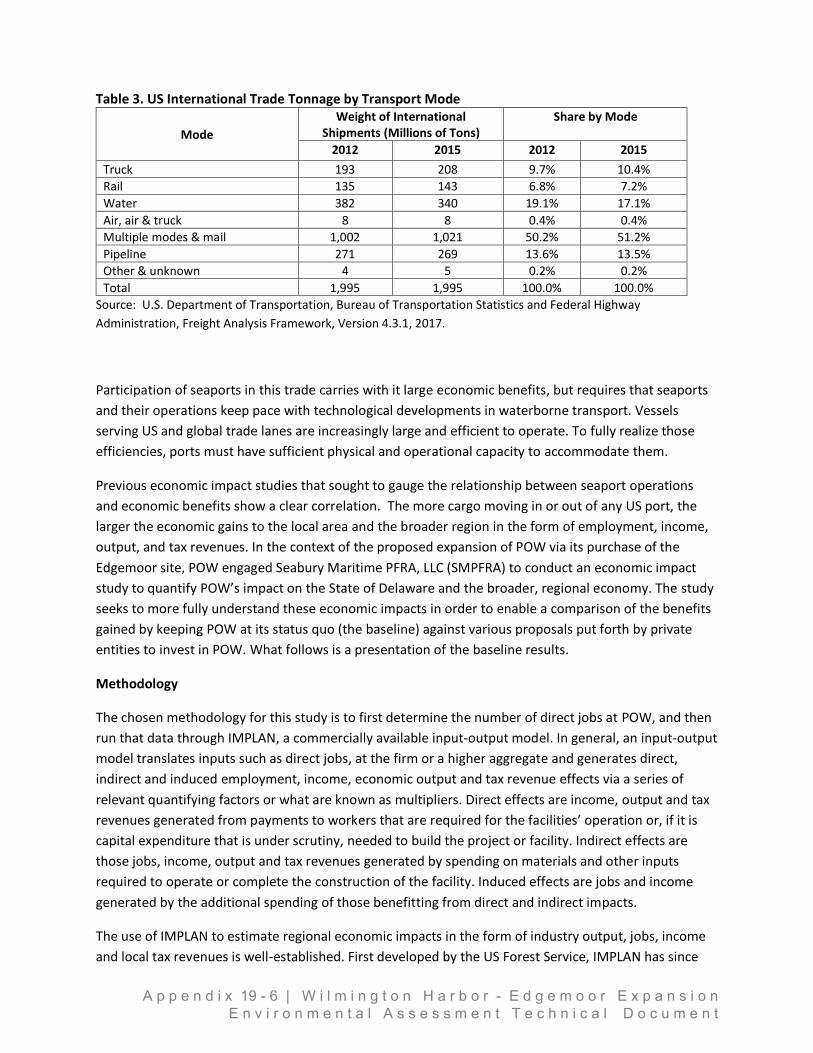
Table 3. US International Trade Tonnage by Transport Mode
Mode
Weight of International Shipments (Millions of Tons)
Share by Mode
2012 2015 2012 2015
Truck 193 208 9.7% 10.4%
Rail 135 143 6.8% 7.2%
Water 382 340 19.1% 17.1%
Air, air & truck 8 8 0.4% 0.4%
Multiple modes & mail 1,002 1,021 50.2% 51.2%
Pipeline 271 269 13.6% 13.5%
Other & unknown 4 5 0.2% 0.2%
Total 1,995 1,995 100.0% 100.0%
Source: U.S. Department of Transportation, Bureau of Transportation Statistics and Federal Highway
Administration, Freight Analysis Framework, Version 4.3.1, 2017.
Participation of seaports in this trade carries with it large economic benefits, but requires that seaports
and their operations keep pace with technological developments in waterborne transport. Vessels
serving US and global trade lanes are increasingly large and efficient to operate. To fully realize those
efficiencies, ports must have sufficient physical and operational capacity to accommodate them.
Previous economic impact studies that sought to gauge the relationship between seaport operations
and economic benefits show a clear correlation. The more cargo moving in or out of any US port, the
larger the economic gains to the local area and the broader region in the form of employment, income,
output, and tax revenues. In the context of the proposed expansion of POW via its purchase of the
Edgemoor site, POW engaged Seabury Maritime PFRA, LLC (SMPFRA) to conduct an economic impact
study to quantify POW’s impact on the State of Delaware and the broader, regional economy. The study
seeks to more fully understand these economic impacts in order to enable a comparison of the benefits
gained by keeping POW at its status quo (the baseline) against various proposals put forth by private
entities to invest in POW. What follows is a presentation of the baseline results.
Methodology
The chosen methodology for this study is to first determine the number of direct jobs at POW, and then
run that data through IMPLAN, a commercially available input-output model. In general, an input-output
model translates inputs such as direct jobs, at the firm or a higher aggregate and generates direct,
indirect and induced employment, income, economic output and tax revenue effects via a series of
relevant quantifying factors or what are known as multipliers. Direct effects are income, output and tax
revenues generated from payments to workers that are required for the facilities’ operation or, if it is
capital expenditure that is under scrutiny, needed to build the project or facility. Indirect effects are
those jobs, income, output and tax revenues generated by spending on materials and other inputs
required to operate or complete the construction of the facility. Induced effects are jobs and income
generated by the additional spending of those benefitting from direct and indirect impacts.
The use of IMPLAN to estimate regional economic impacts in the form of industry output, jobs, income
and local tax revenues is well-established. First developed by the US Forest Service, IMPLAN has since
A p p e n d i x 19 - 6 | W i l m i n g t o n H a r b o r - E d g e m o o r E x p a n s i o n E n v i r o n m e n t a l A s s e s s m e n t T e c h n i c a l D o c u m e n t
been expanded to apply across a wide range of industries and economic sectors including the analysis of
regional benefits of transportation facilities and capital expenditure projects. There are many such
impact studies for the port sector. For instance, Towson University’s Regional Economic Studies Institute
used IMPLAN to determine the regional economic impact of the Panama Canal expansion on the areas
surrounding the Port of Baltimore.1 It was found that the additional capital expenditures at the Port
made to accommodate the new generation of larger vessels, (the construction phase) plus the
additional cargo landed and exported (the operations phase) would generate significant benefits for the
regional economy in the form of increased jobs and income. Specifically, the model generated estimates
of job and income creation from direct spending on capital improvements plus, the model generated
estimates of indirect jobs such as in trucking, rail, warehousing and other freight-related services. The
model was also used to determine the impact on the region’s economy should no action be taken to
expand the Port of Baltimore such that vessels divert to more competitive ports.
It should be noted that IMPLAN, like all input-output models is limited in one critical way, specifically, it
is not a dynamic simulation model and therefore is not recommended for rigorous forecasting functions.
The main reason for this limitation is that IMPLAN ignores technical change that affects its multipliers.
For instance, if a dollar of spending in sector X generated Y jobs in 2002, then in 2020, a dollar of
spending would generate the same number of jobs. This might be unrealistic given that there are
significant trends in technical progress that would change the multiplier over time, especially in some
sectors. Thus for long-term investment in infrastructure, researchers will need to make adjustments to
the IMPLAN multipliers to account for technological change. Nevertheless, IMPLAN is a widely accepted
tool for regional economic modeling and is therefore a defensible means of analyzing the regional
impacts of operations and investment.
Study Areas
As defined by the US Census, POW lies within the Philadelphia-Wilmington-Camden Metropolitan
Statistical Area (MSA). This area includes 11 counties in the States of Pennsylvania, New Jersey,
Delaware and Maryland. The 11-county area will be deemed the regional economy or study area.
Individual counties are listed below.
Burlington County, NJ
Camden County, NJ
Salem County, NJ
Gloucester County, NJ
Bucks County, PA
Chester County, PA
Delaware County, PA
Montgomery County, PA
Philadelphia County, PA
1 See Economic and Fiscal Impacts of the Panama Canal Expansion on the Port of Baltimore, downloaded from https://www.towson.edu/campus/business/research/resi/documents/resi-eagb.pdf
A p p e n d i x 19 - 7 | W i l m i n g t o n H a r b o r - E d g e m o o r E x p a n s i o n E n v i r o n m e n t a l A s s e s s m e n t T e c h n i c a l D o c u m e n t
New Castle County, DE
Cecil County, MD
However, the model was also used to estimate impacts exclusive to the State of Delaware. Delaware
counties are listed here.
New Castle County, DE
Kent County, DE
Sussex County, DE
The Philadelphia-Wilmington-Camden MSA
According to the US Bureau of Economic Analysis, as of 2015, the population of the Philadelphia-
Camden-Wilmington MSA was estimated to be 6,069,875 persons, the 7th largest in the US. Per capita
income was $57,173, or 119 percent of the national average of $48,112.2 The 2005-2015 compound
annual growth rate of per capita income was 3.1 percent, just above the national growth rate of 3.0
percent. In the aggregate, the MSA had a personal income of $347 billion in 2015.
State of Delaware
The total population of Delaware was 944,0763 in 2015 and per capita income was $47,727. Total
personal income amounted to $45.6 billion and total output was $70.2 billion. Delaware GDP is
relatively slow-growing at an average annual rate of 2.3 percent from 2006 – 2016.4 The State of
Delaware participates in international trade at slightly above what its population would suggest. The
value of overseas shipments originating in Delaware range between 0.3 percent and 0.4 percent of all
US export shipment value while Delaware’s population is just under 0.3 percent of the total US
population.5
MSA Level Economic Impacts
MSA Direct Jobs Estimates
IMPLAN will accept as inputs, estimates of direct jobs at the port then use these to impute total wages
and income. Direct wages and income are subsequently used to generate estimates of indirect and
induced jobs, income, value-added, total output and tax revenues across the specified market or region.
Estimates of direct jobs at POW were originally to be derived using an online survey via the Survey
Monkey platform. We developed the survey instrument in early September and distributed it to all firms
known to operate at POW. The survey included questions about total employment, total wages, the
geographic distribution of employment, operating costs and type of business. Unfortunately, the
response rate for this exercise was low with just 8 firms or 20 percent of the sample responding and not
2 Source BEA at https://www.bea.gov/regional/bearfacts/pdf.cfm?fips=37980&areatype=MSA&geotype=4 3 Source: https://fred.stlouisfed.org/series/DEPOP 4 Source: https://www.bea.gov/regional/bearfacts/pdf.cfm?fips=10000&areatype=STATE&geotype=3 5 See US Census Total U.S. Exports (Origin of Movement) from Delaware available at https://www.census.gov/foreign-trade/statistics/state/data/de.html
A p p e n d i x 19 - 8 | W i l m i n g t o n H a r b o r - E d g e m o o r E x p a n s i o n E n v i r o n m e n t a l A s s e s s m e n t T e c h n i c a l D o c u m e n t
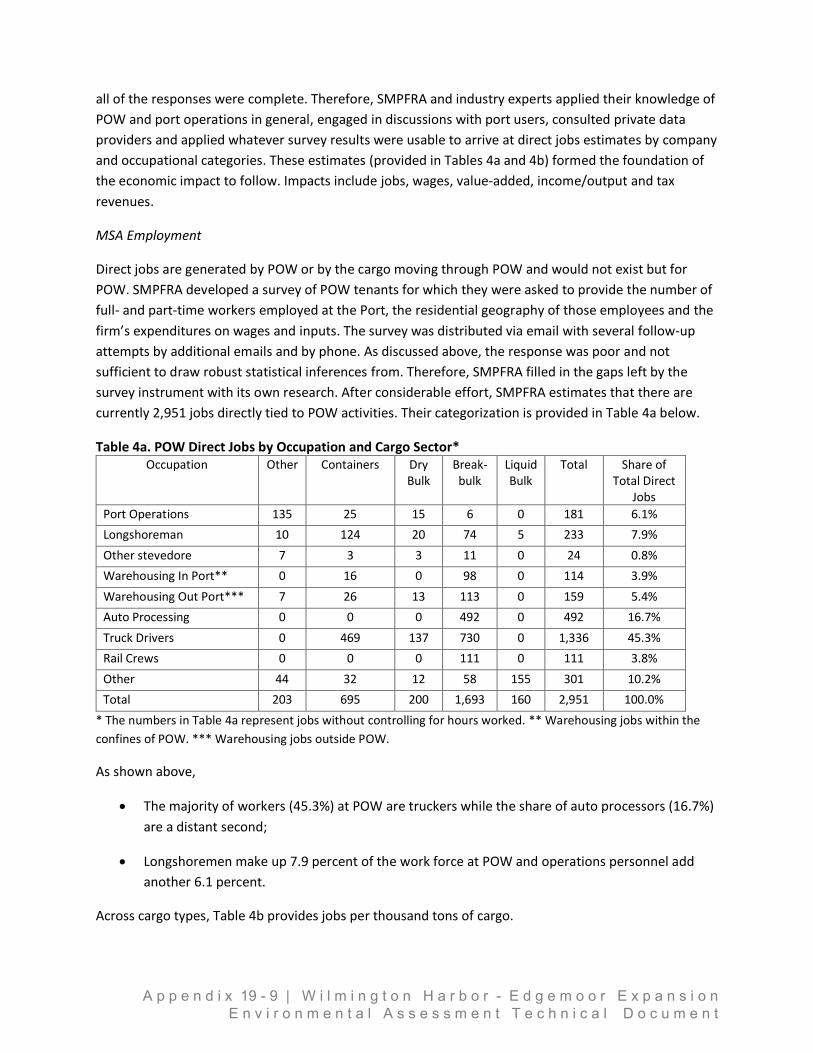
all of the responses were complete. Therefore, SMPFRA and industry experts applied their knowledge of
POW and port operations in general, engaged in discussions with port users, consulted private data
providers and applied whatever survey results were usable to arrive at direct jobs estimates by company
and occupational categories. These estimates (provided in Tables 4a and 4b) formed the foundation of
the economic impact to follow. Impacts include jobs, wages, value-added, income/output and tax
revenues.
MSA Employment
Direct jobs are generated by POW or by the cargo moving through POW and would not exist but for
POW. SMPFRA developed a survey of POW tenants for which they were asked to provide the number of
full- and part-time workers employed at the Port, the residential geography of those employees and the
firm’s expenditures on wages and inputs. The survey was distributed via email with several follow-up
attempts by additional emails and by phone. As discussed above, the response was poor and not
sufficient to draw robust statistical inferences from. Therefore, SMPFRA filled in the gaps left by the
survey instrument with its own research. After considerable effort, SMPFRA estimates that there are
currently 2,951 jobs directly tied to POW activities. Their categorization is provided in Table 4a below.
Table 4a. POW Direct Jobs by Occupation and Cargo Sector* Occupation Other Containers Dry
Bulk Break- bulk
Liquid Bulk
Total Share of Total Direct
Jobs
Port Operations 135 25 15 6 0 181 6.1%
Longshoreman 10 124 20 74 5 233 7.9%
Other stevedore 7 3 3 11 0 24 0.8%
Warehousing In Port** 0 16 0 98 0 114 3.9%
Warehousing Out Port*** 7 26 13 113 0 159 5.4%
Auto Processing 0 0 0 492 0 492 16.7%
Truck Drivers 0 469 137 730 0 1,336 45.3%
Rail Crews 0 0 0 111 0 111 3.8%
Other 44 32 12 58 155 301 10.2%
Total 203 695 200 1,693 160 2,951 100.0%
* The numbers in Table 4a represent jobs without controlling for hours worked. ** Warehousing jobs within the
confines of POW. *** Warehousing jobs outside POW.
As shown above,
The majority of workers (45.3%) at POW are truckers while the share of auto processors (16.7%)
are a distant second;
Longshoremen make up 7.9 percent of the work force at POW and operations personnel add
another 6.1 percent.
Across cargo types, Table 4b provides jobs per thousand tons of cargo.
A p p e n d i x 19 - 9 | W i l m i n g t o n H a r b o r - E d g e m o o r E x p a n s i o n E n v i r o n m e n t a l A s s e s s m e n t T e c h n i c a l D o c u m e n t
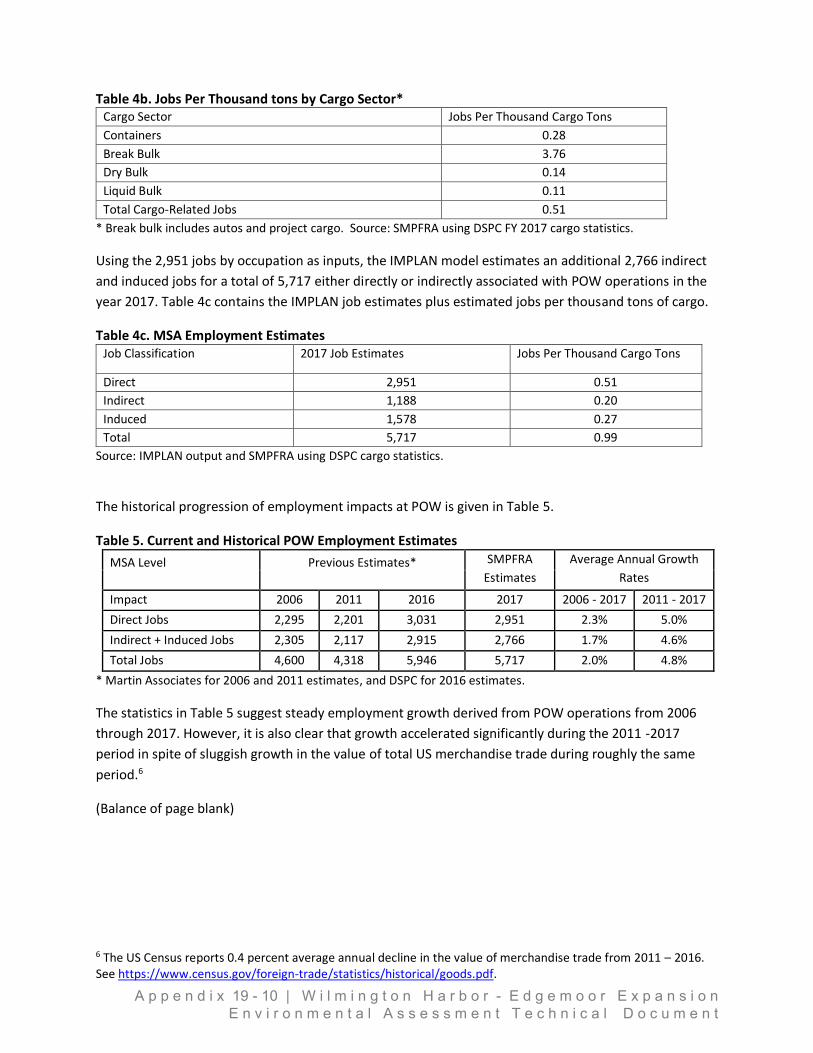
Table 4b. Jobs Per Thousand tons by Cargo Sector* Cargo Sector Jobs Per Thousand Cargo Tons
Containers 0.28
Break Bulk 3.76
Dry Bulk 0.14
Liquid Bulk 0.11
Total Cargo-Related Jobs 0.51
* Break bulk includes autos and project cargo. Source: SMPFRA using DSPC FY 2017 cargo statistics.
Using the 2,951 jobs by occupation as inputs, the IMPLAN model estimates an additional 2,766 indirect
and induced jobs for a total of 5,717 either directly or indirectly associated with POW operations in the
year 2017. Table 4c contains the IMPLAN job estimates plus estimated jobs per thousand tons of cargo.
Table 4c. MSA Employment Estimates Job Classification 2017 Job Estimates Jobs Per Thousand Cargo Tons
Direct 2,951 0.51
Indirect 1,188 0.20
Induced 1,578 0.27
Total 5,717 0.99
Source: IMPLAN output and SMPFRA using DSPC cargo statistics.
The historical progression of employment impacts at POW is given in Table 5.
Table 5. Current and Historical POW Employment Estimates
MSA Level Previous Estimates* SMPFRA
Estimates
Average Annual Growth
Rates
Impact 2006 2011 2016 2017 2006 - 2017 2011 - 2017
Direct Jobs 2,295 2,201 3,031 2,951 2.3% 5.0%
Indirect + Induced Jobs 2,305 2,117 2,915 2,766 1.7% 4.6%
Total Jobs 4,600 4,318 5,946 5,717 2.0% 4.8%
* Martin Associates for 2006 and 2011 estimates, and DSPC for 2016 estimates.
The statistics in Table 5 suggest steady employment growth derived from POW operations from 2006
through 2017. However, it is also clear that growth accelerated significantly during the 2011 -2017
period in spite of sluggish growth in the value of total US merchandise trade during roughly the same
period.6
(Balance of page blank)
6 The US Census reports 0.4 percent average annual decline in the value of merchandise trade from 2011 – 2016. See https://www.census.gov/foreign-trade/statistics/historical/goods.pdf.
A p p e n d i x 19 - 10 | W i l m i n g t o n H a r b o r - E d g e m o o r E x p a n s i o n E n v i r o n m e n t a l A s s e s s m e n t T e c h n i c a l D o c u m e n t
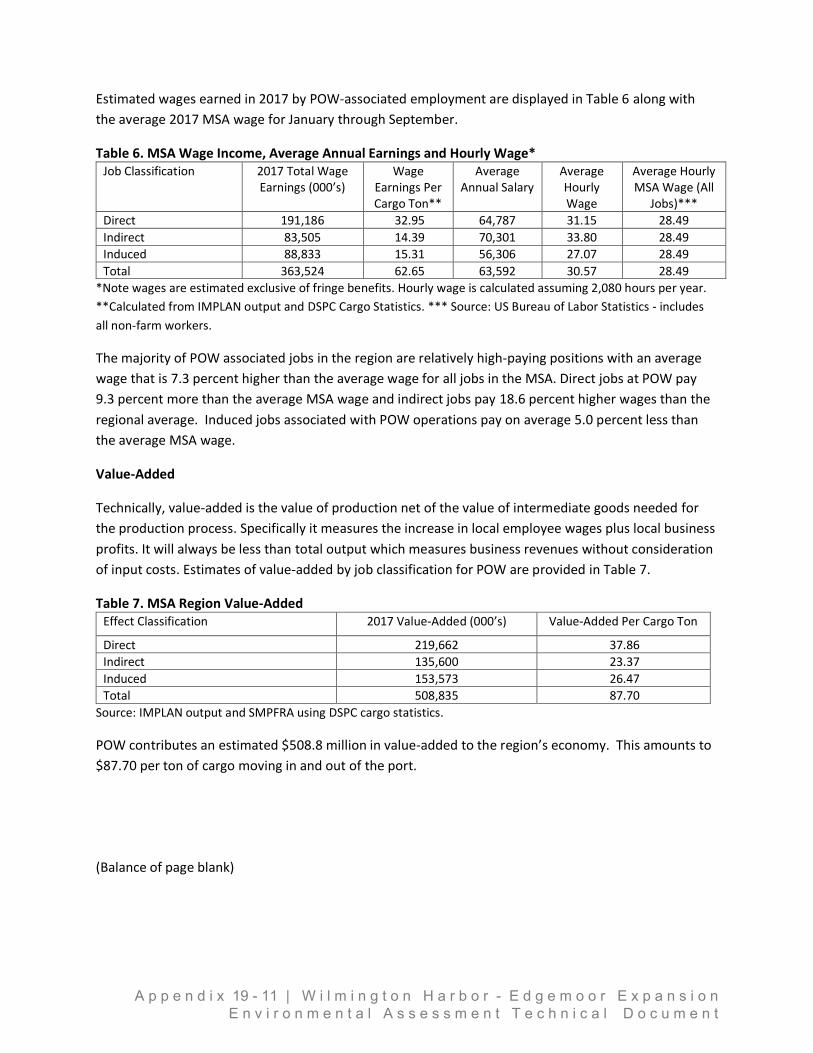
Estimated wages earned in 2017 by POW-associated employment are displayed in Table 6 along with
the average 2017 MSA wage for January through September.
Table 6. MSA Wage Income, Average Annual Earnings and Hourly Wage* Job Classification 2017 Total Wage
Earnings (000’s) Wage
Earnings Per Cargo Ton**
Average Annual Salary
Average Hourly Wage
Average Hourly MSA Wage (All
Jobs)***
Direct 191,186 32.95 64,787 31.15 28.49
Indirect 83,505 14.39 70,301 33.80 28.49
Induced 88,833 15.31 56,306 27.07 28.49
Total 363,524 62.65 63,592 30.57 28.49
*Note wages are estimated exclusive of fringe benefits. Hourly wage is calculated assuming 2,080 hours per year.
**Calculated from IMPLAN output and DSPC Cargo Statistics. *** Source: US Bureau of Labor Statistics - includes
all non-farm workers.
The majority of POW associated jobs in the region are relatively high-paying positions with an average
wage that is 7.3 percent higher than the average wage for all jobs in the MSA. Direct jobs at POW pay
9.3 percent more than the average MSA wage and indirect jobs pay 18.6 percent higher wages than the
regional average. Induced jobs associated with POW operations pay on average 5.0 percent less than
the average MSA wage.
Value-Added
Technically, value-added is the value of production net of the value of intermediate goods needed for
the production process. Specifically it measures the increase in local employee wages plus local business
profits. It will always be less than total output which measures business revenues without consideration
of input costs. Estimates of value-added by job classification for POW are provided in Table 7.
Table 7. MSA Region Value-Added Effect Classification 2017 Value-Added (000’s) Value-Added Per Cargo Ton
Direct 219,662 37.86
Indirect 135,600 23.37
Induced 153,573 26.47
Total 508,835 87.70
Source: IMPLAN output and SMPFRA using DSPC cargo statistics.
POW contributes an estimated $508.8 million in value-added to the region’s economy. This amounts to
$87.70 per ton of cargo moving in and out of the port.
(Balance of page blank)
A p p e n d i x 19 - 11 | W i l m i n g t o n H a r b o r - E d g e m o o r E x p a n s i o n E n v i r o n m e n t a l A s s e s s m e n t T e c h n i c a l D o c u m e n t
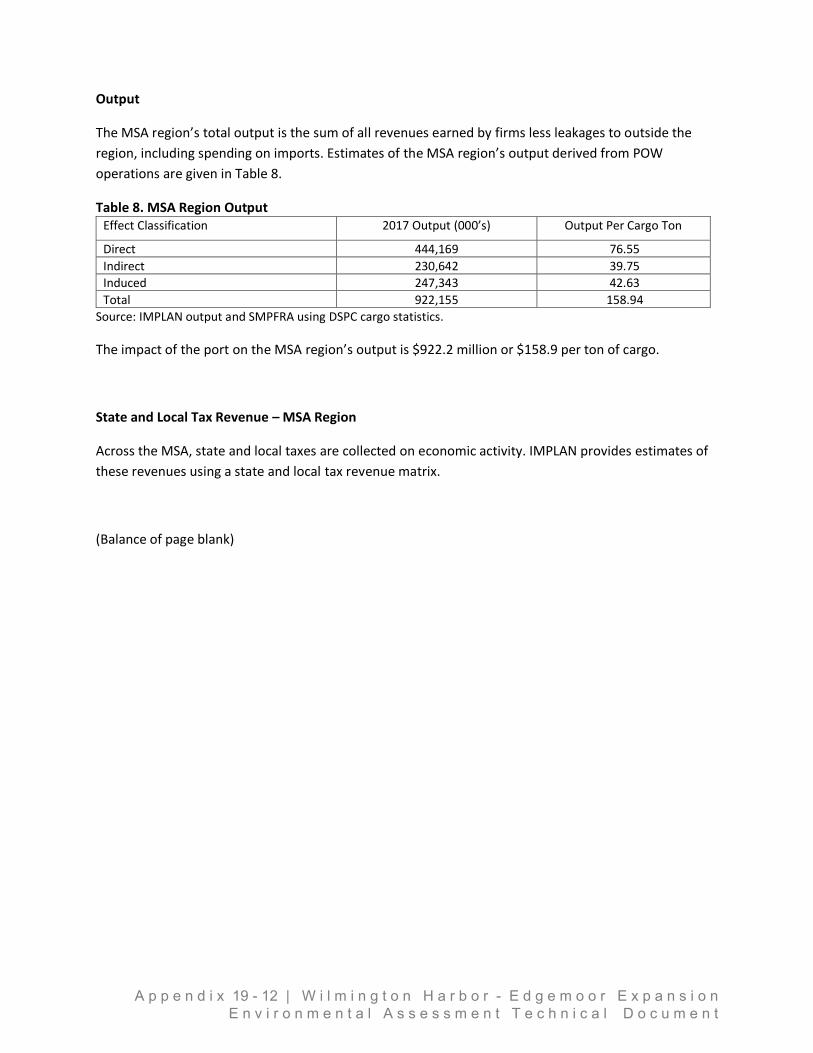
Output
The MSA region’s total output is the sum of all revenues earned by firms less leakages to outside the
region, including spending on imports. Estimates of the MSA region’s output derived from POW
operations are given in Table 8.
Table 8. MSA Region Output Effect Classification 2017 Output (000’s) Output Per Cargo Ton
Direct 444,169 76.55
Indirect 230,642 39.75
Induced 247,343 42.63
Total 922,155 158.94
Source: IMPLAN output and SMPFRA using DSPC cargo statistics.
The impact of the port on the MSA region’s output is $922.2 million or $158.9 per ton of cargo.
State and Local Tax Revenue – MSA Region
Across the MSA, state and local taxes are collected on economic activity. IMPLAN provides estimates of
these revenues using a state and local tax revenue matrix.
(Balance of page blank)
A p p e n d i x 19 - 12 | W i l m i n g t o n H a r b o r - E d g e m o o r E x p a n s i o n E n v i r o n m e n t a l A s s e s s m e n t T e c h n i c a l D o c u m e n t
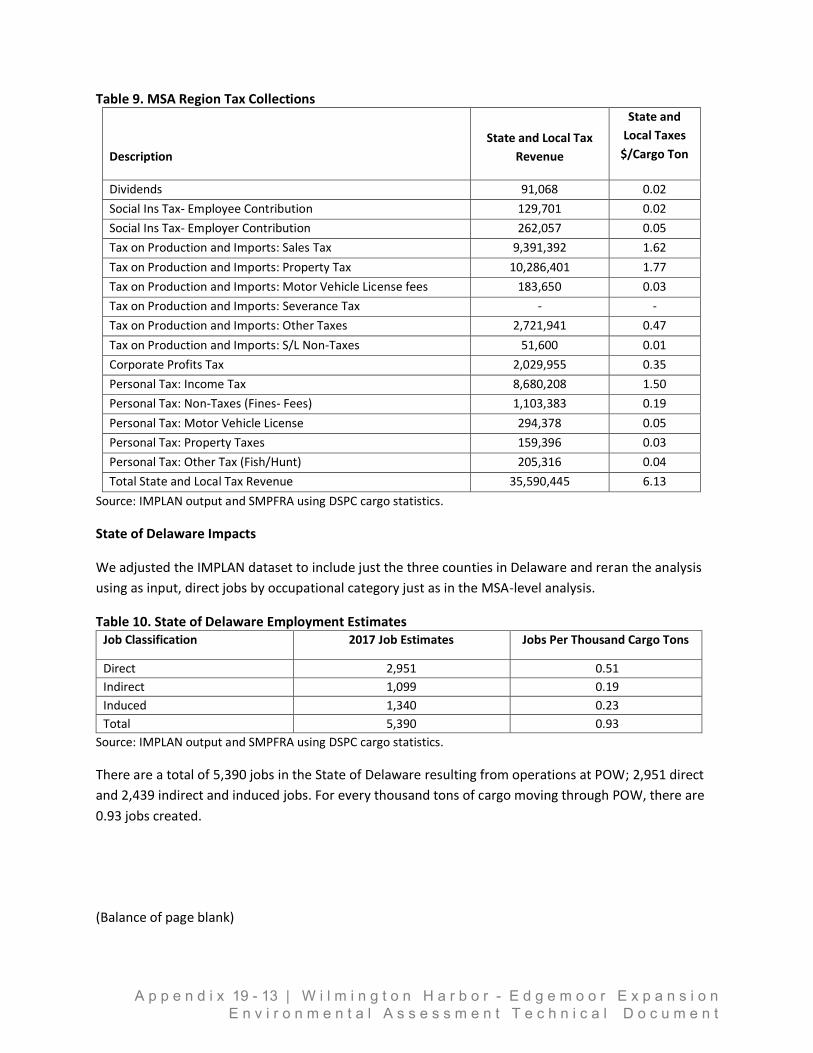
Table 9. MSA Region Tax Collections
Description
State and Local Tax
Revenue
State and
Local Taxes
$/Cargo Ton
Dividends 91,068 0.02
Social Ins Tax- Employee Contribution 129,701 0.02
Social Ins Tax- Employer Contribution 262,057 0.05
Tax on Production and Imports: Sales Tax 9,391,392 1.62
Tax on Production and Imports: Property Tax 10,286,401 1.77
Tax on Production and Imports: Motor Vehicle License fees 183,650 0.03
Tax on Production and Imports: Severance Tax - -
Tax on Production and Imports: Other Taxes 2,721,941 0.47
Tax on Production and Imports: S/L Non-Taxes 51,600 0.01
Corporate Profits Tax 2,029,955 0.35
Personal Tax: Income Tax 8,680,208 1.50
Personal Tax: Non-Taxes (Fines- Fees) 1,103,383 0.19
Personal Tax: Motor Vehicle License 294,378 0.05
Personal Tax: Property Taxes 159,396 0.03
Personal Tax: Other Tax (Fish/Hunt) 205,316 0.04
Total State and Local Tax Revenue 35,590,445 6.13
Source: IMPLAN output and SMPFRA using DSPC cargo statistics.
State of Delaware Impacts
We adjusted the IMPLAN dataset to include just the three counties in Delaware and reran the analysis
using as input, direct jobs by occupational category just as in the MSA-level analysis.
Table 10. State of Delaware Employment Estimates Job Classification 2017 Job Estimates Jobs Per Thousand Cargo Tons
Direct 2,951 0.51
Indirect 1,099 0.19
Induced 1,340 0.23
Total 5,390 0.93
Source: IMPLAN output and SMPFRA using DSPC cargo statistics.
There are a total of 5,390 jobs in the State of Delaware resulting from operations at POW; 2,951 direct
and 2,439 indirect and induced jobs. For every thousand tons of cargo moving through POW, there are
0.93 jobs created.
(Balance of page blank)
A p p e n d i x 19 - 13 | W i l m i n g t o n H a r b o r - E d g e m o o r E x p a n s i o n E n v i r o n m e n t a l A s s e s s m e n t T e c h n i c a l D o c u m e n t
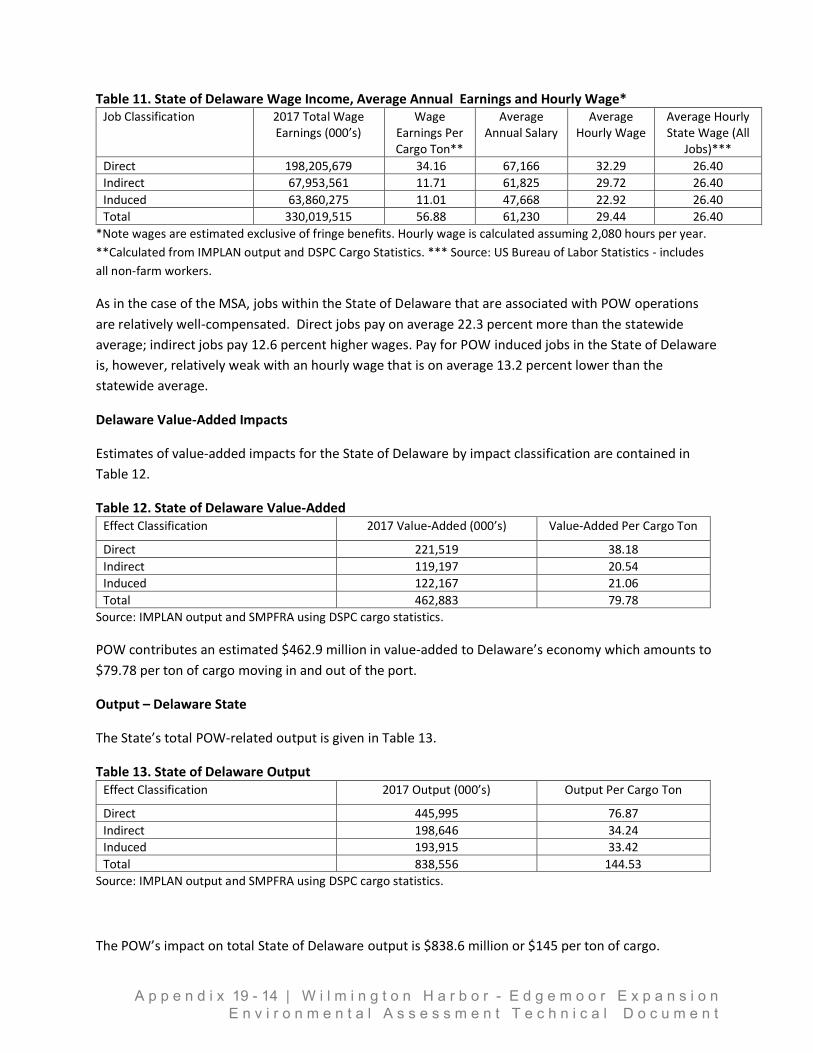
Table 11. State of Delaware Wage Income, Average Annual Earnings and Hourly Wage* Job Classification 2017 Total Wage
Earnings (000’s) Wage
Earnings Per Cargo Ton**
Average Annual Salary
Average Hourly Wage
Average Hourly State Wage (All
Jobs)***
Direct 198,205,679 34.16 67,166 32.29 26.40
Indirect 67,953,561 11.71 61,825 29.72 26.40
Induced 63,860,275 11.01 47,668 22.92 26.40
Total 330,019,515 56.88 61,230 29.44 26.40
*Note wages are estimated exclusive of fringe benefits. Hourly wage is calculated assuming 2,080 hours per year.
**Calculated from IMPLAN output and DSPC Cargo Statistics. *** Source: US Bureau of Labor Statistics - includes
all non-farm workers.
As in the case of the MSA, jobs within the State of Delaware that are associated with POW operations
are relatively well-compensated. Direct jobs pay on average 22.3 percent more than the statewide
average; indirect jobs pay 12.6 percent higher wages. Pay for POW induced jobs in the State of Delaware
is, however, relatively weak with an hourly wage that is on average 13.2 percent lower than the
statewide average.
Delaware Value-Added Impacts
Estimates of value-added impacts for the State of Delaware by impact classification are contained in
Table 12.
Table 12. State of Delaware Value-Added Effect Classification 2017 Value-Added (000’s) Value-Added Per Cargo Ton
Direct 221,519 38.18
Indirect 119,197 20.54
Induced 122,167 21.06
Total 462,883 79.78
Source: IMPLAN output and SMPFRA using DSPC cargo statistics.
POW contributes an estimated $462.9 million in value-added to Delaware’s economy which amounts to
$79.78 per ton of cargo moving in and out of the port.
Output – Delaware State
The State’s total POW-related output is given in Table 13.
Table 13. State of Delaware Output Effect Classification 2017 Output (000’s) Output Per Cargo Ton
Direct 445,995 76.87
Indirect 198,646 34.24
Induced 193,915 33.42
Total 838,556 144.53
Source: IMPLAN output and SMPFRA using DSPC cargo statistics.
The POW’s impact on total State of Delaware output is $838.6 million or $145 per ton of cargo.
A p p e n d i x 19 - 14 | W i l m i n g t o n H a r b o r - E d g e m o o r E x p a n s i o n E n v i r o n m e n t a l A s s e s s m e n t T e c h n i c a l D o c u m e n t
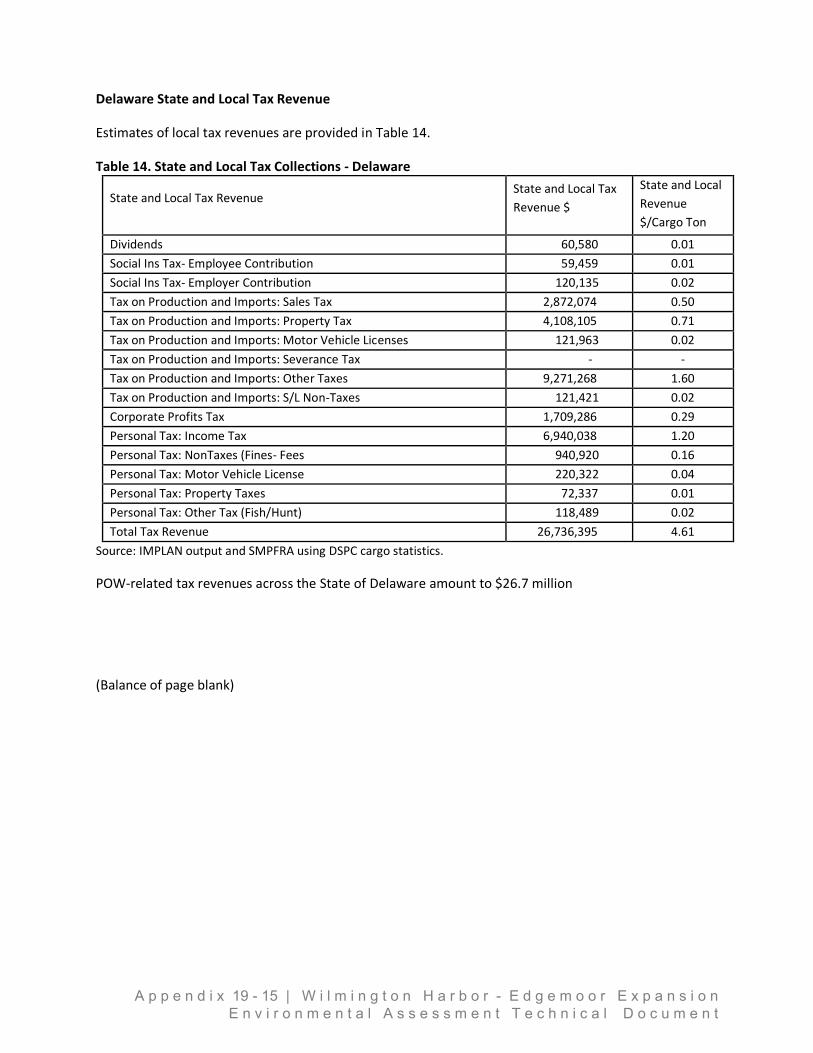
Delaware State and Local Tax Revenue
Estimates of local tax revenues are provided in Table 14.
Table 14. State and Local Tax Collections - Delaware
State and Local Tax Revenue State and Local Tax
Revenue $
State and Local
Revenue
$/Cargo Ton
Dividends 60,580 0.01
Social Ins Tax- Employee Contribution 59,459 0.01
Social Ins Tax- Employer Contribution 120,135 0.02
Tax on Production and Imports: Sales Tax 2,872,074 0.50
Tax on Production and Imports: Property Tax 4,108,105 0.71
Tax on Production and Imports: Motor Vehicle Licenses 121,963 0.02
Tax on Production and Imports: Severance Tax - -
Tax on Production and Imports: Other Taxes 9,271,268 1.60
Tax on Production and Imports: S/L Non-Taxes 121,421 0.02
Corporate Profits Tax 1,709,286 0.29
Personal Tax: Income Tax 6,940,038 1.20
Personal Tax: NonTaxes (Fines- Fees 940,920 0.16
Personal Tax: Motor Vehicle License 220,322 0.04
Personal Tax: Property Taxes 72,337 0.01
Personal Tax: Other Tax (Fish/Hunt) 118,489 0.02
Total Tax Revenue 26,736,395 4.61
Source: IMPLAN output and SMPFRA using DSPC cargo statistics.
POW-related tax revenues across the State of Delaware amount to $26.7 million
(Balance of page blank)
A p p e n d i x 19 - 15 | W i l m i n g t o n H a r b o r - E d g e m o o r E x p a n s i o n E n v i r o n m e n t a l A s s e s s m e n t T e c h n i c a l D o c u m e n t
Port of Wilmington Long-term Forecasts
The port is nearing capacity without the significant investment requirements identified in the recently
completed 2016 Master Plan. The port of Wilmington, DSPC, and the State of Delaware are constrained
by the inability to fund capital improvements. As POW considers its future options, there is a need to
forecast cargo, jobs, and the associated economic impact for a base case. This base case will also be
utilized during the US Army Corps of Engineers (USACE) dredge permitting process that is required for
some potential investment options by the private sector under consideration.
A base case forecast has been developed that assumes:
Masterplan cargo growth forecasts
o Updated for actuals through 2017
o Updated by eliminating a 2017 container service that did not materialize
o Constrained to existing capacity due to the lack of significant Capital Expenditure
(CAPEX) funds for minimum growth requirements in the Master Plan
o Are not constrained by the potential loss of capacity in this analysis due to a possible
lack of “maintenance” CAPEX that is identified in the Master Plan
Jobs and economic impacts forecasted are based on the cargo forecasted
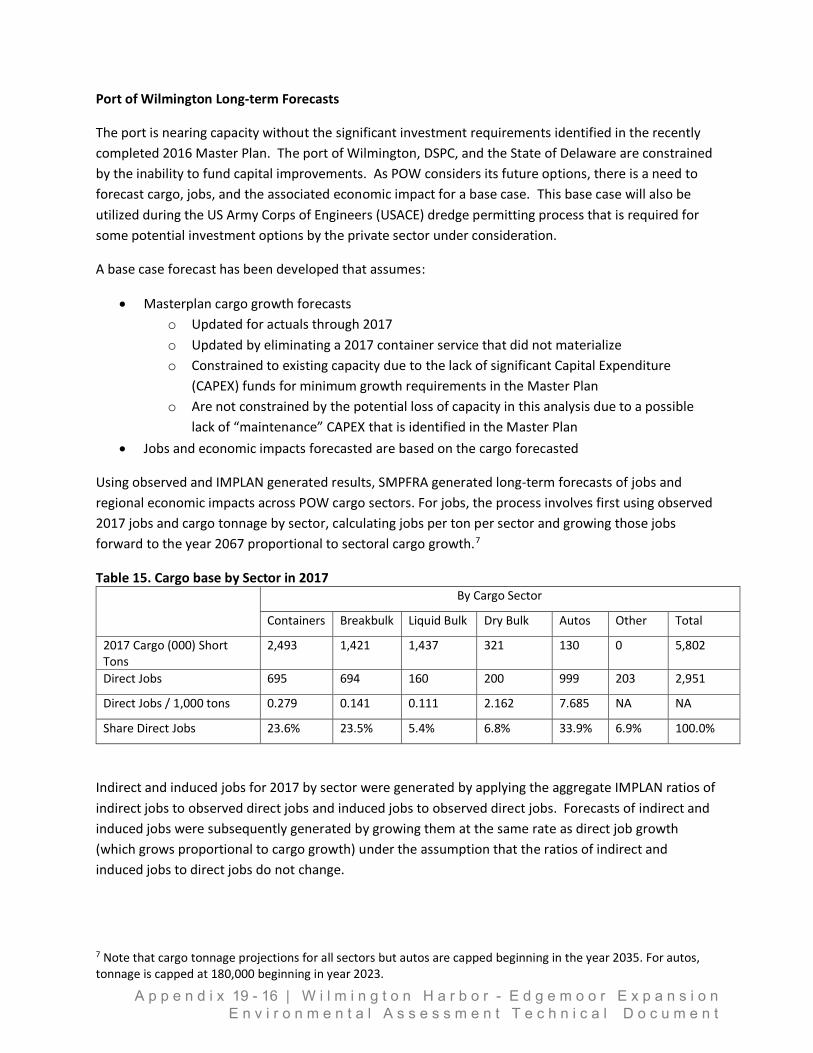
Using observed and IMPLAN generated results, SMPFRA generated long-term forecasts of jobs and
regional economic impacts across POW cargo sectors. For jobs, the process involves first using observed
2017 jobs and cargo tonnage by sector, calculating jobs per ton per sector and growing those jobs
forward to the year 2067 proportional to sectoral cargo growth.7
Table 15. Cargo base by Sector in 2017 By Cargo Sector
Containers Breakbulk Liquid Bulk Dry Bulk Autos Other Total
2017 Cargo (000) Short Tons
2,493 1,421 1,437 321 130 0 5,802
Direct Jobs 695 694 160 200 999 203 2,951
Direct Jobs / 1,000 tons 0.279 0.141 0.111 2.162 7.685 NA NA
Share Direct Jobs 23.6% 23.5% 5.4% 6.8% 33.9% 6.9% 100.0%
Indirect and induced jobs for 2017 by sector were generated by applying the aggregate IMPLAN ratios of
indirect jobs to observed direct jobs and induced jobs to observed direct jobs. Forecasts of indirect and
induced jobs were subsequently generated by growing them at the same rate as direct job growth
(which grows proportional to cargo growth) under the assumption that the ratios of indirect and
induced jobs to direct jobs do not change.
7 Note that cargo tonnage projections for all sectors but autos are capped beginning in the year 2035. For autos, tonnage is capped at 180,000 beginning in year 2023.
A p p e n d i x 19 - 16 | W i l m i n g t o n H a r b o r - E d g e m o o r E x p a n s i o n E n v i r o n m e n t a l A s s e s s m e n t T e c h n i c a l D o c u m e n t
All other direct, indirect and induced economic impacts, including wages, output and value-added were
generated by applying the 2017 share of direct jobs to aggregate IMPLAN outputs for the year 2017 then
growing those impacts forward at the same rate as the growth in cargo.
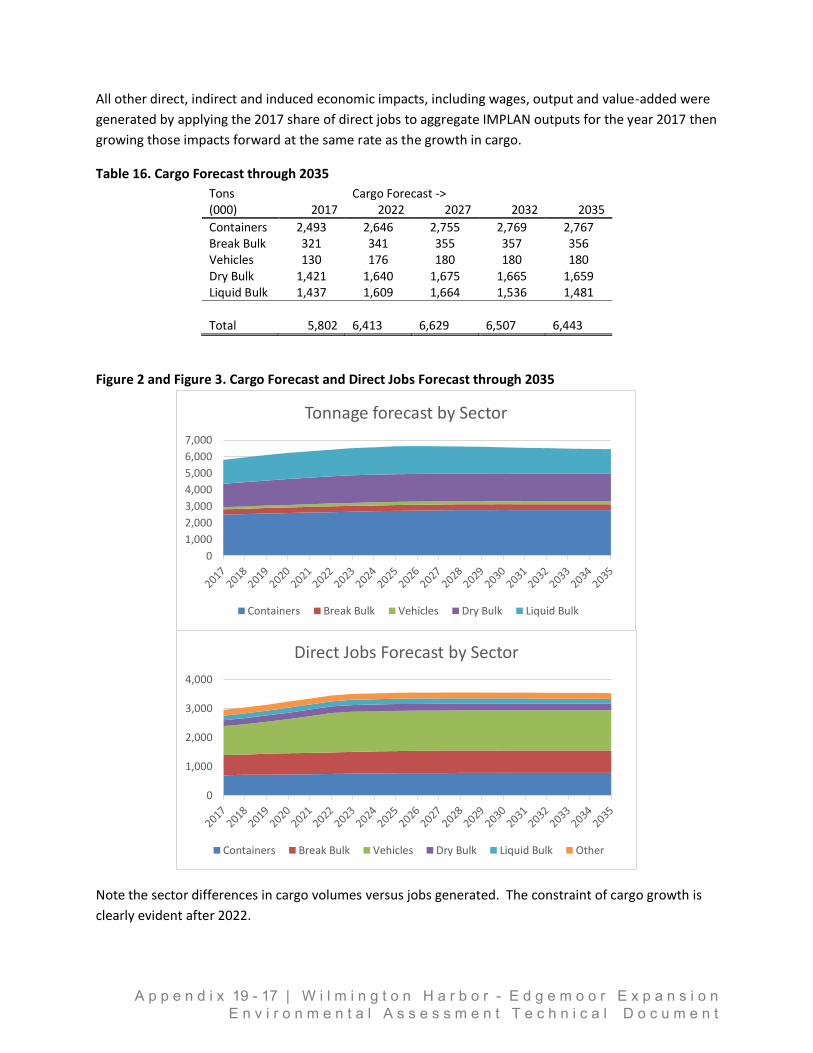
Table 16. Cargo Forecast through 2035
Tons Cargo Forecast -> (000) 2017 2022 2027 2032 2035
Containers 2,493 2,646 2,755 2,769 2,767 Break Bulk 321 341 355 357 356 Vehicles 130 176 180 180 180 Dry Bulk 1,421 1,640 1,675 1,665 1,659 Liquid Bulk 1,437 1,609 1,664 1,536 1,481
Total 5,802 6,413
6,629
6,507
6,443
Figure 2 and Figure 3. Cargo Forecast and Direct Jobs Forecast through 2035
Note the sector differences in cargo volumes versus jobs generated. The constraint of cargo growth is
clearly evident after 2022.
0
1,000
2,000
3,000
4,000
Direct Jobs Forecast by Sector
Containers Break Bulk Vehicles Dry Bulk Liquid Bulk Other
0
1,000
2,000
3,000
4,000
5,000
6,000
7,000
Tonnage forecast by Sector
Containers Break Bulk Vehicles Dry Bulk Liquid Bulk
A p p e n d i x 19 - 17 | W i l m i n g t o n H a r b o r - E d g e m o o r E x p a n s i o n E n v i r o n m e n t a l A s s e s s m e n t T e c h n i c a l D o c u m e n t
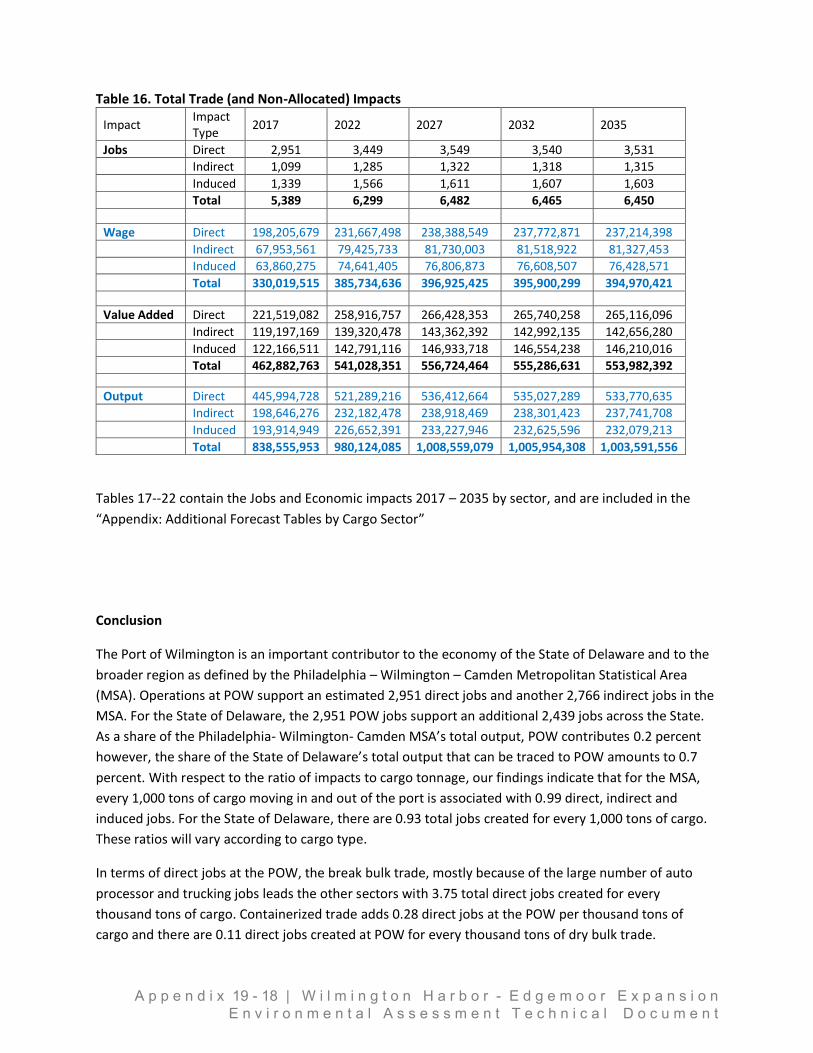
Table 16. Total Trade (and Non-Allocated) Impacts
Impact Impact Type
2017 2022 2027 2032 2035
Jobs Direct 2,951 3,449 3,549 3,540 3,531 Indirect 1,099 1,285 1,322 1,318 1,315 Induced 1,339 1,566 1,611 1,607 1,603 Total 5,389 6,299 6,482 6,465 6,450
Wage Direct 198,205,679 231,667,498 238,388,549 237,772,871 237,214,398 Indirect 67,953,561 79,425,733 81,730,003 81,518,922 81,327,453 Induced 63,860,275 74,641,405 76,806,873 76,608,507 76,428,571 Total 330,019,515 385,734,636 396,925,425 395,900,299 394,970,421
Value Added Direct 221,519,082 258,916,757 266,428,353 265,740,258 265,116,096 Indirect 119,197,169 139,320,478 143,362,392 142,992,135 142,656,280 Induced 122,166,511 142,791,116 146,933,718 146,554,238 146,210,016 Total 462,882,763 541,028,351 556,724,464 555,286,631 553,982,392
Output Direct 445,994,728 521,289,216 536,412,664 535,027,289 533,770,635 Indirect 198,646,276 232,182,478 238,918,469 238,301,423 237,741,708 Induced 193,914,949 226,652,391 233,227,946 232,625,596 232,079,213 Total 838,555,953 980,124,085 1,008,559,079 1,005,954,308 1,003,591,556
Tables 17--22 contain the Jobs and Economic impacts 2017 – 2035 by sector, and are included in the
“Appendix: Additional Forecast Tables by Cargo Sector”
Conclusion
The Port of Wilmington is an important contributor to the economy of the State of Delaware and to the
broader region as defined by the Philadelphia – Wilmington – Camden Metropolitan Statistical Area
(MSA). Operations at POW support an estimated 2,951 direct jobs and another 2,766 indirect jobs in the
MSA. For the State of Delaware, the 2,951 POW jobs support an additional 2,439 jobs across the State.
As a share of the Philadelphia- Wilmington- Camden MSA’s total output, POW contributes 0.2 percent
however, the share of the State of Delaware’s total output that can be traced to POW amounts to 0.7
percent. With respect to the ratio of impacts to cargo tonnage, our findings indicate that for the MSA,
every 1,000 tons of cargo moving in and out of the port is associated with 0.99 direct, indirect and
induced jobs. For the State of Delaware, there are 0.93 total jobs created for every 1,000 tons of cargo.
These ratios will vary according to cargo type.
In terms of direct jobs at the POW, the break bulk trade, mostly because of the large number of auto
processor and trucking jobs leads the other sectors with 3.75 total direct jobs created for every
thousand tons of cargo. Containerized trade adds 0.28 direct jobs at the POW per thousand tons of
cargo and there are 0.11 direct jobs created at POW for every thousand tons of dry bulk trade.
A p p e n d i x 19 - 18 | W i l m i n g t o n H a r b o r - E d g e m o o r E x p a n s i o n E n v i r o n m e n t a l A s s e s s m e n t T e c h n i c a l D o c u m e n t
Wages earned from direct and indirect jobs created by POW operations are higher than the State and
MSA averages while induced jobs pay somewhat less. Overall, however, wages paid to POW-related
workers are higher than average and as such will generate more additional personal income and
therefore tax revenues than the average job in the MSA and in the State of Delaware.
The base case forecast for POW is severely constrained by capacity, and the inability of the DSPC and
State of Delaware to provide significant capital investment as outlined by the 2016 Master Plan. The
forecast herein may be optimistic considering the CAPEX outlined in the Master Plan contained
significant funds to maintain capacity.
(Balance of page blank)
A p p e n d i x 19 - 19 | W i l m i n g t o n H a r b o r - E d g e m o o r E x p a n s i o n E n v i r o n m e n t a l A s s e s s m e n t T e c h n i c a l D o c u m e n t
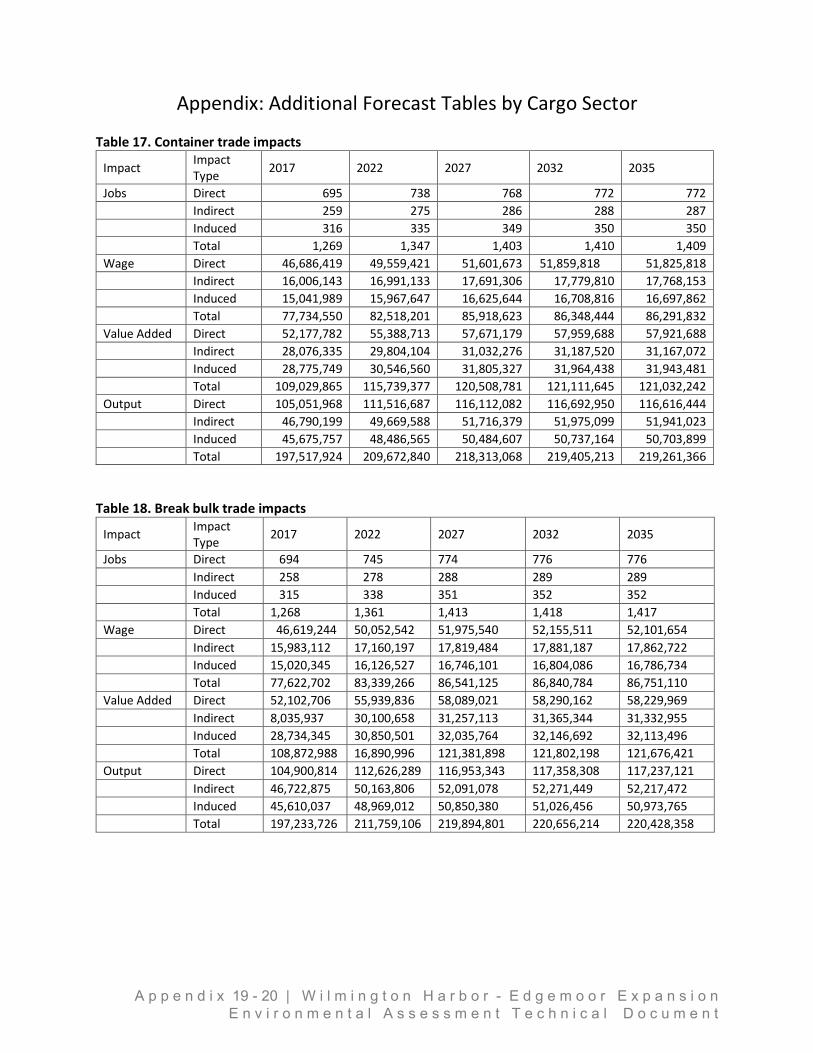
Appendix: Additional Forecast Tables by Cargo Sector
Table 17. Container trade impacts
Impact Impact Type
2017 2022 2027 2032 2035
Jobs Direct 695 738 768 772 772 Indirect 259 275 286 288 287 Induced 316 335 349 350 350 Total 1,269 1,347 1,403 1,410 1,409
Wage Direct 46,686,419 49,559,421 51,601,673 51,859,818 51,825,818 Indirect 16,006,143 16,991,133 17,691,306 17,779,810 17,768,153 Induced 15,041,989 15,967,647 16,625,644 16,708,816 16,697,862 Total 77,734,550 82,518,201 85,918,623 86,348,444 86,291,832
Value Added Direct 52,177,782 55,388,713 57,671,179 57,959,688 57,921,688 Indirect 28,076,335 29,804,104 31,032,276 31,187,520 31,167,072 Induced 28,775,749 30,546,560 31,805,327 31,964,438 31,943,481 Total 109,029,865 115,739,377 120,508,781 121,111,645 121,032,242
Output Direct 105,051,968 111,516,687 116,112,082 116,692,950 116,616,444 Indirect 46,790,199 49,669,588 51,716,379 51,975,099 51,941,023 Induced 45,675,757 48,486,565 50,484,607 50,737,164 50,703,899 Total 197,517,924 209,672,840 218,313,068 219,405,213 219,261,366
Table 18. Break bulk trade impacts
Impact Impact Type
2017 2022 2027 2032 2035
Jobs Direct 694 745 774 776 776 Indirect 258 278 288 289 289 Induced 315 338 351 352 352 Total 1,268 1,361 1,413 1,418 1,417
Wage Direct 46,619,244 50,052,542 51,975,540 52,155,511 52,101,654 Indirect 15,983,112 17,160,197 17,819,484 17,881,187 17,862,722 Induced 15,020,345 16,126,527 16,746,101 16,804,086 16,786,734 Total 77,622,702 83,339,266 86,541,125 86,840,784 86,751,110
Value Added Direct 52,102,706 55,939,836 58,089,021 58,290,162 58,229,969 Indirect 8,035,937 30,100,658 31,257,113 31,365,344 31,332,955 Induced 28,734,345 30,850,501 32,035,764 32,146,692 32,113,496 Total 108,872,988 16,890,996 121,381,898 121,802,198 121,676,421
Output Direct 104,900,814 112,626,289 116,953,343 117,358,308 117,237,121 Indirect 46,722,875 50,163,806 52,091,078 52,271,449 52,217,472 Induced 45,610,037 48,969,012 50,850,380 51,026,456 50,973,765 Total 197,233,726 211,759,106 219,894,801 220,656,214 220,428,358
A p p e n d i x 19 - 20 | W i l m i n g t o n H a r b o r - E d g e m o o r E x p a n s i o n E n v i r o n m e n t a l A s s e s s m e n t T e c h n i c a l D o c u m e n t
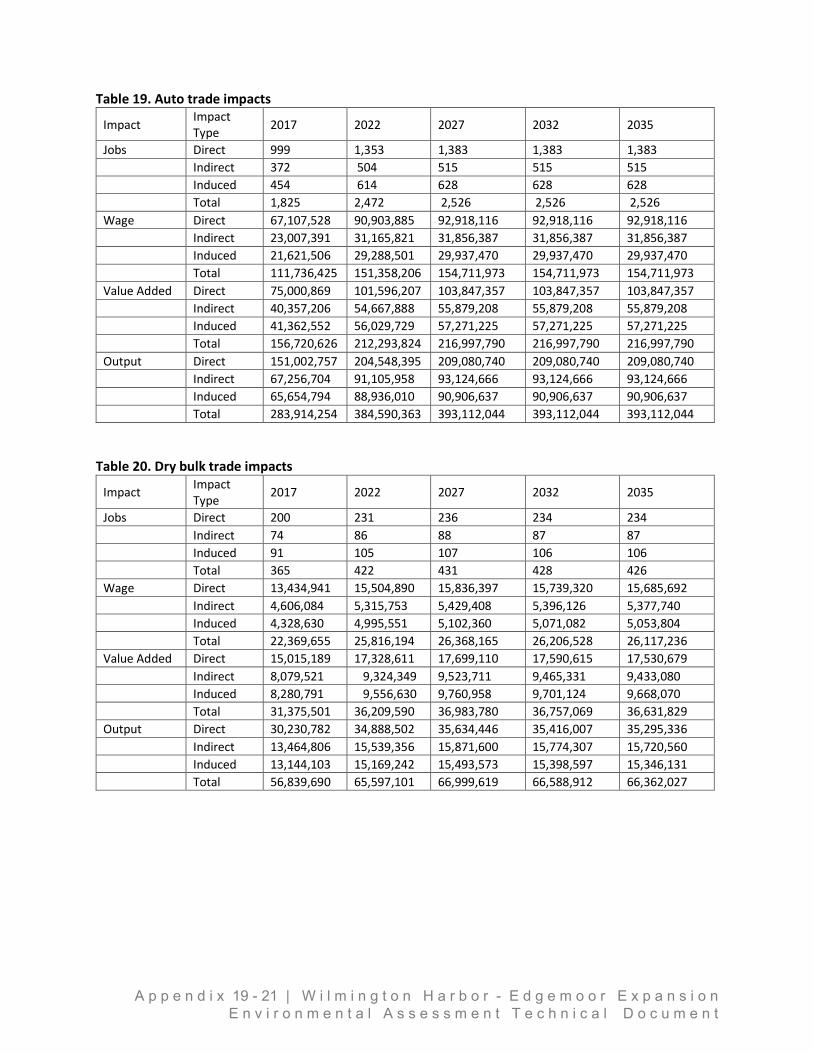
Table 19. Auto trade impacts
Impact Impact Type
2017 2022 2027 2032 2035
Jobs Direct 999 1,353 1,383 1,383 1,383 Indirect 372 504 515 515 515 Induced 454 614 628 628 628 Total 1,825 2,472 2,526 2,526 2,526
Wage Direct 67,107,528 90,903,885 92,918,116 92,918,116 92,918,116 Indirect 23,007,391 31,165,821 31,856,387 31,856,387 31,856,387 Induced 21,621,506 29,288,501 29,937,470 29,937,470 29,937,470 Total 111,736,425 151,358,206 154,711,973 154,711,973 154,711,973
Value Added Direct 75,000,869 101,596,207 103,847,357 103,847,357 103,847,357 Indirect 40,357,206 54,667,888 55,879,208 55,879,208 55,879,208 Induced 41,362,552 56,029,729 57,271,225 57,271,225 57,271,225 Total 156,720,626 212,293,824 216,997,790 216,997,790 216,997,790
Output Direct 151,002,757 204,548,395 209,080,740 209,080,740 209,080,740 Indirect 67,256,704 91,105,958 93,124,666 93,124,666 93,124,666 Induced 65,654,794 88,936,010 90,906,637 90,906,637 90,906,637 Total 283,914,254 384,590,363 393,112,044 393,112,044 393,112,044
Table 20. Dry bulk trade impacts
Impact Impact Type
2017 2022 2027 2032 2035
Jobs Direct 200 231 236 234 234 Indirect 74 86 88 87 87 Induced 91 105 107 106 106 Total 365 422 431 428 426
Wage Direct 13,434,941 15,504,890 15,836,397 15,739,320 15,685,692 Indirect 4,606,084 5,315,753 5,429,408 5,396,126 5,377,740 Induced 4,328,630 4,995,551 5,102,360 5,071,082 5,053,804 Total 22,369,655 25,816,194 26,368,165 26,206,528 26,117,236
Value Added Direct 15,015,189 17,328,611 17,699,110 17,590,615 17,530,679 Indirect 8,079,521 9,324,349 9,523,711 9,465,331 9,433,080 Induced 8,280,791 9,556,630 9,760,958 9,701,124 9,668,070 Total 31,375,501 36,209,590 36,983,780 36,757,069 36,631,829
Output Direct 30,230,782 34,888,502 35,634,446 35,416,007 35,295,336 Indirect 13,464,806 15,539,356 15,871,600 15,774,307 15,720,560 Induced 13,144,103 15,169,242 15,493,573 15,398,597 15,346,131 Total 56,839,690 65,597,101 66,999,619 66,588,912 66,362,027
A p p e n d i x 19 - 21 | W i l m i n g t o n H a r b o r - E d g e m o o r E x p a n s i o n E n v i r o n m e n t a l A s s e s s m e n t T e c h n i c a l D o c u m e n t
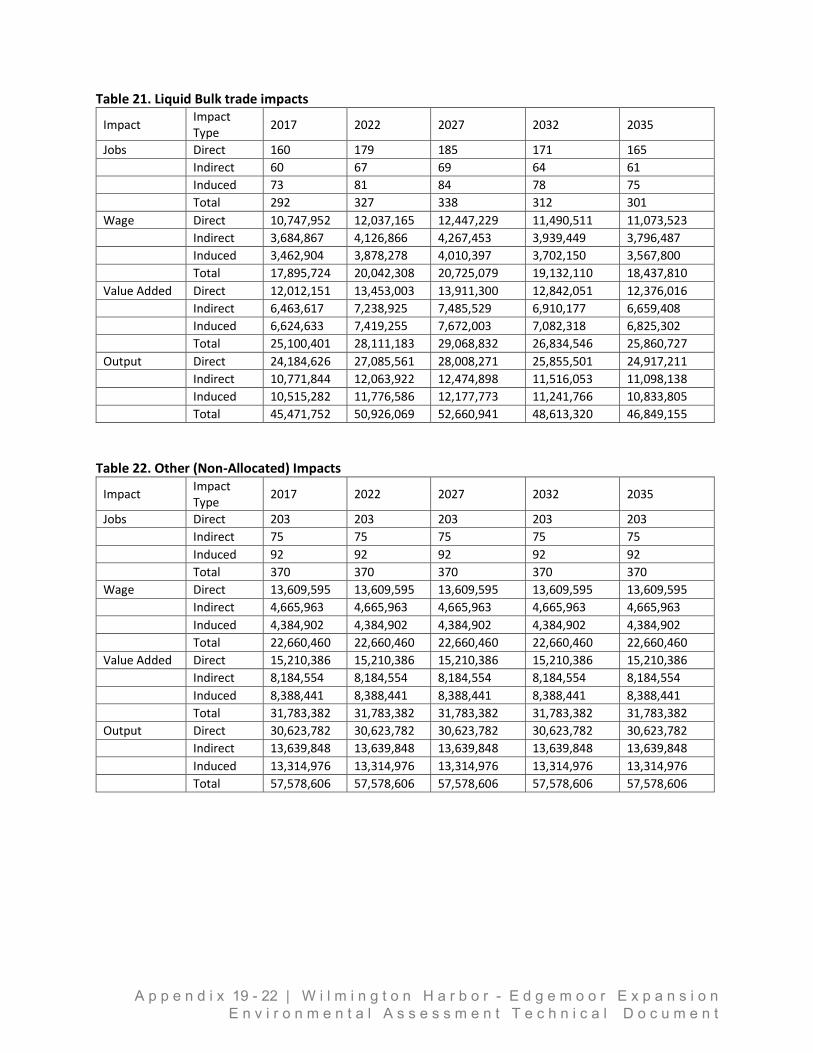
Table 21. Liquid Bulk trade impacts
Impact Impact Type
2017 2022 2027 2032 2035
Jobs Direct 160 179 185 171 165 Indirect 60 67 69 64 61 Induced 73 81 84 78 75 Total 292 327 338 312 301
Wage Direct 10,747,952 12,037,165 12,447,229 11,490,511 11,073,523 Indirect 3,684,867 4,126,866 4,267,453 3,939,449 3,796,487 Induced 3,462,904 3,878,278 4,010,397 3,702,150 3,567,800 Total 17,895,724 20,042,308 20,725,079 19,132,110 18,437,810
Value Added Direct 12,012,151 13,453,003 13,911,300 12,842,051 12,376,016 Indirect 6,463,617 7,238,925 7,485,529 6,910,177 6,659,408 Induced 6,624,633 7,419,255 7,672,003 7,082,318 6,825,302 Total 25,100,401 28,111,183 29,068,832 26,834,546 25,860,727
Output Direct 24,184,626 27,085,561 28,008,271 25,855,501 24,917,211 Indirect 10,771,844 12,063,922 12,474,898 11,516,053 11,098,138 Induced 10,515,282 11,776,586 12,177,773 11,241,766 10,833,805 Total 45,471,752 50,926,069 52,660,941 48,613,320 46,849,155
Table 22. Other (Non-Allocated) Impacts
Impact Impact Type
2017 2022 2027 2032 2035
Jobs Direct 203 203 203 203 203 Indirect 75 75 75 75 75 Induced 92 92 92 92 92 Total 370 370 370 370 370
Wage Direct 13,609,595 13,609,595 13,609,595 13,609,595 13,609,595 Indirect 4,665,963 4,665,963 4,665,963 4,665,963 4,665,963 Induced 4,384,902 4,384,902 4,384,902 4,384,902 4,384,902 Total 22,660,460 22,660,460 22,660,460 22,660,460 22,660,460
Value Added Direct 15,210,386 15,210,386 15,210,386 15,210,386 15,210,386 Indirect 8,184,554 8,184,554 8,184,554 8,184,554 8,184,554 Induced 8,388,441 8,388,441 8,388,441 8,388,441 8,388,441 Total 31,783,382 31,783,382 31,783,382 31,783,382 31,783,382
Output Direct 30,623,782 30,623,782 30,623,782 30,623,782 30,623,782 Indirect 13,639,848 13,639,848 13,639,848 13,639,848 13,639,848 Induced 13,314,976 13,314,976 13,314,976 13,314,976 13,314,976 Total 57,578,606 57,578,606 57,578,606 57,578,606 57,578,606
A p p e n d i x 19 - 22 | W i l m i n g t o n H a r b o r - E d g e m o o r E x p a n s i o n E n v i r o n m e n t a l A s s e s s m e n t T e c h n i c a l D o c u m e n t