Embed Size (px)
Citation preview

2010 - 2011 - 2012
PORT STATISTICS

2012 2011 2010Agribulk 8.1 9.9 8.4Iron ore and scrap 32.7 37.4 39.9Coal 25.3 26.7 24.1Other dry bulk 12.0 13.3 12.3Subtotal dry bulk 78.1 87.3 84.6Crude oil 98.3 92.8 100.2Mineral oil products 81.8 73.4 77.6LNG 0.6 0.6 0.0Other liquid bulk 33.5 31.7 31.6Subtotal liquid bulk 214.2 198.5 209.0
Total bulk goods 292.3 285.9 294.1
Containers 125.4 123.6 112.3
Roll-on/Roll-off 17.9 17.5 17.0Other general cargo 5.9 7.7 6.9Total breakbulk 23.8 25.1 23.8Total throughput 441.5 434.6 430.2
Incoming Outgoing TotalAgribulk 7.0 1.0 8.1Iron ore and scrap 30.6 2.2 32.7Coal 24.8 0.5 25.3Other dry bulk 10.0 2.0 12.0Subtotal dry bulk 72.4 5.7 78.1Crude oil 98.2 0.1 98.3Mineral oil products 45.0 36.8 81.8LNG 0.6 0.0 0.6Other liquid bulk 20.6 12.9 33.5Subtotal liquid bulk 164.4 49.8 214.2
Total bulk goods 236.8 55.5 292.3
Containers 60.7 64.7 125.4
Roll-on/Roll-off 8.7 9.2 17.9Other general cargo 3.9 1.9 5.9Total breakbulk 12.6 11.1 23.8Total throughput 310.1 131.4 441.5
Incoming and outgoing by commodity, 2012
Source : PoR
Source : PoR
Unit : Gross weight x 1 million metric tons
Unit : Gross weight x 1 million metric tons
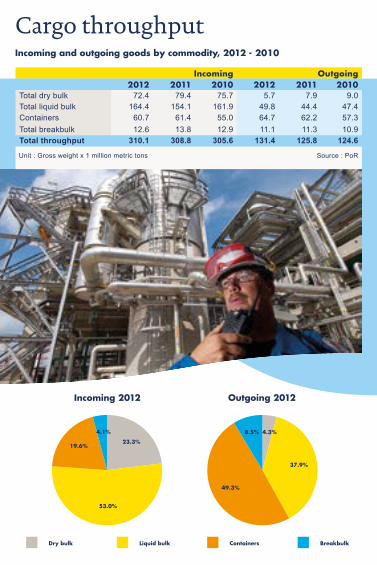
Cargo throughputTotal throughput by commodity, 2012 - 2010

2012
Agribulk 6.2 1.1 0.0 6.9 8.1 0.9 1.1 2.2 0.1 1.1 0.0Iron ore and scrap 9.2 4.3 0.0 8.6 32.7 0.7 2.7 3.3 0.0 12.1 0.0Coal 5.2 1.8 1.6 18.9 25.3 4.8 5.7 2.9 0.0 8.2 1.0Other dry bulk 4.8 1.8 1.7 7.5 12.0 5.6 9.5 8.5 1.5 3.1 1.7Subtotal dry bulk 25.3 9.0 3.3 41.9 78.1 11.9 19.1 16.8 1.6 24.4 2.6Crude oil 4.4 0.0 21.4 0.0 98.3 0.0 2.6 0.0 0.0 0.0 22.5Mineral oil products 6.9 1.4 1.0 41.2 81.8 9.2 32.0 1.1 3.2 5.5 12.6LNG 0.0 0.0 0.0 0.0 0.6 0.0 0.0 0.0 4.2 0.0 0.0Other liquid bulk 2.8 0.0 0.4 2.1 33.5 2.8 10.7 2.9 0.3 1.3 1.6Subtotal liquid bulk 14.1 1.4 22.8 43.2 214.2 12.0 45.3 4.0 7.7 6.9 36.7Total bulk 39.4 10.4 26.1 85.2 292.3 23.9 64.4 20.8 9.3 31.3 39.3
Containers 89.4 65.2 0.0 0.8 125.4 0.2 104.1 0.6 20.3 2.4 22.7
Roll-on/roll-off 0.0 0.0 0.0 0.6 17.9 1.5 4.8 1.7 12.5 13.1 0.0Other general cargo 2.1 8.4 0.0 7.6 5.9 8.3 10.9 3.2 1.4 0.9 1.4Total breakbulk 2.1 8.4 0.0 8.2 23.8 9.8 15.7 4.9 13.9 14.0 1.4
Total 130.9 84.0 26.2 94.3 441.5 34.0 184.1 26.3 43.5 47.6 63.5Market share in % 11.1 7.1 2.2 8.0 37.5 2.9 15.7 2.2 3.7 4.1 5.4
Source : Port Authorities
Unit : Gross weight x 1 million metric tonsHamburg, Bremen and Le Havre: other general cargo including roll-on/roll-off; Zeebrugge: including bunker materials; *) Zeeland Seaports breakdown of goods estimated
Total throughput by commodity in the Hamburg - Le Havre range, 2012
Dry bulk Liquid bulk Containers Breakbulk
DunkirkAntwerp Zeebrugge
Zeeland Seaports
Others
Amsterdam Rotterdam
Wilhelmshaven
Le Havre
Hamburg Bremerhaven
WILH
ELM
SHAV
EN
BREM
ERHA
VEN
HAM
BURG
ANTW
ERP
ZEEL
AND
SEAP
.*)
AMST
ERDA
M
DUN
KIRK
ZEEB
RUG
GE
GHE
NT
LE H
AVRE
ROTT
ERDA
M
Cargo throughput
,
4.1%
19.6%
53.0%
23.3%
8.5%
49.3%
37.9%
4.3%
Incoming 2012 Outgoing 2012
Containers BreakbulkDry bulk Liquid bulk
Incoming Outgoing2012 2011 2010 2012 2011 2010
Total dry bulk 72.4 79.4 75.7 5.7 7.9 9.0Total liquid bulk 164.4 154.1 161.9 49.8 44.4 47.4Containers 60.7 61.4 55.0 64.7 62.2 57.3Total breakbulk 12.6 13.8 12.9 11.1 11.3 10.9Total throughput 310.1 308.8 305.6 131.4 125.8 124.6
Source : PoRUnit : Gross weight x 1 million metric tons
Incoming and outgoing goods by commodity, 2012 - 2010
Cargo throughput

Incoming Outgoing Total2011 2010 2011 2010 2011 2010
Europe 140,875 142,732 62,211 68,171 203,086 210,903Africa 31,225 32,011 7,004 7,016 38,229 39,027America 73,452 70,959 15,422 13,739 88,874 84,699Asia 55,891 53,143 40,771 35,239 96,662 88,382Oceania 7,322 6,732 366 383 7,688 7,115Not specified 0 0 13 33 13 33Total 308,765 305,578 125,787 124,581 434,552 430,159
2.4%
18.1%
23.8%
10.1%
45.6%
Incoming 2011 Outgoing 2011
0.3%
32.4%
12.3%5.6%
49.5%
America AsiaEurope Africa Oceania
Source : CBSUnit : Gross weight x 1,000 metric tons
Incoming and outgoing goods, grouped by continent, 2011 - 2010
Cargo throughput

2012 2011 2010Rotterdam Netherlands 441.5 434.6 430.2Antwerp Belgium 184.1 187.2 178.2Hamburg Germany 130.9 132.2 121.2Novorossiysk 1) Russia 117.4 116.2 117.1Amsterdam Netherlands 94.3 93.0 90.8Marseilles France 85.6 88.1 86.0Bremerhaven Germany 84.0 80.6 68.7Algeciras Spain 83.0 76.9 65.7Primorsk Russia 74.8 75.1 77.6Valencia Spain 65.7 65.8 63.7Le Havre France 63.5 67.6 70.2Grimsby/Immingham 2) United Kingdom 60.1 57.2 54.0St. Petersburg Russia 57.8 60.0 58.0Constantza Romania 50.6 46.0 47.5Genoa Italy 50.2 50.4 50.7Trieste Italy 49.2 48.2 47.6Dunkirk France 47.6 47.5 42.7London United Kingdom 43.7 48.8 48.1Zeebrugge Belgium 43.5 47.0 49.6Gothenburg Sweden 41.7 41.3 44.3
Source : Port Authorities
Unit : Gross weight x 1 million metric tons1) Including Caspian pipeline Consortium Marine Terminal2) 2012 Provisional figures (Department of Transport)
Top 20 European ports, 2012 - 2010
European ports

European ports

2012 2011 2010Ningbo & Zhoushan 1) China 744.0 691.0 627.0Shanghai 2) China 736.0 727.6 653.0Singapore Singapore 538.0 531.2 503.3Tianjin China 476.0 451.0 408.0Rotterdam Netherlands 441.5 434.6 430.2Guangzhou China 434.0 429.0 400.0Qingdao China 402.0 375.0 350.1Dalian China 373.0 338.0 300.8Tangshan China 364.6 308.0 250.6Yingkou China 301.1 261.0 225.0Busan 3) South Korea 298.7 269.9 241.1Rizhao China 281.0 252.6 221.0Qinhuangdao China 271.5 287.0 257.0Hongkong 4) China 269.3 277.4 267.8Port Hedland Australia 260.1 197.7 177.5Shenzhen China 228.1 223.0 221.0Port Klang Maleisie 197.9 194.2 171.0Los Angeles United States of America 193.1 203.9 204.8Antwerp Belgium 184.1 187.2 178.2Xiamen China 172.0 156.5 139.3
Source : Port Authorities
Unit : Gross weight x 1 million metric tons; 1) Ports combined in 2006; 2) Including domestic trade and river trade; 3) Converted from freight ton to metric ton; 4) Including river trade;China ports figures for 2012 are provisional
Top 20 World ports, 2012 - 2010
World ports

World ports
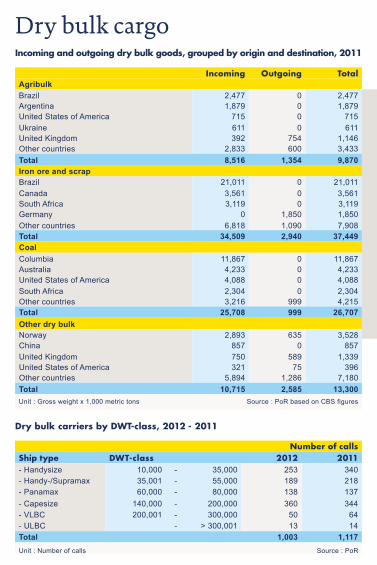
Number of callsShip type DWT-class 2012 2011- Handysize 10,000 - 35,000 253 340- Handy-/Supramax 35,001 - 55,000 189 218- Panamax 60,000 - 80,000 138 137- Capesize 140,000 - 200,000 360 344- VLBC 200,001 - 300,000 50 64- ULBC - > 300,001 13 14Total 1,003 1,117
Incoming Outgoing TotalAgribulkBrazil 2,477 0 2,477Argentina 1,879 0 1,879United States of America 715 0 715Ukraine 611 0 611United Kingdom 392 754 1,146Other countries 2,833 600 3,433Total 8,516 1,354 9,870Iron ore and scrapBrazil 21,011 0 21,011Canada 3,561 0 3,561South Africa 3,119 0 3,119Germany 0 1,850 1,850Other countries 6,818 1,090 7,908Total 34,509 2,940 37,449CoalColumbia 11,867 0 11,867Australia 4,233 0 4,233United States of America 4,088 0 4,088South Africa 2,304 0 2,304Other countries 3,216 999 4,215Total 25,708 999 26,707Other dry bulkNorway 2,893 635 3,528China 857 0 857United Kingdom 750 589 1,339United States of America 321 75 396Other countries 5,894 1,286 7,180Total 10,715 2,585 13,300
Source : PoR based on CBS figures
Source : PoR
Unit : Gross weight x 1,000 metric tons
Unit : Number of calls
Dry bulk cargoIncoming and outgoing dry bulk goods, grouped by origin and destination, 2011
Dry bulk carriers by DWT-class, 2012 - 2011

Ship type Number of callsOil/product tankers DWT-class 2012 2011- Tankers - < 60,000 1,208 1,109- Panamax 60,000 - 80,000 158 142- Aframax 80,001 - 120,000 739 692- Suezmax 120,001 - 200,000 258 195- VLCC 200,001 - 320,000 126 121- ULCC - > 320,001 3 8Total 2,492 2,267
Incoming Outgoing TotalCrude oilRussia 25,619 0 25,619Saudi Arabia/Egypt 14,715 0 14,715United Kingdom 12,527 0 12,527
Norway 11,450 0 11,450Other countries 27,778 719 28,497Total 92,089 719 92,808Mineral oil productsRussia and Baltic 20,631 101 20,732United Kingdom 3,495 3,141 6,636United States of America 2,869 2,826 5,695Singapore 667 9,409 10,076Other countries 13,983 16,326 30,309Total 41,645 31,803 73,448Other liquid bulkUnited Kingdom 2,095 1,885 3,980United States of America 1,387 1,580 2,967Malaysia 1,346 56 1,402Indonesia 1,161 3 1,164Other countries 13,803 8,385 22,188Total 19,792 11,909 31,701
Source : PoR
Source : PoR based on CBS figures
Unit : Number of calls
Unit : Gross weight x 1,000 metric tons
Incoming and outgoing liquid bulk goods, grouped by origin and destination, 2011
Liquid bulk ships by DWT-class, 2012 - 2011
Liquid bulk cargo
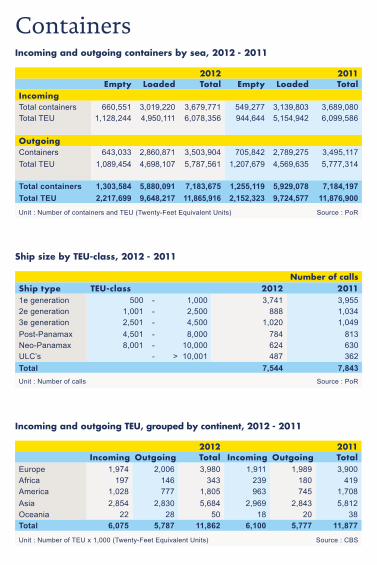
2012 2011Empty Loaded Total Empty Loaded Total
IncomingTotal containers 660,551 3,019,220 3,679,771 549,277 3,139,803 3,689,080Total TEU 1,128,244 4,950,111 6,078,356 944,644 5,154,942 6,099,586
OutgoingContainers 643,033 2,860,871 3,503,904 705,842 2,789,275 3,495,117Total TEU 1,089,454 4,698,107 5,787,561 1,207,679 4,569,635 5,777,314
Total containers 1,303,584 5,880,091 7,183,675 1,255,119 5,929,078 7,184,197Total TEU 2,217,699 9,648,217 11,865,916 2,152,323 9,724,577 11,876,900
2012 2011Incoming Outgoing Total Incoming Outgoing Total
Europe 1,974 2,006 3,980 1,911 1,989 3,900Africa 197 146 343 239 180 419America 1,028 777 1,805 963 745 1,708Asia 2,854 2,830 5,684 2,969 2,843 5,812Oceania 22 28 50 18 20 38Total 6,075 5,787 11,862 6,100 5,777 11,877
Number of callsShip type TEU-class 2012 20111e generation 500 - 1,000 3,741 3,9552e generation 1,001 - 2,500 888 1,0343e generation 2,501 - 4,500 1,020 1,049Post-Panamax 4,501 - 8,000 784 813Neo-Panamax 8,001 - 10,000 624 630ULC’s - > 10,001 487 362Total 7,544 7,843
Source : PoR
Source : PoR
Source : CBS
Unit : Number of containers and TEU (Twenty-Feet Equivalent Units)
Unit : Number of calls
Unit : Number of TEU x 1,000 (Twenty-Feet Equivalent Units)
ContainersIncoming and outgoing containers by sea, 2012 - 2011
Ship size by TEU-class, 2012 - 2011
Incoming and outgoing TEU, grouped by continent, 2012 - 2011
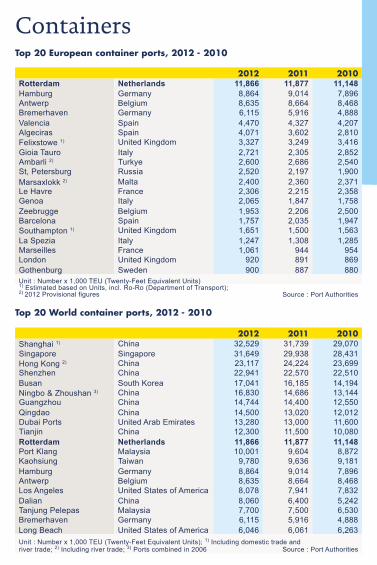
2012 2011 2010Rotterdam Netherlands 11,866 11,877 11,148Hamburg Germany 8,864 9,014 7,896Antwerp Belgium 8,635 8,664 8,468Bremerhaven Germany 6,115 5,916 4,888Valencia Spain 4,470 4,327 4,207Algeciras Spain 4,071 3,602 2,810Felixstowe 1) United Kingdom 3,327 3,249 3,416Gioia Tauro Italy 2,721 2,305 2,852Ambarli 2) Turkye 2,600 2,686 2,540St, Petersburg Russia 2,520 2,197 1,900Marsaxlokk 2) Malta 2,400 2,360 2,371Le Havre France 2,306 2,215 2,358Genoa Italy 2,065 1,847 1,758Zeebrugge Belgium 1,953 2,206 2,500Barcelona Spain 1,757 2,035 1,947Southampton 1) United Kingdom 1,651 1,500 1,563La Spezia Italy 1,247 1,308 1,285Marseilles France 1,061 944 954London United Kingdom 920 891 869Gothenburg Sweden 900 887 880
Top 20 World container ports, 2012 - 2010
2012 2011 2010Shanghai 1) China 32,529 31,739 29,070Singapore Singapore 31,649 29,938 28,431Hong Kong 2) China 23,117 24,224 23,699Shenzhen China 22,941 22,570 22,510Busan South Korea 17,041 16,185 14,194Ningbo & Zhoushan 3) China 16,830 14,686 13,144Guangzhou China 14,744 14,400 12,550Qingdao China 14,500 13,020 12,012Dubai Ports United Arab Emirates 13,280 13,000 11,600Tianjin China 12,300 11,500 10,080Rotterdam Netherlands 11,866 11,877 11,148Port Klang Malaysia 10,001 9,604 8,872Kaohsiung Taiwan 9,780 9,636 9,181Hamburg Germany 8,864 9,014 7,896Antwerp Belgium 8,635 8,664 8,468Los Angeles United States of America 8,078 7,941 7,832Dalian China 8,060 6,400 5,242Tanjung Pelepas Malaysia 7,700 7,500 6,530Bremerhaven Germany 6,115 5,916 4,888Long Beach United States of America 6,046 6,061 6,263
Source : Port Authorities
Source : Port Authorities
Unit : Number x 1,000 TEU (Twenty-Feet Equivalent Units)1) Estimated based on Units, incl. Ro-Ro (Department of Transport); 2) 2012 Provisional figures
Unit : Number x 1,000 TEU (Twenty-Feet Equivalent Units); 1) Including domestic trade and river trade; 2) Including river trade; 3) Ports combined in 2006
ContainersTop 20 European container ports, 2012 - 2010


2012 2011 2010St. Petersburg Russia 14,052 13,964 11,823Novorossiysk Russia 11,078 9,586 10,294Antwerp Belgium 10,895 12,696 11,129Zeeland Seaports Netherlands 8,330 7,793 7,352Rotterdam Netherlands 5,865 7,693 6,875
2012 2011 2010Calais France 33,662 37,864 37,791Dover 1) United Kingdom 25,000 24,250 23,771Rotterdam Netherlands 17,919 17,450 16,968Dunkirk France 13,076 11,825 11,195Zeebrugge Belgium 12,549 13,130 12,396
Number of calls2012 2011
Car carriers 97 90Roll-on/Roll-off ships 1,715 1,836General cargo ships 7,711 8,322Ropax ships 365 362Total 9,888 10,610
Source : Port Authorities
Source : Port Authorities
Source : PoR
Unit : Gross weight x 1,000 metric tons
Unit : Gross weight x 1,000 metric tons; 1) 2012 Provisional figures
Unit : Number of calls
Top 5 general cargo in Europe, 2012 - 2010
Top 5 Roll-on/Roll-off ports in Europe, 2012 - 2010
Breakbulk and Roll-on/Roll-off ships, 2012 - 2011
Breakbulk and Roll-on/Roll-off

Sector Added value Employment
2011 2010 2009 2011 2010 2009Nodes 6,614 6,388 6,331 57,893 57,211 58,214Transport mode 2,448 2,442 2,580 37,057 36,871 37,629- Navigation 352 373 447 3,763 3,751 3,860- Inland navigation 355 332 396 6,753 6,443 6,074- Road transport 1,537 1,531 1,545 25,146 25,179 26,371- Rail transport 82 88 75 1,345 1,448 1,272- Pipeline transport 122 118 118 51 51 51Services for transport 1,787 1,673 1,511 11,833 11,449 11,241Handling and storage 2,378 2,273 2,239 9,003 8,891 9,345
BusiNess locatioN 6,443 5,901 5,174 30,756 30,485 31,277Industry 5,202 4,725 4,040 18,937 18,930 19,358- Foodstuff 306 297 306 2,480 2,521 2,630- Petroleum 1,516 1,181 1,128 3,449 3,432 3,409- Chemicals 2,293 2,108 1,452 4,471 4,462 4,545- Metals 266 265 266 2,874 2,937 3,163- Vehicles 98 90 90 1,740 1,703 1,710- Production of electricity 553 632 654 2,097 2,065 1,967- Other 170 153 144 1,827 1,812 1,935
Wholesale 706 661 602 7,073 7,012 7,142Public and non-private services 535 514 532 4,746 4,543 4,778
Total 13,057 12,289 11,506 88,649 87,696 89,491Source : Erasmus University RotterdamUnit : Value in € x 1 million; number of employees
Added value/EmploymentDirect Seaport related added value and employment per sector in Rotterdam - Rijnmond, 2011 - 2009

Unrestricted accessibility 24 hours a day, 7 days a weekTotal port area, including Maasvlakte 2 12,426 haLand area 7,692 haOf which rentable sites 5,922 haWater area 4,734 haTotal length Rotterdams port area 42 kmWater depth N.A.P. (max.) 24 mDepth Eurogeul in the North Sea N.A.P. (max.) 25 mLength Eurogeul in the North Sea 57 kmPipelines 1,500 kmBanks (sloops) 155 kmQuay length 65 kmSea jetties 17Buoys 39Dolphins 20Pontoons 90Jetties 85Sites/TerminalsOil and oil productsOil refineries 5Refinery terminals 6Independent tank terminals for oil products 11Chemicals, biofuels and edible oilsChemical locations 45Biofuels plants 6Vegetable oils refineries 5Independent tank terminals for chemie, biofuels and edible oils 17Gas and power, coal and biomassGas fired power plants 4Coal and biomass fired plants 1Natural gas terminals 1Wind turbines (total 126 Mw) 68UtilitiesIndustrial gases and water plants 4Steam and power plants 6Waste processing 1Container terminalsDeepsea 5Shortsea 3Empty depots 16Breakbulk terminalsRoll-on/Roll-off 6Other general cargo 18Dry bulk terminalsAgribulk, ores and scrap, coal, biomass and other dry bulk 15Tank storage Capacity: (1 million m3)Crude oil 13.3Mineral oil products 13.4Chemical products 2.7Vegetable oils and fats 1.2
Source : PoRUnit : Number
Port infrastructure, 2012

2.7%
41.2%
28.9%
49.2%
7.0%
16.9%
38.6%
31.5%
12.9%
0.1%
Number of calls 2012 Throughput 2012
10,001 - 50,000 50,001 - 100,000GT-class: 0 - 1,500 1,501 - 10,000 100,001 - 180,000
2012 2011Number of sea-going vessels 1) 32,057 33,681- unloaded and/or loaded 31,789 32,738- cruise ships 28 28- chemical ships 6,183 6,170- other ships 240 915Ship movements of sea-going vessels 79,487 83,643Inland vessels 2) 87,000 95,780
2012 2011GT-class Number Throughput Number Throughput
0 - 1,500 2,211 640 2,147 8821,501 - 10,000 15,648 56,945 16,761 61,295
10,001 - 50,000 9,201 139,089 9,269 133,48150,001 - 100,000 13,083 170,357 13,076 168,611
100,001 - 180,000 847 74,496 754 70,281Total 31,789 441,527 32,738 434,550
Source : PoR
Source : PoR
Unit : Number of vessels1) Refers to the number of ships visiting the port of Rotterdam, including transhipment and repair, a.o.; 2) 2012 Provisional figures
Unit : Number of calls and throughput x 1,000 metric tons
VesselsShip arrivals, 2012 - 2011
Number of sea-going vessels unloaded and/or loaded at the port of Rotterdam, 2012 - 2011
Diff
eren
ces
due
to ro
undi
ng o
ff ar
e po
ssib
le. T
he P
ort o
f Rot
terd
am A
utho
rity
does
not
acc
ept a
ny re
spon
sibi
lity
for a
ny e
rrors
that
mig
ht o
ccur
in th
is p
ublic
atio
n.

Diff
eren
ces
due
to ro
undi
ng o
ff ar
e po
ssib
le. T
he P
ort o
f Rot
terd
am A
utho
rity
does
not
acc
ept a
ny re
spon
sibi
lity
for a
ny e
rrors
that
mig
ht o
ccur
in th
is p
ublic
atio
n.
Published byPort of Rotterdam AuthorityP.O. Box 66223002 AP Rotterdam
The Netherlands
T +31 (0)10 252 10 10
F +31 (0)10 252 10 20
E
I
Contents and design
Port of Rotterdam Authority
Images
Aeroview Rotterdam
Eric Bakker (Rotterdam)
Freek van Arkel (Rotterdam)
Port of Rotterdam Authority
Printing
platform P (May 2013)
Port of rotterdAM Authority
The aim of the Port of Rotterdam Authority is to enhance the port of Rotterdam’s
competitive position as a logistics hub and world-class industrial complex. Not only
in terms of size, but also quality. The core tasks of the Port Authority are to develop,
manage and run the port in a sustainable way and to maintain a speedy and safe
service for shipping.
Facts and figures for the Port Authority and the port of Rotterdam:
Port Authority: 1,200 employees, turnover approx. € 600 million.
Direct employment: over 87,000 jobs.
For further information refer to our website:
www.portofrotterdam.com
www.portofrotterdam.com