Embed Size (px)
Citation preview

Portfolio optimization with robust possibilistic
programming
Maghsoud Amiri* *Corresponding author, Prof., Faculty of Management and Accounting, Allameh
Tabataba'i University, Tehran, Iran. (Email: [email protected])
Mohammad Saeed Heidary Ph.D. Candidate, Department of Financial Management, Faculty of Management and
Accounting, Allameh Tabataba'i University, Tehran, Iran. (Email:
Abstract
one of the most important financial and investment issues is Portfolio selection, that seeks to allocate a predetermined capital (wealth) over one or multiple periods between assets and stocks in such a way that the wealth of investor (portfolio owner) is maximized and, Simultaneously, its risk minimized. In the paper, we first propose a mathematical programming model for Portfolio selection to maximize the minimum amount of Sharpe ratios of the portfolio in all periods (max-min problem). Then, due to the uncertain property of the input parameters of such a problem, a robust possibilistic programming model (based on necessity theory) has been developed, which is capable of adjusting the robust degree of output decisions to the uncertainty of the parameters. The proposed model was tested on 27 companies active in the Tehran stock market. In the end, the results of the model demonstrated the good performance of the robust possibilistic programming model.
Keywords: Portfolio Optimization, Sharpe ratio, Robust Possibilistic Programming.
DOI: 10.22034/ijf.2020.195328.1046 © Iran Finance Association

45
Portfolio optimization with robust possibilistic programming
Introduction
Portfolio formation and diversification of assets are among the most
fundamental strategies for reducing and controlling investment risks. A good
Portfolio selection with high returns and low risk is demanded by all investors.
Hence, there are many models for Portfolio selection and many efforts have
been made to improve these models. In fact, Portfolio selection of assets is one
of the most important issues in the field of investment management.
Several optimization methods have been developed following
Markowitz's innovation and his minimum risk model. These methods have
tried to generate the highest quality portfolios in terms of risk and return, by
adding more metrics in the target function and intelligent constraints. In recent
years, in addition to optimization of risk and return of the portfolio, the
discussion of the sustainability of results and the need for a gradual change in
the weight of assets in the investment portfolio has been raised, given the
existence of an uncertainty factor in the level of risk and return of financial
assets. Also, using stochastic, fuzzy logic and robustification approaches,
attempts have been made to optimize the level of uncertainty in addition to
achieving the optimal combination of risk and return. Therefore, simultaneous
risk and return play a vital role in the investment portfolio, so in designing each
model for optimization, it is necessary to consider return and risk maximization
in the target function simultaneously. This can be done in the form of a Multi-
objectives function or by targeting a measurement in a function that is a
combination of risks and returns and to target the measurement
maximization/minimization. One approach is using Sharpe; that is, a
measurement having risk and return at the same time. Therefore, the Sharpe
statistics/ratio was selected.
: Portfolio return
: Risk-free rate of return
: Portfolio Standard deviation (risk measurement)
In addition to being considered as an appropriate ratio for assessing the
relative performance of financial assets, the Sharpe ratio (Sharpe,1963)
maximization in the optimization portfolio model is equivalent to minimizing
the risk of falling investment returns below a certain limit (Roy's Safety-First)
in the most conservative mode; that is, when the form of the distribution

46
Iranian Journal of Finance, 2019, Vol. 3, No. 2
function is not known and it is necessary to use Chebyshev inequality, even the
worst types of distributions (distributions with negative skewness, etc.) also
apply to the model, and has injected robustification to the model in practice.
In another aspect, due to the competitive and risky space in the stock
market, decision-making is often faced with a lack of information or uncertain
information; therefore, the model programming should take this into account.
Robust optimization is presented in recent years to deal with uncertainty, in
which the optimization is addressed when the worst happens. The Robust
approach was proposed to solve optimization problems with data uncertainty
and has recently been widely explored and developed. The main advantages of
this approach are as follows (Alem, Morabito, 2012):
1. Robust optimization is easier than the probabilistic approach in terms of
solving the model.
2. There is no need for a clear knowledge of the possibilistic distribution of
data with uncertainty.
In the subject matter discussed in this paper, due to the incompleteness
and unavailability of information, we face uncertainty in data that is of a kind
of epistemic uncertainty (Asadujjaman, 2019), therefore, robust possibilistic
programming has been used to model the problem. It is superior to possibilistic
programming for the following reasons:
1. In robust optimization, the confidence level of constraint satisfaction is
determined by the model itself and its value is optimal,
2. In robust optimization, the final answer has Optimality Robustness and
Feasibility Robustness
3. Considering the objective function deviations due to the uncertainty of the
parameters, it avoids heavy and irreparable costs for managers and
investors. In the case of possibilistic programming, the following issues are
not taken into consideration.
Background and Literature review
So far, many researches have been done in the optimization of stock portfolios
due to the increasing development of global financial markets and the impact
of this optimization on economic returns and profits.
In 2009, Huang used the combination of Fuzzy c-means (FCM), a
variable-precision rough set (VPRS) model, Autoregressive with exogenous
input (ARX) and a gray-system theory for Portfolio selection investing.

47
Portfolio optimization with robust possibilistic programming
Soleimani et al. (2009) presented a genetic algorithm-based approach
with integer constraints and the market share of various industries to optimize
Markowitz's MV model.
Chang et al. (2009) introduced a genetic algorithm to solve optimization
problems with different risk measurements on the model.
Tiriaki et al. (2009) combined the fuzzy AHP with Portfolio selection.
The main approach in AHP was to design and implement a model for
combining corporate risk behavior with the investor risk class (low, medium
and high), investor goals and internal and external factors.
Montazar et al. (2010) proposed a method for designing a fuzzy expert
system for recommending and introducing investment portfolios in the Tehran
Stock Exchange.
Zymler et al. (2011) combine a robust optimization portfolio with a
classic insurance portfolio model to cover risks from rare events.
Sajjadi and Seyyed Hosseini (2011) proposed a multi-period dynamic
fuzzy model for Portfolio Selection of stocks, in which borrowing and lending
are possible in real terms (different rates of cash borrowing and lending).
Jun and Lu (2012) used a Mini-Max -based robust ranking model in
integer programming.
The constraints in this model are generated using a network streaming
model and ultimately used this method for portfolio optimization.
Looking deeper into robust investment portfolios, Fabozzi et al. (2014)
analyzed the behavior of these portfolios formed with Robust Optimization.
Their research suggested that by increasing robust optimization of investment,
optimal weights would be directed towards that portfolio, whose variance is
described to the highest by specific factors.
Wu Chang Kim et al. (2014) introduced a new approach to the robustation
portfolio of the minimum variance in which to control the kurtosis and
skewness (third and fourth torque) without the aid of higher torques. The main
idea in this article is that the robust investment portfolio based on the worst-
case scenario is prone to skewness and opposed to kurtosis.
Pishvaee, Razmi, and Torabi (2012) used robust possibilistic
programming to design supply chain.
Pishvaee and Kalantari (2012) also used robust possibilistic programming
for the primary programming of the drug supply chain.

48
Iranian Journal of Finance, 2019, Vol. 3, No. 2
Millt and Takkapi (2015) presented robust models to meet the needs of
investors looking for a global minimum variance portfolio and a rule against
robust uncertainty.
In this paper, the Monte Carlo simulation showed the robust portfolio
superiority to unrobust portfolios in different dimensions of the risk and
variance-based adjusted return. They found that the robust investment portfolio
had a minimum of variance, lower turnover, and a Sharpe ratio compared to
traditional portfolios.
Zulfagar and Ayoub (2015), based on a study conducted on the Karachi
stock exchange in the area of using the robust downside index, showed that the
use of this statistic, especially concerning assets whose curtailment curves are
greater than those of kurtosis, are much better performing Compared to
Markowitz's Mean-Variance Model.
Balabas and Balabas (2016) put forward the concept of ambiguity with
risk in their paper to create a robust portfolio optimization model, and in
particular to solve the shortcomings of capital asset pricing models.
Han, Zia and Lee (2016) developed the robust asymmetric model of the
absolute mean standard deviation that covers asymmetry in the returns
distribution.
They tested various strategies for robustification in emerging markets and
falling markets and showed that the model was able to identify lucrative stocks.
In the recent period, and since 2009, Some important points of foreign
research include:
A. Among the researches, the use of the Sharpe index as a performance
measurement was very high and had a significant difference with other
methods. The most significant measurements are CVAR, Torque, kurtosis,
Alpha and Treynor ratio.
B. Mathematical modeling, Fuzzy logic, and genetic algorithm are the most
widely used algorithms to optimize portfolios of assets. Other algorithms
include particle swarm optimization approach, quadrilateral programming
model, expert system methodology and goal programming.
Research gap
The literature review identifies important research gaps. Despite the decades of
research on investment optimization and risk management, there is still no
acceptable tool for risk measurement (The fundamental nature of risk in the

49
Portfolio optimization with robust possibilistic programming
financial field has made it impossible to achieve such a model since any model
of a universal nature will change the behavior of investors in financial markets
and ultimately reduce the performance of the model.)
The development of new Investment Portfolio Selection approaches and
models with more comprehensiveness that deals with different and conflicting
and are more flexible in dealing with the risk phenomenon (goals (with no
definitive means to measure it)) is a perpetual gap.
The research also aims to develop a new model with Robust Optimization
and Fuzzy Logic as the goal of Investment Portfolio Selection.
The question now is what model to choose for portfolio design (in terms
of type, volume, and quantity of financial assets used in the portfolio) should
be used in this model, which can maintain its credibility and efficiency over an
acceptable time frame, despite the ongoing Volatilities of financial markets.
None of the research on stock portfolio programming in uncertainty has
used the robust possibilistic programming approach to deal with this
issue. Using this approach will make the model responses determined so that
feasibility robustness and optimality robustness are also guaranteed and,
therefore, reduce the cost of implementing a real-world decision. Therefore,
sources of uncertainty in the stock market should be effectively managed. and,
in order to manage the uncertainty surrounding this environment and to have
sufficient confidence in the results, robust programming must be done so that
managers can be sure of their results and reduce the risk of their decision
making. Programming robust is one of the new and reliable approaches.
Research methodology
Dantzig et al. (1993) proposed a standard framework for multi-period asset
allocation problems. They assume risky assets in the capital market; trading
periods, linear transaction costs for trading stock and one riskless asset e.g.
risk-free deposit, we use this framework for portfolio making and objective
function based on Sharpe ratio.
1. Non-deterministic model of stock portfolio optimization
In the real world, especially in capital markets, many of the parameters of the
problem are subject to change over time and the definitive assumption of these
parameters during programming cause errors and problems. In the underlying
question, it is assumed that the stock return parameter and, hence, Sharpe ratios
are not definite numbers and are predictable fuzzy numbers. Given the dynamic

50
Iranian Journal of Finance, 2019, Vol. 3, No. 2
nature and Volatility of some of the important parameters (Sharpe ratio and
stock return), for modeling imprecise parameters that can be defined by their
four prominent points (Pishvaee et al. 2012):
( ، ، ، )
( ، ، ، )
Represent fuzzy Sharpe ratio in period t and represent the fuzzy
rate of return in period t
a.The robust possibilistic programming model
The evaluation of definitive parameters for long-term decision-making is
difficult and sometimes impossible. Even if one could estimate a possibilistic
distribution function for these two parameters, these parameters may not have
the same behavior as the past data. Different approaches, including possibilistic
programming, have been used to address the uncertainty. It should be noted
that the uncertainty parameters are suitably suited for the possibilistic
functions, such as triangular or trapezoidal possibilistic functions, based on
inadequate data or knowledge and experience of modeling decision-makers.
Therefore, in this paper, uncertain parameters are considered as fuzzy data at
any time when it changes in a long-term programming horizon. If the
possibilistic programming method is used, in order to control the level of
confidence in creating these uncertain limits, the concept of the decision can
achieve the minimum level of assurance as a safe margin for any of these
constraints. To do this, two fuzzy standard method and practices are commonly
used. It is worth noting that the optimistic fuzzy (NEC) indicates the optimistic
probability level of an uncertain event involving uncertain parameters, while
the pessimistic fuzzy (POS) indicates a pessimistic decision about an uncertain
event. It is more conservative, however, to use a pessimistic fuzzy, that is, we
assume that the decision has a pessimistic (conservative) constraint to create
uncertainties; Currently, based on the ambiguous parameters mentioned and the
use of the expected value for the objective function and the pessimistic action
for uncertain constraints, the obvious equivalent of the uncertain model can be
formulated. To do this, first consider the abbreviation for the proposed model
(Tanaka, 2000):
4))
(5)

51
Portfolio optimization with robust possibilistic programming
(6)
(7)
(8) { ، }، ،
It is assumed that vectors 𝑑 and 𝑏 are presented in the non-deterministic
parameters in the above model. The matrices B, E, S are coefficient matrices of
the constraints. Additionally, vectors y and x denote the binary and continuous
variables, respectively regarding the generic non-deterministic finite program,
the expected value of the pseudo-objective and fuzzy function is obtained,
respectively, for dealing with the objective function and the uncertain limit.
Now with the abbreviation, the basic possibilistic programming model is as
follows:
(9)
(10) { }
(11) { }
(12)
(13) ، ، ،
In which β and α control the minimum degree of certainty for establishing
a non-deterministic constraint with a pessimistic decision-making approach.
Regarding the distribution of the trapezium probability for ambiguous
parameters, the general form of relations 9-13 can be defined as follows
(Tanaka, 2000):
(14)
(15) ( )
(16) ((
) (
) )

52
Iranian Journal of Finance, 2019, Vol. 3, No. 2
(17) ((
) 𝑏 (
) 𝑏 )
(18)
(19) ، ، ،
In the possibilistic programming models, the minimum level of
confidence to establish a non-deterministic constraint should be determined in
terms of decision preferences. As seen, in the proposed model, the objective
function is not sensitive to the deviation from its expected value, which means
that gaining robust solutions in the possibilistic programming model is not
guaranteed. In such cases, there may be high risk in many real cases of
decision-making, especially in strategic decisions that the robustness of the
solution is vital. In fact, possibilistic programming has important shortcomings.
In probabilistic programming, the constraint satisfaction level is a parameter
determined by the decision-maker, which does not optimize the confidence
level. In the possibilistic programming model, there is little interest in the
feasibility of robustness and optimality robustness. On the other hand, the lack
of attention to the deviations of the objective function due to the uncertainty of
the parameters can lead to irreversible costs for managers and organizations.
This is not much to be considered in possibilistic programming. Therefore,
Pishvaee et al. (2012) proposed a robust optimizing program called robust
possibilistic programming using the concept of robust optimization. This
approach takes advantage of both robust optimization and possibilistic
programming, which clearly distinguishes it from other programming
uncertainty approaches. The robust possibilistic programming form in the
previous model is as follows:
(20)
( (
)
) ( (
)
)
(21) ( )
(22) ((
) (
) )

53
Portfolio optimization with robust possibilistic programming
(23) ((
) (
) )
(24)
(25) ، ، ،
(26) ،
In the first objective function, equation 20 of the first expression refers to the expected value of the first objective function, using the mean values of the non-deterministic parameters of the model. The second, third, and fourth sentences indicate the total cost of the deviation from the non-deterministic parameter. Hence, the parameter ξ is the weight function of the objective function, η1, and η2, the penalty for not estimating the uncertainty parameter.The parameters β and α represent the correction factor at the fuzzy numbers, according to Pishvaee (2012) which should be between 0.5 and 1.
Research Findings
In this section, a dynamic model is designed to invest in a limited number of
financial assets (Tehran Stock Exchange and risk-free deposits) over a period
and with a specified cash budget and at the end of each period on the basis for
risk and return data, investments reviewed, some sold, and some new assets
purchased. One of the best benchmark and measurement for the selection of a
mass of stocks and financial assets is the Sharpe ratio of each share/asset. In
order to achieve the real diversification, the weight assigned to each share in
the portfolio of investment placed in a certain range (Floor and ceiling)
(Fabozzi,2007), and by determining the floor and ceiling for it, we tried to
design and present a conservative portfolio consistent with the facts of real
capital markets.
1. Definitive modeling
Parameters
Sharpe ratio of ith share in the period t
Return of ith share in the period t
Cash profit (risk-free deposit) in the period t
The maximum weight of the share th in the portfolio in the period t
The minimum weight of the share th in the portfolio in the period t
Number of authorized shares in the portfolio
Purchase fee (about 0.5% of transaction value) 𝑏
Sales fee (about 0.6% of transaction value)

54
Iranian Journal of Finance, 2019, Vol. 3, No. 2
Decision variable
Continuous variable
Weight of ith share in the period t
Cash amount in the period t
The standard deviation of the portfolio in period t
Weight of ith share in the period t (The result of the
∑
)
Sale amount of ith share in the period t
The purchase amount of ith share in the period t
Binary variable, (if = 1,then >0 and F_it = 0,then =0)
(27)
∑
√∑ ∑
(28)
∑
، ، ، ، ، ، ، ،
(29) ، ، ، ، ، ، ، ،
(30) ( ) ∑
∑ 𝑏
،
، ، ،
(31) ∑
، ، ، ،
(32) =1000
(33) ، ، ، ، ، ، ، ، ، ،
(34) ، ، ، ، ، ، ، ،
Relation 27 represents the objective function of the model. Constraint 28
specifies that the weight of each share must not exceed the minimum and
maximum values set. Constraint 29 defines the weight of each share in each
period, based on the share weight in the previous period and the amount of the
transaction.
55
Portfolio optimization with robust possibilistic programming
Constraint 30 specifies the amount of cash. Constraint 31 specifies upper
and lower bound of the number of shares to be selected per period, Constraints
33 and 34 also specify the range of decision variables.
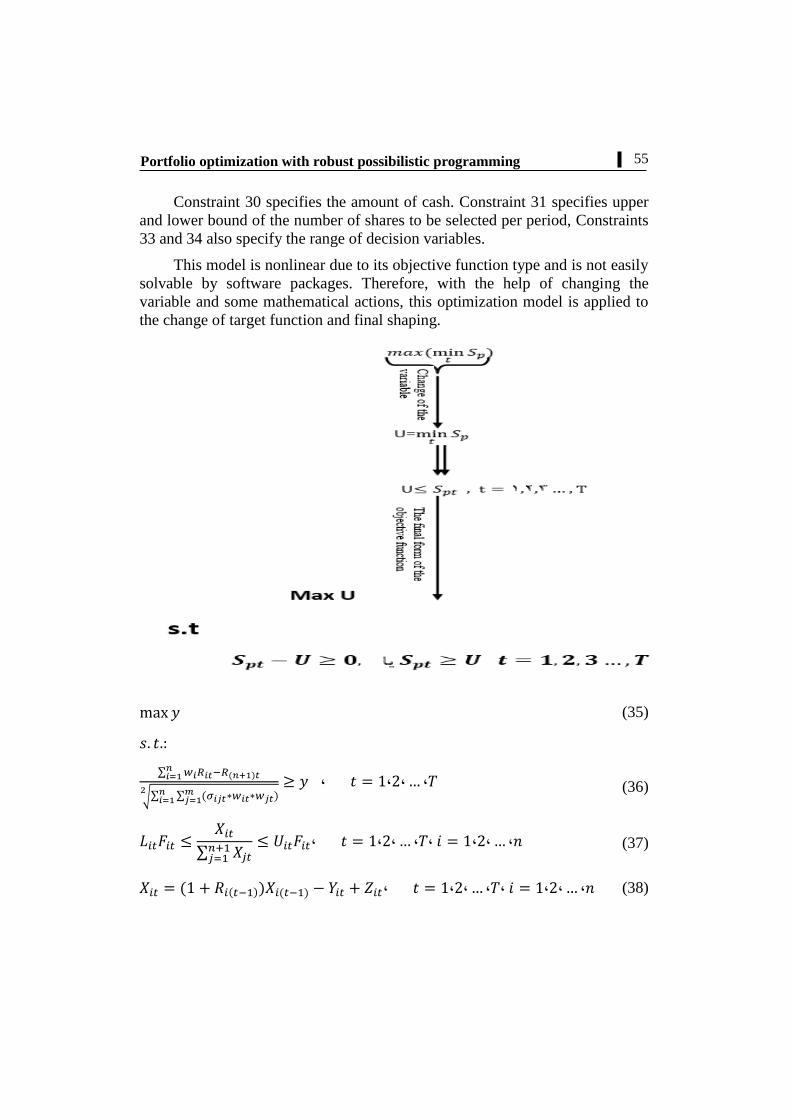
This model is nonlinear due to its objective function type and is not easily
solvable by software packages. Therefore, with the help of changing the
variable and some mathematical actions, this optimization model is applied to
the change of target function and final shaping.
(35)
(36) ∑
√∑ ∑
، ، ، ،
(37)
∑
، ، ، ، ، ، ، ،
(38) ، ، ، ، ، ، ، ،

56
Iranian Journal of Finance, 2019, Vol. 3, No. 2
(39) ( ) ∑
∑ 𝑏
،
، ، ،
(40) ∑
، ، ، ،
(41) =1000
(42) ، ، ، ، ، ، ، ، ، ،
(43) ، ، ، ، ، ، ، ،
2. The proposed robust possibilistic programming model for stock
portfolio optimization
The purpose of this section is to allow the constraint 28 to be exceeded by a
certain level. Given that a pessimistic fuzzy is used to ensure greater reliability,
and then relation 28 is converted as follows:
(44) ∑∑
According to the above, the robust possibilistic programming model is as
follows:
(45)
MAX) y (∑
√∑ ∑
∑
√∑ ∑
∑
√∑ ∑
))
s.t
46))
∑
√∑ ∑
+(1- )*
∑
√∑ ∑
,
، ، ، ، ، ، ،
47))
∑
، ، ، ، ، ، ، ،

57
Portfolio optimization with robust possibilistic programming
(48) ((
) (
) (
) (
))
، ، ، ، ، ، ، ،
49)) ((
) (
) (
) (
))
، ، ، ، ، ، ، ،
50))
∑
∑ 𝑏
، ، ، ،
(51) ∑
، ، ، ،
(52) =1000
53)) ، ، ، ، ، ، ، ، ، ،
(54) ، ، ، ، ، ، ، ،
(55) ،
Relation 42 shows the objective function of robust possibilistic based on the
proposed model. Constraints 43, 45 and 46 are also rewritten according to
robust possibilistic programming rules. Other constraints are the same as the
proposed definitive model.
3. Computational results
In this section, at first, 29 companies active on the Iran stock market were
selected in 6 time periods (weekly) for problem-solving. Descriptive statistics
that extracted from these samples (stocks) are variance and covariance. The
model was solved using GAMS software and BONMIN Solver and with the
help of the 3 GB RAM, the Core 2 Duo CPU system and the outputs of the
problem are also shown. The sensitivity analysis was performed on some of the
parameters of the model and the objective function and decision variables were
compared. This sensitivity analysis has two main objectives: a) Creating
managerial insights and new scientific achievements; b) Ensuring the validity
of the model (Sensitivity analysis on some parameters does not really mean
much and does not lead to new knowledge. But this analysis and observing the
change in the value of the objective function help us to make sure that his
model is valid and not technically problematic).

58
Iranian Journal of Finance, 2019, Vol. 3, No. 2
Problem-Solving in a Real Sample of Companies in Stock market
Considering the uncertainty assumption of some of the model parameters such
as the Sharpe ratio of stock and stock returns at different periods, the
mentioned parameters are considered as a trapezoidal fuzzy. Other parameters
of the model are based on the information available from the stock market.
Table 1 shows the definite parameters used to solve the model (30 companies
active in the stock exchange).
Table1. The definitive parameters used in problem-solving
Parameter Value Parameter Value
Number of authorized shares per
Portfolio 5 Purchase fee 0.005
The maximum weight of the share 0.5 Sales fee 0.006
The minimum weight of the share 0.1 Initial investment 1000
According to table 1, the maximum objective function in the above problem is
1520.056.
4. Sensitivity analysis
Number of authorized shares per portfolio
Initially, the sensitivity of the problem is analyzed on the difference between
the minimum and the maximum number of authorized stocks in each portfolio.
Thus, the objective function and the computational time are shown in Table 3.
Table2. Changes in the amount of objective function and computational time by changing the
difference between the upper and the lower number of authorized stocks
Number of
difference
between upper
and lower
The value of
the objective
function
Computational time
The number of
companies that
have been
purchased at least
once during six
periods
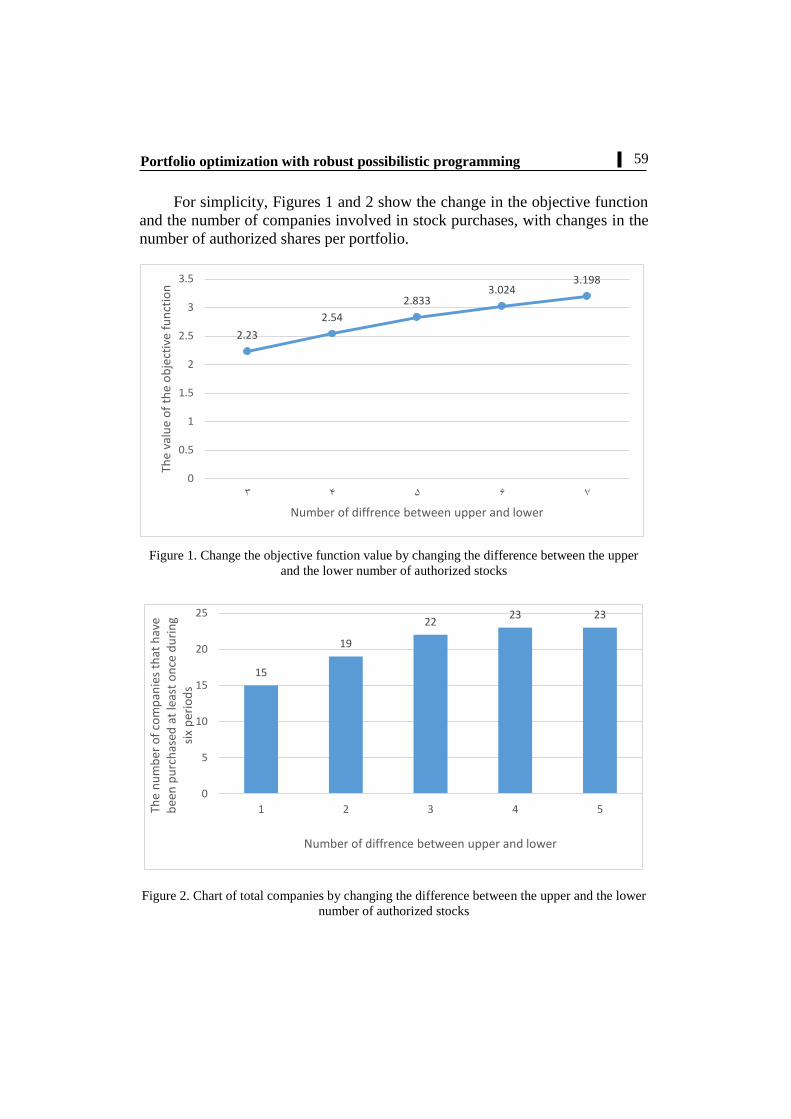
3 2.23 5.003 15
4 2.54 5.191 19
5 2.833 7.215 22
6 3.024 7.961 23
7 3.198 7.053 23
59
Portfolio optimization with robust possibilistic programming
For simplicity, Figures 1 and 2 show the change in the objective function
and the number of companies involved in stock purchases, with changes in the
number of authorized shares per portfolio.
Figure 1. Change the objective function value by changing the difference between the upper
and the lower number of authorized stocks
Figure 2. Chart of total companies by changing the difference between the upper and the lower
number of authorized stocks
15
19
22 23 23
0
5
10
15
20
25
1 2 3 4 5The
nu
mb
er o
f co
mp
anie
s th
at h
ave
bee
n p
urc
has
ed a
t le
ast
on
ce d
uri
ng
six
per
iod
s
Number of diffrence between upper and lower
2.23
2.54
2.833 3.024
3.198
0
0.5
1
1.5
2
2.5
3
3.5
3 4 5 6 7
The
valu
e o
f th
e o
bje
ctiv
e fu
nct
ion
Number of diffrence between upper and lower

60
Iranian Journal of Finance, 2019, Vol. 3, No. 2
The risk-free rate of return
In the remainder of this section, with the assumption of constant consideration
of 5 shares in each portfolio of purchases in each period, the objective function
and the computational time of the problem solving are calculated by changing
the risk-free rate of return. Table 3 shows the changes in these indicators in
different amounts of the risk-free rate of return.
Table 3. Change the value of the objective function and computational time by changing the
risk- free rate of return
Return of
risk-free
deposit
The value of the
objective function
Computational time
Amount of change in
The value of the
objective function (%)
0.11 2.527 6.915 -0.00237
0.12 2.530 7.677 -0.00119
0.13 2.533 7.215 0.00000
0.14 2.537 7.024 0.00158
0.15 2.540 7.168 0.00276
0.16 2.543 10.292 0.00393
According to the results of the above table, with the increase of the risk-
free rate of return, the objective function is increased and with the increase of
1% of the risk-free rate of return, the total objective function is linearly
increased. For this purpose, Figure 3 illustrates this change in risk-free returns.
Figure 3. Change in the percentage of total profit by changing the risk-free rate of return
-0.00300
-0.00200
-0.00100
0.00000
0.00100
0.00200
0.00300
0.00400
0.00500
0.11 0.12 0.13 0.14 0.15 0.16
Am
ou
nt
of
chan
ge in
Th
e va
lue
of
the
ob
ject
ive
fun
ctio
n(%
)
Return of risk free deposit

61
Portfolio optimization with robust possibilistic programming
Uncertainty rates
Due to the nature of possibilistic Robust optimization model, the uncertainty
rate is implemented as a decision variable in modeling, which is included in the
objective function and computational time calculated in β and α between 0.5
and 1. This section is shown in Table 4 by changing the uncertainty rate.
Table 4. Change the value of the objective function and computational time by changing the
uncertainty rate
The value of the objective
function Computational time
0.9
0.5 0.850 6.173
0.6 0.852 5.374
0.7 0.854 5.844
0.8 0.856 5.125
0.9 0.858 5.721
1 0.860 6.337
0.95
0.5 1.553 3.985
0.6 1.552 4.146
0.7 1.550 4.879
0.8 1.549 4.457
0.9 1.548 4.15
1 1.547 4.436
1
0.5 2.533 7.215
0.6 2.528 8.552
0.7 2.523 6.113
0.8 2.518 6.555
0.9 2.513 6.148
1 2.508 7.421
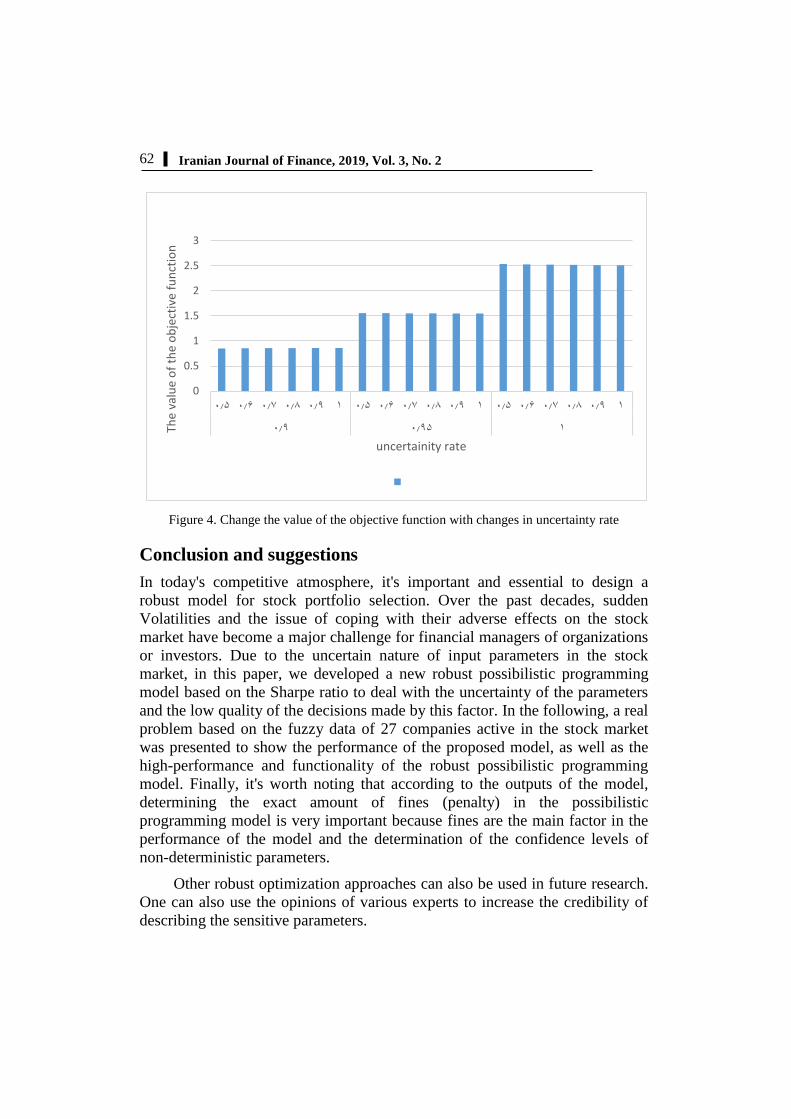
According to the results of Table 4, the maximum profit earned in the
uncertainty rate α and β is 1 and 0.5, respectively. Figure 4 shows the trend of
variations in the objective function value at different rates of uncertainty.
62
Iranian Journal of Finance, 2019, Vol. 3, No. 2
Figure 4. Change the value of the objective function with changes in uncertainty rate
Conclusion and suggestions
In today's competitive atmosphere, it's important and essential to design a
robust model for stock portfolio selection. Over the past decades, sudden
Volatilities and the issue of coping with their adverse effects on the stock
market have become a major challenge for financial managers of organizations
or investors. Due to the uncertain nature of input parameters in the stock
market, in this paper, we developed a new robust possibilistic programming
model based on the Sharpe ratio to deal with the uncertainty of the parameters
and the low quality of the decisions made by this factor. In the following, a real
problem based on the fuzzy data of 27 companies active in the stock market
was presented to show the performance of the proposed model, as well as the
high-performance and functionality of the robust possibilistic programming
model. Finally, it's worth noting that according to the outputs of the model,
determining the exact amount of fines (penalty) in the possibilistic
programming model is very important because fines are the main factor in the
performance of the model and the determination of the confidence levels of
non-deterministic parameters.
Other robust optimization approaches can also be used in future research.
One can also use the opinions of various experts to increase the credibility of
describing the sensitive parameters.
0
0.5
1
1.5
2
2.5
3
0.5 0.6 0.7 0.8 0.9 1 0.5 0.6 0.7 0.8 0.9 1 0.5 0.6 0.7 0.8 0.9 1
0.9 0.95 1 The
valu
e o
f th
e o
bje
ctiv
e fu
nct
ion
uncertainity rate

63
Portfolio optimization with robust possibilistic programming
In the end, it is suggested to use risk-based minimization models, in
particular, using more precise and comprehensive risk assessment measures
such as the Estimator of Garman- Klass (Garman,1980) and Parkinson's
(Parkinson,1980), to take full advantage of Robust possibilistic programming
capabilities. Additionally, adding an integer constraint to the weight of each
asset/share in the investment portfolio helps the proposed portfolio of the
model in the real world to be easily implemented and prevent the purchase of a
very small shareholding (micro trade).
References
Alem, D. J., Morabito, R., (2012), Production planning in furniture
settings via robust optimization, Computers & Operations Research 39 (2),
139-150.
Chang, T. J., Yang, S. C., & Chang, K. J. (2009). Portfolio optimization
problems in different risk measures using genetic algorithm. Expert Systems
with Applications, 36(7), 10529-10537.
Dantzig G, Infanger G (1993). Multi-stage stochastic linear programs for
portfolio optimization. Ann. Oper. Res., 45(1): 59-76.
Fabozzi ،frank j. kolm ،petter n. pachamanova ،dessislava a. focardi ،
Sergio m. 2007. Robust Portfolio Optimization and Management ،John Wiley
& Sons ،Inc.
Garman M.B., M.J. Klass, (1980), On the Estimation of Security Price
Volatility from Historical Data, Journal of Business, 53(1), 67-78.
Holland, J. H. (1992). Adaptation in natural and artificial systems: an
introductory analysis with applications to biology, control, and artificial
intelligence. MIT press.
Huang, K. Y. (2009). Application of VPRS model with enhanced
threshold parameter selection mechanism to automatic stock market forecasting
and portfolio selection. Expert Systems with Applications, 36(9), 11652-11661
Markowitz, H. (1952). Portfolio Selection, Journal of Finance, 7(1), 77–
91.
Md. Asadujjaman, Kais Zaman (2019). Robustness-based portfolio
optimization under epistemic uncertainty, Journal of Industrial Engineering
International June 2019, Volume 15, Issue 2, pp 207–219.

64
Iranian Journal of Finance, 2019, Vol. 3, No. 2
Montazer, G. A & Fasanghari, M. (2010). Design and implementation of
fuzzy expert system for Tehran Stock Exchange portfolio recommendation,
Expert Systems with Applications, 37(9), 6138-6147.
Nils H Hakansson, (1971). Multi-Period Mean-Variance Analysis:
Toward A General Theory of Portfolio Choice, Journal of Finance, 26(4), 857-
84
Parkinson M., (1980), The Extreme Value Method for Estimating the
Variance of the Rate of Return, Journal of Business, 53(1), 61-65.
Pishvaee, M.S., Razmi, J., and Torabi, S., (2012), Robust possibilistic
programming for socially responsible supply chain network design: A new
approach, Fuzzy sets and systems 206, 1-20.
S.J. Sadjadi, S.M. Seyedhosseini, Kh. Hassanlou (2011), Fuzzy multi
period portfolio selection with different rates for borrowing and Lending,
Applied Soft Computing 11, 3821–3826.
Sharpe, William, (1967), Portfolio Analysis, Journal of Financial and
Quantitative Analysis, 2(2), 76-84.
Sharpe, w (1963). A simplified model for portfolio analysis. management
science, 9, 277-293.
Soleimani, H., Golmakani, H. R., & Salimi, M. H. (2009). Markowitz-
based portfolio selection with minimum transaction lots, cardinality constraints
and regarding sector capitalization using genetic algorithm. Expert Systems
with Applications, 36(3), 5058-5063.
Tiryaki, F., & Ahlatcioglu, B. (2009). Fuzzy portfolio selection using
fuzzy analytic hierarchy process. Information Sciences, 179(1), 53-69.
Taguchi, G., Chowdhury, S., & Taguchi, S. (2000). Robust engineering:
learn how to boost quality while reducing costs & time to market. McGraw-
Hill Professional Pub.
TANAkA, H., GUO, P., TURKSEN, B., (2000). Portfolio selection based
on fuzzy probabilities and possibility distributions, Fuzzy sets and systems 111
(3), 387–397.
Wu, J. CF and Hamada, M. (2000). Experiments: Planning, analysis, and
parameter design optimization. Wiley &sons, Inc. Hoboken, new jersey
Woo ChangKim, Jang HoKim, Frank J.Fabozzi (2014), Deciphering
robust portfolios, Journal of Banking & Finance 45, 1-8.

65
Portfolio optimization with robust possibilistic programming
Woo Chang Kim, Frank Fabozzi (2014), Controlling portfolio skewness
and kurtosis without directly optimizing third and fourth moments, Economics
Letters, 122(2), 154-158.
Zymler, S.; Rustem, B., & Kuhn, D. (2011). Robust portfolio
optimization with derivative insurance guarantees. European Journal of
Operational Research, 210(2), 410 -424.
Bibliographic information of this paper for citing:
Amiri, Maghsoud & Heidary, Mohammad Saeed (2019). Portfolio optimization with
robust possibilistic programming. Iranian Journal of Finance, 3(2), 44-65.
Copyright © 2019, Maghsoud Amiri and Mohammad Saeed Heidary


![Robust discrete optimization and network flowsdbertsim/papers/Robust Optimization/Robust Discrete optimization and...approach, Averbakh [2] showed that polynomial solvability is preserved](https://img.pdfslide.net/doc/110x75/5e8bccbc0dd72141917dfdea/robust-discrete-optimization-and-network-i-dbertsimpapersrobust-optimizationrobust.jpg)