Embed Size (px)
Citation preview
IL NUOV0 CIMENT0 VOL. 10 D, N. 8 Agosto 1988
Positron Implantation Profile in Kapton.
K. PLOTKOWSKI, T. J. PANEK and J. KANSY
Institute of the Physics and Chemistry of Metals Silesian University - 40-007 Katowice, Bankowa 12, Poland
(ricevuto il 14 Marzo 1988)
Summary. - - Measurements of positrons' implantation profile were made with geometry as in the majority of PAT experiments, making use of the difference in values of mean lifetimes of positrons in the absorber and in the detector. The function describing the absorption of positrons in the absorber taking into account measurement geometry was fitted to the experimental data. The correction to the exponential relation occurring in this function is the dominating factor for small thicknesses of the absorber. In this analysis various values of positrons' backscatter coefficients of the nickel and of the kapton were also taken into account.
PACS 71.60 - Positron states.
1 . - I n t r o d u c t i o n .
The positron annihilation techniques (PAT) are widely employed for the investigation of certain proper t ies of solid s tates (1). F o r this purpose use is made of positrons implanted from an external ~§ source. In this situation some knowledge is required of the implantation profile of the positrons penet ra t ing the tes ted material. Knowledge of the positrons implantation profile is also necessary when correct ing experimental spectra for annihilation in the source confining material(2). The positron implantation profile is defined as the probabil i ty tha t a positron of kinetic ene rgy E penet ra t ing into the sample will be annihilated at a depth between z and z + dz (~). Considerable difficulties are
C) Positrons in Solids, edited by P. HAUTOJ~_RVI (Springer-Verlag, Heidelberg, 1979). (2) H. E. HANSEN, S. LINDEROTH and K. PETERSEN: Appl. Phys. A, 29, 99 (1982). (3) H. E. HANSEN and U. INGERSLEV-JENSEN: Positron Annihilation, edited by P. G. COLEMAN, S. C. SHARMA and L. M. DIANA (North Holland Publishing Company, Amsterdam, New York, N.Y., Oxford, 1982), p. 702.
933
934 K. P~LOTKOWSKI, T. J. PANEK and J. KANSY
encountered in determining the theoretical shape of the implantation profile (it is necessary to take into account various physical phenomena taking place during elastic and inelastic interactions of the positrons in the material). In experimental studies no positive results are obtained when applying standard transmission techniques (~).
A simple and reasonably accurate method for determining the positrons implantation profile with characteristic geometry for annihilation experiments was proposed by Hansen et al. (~). This method makes use of the difference in values of characteristic annihilation parameters of the positron annihilation process in the absorber and in the detector. Similar ideas may be found in earlier papers by MacKenzie et al. (4), Bisi and Braicovich (~), Bertolaccini and Zappa (6), Bisi et al. (7), Ram et al. (8) and also Arifov et al. (9). These papers report attempts to determine the coefficients of positron absorption (~+) and their backscatter coefficients (p§ In certain of these investigations empirical functions were determined relating these mentioned parameters with the energy of the ~* particles and the atomic number Z of the absorber or of the reflecting material.
2. - E x p e r i m e n t a l t e c h n i q u e .
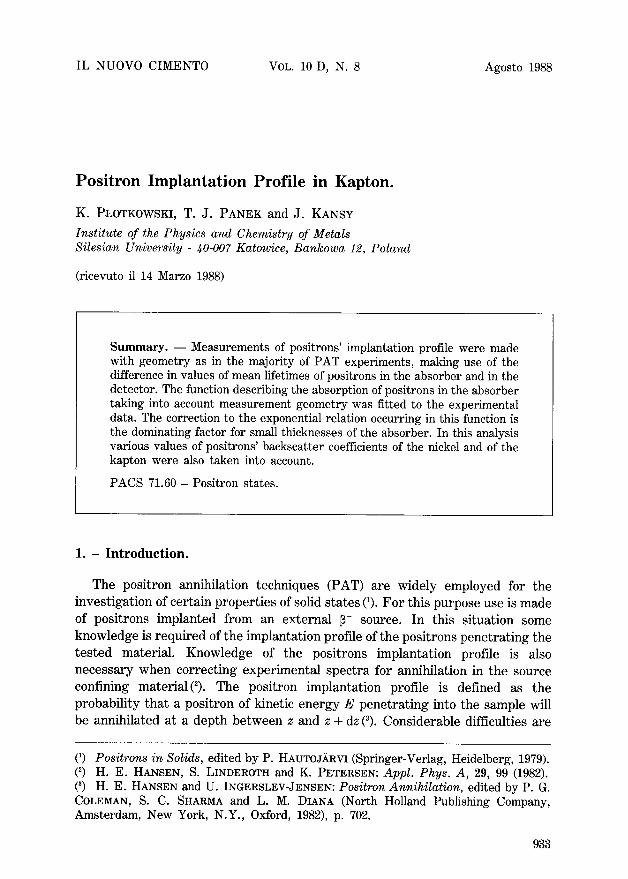
In the experiment described here the method as in(~) was used with a positrons' source in the form of a 22Na deposited on one layer of the kapton polyamide and covered with another layer. The ~§ source was covered by kapton foils with the surface density of foil: (1 + 0.01)mg/cm 2. Well-annealed nickel plates were used as detectors of the positrons passing through. The thickness of the plates was sufficient to stop all the positrons emitted by the source. Figure 1 shows the ~+ source packed in kapton foils placed between nickel plates. The kapton shutting off the source is, of course, treated as part of the pile of absorbent layers. The measurement technique is based on measuring the lifetime of the positrons. The parameter which allows the positron annihilation in kapton and nickel to be distinguished is thus the mean lifetime of positrons in these materials.
The lifetimes of the positrons were measured with a conventional spectrometer operating in a ~fast-slow, system. The full width at half-maximum
(4) I .K . MACKENZIE, C. W. SCHULTE, T. JACKMANN and J. L. CAMPBELL: Phys. Rev. A, 7, 135 (1973). (5) A. BIsI and L. BRAICOVICH: Nucl. Phys., 58, 171 (1964). (~) i . BERTOLACCINI and L. ZAPPA: Nuovo Cimento B, 52, 487 (1967). (7) A. BISI, G. GAMBARINI and L. ZAPPA: Nuovo Cimento B, 53, 428 (1979). (s) N. RAM, I. S. SUNDARA RAO and M. K. MEHTA: Phys. Rev. A, 23, 1202 (1981). (9) p. U. ARIFOV, A. R. GRUPPER and H. ALIMKULOV: Positron Annihilation, edited by P. G. COLEMAN, S. C. SttARMA and L. M. DIANA (North Holland Publishing Company, Amsterdam, New York, N.Y., Oxford, 1982), p 699.
POSITRON IMPLANTATION PROFILE IN KAPTON 935
~'Ni
~'K= 1 --~'Ni
d, ec, ec,o
/
_ C
Vll O~l l l , , e~ec:Ol~
~§ kobpton f o i l s
Fig. 1. - Schematic view of the experimental set-up. INi denotes the intensity of positrons annihilated in Ni plates.
(FWHM) of the resolution curve was 305 ps. Measurement statistics showed 106 counts of coincidence of annihilation quanta under each of the experimental curves. Numerical analysis of the lifetime spectrum was performed using the POSITRONFIT programme (lo).
3. - R e s u l t s a n d d i s c u s s i o n .
Similarly as in classical experiments with absorption of ~+ particles in thin layers of absorber (transmission technique), part of the positrons annihilated in the nickel may be treated as the intensity of the beam of positrons passing through the layer of kapton. Hence in this experiment the nickel takes the role of detector. The lifetime of the positrons in the nickel and in the kapton was determined in a separate experiment, obtaining a single time component ~Ni = (105.6+ 1.1)ps for the nickel and for the kapton also a single component ~YK = (386 + 7) ps.
Intensity of the time component associated with positrons' annihilation in nickel is related to the intensity of positrons' annihilation in kapton as in the formula
(1) INi = 1 - Ig.
Measurements of mean lifetime of positrons give values satisfying the equation
(2) § = INi "t'Ni + IK TK"
(lo) p. KIRKEGAARD, M. ELDRUP, O. E. MOGENSEN, N. J. PEDERSEN: Comp. Phys. Commun., 23, 307 (1981).
936 K . P . L O T K O W S K I , T. J . P A N E K and J . K A N S Y
Measuring the value of this annihilation parameter as a function of thickness of kapton foils, the intensity of the beam passing through is equal to
(3) INi(z) = - - ~ - ~ ( z )
"~'K - - TNi
The curve of intensity of positrons' annihilation in nickel defined in this way is in agreement with the values of the parameter obtained during direct analysis of the experimental spectra resolved into two time components. Figure 2
# { :
.c
E
d
10 z
10 1
0 I 10
0 20 4-0 60 80 100
~h ickness ( m q / c m 2 )
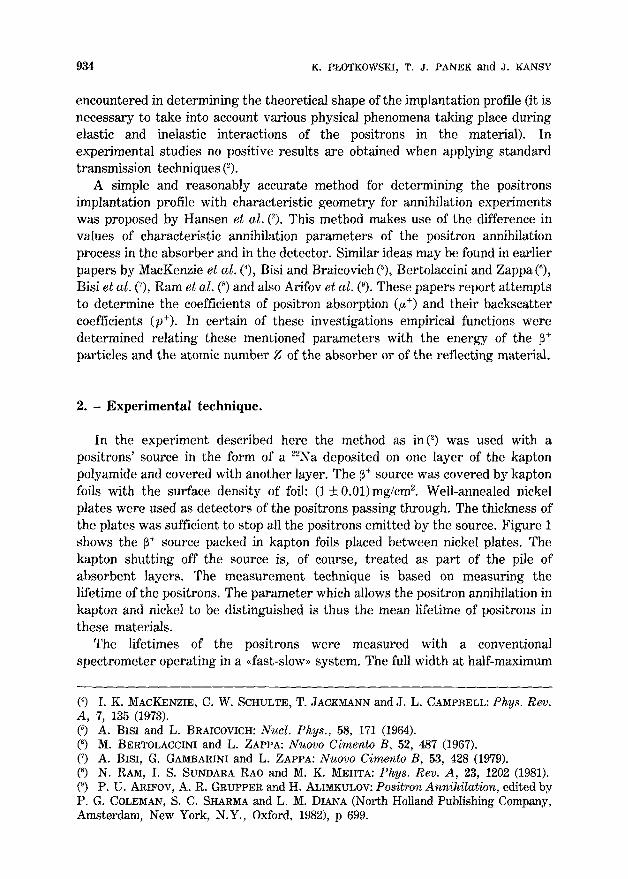
Fig. 2. - The relative intensity of positron beam passing through kapton foils. Points: experimental data, solid curve is the intensity of positrons which has been calculated from relation (11) as a function of kapton thickness.
illustrates the intensity Is~ as a function of thickness of kapton absorber. In paper (0 it was suggested that the mass absorption coefficient for positrons may be calculated from the relation
dINi(Z)/dz (4) ~+ = z > z~,
INi(z) '
where z is the surface density of the absorber and zr is the limiting thickness above which the function INi(z) is of exponential type. By assuming that zr = 5.7mg/cm 2 a value of~ § corresponding to the curve in fig. 2 was found. The value of t~ § is given in table I.
In the present experiment no collimation of the positron beam occurs and relation (4) cannot be satisfied throughout the whole range of variations of
POSITRON IMPLANTATION PROFILE IN KAPTON 937
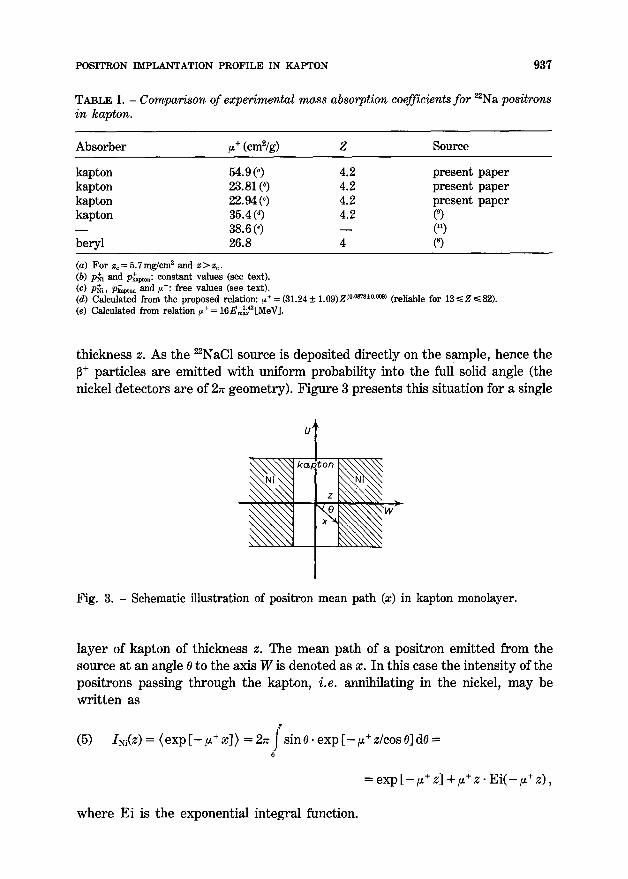
TABLE I. - Comparison of experimental mass absorption coefficients for ~Na positrons in kapton.
Absorber ~§ (cm2/g) Z Source
kapton 54.9(~ 4.2 present paper kapton 23.81 (b) 4.2 present paper kapton 22.94 (~ 4.2 present paper kapton 35.4 (~) 4.2 (9) - - 3 8 . 6 (Q - - (11)
beryl 26.8 4 (8)
(a) For z~ = 5.7 mg/cm 2 and z > zc. (b) P~i and P~pto~: constant values (see text). (c) P~i, P~apton and ~+: free values (see text). (d) Calculated from the proposed relation: ~+= (31.24 _+ 1.09)Z ~~176176 (reliable for 1 3 ~ Z ~<82). (e) Calculated from relation ~+= 16E~:~[MeV].
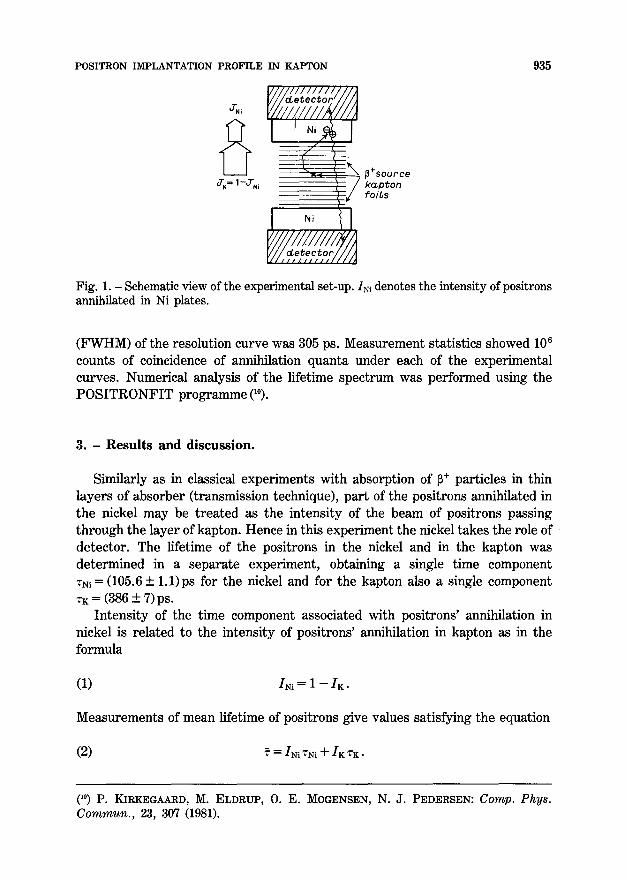
thickness z. As the ~NaC1 source is deposited directly on the sample , hence the ~§ particles are emitted with uniform probability into the full solid angle (the nickel detectors are of 27: geometry). Figure 3 presents this situation for a single
Fig. 3. - Schematic illustration of positron mean path (x) in kapton monolayer.
layer of kapton of thickness z. The mean path of a positron emitted from the source at an angle 0 to the axis W is denoted as x. In this case the intensity of the positrons passing through the kapton, i.e. annihilating in the nickel, may be written as
(5) INi(Z) = (exp [ - ~+ x]) = 2= ; s i n 0. exp [ - ~+ z/cos 0] dO --- 0
= exp [ - ~+ z] +~+z . E i ( - tL+ z),
where Ei is the exponential integral function.
938 K. P~LOTKOWSKI, T. J. PANEK a n d J. KANSY
From relation (5) it is clear that the intensity of the beam of positrons passing through the absorber is not of purely exponential type. In the numerical analysis of experimental results, the exponential integral function was replaced by a sufficiently rapidly convergent expansion
1 ( - +Z) k (6) E l ( - t~ + z) = C + ~ ln( - ~+ z) ~ +
k=l k �9 k ! ' ~5
where C is the Euler-Mascheroni constant. All the annihilated positrons are counted, but not all the positrons penetrating
into the absorber or detector directly from the source are counted. Some of these suffer backscatter from the nickel or the kapton. The assumption normally accepted is that for the range of positron energy considered (~0.5MeV) the coefficient of positron backscattering (p+) depends solely on the atomic number Z of the target material. MacKenzie et al. (4), using measurement geometry similar to that in our experiments, obtained as empirical relation describing the back- scatter coefficient
(7) pi ~ = 0.342�9 l o g l o Z - 0.146
satisfied for 3 ~< Z ~< 92. Arffov et al. (9) proposed the following formula for non-monoenergy positrons
emitted from the ~NaC1 source:
(8) p~ = (0.0577 + O. 0058) Z (o.47~ • 0.0249),
From these empirical relations the following values of the backscatter coefficient may be deduced:
(9) pi~(Ni) = 0.349 and p~(Ni) = 0.278,
for kapton (assuming Z = 4.2):
(10) pi~(kapton) = 0.067 and pS(kapton) = 0.114.
To allow for the effects of positrons' reflection from the nickel and the kapton a mean value is assumed for the value of calculated coefficients, i.e. P~i = 0.314 and P~p~n = 0.091. The intensity of the beam of positrons passing through the absorber modified by the first reflection from the nickel and the kapton may then be written as
(11) Isi(Z) = [exp [-- ~+ z] +/z + z Ei(- /z + z)].
�9 { 1 - (P?~i - Ps p~i)[1 - (exp [ - 2t~ + z] + 2~ + z E i ( - 2t~ + z))]}.
POSITRON IMPLANTATION PROFILE IN KAPTON 939
From the results of the numerical analysis, making use of expansion (6) and mean values of backscatter coefficients, a mass absorption coefficient for positrons in the kapton ~+= 23.81cm2/g was obtained.
However, from fitting of the three free parameters (P~i, P~apton, k r better agreement was found between experimental data and function (11) for the following values:
P~i 0.351, + ~+ = = Pkapton = 0.069, 22.94 cm2/g.
These values exhibit very good agreement with the results from (9) and (10) determined from the formula given by MacKenzie et al. However, the value of mass absorption coefficient for positrons in kapton is lower than that Calculated from the experimental formulae proposed in (~) and (11) (cf. table I). Experimental data for materials with approximately equal values of Z confirm, nevertheless, the value of ~+ for kapton (cf. (s) and (7)). It is noteworthy that for the given values :of the mass absorption coefficient and the backscatter coefficients good fitting of function (11) to the experimental data was found throughout the whole range of variations of absorber thickness z. The correction to the experimental form of the variation of intensity of positrons passing through the absorber, which occurs in formula (5), is of decisive importance for small thicknesses of the
10" A
"e
o
~
:~ 10
C
._~
10 20 40 60 80 100
tl'Ecl<ness (mg/c m ~ )
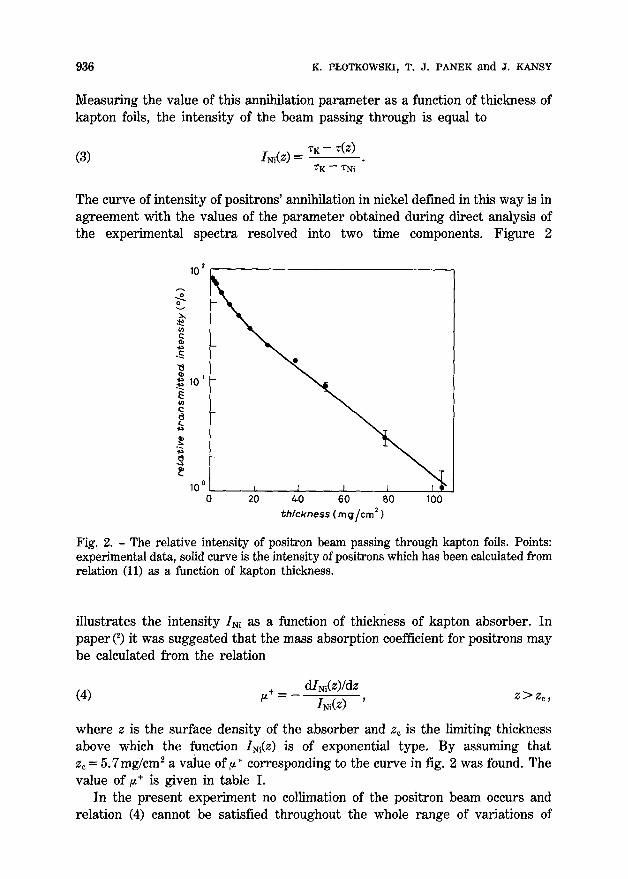
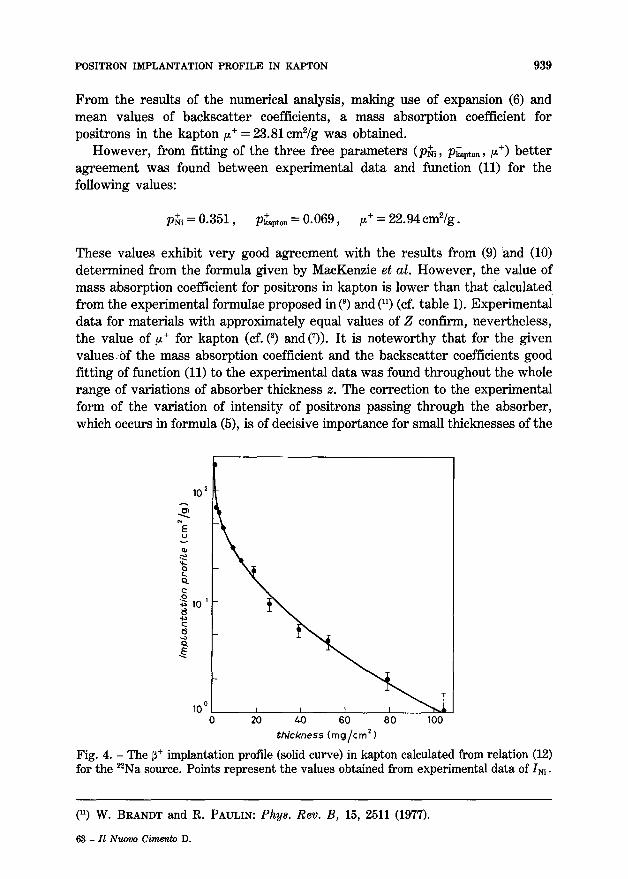
Fig. 4. - The ~+ implantation profile (solid curve) in kapton calculated from relation (12) for the ~Na source. Points represent the values obtained from experimental data of INi-
(11) W. BRANDT and R. PAULIN: Phys. Rev. B, 15, 2511 (1977).
68 - I l N u o v o Cimento D.
940 K. P~LOTKOWSKI, T. J. PANEK and J. KANSY
absorber. F o r a single layer of kapton an absorption of almost 17% of the positrons reaching it was noted.
The principal objective in the present paper was to determine the positrons' implantation profile in a measurement geomet ry characterist ic for annihilation experiments . The positron implantation profile in kapton is determined from the relation
d~(z) (12) p(z, E ) = dz
where E is the mean positrons' energy. Figure 4 shows the form of the positrons' implantation profile in kapton counted directly from relation (12) making use of the exper imental data from measurements of lifetimes of these particles. Due to the fact tha t the absorption coefficient depends on the atomic number Z, the curves from fig. 2 and 4 may be utilized for absorbers with atomic number close to 4 throughout the whole range of variations of the thickness while achieving good fitting of function (12) to the experimental data.
�9 R I A S S U N T O (*)
Sono state effettuate misure del profilo di impianto dei positroni per mezzo della geometria come nella maggioranza degli esperimenti PAT, usando la differenza nei valori delle vite medie dei positroni nell'assorbitore e nel rilevatore. La funzione che descrive l'assorbimento di positroni nell'assorbitore, considerando la geometria di misurazione, stata adattata ai dati sperimentali. La correzione alla relazione esponenziale che si verifica in questa funzione ~ il fattore dominante per spessori ridotti dell'assorbitore. Sono stati presi in esame in quest'analisi anche vari valori dei coefficienti di backscatter dei positroni del nickel e del kapton.
(*) Traduzione a cura della Redazione.
[email protected], HMn.~anTa~m uO3XTpOHOB B KapTone.
Pe3mMe (*). - - IlpoBe~ermi H3Meperli~l npoqbmla i4MnJiaHTaHni4 no3rrrponoa B cayqae reoMeTprm, KaK B 6OJ/blIIItHCTBe aKcnepnMeHTOB PAT, ncIIOHb3y~ pa3~rrqr~ B BeHHqHHaX cpe~m~x BpeMeH ~'a~3HrI nOaHTpOHOB B noraoTnTene n B ~eTeKTOpe. ~yHKIIrm, OHHCBIBaIOIIIaff norJ1omeane HO3HTpOHOB B norJIOTHTeHe C yqeTOM reOMTpHH rI3MepeHr~, yHOBJ/eTBopffeT 9KCIIepHMeHTaJIBHBIM HaHHBIM. I-[oHpaBKa K 9KCIIOHeHI~HaJIBHOMy OTHOmeI-mlO, nomanalomaaca B aro~ qby~Kmm, npe~IcTan~eT ocnoano~I KoaqbqbrlRHerlT H:I~I MaJIbIX TOJIII]~H HOF3IOTHTeJI$/. B ~TOM aHaJiH3e yqHTbIBaIOTCff pa3JIHqHbIe BeJIHqI4HbI ~[JIff Koaqbqbmmenroa o6paraoro pacceamm OT nnKeaa n KapTona.
(*) HepeeeOeno pec)atc.ue~.