Embed Size (px)
Citation preview
1 International Journal of Environment 1(1): 1-21, 2013 ISSN: 2077-4508
Corresponding Author: Abo-El-Fadl, M.M, Hydrogeochemistry Dept., Desert Research Center, Desert Research Center, El-Matariya, Cairo, P.O.B 11753, Egypt
E-mail: [email protected]
Possibilities of Groundwater Pollution in Some Areas, East of Nile Delta, Egypt Abo-El-Fadl, M.M Hydrogeochemistry Dept., Desert Research Center, Desert Research Center, El-Matariya, Cairo, P.O.B 11753, Egypt, ABSTRACT
The chemical analyses, we performed a case study of the surface water and groundwater quality in east of Nile delta –Egypt, in order to understand the hydrogeochemical aspects and the possibilities of groundwater pollution. Concentrations of major chemical elements in the polluted surface water were related to reaches of good groundwater quality, where the Bahr El-Baker reservoir was seriously polluted, with different pollutions. Hydrogeochemical study has been carried out for 72 water samples from the study area, 16 surface water samples and 56 groundwater samples. Total dissolved solid (TDS) contents of groundwater are highly variable rising along flowpath from the south (271 mg/L) to the north (20274 mg/L), implying significant deterioration and salinization of groundwater. Based on TDS and ionic ratios, groundwater samples were classified into three groups. In fresh water (group A) brackish water (group B), water chemistry is greatly influenced by cation exchange, mineral dissolution/precipitation, anthropogenic pollutants and mixing with surface water, whilst, in saline water (group C), water chemistry is affected by salt-water intrusion, reverse cation exchange and evaporation. The south and central groundwater of study areas is influenced by TOC, COD, NO3
- and NH4+
pollutions confirming the seepage of surface water to groundwater. Key words: Groundwater salinization -water–rock interaction- ionic ratios- ionic deltas - groundwater pollution, eastern Nile Delta Introduction
Water is the artery of our life and one of the most important gifts from our God to mankind. Water covers nearly three quarters of the earth’s surface in oceans, lakes, snow and glaciers. It exists also in the atmosphere and under ground. Only a tiny portion (4.9 %) of this water is fresh and suitable for direct human uses. Groundwater represents two thirds of this fresh water. The groundwater of the Quaternary aquifer in the Nile Delta region represents an important source of water after the River Nile water. Greater demands for water with growing population in parallel with cultivation and industrial activities are increasingly needed. However, even in countries where surface water is abundant, the good quality of groundwater, its accessibility and its relatively low cost are factors that stimulate an increasing level of exploitation of this resource. Groundwater pollution due to agricultural and some non-agricultural activities could be particularly insidious because of its widespread character. A direct impact on the quality of groundwater by intensive agriculture is due to the excessive use of pesticides and chemical fertilizers. Not all of the nutrients in the fertilizers are used by the crops. The exact quantity used depends on many factors including the type of crop, climate and meteorological conditions as well as the amount of fertilizers spread per hectare. Part of these nutrients is percolated on the soil surface or infiltrated into groundwater. Intensive livestock farming generates similar problems because of high quantity of animal manure. Another source of pollutants that contaminate groundwater is the usage of sewage sludge instead of fertilizers in farming and use of drainage water for irrigation.
The eastern Nile Delta is an important part for agriculture in Egypt. Some problems appeared with decreasing Nile water, unfair usage of groundwater, and irrigation with drainage water. Many researchers devoted their efforts toward studying the sources and causes of these problems and consequences. Review of the previous work concerning the water pollution of groundwater and salt water intrusion problems in the study area is presented herein.
Quaternary and Tertiary aquifers are mostly of hydrological importance in the Nile Delta and its fringes. The deltaic deposits belonging to the Pleistocene represent the main aquifer, (Shata and El-Fayoumy, 1969). The main source of the groundwater of the aquifer is the Nile water seepage. The eastern Nile Delta aquifer is a rich one and could be utilized with considering a wise pumping policy and periodical control for water quality, (El-Dairy, 1980). Nada (1984), indicated that the recharge sources of the groundwater in the eastern Nile Delta involve a mixing between different sources of water: Nile water, Palaeowater, flood water and connate water in some wells. The hydrochemical characteristics of the groundwater in the eastern Nile Delta distinguished the aquifer into three zones with different water qualities. Ismailia Canal and Damietta branch (in some places) act as recharging streams for the adjacent aquifer. To the north, Damietta Branch acts as discharging stream for groundwater, (Khalil et al., 1985). Total seepage from Ismailia Canal was estimated using the radioactive

2 Int. j. Environ. 1(1): 1-21, 2012
iodine-131. Where shallow wells were used for radioactive tracer experiments. The estimated filtration velocity values range between 0.021 and 0.137 m/day. Salem, 1996, applied the isotopic and hydrochemical techniques to study the recharge source of the groundwater in the eastern Nile Delta. The study area was classified into three main groups from the hydrochemical point of view. The southern group is mainly fresh water, indicating meteoric water influence, the middle group is characterized by brackish water, indicating leaching processes accompanying irrigation and the northern group is saline water, reflecting sea water intrusion. From the hydrochemistry and stable isotopes studies, the recharge sources were found to be: Fresh Nile water, saline water, precipitation, and irrigation water return. Site description:
The investigated area (Fauqus and Hesinia) is located east of the River Nile north Cairo, between latitudes
30° 45´ and 31° 00´ N and longitudes 31° 50´ and 32° 5´E. The study area is bounded at the west by the Nile River (Damietta Branch), Suez Canal at the east, Mediterranean Sea and Manzala Lake at the north and Ismailia canal at the south, Fig. (1). The relative humidity is moderate and active winds of intermediate speeds are recorded. The highest recorded value of relative humidity is 71.8 % in December. The mean annual precipitation ranges from 17.4 to 4.2 mm/year. Evaporation reaches up to 18.7mm/day in May and its minimum value of 2.3 mm/day recorded in December. The average daily temperatures vary from about 37.1°C in August to about 5°C in January. Mean annual precipitation increases northward from 20 to about 100 mm and daily evapotranspiration ranges between 1.5 mm in December to 7.5 mm in July (RIGW-IWACO (1992).
The overall objective of this hydrochemical study is to integrate geomorphology, geology, hydrology, hydrogeology and geochemical modeling in conjunction with their ionic data and hydrogeochemical indices to study groundwater salinity origin, the important hydrogeochemical reactions, groundwater mixing processes, controls on water quality, and further provide estimates of the anthropogenic contamination of the aquifer by TOC, COD, nitrate and ammonia ions. Such information will contribute to adequate land and water-planning strategies.
Fig. 1: Location map of the study area
3 Int. j. Environ. 1(1): 1-21, 2012
Aquifer system: The eastern region of Nile Delta is sloping regionally in a northward direction with a low relief. This area is
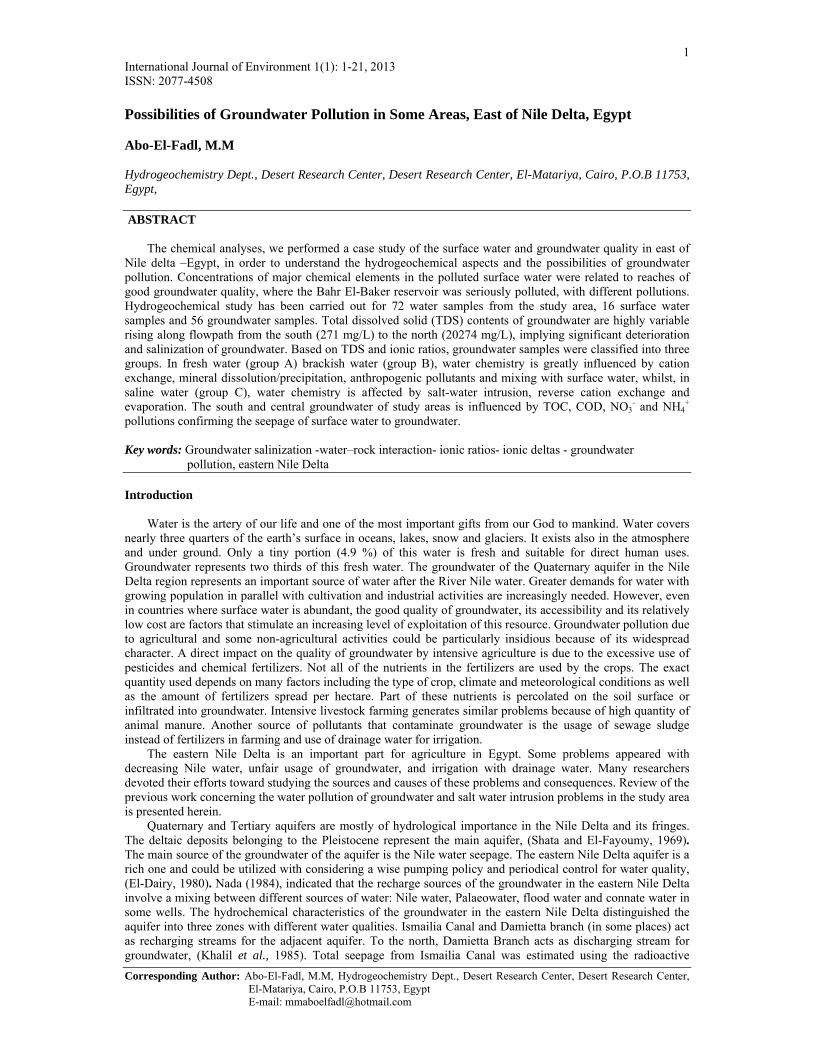
characterized by sandy and gravelly sediments belonging essentially to the old Nile Delta, and shows good examples of deflation and peneplanation. The area includes the Nile Delta flood plain. The surface is formed of silt, clay and very fine sand resulting from the successive accumulation of the suspended matter in the Nile Delta during the flood seasons. This section is underlain by sandy and gravelly sediments deposited by the Nile during the Pleistocene times and having a thickness of about 300 m, (El Fayoumy, 1968). Geriesh, 1994, classified the East Nile Delta region into three geomorphologic units, as follow, Fig. (2):
1-El Salhiya Plain. 2-The Northern Low Lands. 3-The Eastern Nile Delta Flood Plain.
Eastern Nile Delta Flood Plain
El Salhiya Plain
Um Gidam Slopes.
Northern Low Lands
Nile Delta
Gebel Shabrawit - Cairo Structural Ridges
Timsah Lake
Suze CanalE
asternLow
lands
Ismailia
Ismailia
Canal
Damiet
ta
branch
Sea
MEDITERRANEAN
Port Said
G Hamza
W Gafra
W M
oftah
W AshraW Agrama
W Sakran
Watan
Great B
itter Lake
Sand dunesBoundary between geomorphic units
Legend
ScaleKm0 20
3030
3100
3130
31 30 32 00 32 30
Wadi El Tumilat
G Um Rogm
Cairo
Northern Low andsEl Salhiya Plain
Eastern Nile Delta Flood Plain
Fig. 2: Geomorphologic map of the study area, (after El Sayed, 2000).
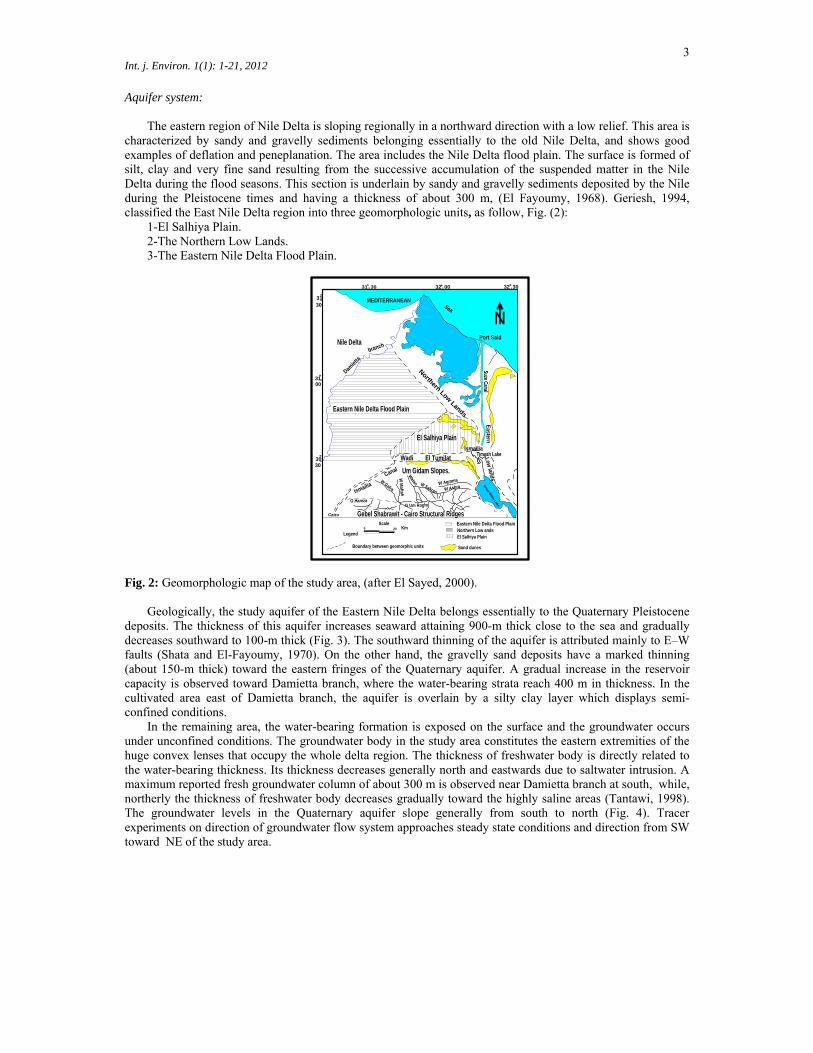
Geologically, the study aquifer of the Eastern Nile Delta belongs essentially to the Quaternary Pleistocene
deposits. The thickness of this aquifer increases seaward attaining 900-m thick close to the sea and gradually decreases southward to 100-m thick (Fig. 3). The southward thinning of the aquifer is attributed mainly to E–W faults (Shata and El-Fayoumy, 1970). On the other hand, the gravelly sand deposits have a marked thinning (about 150-m thick) toward the eastern fringes of the Quaternary aquifer. A gradual increase in the reservoir capacity is observed toward Damietta branch, where the water-bearing strata reach 400 m in thickness. In the cultivated area east of Damietta branch, the aquifer is overlain by a silty clay layer which displays semi-confined conditions.
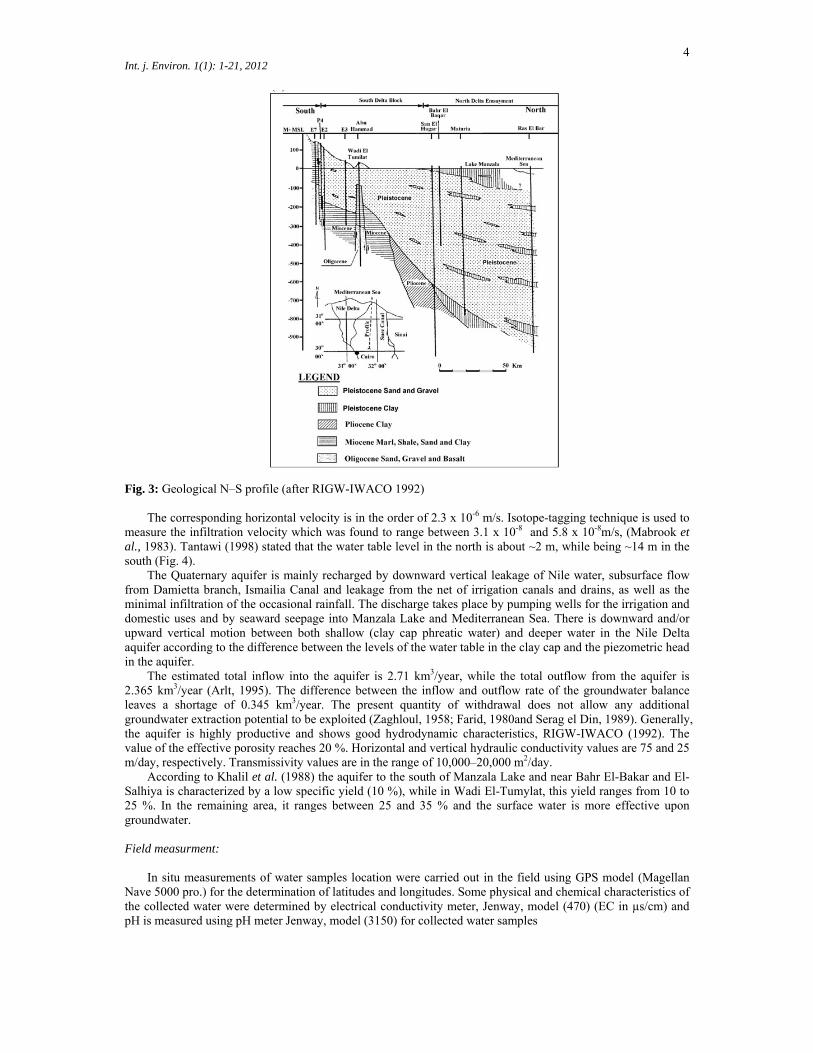
In the remaining area, the water-bearing formation is exposed on the surface and the groundwater occurs under unconfined conditions. The groundwater body in the study area constitutes the eastern extremities of the huge convex lenses that occupy the whole delta region. The thickness of freshwater body is directly related to the water-bearing thickness. Its thickness decreases generally north and eastwards due to saltwater intrusion. A maximum reported fresh groundwater column of about 300 m is observed near Damietta branch at south, while, northerly the thickness of freshwater body decreases gradually toward the highly saline areas (Tantawi, 1998). The groundwater levels in the Quaternary aquifer slope generally from south to north (Fig. 4). Tracer experiments on direction of groundwater flow system approaches steady state conditions and direction from SW toward NE of the study area.
4 Int. j. Environ. 1(1): 1-21, 2012
Fig. 3: Geological N–S profile (after RIGW-IWACO 1992)
The corresponding horizontal velocity is in the order of 2.3 x 10⁻⁶ m/s. Isotope-tagging technique is used to
measure the infiltration velocity which was found to range between 3.1 x 10⁻⁸ and 5.8 x 10⁻⁸m/s, (Mabrook et al., 1983). Tantawi (1998) stated that the water table level in the north is about ~2 m, while being ~14 m in the south (Fig. 4).
The Quaternary aquifer is mainly recharged by downward vertical leakage of Nile water, subsurface flow from Damietta branch, Ismailia Canal and leakage from the net of irrigation canals and drains, as well as the minimal infiltration of the occasional rainfall. The discharge takes place by pumping wells for the irrigation and domestic uses and by seaward seepage into Manzala Lake and Mediterranean Sea. There is downward and/or upward vertical motion between both shallow (clay cap phreatic water) and deeper water in the Nile Delta aquifer according to the difference between the levels of the water table in the clay cap and the piezometric head in the aquifer.
The estimated total inflow into the aquifer is 2.71 km3/year, while the total outflow from the aquifer is 2.365 km3/year (Arlt, 1995). The difference between the inflow and outflow rate of the groundwater balance leaves a shortage of 0.345 km3/year. The present quantity of withdrawal does not allow any additional groundwater extraction potential to be exploited (Zaghloul, 1958; Farid, 1980and Serag el Din, 1989). Generally, the aquifer is highly productive and shows good hydrodynamic characteristics, RIGW-IWACO (1992). The value of the effective porosity reaches 20 %. Horizontal and vertical hydraulic conductivity values are 75 and 25 m/day, respectively. Transmissivity values are in the range of 10,000–20,000 m2/day.
According to Khalil et al. (1988) the aquifer to the south of Manzala Lake and near Bahr El-Bakar and El-Salhiya is characterized by a low specific yield (10 %), while in Wadi El-Tumylat, this yield ranges from 10 to 25 %. In the remaining area, it ranges between 25 and 35 % and the surface water is more effective upon groundwater. Field measurment:
In situ measurements of water samples location were carried out in the field using GPS model (Magellan
Nave 5000 pro.) for the determination of latitudes and longitudes. Some physical and chemical characteristics of the collected water were determined by electrical conductivity meter, Jenway, model (470) (EC in µs/cm) and pH is measured using pH meter Jenway, model (3150) for collected water samples
5 Int. j. Environ. 1(1): 1-21, 2012
Fig. 4: Water-level contour map and groundwater flow of the Quaternary aquifer in the study area, (after Tantawi, 1998).
Laboratory measurement:
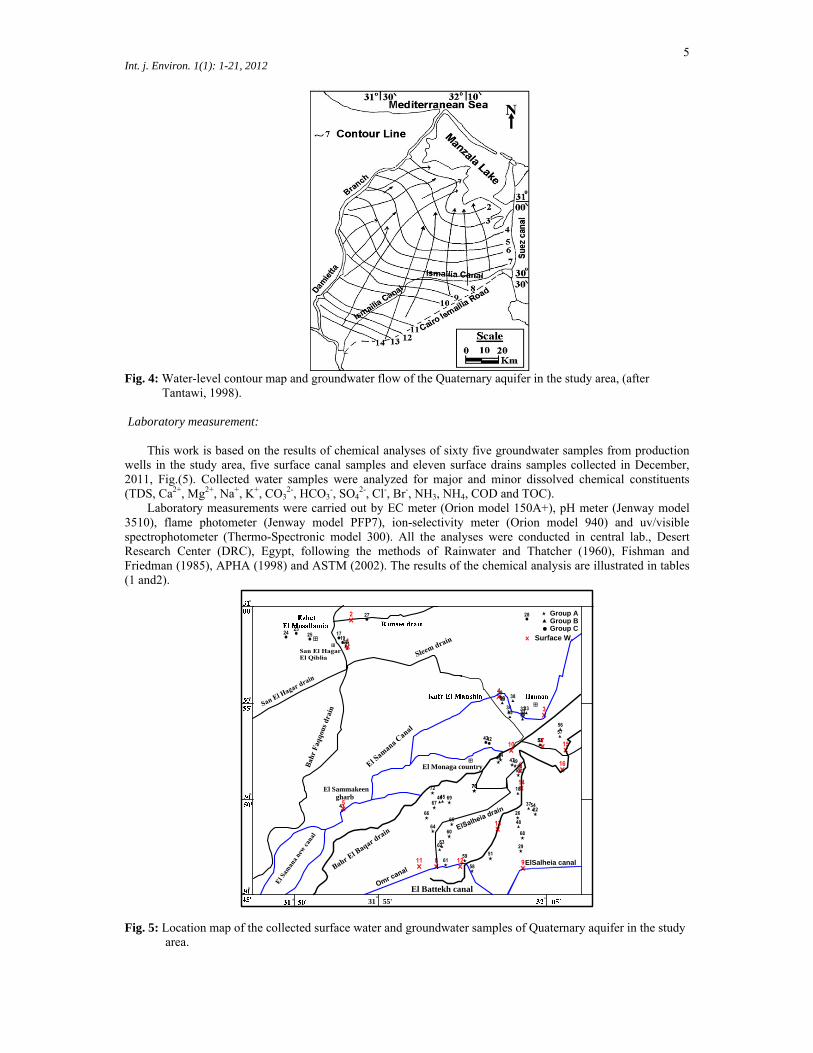
This work is based on the results of chemical analyses of sixty five groundwater samples from production
wells in the study area, five surface canal samples and eleven surface drains samples collected in December, 2011, Fig.(5). Collected water samples were analyzed for major and minor dissolved chemical constituents (TDS, Ca2+, Mg2+, Na+, K+, CO3
2-, HCO3-, SO4
2-, Cl-, Br-, NH3, NH4, COD and TOC). Laboratory measurements were carried out by EC meter (Orion model 150A+), pH meter (Jenway model
3510), flame photometer (Jenway model PFP7), ion-selectivity meter (Orion model 940) and uv/visible spectrophotometer (Thermo-Spectronic model 300). All the analyses were conducted in central lab., Desert Research Center (DRC), Egypt, following the methods of Rainwater and Thatcher (1960), Fishman and Friedman (1985), APHA (1998) and ASTM (2002). The results of the chemical analysis are illustrated in tables (1 and2).
El Monaga country
31 55'
El Battekh canal
El Sammakeengharb
ElSalheia canal
Group AGroup BGroup C
Surface W.
Fig. 5: Location map of the collected surface water and groundwater samples of Quaternary aquifer in the study area.
6 Int. j. Environ. 1(1): 1-21, 2012
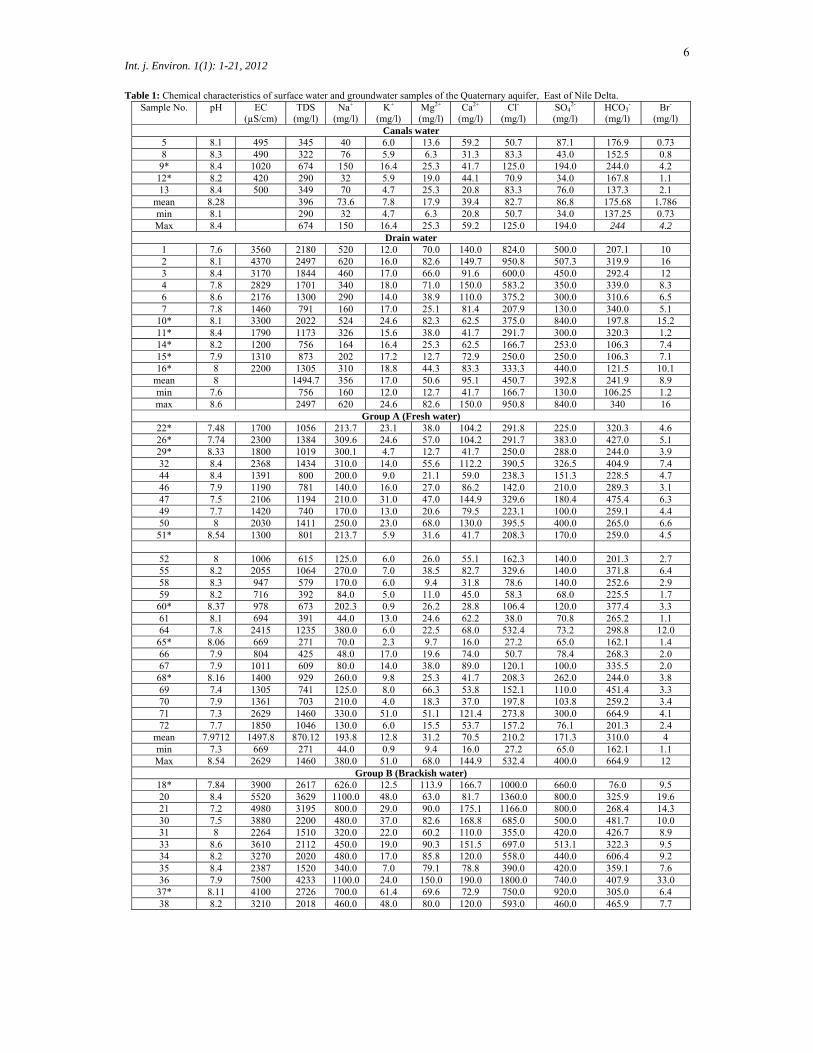
Table 1: Chemical characteristics of surface water and groundwater samples of the Quaternary aquifer, East of Nile Delta. Sample No. pH EC
(µS/cm) TDS
(mg/l) Na+
(mg/l) K+
(mg/l) Mg2+
(mg/l) Ca2+
(mg/l) Cl-
(mg/l) SO4
2-
(mg/l) HCO3
-
(mg/l) Br-
(mg/l)
Canals water5 8.1 495 345 40 6.0 13.6 59.2 50.7 87.1 176.9 0.738 8.3 490 322 76 5.9 6.3 31.3 83.3 43.0 152.5 0.89* 8.4 1020 674 150 16.4 25.3 41.7 125.0 194.0 244.0 4.2
12* 8.2 420 290 32 5.9 19.0 44.1 70.9 34.0 167.8 1.113 8.4 500 349 70 4.7 25.3 20.8 83.3 76.0 137.3 2.1
mean 8.28 396 73.6 7.8 17.9 39.4 82.7 86.8 175.68 1.786min 8.1 290 32 4.7 6.3 20.8 50.7 34.0 137.25 0.73Max 8.4 674 150 16.4 25.3 59.2 125.0 194.0 244 4.2
Drain water1 7.6 3560 2180 520 12.0 70.0 140.0 824.0 500.0 207.1 102 8.1 4370 2497 620 16.0 82.6 149.7 950.8 507.3 319.9 163 8.4 3170 1844 460 17.0 66.0 91.6 600.0 450.0 292.4 124 7.8 2829 1701 340 18.0 71.0 150.0 583.2 350.0 339.0 8.36 8.6 2176 1300 290 14.0 38.9 110.0 375.2 300.0 310.6 6.5 7 7.8 1460 791 160 17.0 25.1 81.4 207.9 130.0 340.0 5.1
10* 8.1 3300 2022 524 24.6 82.3 62.5 375.0 840.0 197.8 15.2 11* 8.4 1790 1173 326 15.6 38.0 41.7 291.7 300.0 320.3 1.214* 8.2 1200 756 164 16.4 25.3 62.5 166.7 253.0 106.3 7.415* 7.9 1310 873 202 17.2 12.7 72.9 250.0 250.0 106.3 7.116* 8 2200 1305 310 18.8 44.3 83.3 333.3 440.0 121.5 10.1
mean 8 1494.7 356 17.0 50.6 95.1 450.7 392.8 241.9 8.9 min 7.6 756 160 12.0 12.7 41.7 166.7 130.0 106.25 1.2max 8.6 2497 620 24.6 82.6 150.0 950.8 840.0 340 16
Group A (Fresh water)22* 7.48 1700 1056 213.7 23.1 38.0 104.2 291.8 225.0 320.3 4.626* 7.74 2300 1384 309.6 24.6 57.0 104.2 291.7 383.0 427.0 5.129* 8.33 1800 1019 300.1 4.7 12.7 41.7 250.0 288.0 244.0 3.9 32 8.4 2368 1434 310.0 14.0 55.6 112.2 390.5 326.5 404.9 7.444 8.4 1391 800 200.0 9.0 21.1 59.0 238.3 151.3 228.5 4.746 7.9 1190 781 140.0 16.0 27.0 86.2 142.0 210.0 289.3 3.147 7.5 2106 1194 210.0 31.0 47.0 144.9 329.6 180.4 475.4 6.349 7.7 1420 740 170.0 13.0 20.6 79.5 223.1 100.0 259.1 4.450 8 2030 1411 250.0 23.0 68.0 130.0 395.5 400.0 265.0 6.6
51* 8.54 1300 801 213.7 5.9 31.6 41.7 208.3 170.0 259.0 4.5
52 8 1006 615 125.0 6.0 26.0 55.1 162.3 140.0 201.3 2.755 8.2 2055 1064 270.0 7.0 38.5 82.7 329.6 140.0 371.8 6.458 8.3 947 579 170.0 6.0 9.4 31.8 78.6 140.0 252.6 2.959 8.2 716 392 84.0 5.0 11.0 45.0 58.3 68.0 225.5 1.7
60* 8.37 978 673 202.3 0.9 26.2 28.8 106.4 120.0 377.4 3.3 61 8.1 694 391 44.0 13.0 24.6 62.2 38.0 70.8 265.2 1.164 7.8 2415 1235 380.0 6.0 22.5 68.0 532.4 73.2 298.8 12.0
65* 8.06 669 271 70.0 2.3 9.7 16.0 27.2 65.0 162.1 1.466 7.9 804 425 48.0 17.0 19.6 74.0 50.7 78.4 268.3 2.067 7.9 1011 609 80.0 14.0 38.0 89.0 120.1 100.0 335.5 2.0
68* 8.16 1400 929 260.0 9.8 25.3 41.7 208.3 262.0 244.0 3.869 7.4 1305 741 125.0 8.0 66.3 53.8 152.1 110.0 451.4 3.370 7.9 1361 703 210.0 4.0 18.3 37.0 197.8 103.8 259.2 3.471 7.3 2629 1460 330.0 51.0 51.1 121.4 273.8 300.0 664.9 4.172 7.7 1850 1046 130.0 6.0 15.5 53.7 157.2 76.1 201.3 2.4
mean 7.9712 1497.8 870.12 193.8 12.8 31.2 70.5 210.2 171.3 310.0 4 min 7.3 669 271 44.0 0.9 9.4 16.0 27.2 65.0 162.1 1.1Max 8.54 2629 1460 380.0 51.0 68.0 144.9 532.4 400.0 664.9 12
Group B (Brackish water)18* 7.84 3900 2617 626.0 12.5 113.9 166.7 1000.0 660.0 76.0 9.520 8.4 5520 3629 1100.0 48.0 63.0 81.7 1360.0 800.0 325.9 19.6 21 7.2 4980 3195 800.0 29.0 90.0 175.1 1166.0 800.0 268.4 14.3 30 7.5 3880 2200 480.0 37.0 82.6 168.8 685.0 500.0 481.7 10.0 31 8 2264 1510 320.0 22.0 60.2 110.0 355.0 420.0 426.7 8.933 8.6 3610 2112 450.0 19.0 90.3 151.5 697.0 513.1 322.3 9.534 8.2 3270 2020 480.0 17.0 85.8 120.0 558.0 440.0 606.4 9.2 35 8.4 2387 1520 340.0 7.0 79.1 78.8 390.0 420.0 359.1 7.636 7.9 7500 4233 1100.0 24.0 150.0 190.0 1800.0 740.0 407.9 33.0
37* 8.11 4100 2726 700.0 61.4 69.6 72.9 750.0 920.0 305.0 6.4 38 8.2 3210 2018 460.0 48.0 80.0 120.0 593.0 460.0 465.9 7.7
7 Int. j. Environ. 1(1): 1-21, 2012
Table 1: Cont. Sample No. pH EC
(µS/cm) TDS
(mg/l) Na+
(mg/l) K+
(mg/l) Mg2+
(mg/l) Ca2+
(mg/l) Cl-
(mg/l) SO4
2-
(mg/l) HCO3
-
(mg/l) Br-
(mg/l)
40* 7.95 6200 4364 702.0 390.9 215.2 270.8 1542.0 1175.0 137.3 12.0 41 8.9 2490 1604 470.0 4.0 26.8 82.0 220.0 400.0 693.6 6.1
45* 8.3 2890 2002 619.3 9.0 31.6 52.1 625.0 582.0 167.5 9.3 48* 8.26 2400 1630 336.1 34.0 69.6 93.8 292.0 660.0 289.8 5.4 53 8.3 2980 1550 460.0 9.0 41.9 74.7 431.0 257.0 493.1 11.0 54 7.97 3000 1918 484.0 71.1 63.3 62.5 500.0 600.0 274.5 6.9 56 8.4 3870 2852 800.0 27.0 65.2 140.2 1300.0 300.0 410.0 14.0 57 7.7 3710 2039 470.0 14.0 87.4 137.9 735.0 330.0 504.0 13.0 62 7.6 3890 2049 520.0 8.0 60.2 175.8 786.0 177.0 584.6 16.0 63 7.7 3190 1744 550.0 3.0 31.7 100.8 583.0 150.0 603.1 15.0
mean 8.06 3773.38 2358.7 584.2 42.6 78.9 125.1 779.5 538.3 390.5 11.63 min 7.2 2264 1510 320.0 3.0 26.8 52.1 220.0 150.0 76 5.38 max 8.9 7500 4364 1100.0 390.9 215.2 270.8 1800.0 1175.0 693.6 33
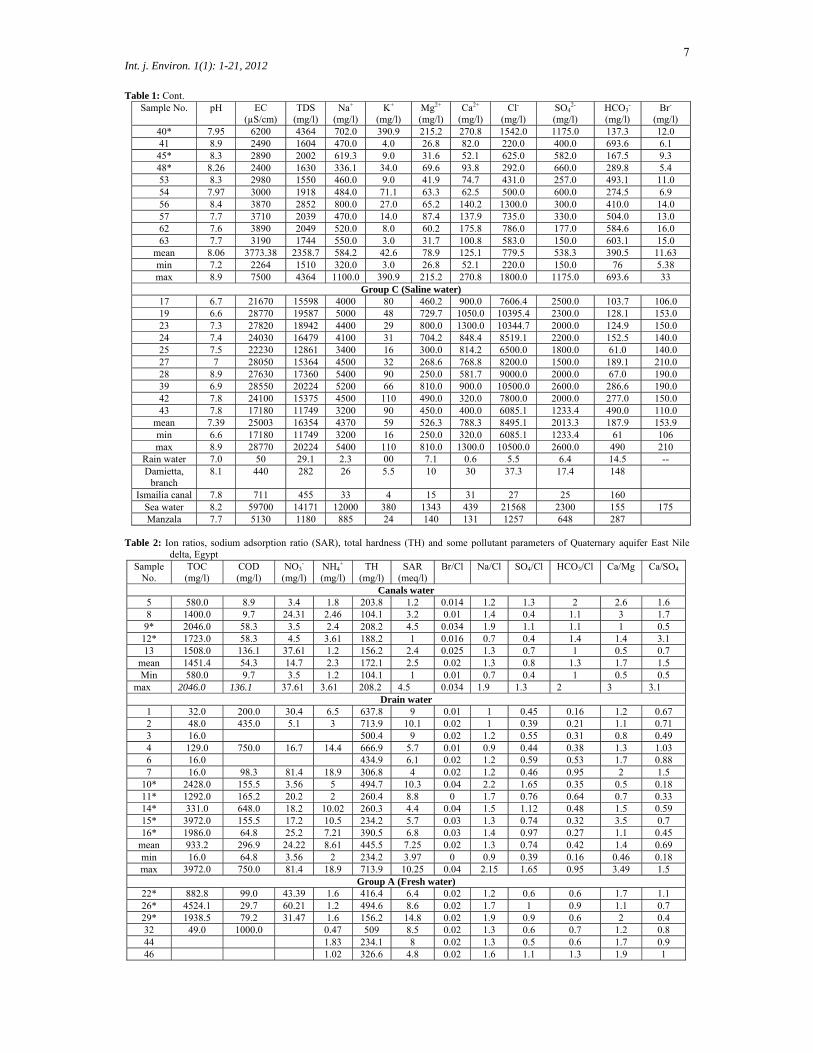
Group C (Saline water) 17 6.7 21670 15598 4000 80 460.2 900.0 7606.4 2500.0 103.7 106.0 19 6.6 28770 19587 5000 48 729.7 1050.0 10395.4 2300.0 128.1 153.0 23 7.3 27820 18942 4400 29 800.0 1300.0 10344.7 2000.0 124.9 150.0 24 7.4 24030 16479 4100 31 704.2 848.4 8519.1 2200.0 152.5 140.0 25 7.5 22230 12861 3400 16 300.0 814.2 6500.0 1800.0 61.0 140.0 27 7 28050 15364 4500 32 268.6 768.8 8200.0 1500.0 189.1 210.0 28 8.9 27630 17360 5400 90 250.0 581.7 9000.0 2000.0 67.0 190.0 39 6.9 28550 20224 5200 66 810.0 900.0 10500.0 2600.0 286.6 190.0 42 7.8 24100 15375 4500 110 490.0 320.0 7800.0 2000.0 277.0 150.0 43 7.8 17180 11749 3200 90 450.0 400.0 6085.1 1233.4 490.0 110.0
mean 7.39 25003 16354 4370 59 526.3 788.3 8495.1 2013.3 187.9 153.9 min 6.6 17180 11749 3200 16 250.0 320.0 6085.1 1233.4 61 106 max 8.9 28770 20224 5400 110 810.0 1300.0 10500.0 2600.0 490 210
Rain water 7.0 50 29.1 2.3 00 7.1 0.6 5.5 6.4 14.5 -- Damietta,
branch 8.1 440 282 26 5.5 10 30 37.3 17.4 148
Ismailia canal 7.8 711 455 33 4 15 31 27 25 160 Sea water 8.2 59700 14171 12000 380 1343 439 21568 2300 155 175 Manzala 7.7 5130 1180 885 24 140 131 1257 648 287
Table 2: Ion ratios, sodium adsorption ratio (SAR), total hardness (TH) and some pollutant parameters of Quaternary aquifer East Nile
delta, Egypt Sample
No. TOC (mg/l)
COD (mg/l)
NO3-
(mg/l) NH4
+ (mg/l)
TH (mg/l)
SAR (meq/l)
Br/Cl Na/Cl SO4/Cl HCO3/Cl Ca/Mg Ca/SO4
Canals water 5 580.0 8.9 3.4 1.8 203.8 1.2 0.014 1.2 1.3 2 2.6 1.6 8 1400.0 9.7 24.31 2.46 104.1 3.2 0.01 1.4 0.4 1.1 3 1.7 9* 2046.0 58.3 3.5 2.4 208.2 4.5 0.034 1.9 1.1 1.1 1 0.5 12* 1723.0 58.3 4.5 3.61 188.2 1 0.016 0.7 0.4 1.4 1.4 3.1 13 1508.0 136.1 37.61 1.2 156.2 2.4 0.025 1.3 0.7 1 0.5 0.7
mean 1451.4 54.3 14.7 2.3 172.1 2.5 0.02 1.3 0.8 1.3 1.7 1.5 Min 580.0 9.7 3.5 1.2 104.1 1 0.01 0.7 0.4 1 0.5 0.5
max 2046.0 136.1 37.61 3.61 208.2 4.5 0.034 1.9 1.3 2 3 3.1 Drain water
1 32.0 200.0 30.4 6.5 637.8 9 0.01 1 0.45 0.16 1.2 0.67 2 48.0 435.0 5.1 3 713.9 10.1 0.02 1 0.39 0.21 1.1 0.71 3 16.0 500.4 9 0.02 1.2 0.55 0.31 0.8 0.49 4 129.0 750.0 16.7 14.4 666.9 5.7 0.01 0.9 0.44 0.38 1.3 1.03 6 16.0 434.9 6.1 0.02 1.2 0.59 0.53 1.7 0.88 7 16.0 98.3 81.4 18.9 306.8 4 0.02 1.2 0.46 0.95 2 1.5
10* 2428.0 155.5 3.56 5 494.7 10.3 0.04 2.2 1.65 0.35 0.5 0.18 11* 1292.0 165.2 20.2 2 260.4 8.8 0 1.7 0.76 0.64 0.7 0.33 14* 331.0 648.0 18.2 10.02 260.3 4.4 0.04 1.5 1.12 0.48 1.5 0.59 15* 3972.0 155.5 17.2 10.5 234.2 5.7 0.03 1.3 0.74 0.32 3.5 0.7 16* 1986.0 64.8 25.2 7.21 390.5 6.8 0.03 1.4 0.97 0.27 1.1 0.45
mean 933.2 296.9 24.22 8.61 445.5 7.25 0.02 1.3 0.74 0.42 1.4 0.69 min 16.0 64.8 3.56 2 234.2 3.97 0 0.9 0.39 0.16 0.46 0.18 max 3972.0 750.0 81.4 18.9 713.9 10.25 0.04 2.15 1.65 0.95 3.49 1.5
Group A (Fresh water) 22* 882.8 99.0 43.39 1.6 416.4 6.4 0.02 1.2 0.6 0.6 1.7 1.1 26* 4524.1 29.7 60.21 1.2 494.6 8.6 0.02 1.7 1 0.9 1.1 0.7 29* 1938.5 79.2 31.47 1.6 156.2 14.8 0.02 1.9 0.9 0.6 2 0.4 32 49.0 1000.0 0.47 509 8.5 0.02 1.3 0.6 0.7 1.2 0.8 44 1.83 234.1 8 0.02 1.3 0.5 0.6 1.7 0.9 46 1.02 326.6 4.8 0.02 1.6 1.1 1.3 1.9 1

8 Int. j. Environ. 1(1): 1-21, 2012
47 1.23 555.4 5.5 0.02 1.1 0.4 0.9 1.9 1.9 49 4.05 283.3 6.2 0.02 1.2 0.3 0.7 2.4 1.9 50 nil 604.6 6.3 0.02 1 0.8 0.4 1.2 0.8 51* 1184.6 19.8 20.52 2 234.3 8.6 0.02 1.6 0.6 0.8 0.8 0.6 52 2.04 244.6 4.9 0.02 1.2 0.6 0.7 1.3 0.9 55 0.26 365.1 8.7 0.02 1.3 0.3 0.7 1.3 1.4 58 0.17 118 9.6 0.04 3.4 1.3 2.1 2.1 0.5 59 0.17 157.8 4.1 0.03 2.3 0.9 2.4 2.5 1.6 60* 1721.4 153.9 337.6 0.5 180 9.3 0.03 3 0.8 2.3 0.7 0.6 61 20.4 0.04 256.4 1.7 0.03 2.1 1.4 4.2 1.5 2.1 64 5.1 0.02 262.6 14.4 0.02 1.1 0.1 0.3 1.8 2.2 65* 1324.1 92.6 243.1 0.5 80 4.8 0.05 4.1 1.8 3.7 1 0.6 66 3.89 265.4 1.8 0.04 1.8 1.1 3.2 2.3 2.3 67 535.7 0.23 378.7 2.5 0.02 1.1 0.6 1.6 1.4 2.1 68* 1400.0 69.3 14.66 2.4 208.3 11.1 0.02 2 0.9 0.7 1 0.4 69 28.6 0.03 407.3 3.8 0.02 1.3 0.5 1.7 0.5 1.2 70 0.09 167.7 10 0.02 1.7 0.4 0.8 1.2 0.9 71 267.8 0.63 513.5 9 0.01 2 0.8 1.4 1.4 1 72 0.33 197.9 5.7 0.02 1.3 0.4 0.7 2.1 1.7
mean 1628.0 234.6 80.5 1.1 304.7 7.2 0.02 1.7 0.7 1.4 1.5 1.2 min 49.0 19.8 5.1 0.02 80 1.7 0.01 1 0.1 0.3 0.5 0.4 max 4524.1 1000.0 337.6 4.05 604.6 14.8 0.05 4.1 1.8 4.2 2.5 2.3
Group B (Brackish water)
18* 3089.7 48.6 3.77 3.2 885.1 9.2 0.01 1 0.49 0.05 0.9 0.61 20 16.0 1.785 463.3 22.2 0.014 1.3 0.43 0.15 0.8 0.25 21 16.0 2.718 807.8 12.2 0.012 1.1 0.51 0.13 1.2 0.53 30 0.328 761.4 7.6 0.015 1.1 0.54 0.42 1.2 0.81 31 5.445 522.5 6.1 0.025 1.4 0.87 0.73 1.1 0.63 33 16.0 1.798 750 7.1 0.014 1 0.54 0.32 1 0.71 34 16.0 0.837 652.7 8.2 0.017 1.4 0.58 0.67 0.8 0.65 35 0.185 522.5 6.5 0.02 1.4 0.79 0.61 0.6 0.45 36 0.087 1092 14.5 0.018 1 0.3 0.15 0.8 0.62 37* 1655.2 89.1 52.9 8.81 468.6 14.1 0.009 1.5 0.9 0.24 0.6 0.19 38 0.034 629 8 0.013 1.3 0.57 0.5 0.9 0.63 40* 2692.3 46.2 47.45 14.82 1562 7.7 0.008 0.9 0.56 0.05 0.8 0.55 41 4.008 315.1 11.5 0.028 3.3 1.34 2.13 1.9 0.49 45* 2046.2 29.7 0.1 3.2 260.3 16.7 0.015 1.5 0.69 0.17 1 0.21 48* 1292.3 69.3 48.9 2.003 520.7 6.4 0.019 1.9 1.67 0.58 0.8 0.34 53 81.4 0.68 358.9 10.6 0.026 1.7 0.44 0.75 1.1 0.7 54* 2537.9 9.9 59.52 21.63 416.6 10.3 0.014 1.6 0.89 0.32 0.6 0.25 56 15.0 1.203 618.5 14 0.011 1 0.17 0.2 1.3 1.12 57 15.0 0.023 704.2 7.7 0.018 1 0.33 0.42 1 1 62 0.008 686.8 8.6 0.02 1 0.17 0.48 1.8 2.38 63 19.0 1607.0 0.06 382.4 12.2 0.026 1.5 0.19 0.65 1.9 1.61
mean 1032.8 271.4 42 3.47 637.2 10.5 0.017 1.4 0.62 0.46 1.1 0.7 min 15.0 9.9 0.1 0.008 260.3 6.1 0.008 0.9 0.17 0.05 0.6 0.19 max 3089.7 1607.0 81.4 21.63 1562 22.2 0.028 3.3 1.67 2.13 1.9 2.38
Group C (Saline water) 17 65.0 3.013 4142 38.2 0.014 0.82 0.24 0.008 1.19 0.86 19 65.0 0.218 5626 41 0.015 0.75 0.16 0.007 0.87 1.1 23 81.0 0.626 6540 33.5 0.015 0.66 0.14 0.008 0.99 1.56 24 81.0 416.6 5.1 0.077 5017 35.6 0.016 0.75 0.19 0.01 0.73 0.93 25 48.0 0.327 3268 36.6 0.022 0.81 0.2 0.005 1.65 1.09 27 48.0 0.286 3026 50.3 0.026 0.85 0.13 0.013 1.74 1.23 28 81.0 0.056 2482 66.7 0.021 0.93 0.16 0.005 1.41 0.7 39 16.7 0.073 5582 42.8 0.018 0.77 0.18 0.016 0.67 0.83 42 32.0 1.941 2816 52.2 0.019 0.9 0.19 0.023 0.4 0.38 43 32.0 0.617 2851 36.9 0.018 0.82 0.15 0.056 0.54 0.78
mean 59.2 416.6 10.9 0.723 4135 43.4 0.018 0.81 0.18 0.015 1.02 0.94 min 32.0 416.6 5.1 0.056 2482 33.5 0.014 0.66 0.13 0.005 0.4 0.38 max 81.0 416.6 16.7 3.013 6540 66.7 0.026 0.93 0.24 0.056 1.74 1.56
Samples * Hussein,(2010).
Results and Discussion
The chemical characteristics of surface and groundwater samples from the Eastern Nile Delta are compiled
together with some ionic ratios (expressed in mg/l and me/l), tables (1 and 2). Analysis of rain water, Seawater, Dameitta branch, Ismailia Canal and Manzala lake are also added as possible sources of recharge of the Quaternary aquifer. All the sampled wells are tapping the Quaternary alluvium aquifer in the Eastern Nile Delta.
9 Int. j. Environ. 1(1): 1-21, 2012
The results of chemical analyses show wide variations in chemical compositions and also indicate high salinity of some groundwater samples. In general, the groundwater samples exhibit pH values between 6.6 and 8.9 (neutral to alkaline) and electrical conductivity (EC) 669–28770 µS/cm, and total dissolved solids (TDS) values 271–20224 mg/l. Moreover, very wide ranges are easily recognized for most parameters (Table 1). In particular, the ranges of Na+ and Cl- concentrations are wide; 44–5400 and 27.2–10500 mg/l, respectively. Also, Ca2+ and Mg2+ concentrations range from 16 to 1300 mg/l and from 9.4 to 810 mg/l, respectively. The sulfate concentration varies from 65to 2600 mg/l, while bicarbonate values range between 61 and 693.6 mg/l. Such wide ranges of solute concentrations suggest that multiple sources and/or complex hydrochemical processes act to generate the chemical composition. The very high TOC ( up to 4524mg/l), COD (up to 1607mg/l), nitrate (up to 337.5 mg/L) and ammonium (up to 21.6 mg/l) concentrations in some groundwater wells can be attributed to anthropogenic sources such as sewage effluent through seepage from septic tanks, agricultural activity, and the use of orgaic manure and nitrogen fertilizers. This reflects a considerable degradation of groundwater characterized by high TOC, COD, NO3
- and NH4 + concentrations due to the presence of agricultural influences
coupled with the traditionally applied flood irrigation that introduce a long-term risk of groundwater pollution by excess fertilizers and pesticides leached downward.
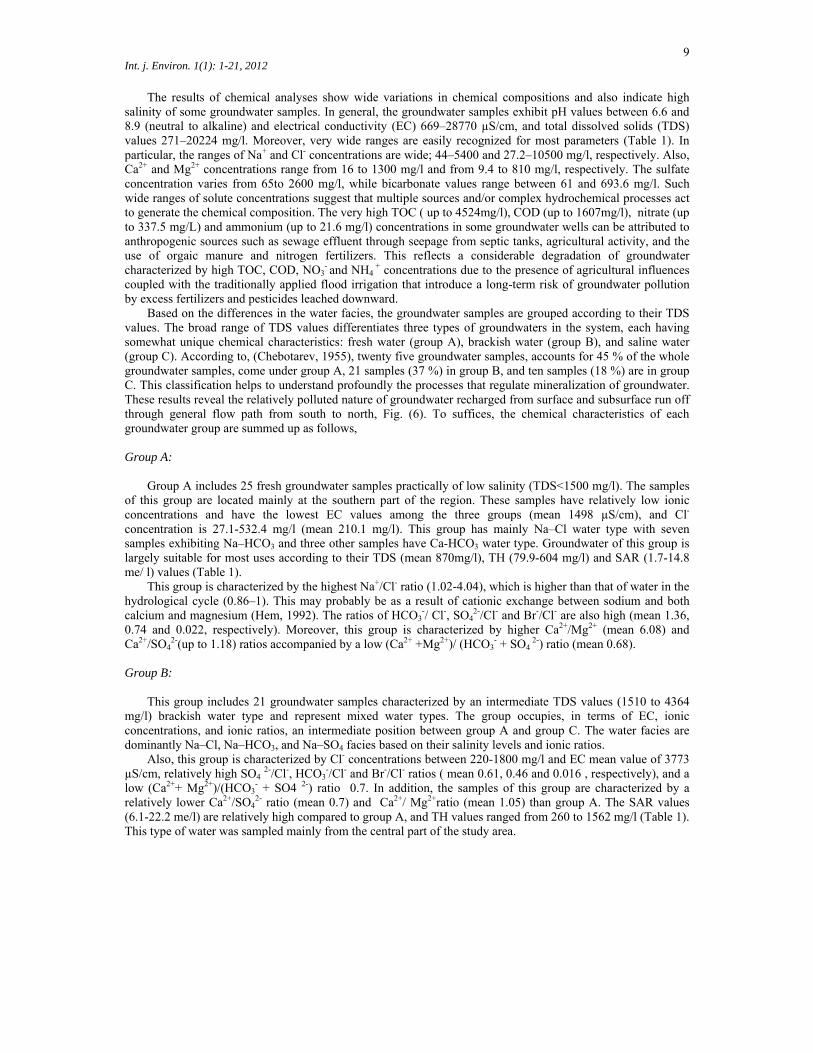
Based on the differences in the water facies, the groundwater samples are grouped according to their TDS values. The broad range of TDS values differentiates three types of groundwaters in the system, each having somewhat unique chemical characteristics: fresh water (group A), brackish water (group B), and saline water (group C). According to, (Chebotarev, 1955), twenty five groundwater samples, accounts for 45 % of the whole groundwater samples, come under group A, 21 samples (37 %) in group B, and ten samples (18 %) are in group C. This classification helps to understand profoundly the processes that regulate mineralization of groundwater. These results reveal the relatively polluted nature of groundwater recharged from surface and subsurface run off through general flow path from south to north, Fig. (6). To suffices, the chemical characteristics of each groundwater group are summed up as follows, Group A:
Group A includes 25 fresh groundwater samples practically of low salinity (TDS<1500 mg/l). The samples
of this group are located mainly at the southern part of the region. These samples have relatively low ionic concentrations and have the lowest EC values among the three groups (mean 1498 µS/cm), and Cl- concentration is 27.1-532.4 mg/l (mean 210.1 mg/l). This group has mainly Na–Cl water type with seven samples exhibiting Na–HCO3 and three other samples have Ca-HCO3 water type. Groundwater of this group is largely suitable for most uses according to their TDS (mean 870mg/l), TH (79.9-604 mg/l) and SAR (1.7-14.8 me/ l) values (Table 1).
This group is characterized by the highest Na+/Cl- ratio (1.02-4.04), which is higher than that of water in the hydrological cycle (0.86–1). This may probably be as a result of cationic exchange between sodium and both calcium and magnesium (Hem, 1992). The ratios of HCO3
-/ Cl-, SO42-/Cl- and Br-/Cl- are also high (mean 1.36,
0.74 and 0.022, respectively). Moreover, this group is characterized by higher Ca2+/Mg2+ (mean 6.08) and Ca2+/SO4
2-(up to 1.18) ratios accompanied by a low (Ca2+ +Mg2+)/ (HCO3- + SO4
2-) ratio (mean 0.68). Group B:
This group includes 21 groundwater samples characterized by an intermediate TDS values (1510 to 4364
mg/l) brackish water type and represent mixed water types. The group occupies, in terms of EC, ionic concentrations, and ionic ratios, an intermediate position between group A and group C. The water facies are dominantly Na–Cl, Na–HCO3, and Na–SO4 facies based on their salinity levels and ionic ratios.
Also, this group is characterized by Cl- concentrations between 220-1800 mg/l and EC mean value of 3773 µS/cm, relatively high SO4
2-/Cl-, HCO3-/Cl- and Br-/Cl- ratios ( mean 0.61, 0.46 and 0.016 , respectively), and a
low (Ca2++ Mg2+)/(HCO3- + SO4 2-) ratio 0.7. In addition, the samples of this group are characterized by a
relatively lower Ca2+/SO42- ratio (mean 0.7) and Ca2+/ Mg2+ratio (mean 1.05) than group A. The SAR values
(6.1-22.2 me/l) are relatively high compared to group A, and TH values ranged from 260 to 1562 mg/l (Table 1). This type of water was sampled mainly from the central part of the study area.
10 Int. j. Environ. 1(1): 1-21, 2012
Fig. 6: iso salinity contour map of the groundwater in study area Group C:
This group includes 10 groundwater samples of highly saline water type (TDS, 11749 to 20224 mg/l) that
was observed only in the northern section of the Eastern Nile Delta. Groundwater from this group has EC values (17180–28770 µS/cm) and is not recommended for domestic use and irrigation. The Cl- concentrations of this saline groundwater vary from 6085 to 10500 mg/L. Concentrations of Mg 2+, Ca2+ and SO4
2- are also high, whereas alkalinity is relatively low. Group C is characterized by the lowest Na+/Cl- ratio (0.6–0.93), Br-/Cl- ratio of 0013-0.025, HCO3
-/Cl- ratio (0.005-0.6) and SO42-/Cl -ratio (0.13-0.24. The highest (Ca2++Mg2+)/ (HCO3
- + SO4
2-) ratio (1.1-2.9), SAR (33.5-66.7 me/l), as well as TH (2481-6539 mg/l) were recorded in this group. While Ca2+/Mg2+and Ca2+/SO4
2- mean values (1.01 and 0.94, respectively) are almost similar to the previous groups (Table 1). Overall the Na+/Cl-, CO3
2- /Cl- and SO42-/ Cl- ratios decrease with the increasing salinity of the
groundwater. In general, the average values for each group show a continuous increase of TDS and EC with Cl-, SO4
2-, Na+, Ca2+, Mg2+, K+ and Br- concentrations from groups A to group C. Similarly, SAR and TH values exhibit the same behavior. In addition, ion/Cl- ratios decrease and ion/ HCO3
- ratios increase with increases the salinity of groundwater. The progressive salinity increases from group A to group C with the movement of groundwater from south to north.
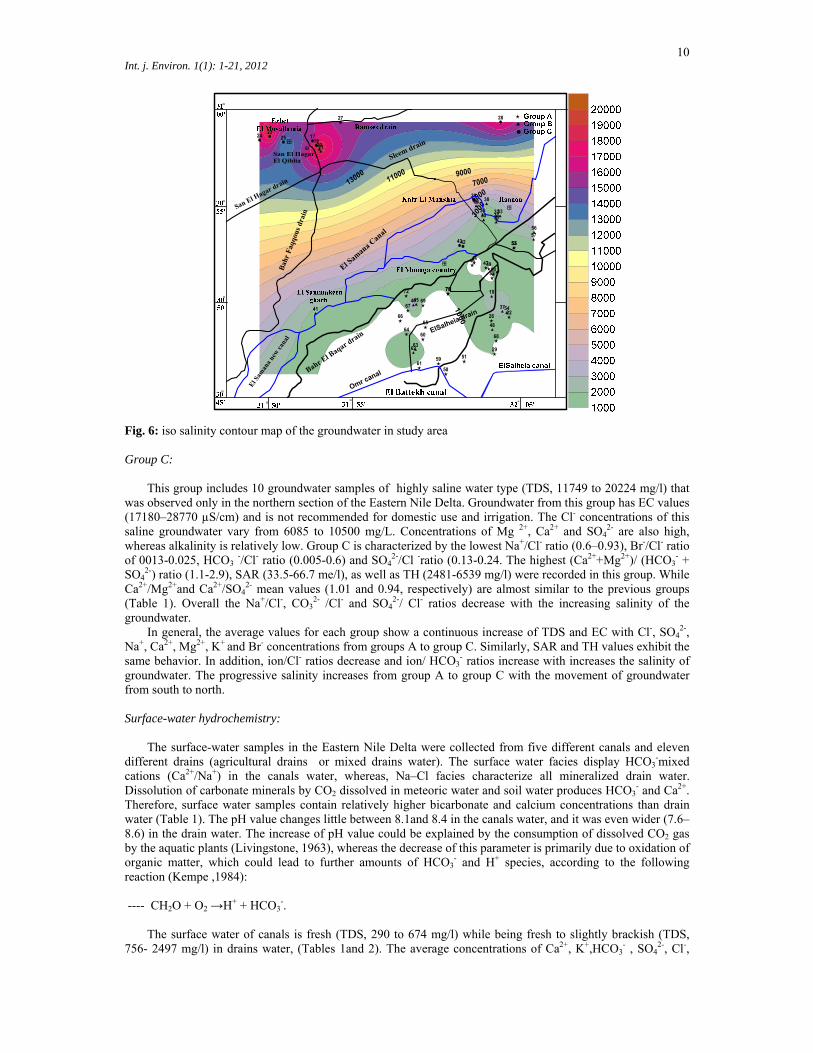
Surface-water hydrochemistry:
The surface-water samples in the Eastern Nile Delta were collected from five different canals and eleven
different drains (agricultural drains or mixed drains water). The surface water facies display HCO3-mixed
cations (Ca2+/Na+) in the canals water, whereas, Na–Cl facies characterize all mineralized drain water. Dissolution of carbonate minerals by CO2 dissolved in meteoric water and soil water produces HCO3
- and Ca2+. Therefore, surface water samples contain relatively higher bicarbonate and calcium concentrations than drain water (Table 1). The pH value changes little between 8.1and 8.4 in the canals water, and it was even wider (7.6–8.6) in the drain water. The increase of pH value could be explained by the consumption of dissolved CO2 gas by the aquatic plants (Livingstone, 1963), whereas the decrease of this parameter is primarily due to oxidation of organic matter, which could lead to further amounts of HCO3
- and H+ species, according to the following reaction (Kempe ,1984): ---- CH2O + O2 →H+ + HCO3
-. The surface water of canals is fresh (TDS, 290 to 674 mg/l) while being fresh to slightly brackish (TDS,
756- 2497 mg/l) in drains water, (Tables 1and 2). The average concentrations of Ca2+, K+,HCO3- , SO4
2-, Cl-,
11 Int. j. Environ. 1(1): 1-21, 2012
Na+ , TH, SAR and Mg values of the drain water are greater compared with canals water. Also, the mean values of NO3- concentrations are 17.5 and 24.2 mg/l in canals and drains water, respectively, indicating that these waters did not exceed the allowable level given for domestic uses (45 mg/l), except for the sample 7 at Bahr El-Baker drain (81.4mg/l). On the contrary, the concentration of TOC in canal water is considerably low being up to 2046mg/l while rises up to 3972mg/l for drain water. likewise, COD concentration in canal water is 136mg/l and rises up to 750mg/l for drain water, ammonium concentrations of surface water (is 8.6mg/l) for drains water while reduced about 4 times in the canals water (2.41mg/l) exceeding the maximum limits of WHO for drinking water (10, 10 and 0.5 mg/l) respectively. This behavior could be interpreted by the microbiological consumption of nitrate, with the presence of organic matter, according to the following reaction (Kempe, 1984): 5CH2O+ 4NO3
- → 4HCO3-+ CO2 + 2N2 + 3H2O
Surface water is characterized by high Na+/Cl- ratio (>1) with small change between ~1.29 in canals water
and ~1.32 in drain water. For canals water, the ratios of HCO3-/Cl-, SO4
2-/Cl-, Ca2+/Mg2+ and Ca2+/SO42- are also
high (mean 1.31, 0.76, 1.71 and 1.53 respectively) compared to drain water (mean 0.42, 0.74, 1.4 and 0.69 respectively). Conversely, the value of Na+/K+ ratio is higher in drain water (mean 36.97) with respect to canals water (mean 16.76) whereas, the (Ca2+ +Mg2+)/(HCO3
- + SO42-) ratio is similar for both canals and drain water
(~0.8). In general, the water chemistry of group A and group B is nearly similar to that of canals and drain water,
and largely reflects mixing of groundwater with surface water in the southern and central region. whereas, group C reflects further modifications that may be due to recycling, evaporation, ion exchanges and precipitation of carbonates or saline water intrusion in the northern region of the study area. Water type, hydrochemical relations and origin of solutes:
The dissolved species ratio were studied in an attempt to identify the origin of salinity and to separate
mixing mechanisms of freshwater and saline water from the main geochemical processes occurring in the aquifer, such as ion-exchange processes.
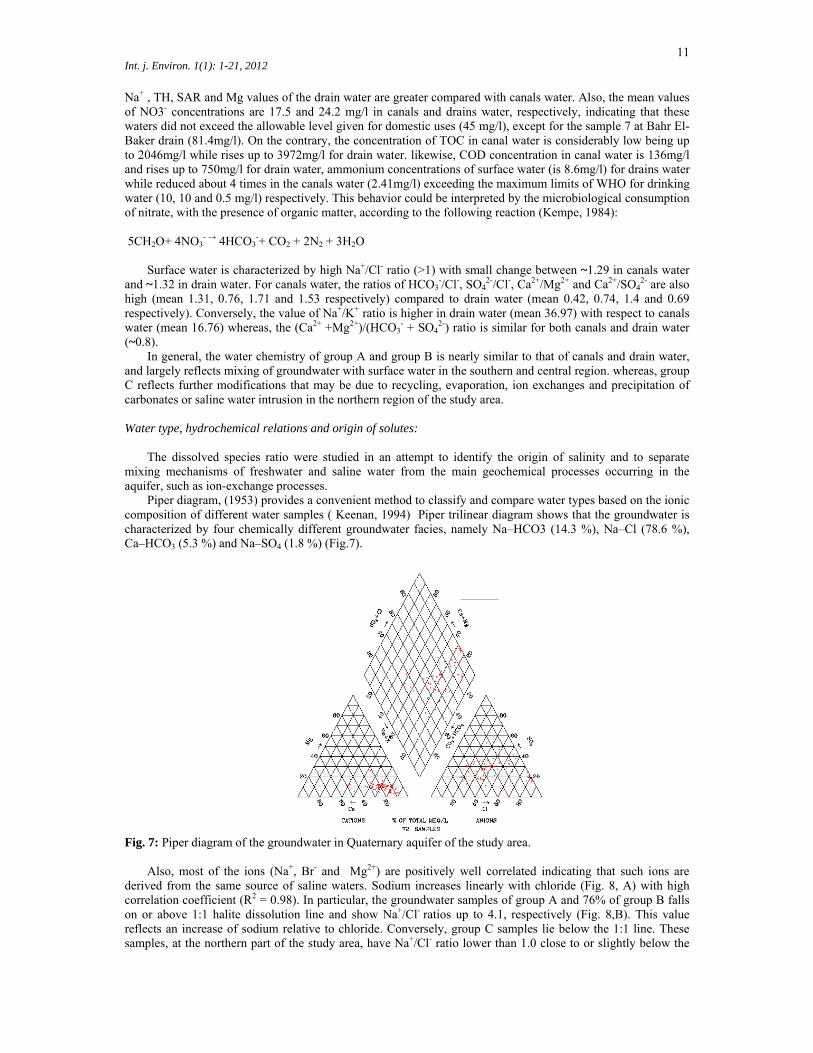
Piper diagram, (1953) provides a convenient method to classify and compare water types based on the ionic composition of different water samples ( Keenan, 1994) Piper trilinear diagram shows that the groundwater is characterized by four chemically different groundwater facies, namely Na–HCO3 (14.3 %), Na–Cl (78.6 %), Ca–HCO3 (5.3 %) and Na–SO4 (1.8 %) (Fig.7).
Fig. 7: Piper diagram of the groundwater in Quaternary aquifer of the study area.
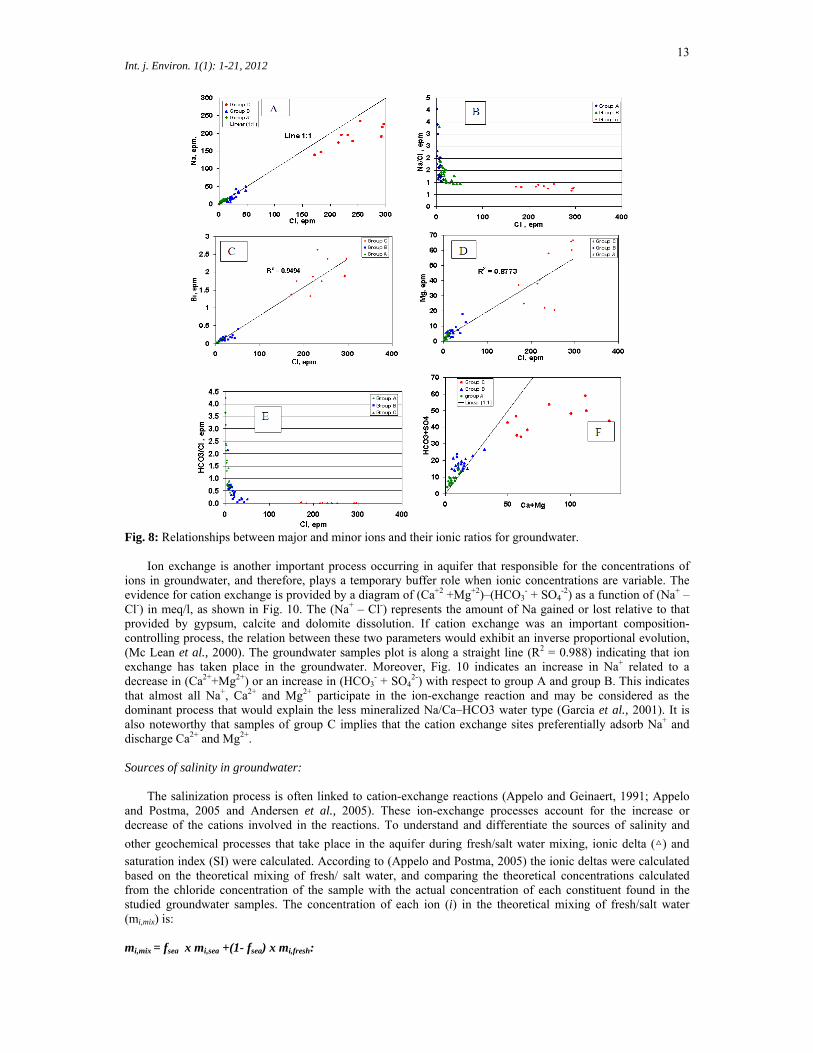
Also, most of the ions (Na+, Br- and Mg2+) are positively well correlated indicating that such ions are
derived from the same source of saline waters. Sodium increases linearly with chloride (Fig. 8, A) with high correlation coefficient (R2 = 0.98). In particular, the groundwater samples of group A and 76% of group B falls on or above 1:1 halite dissolution line and show Na+/Cl- ratios up to 4.1, respectively (Fig. 8,B). This value reflects an increase of sodium relative to chloride. Conversely, group C samples lie below the 1:1 line. These samples, at the northern part of the study area, have Na+/Cl- ratio lower than 1.0 close to or slightly below the

12 Int. j. Environ. 1(1): 1-21, 2012
seawater ratio of 0.86. The decrease of sodium relative to chloride as well as increasing of (Ca2++Mg2+)/ (HCO3-
+ SO42-) ratio (Table 1 and 2) likely predominates the effects of reverse cation exchange activity of Na+ for
Ca2+and Mg2+ on clay fraction of the aquifer material, rather than seawater intrusion. In addition, leaching of salt precipitated through evaporation of surface water and soil moisture can be another dominant process in this context of semi-arid lands.
Since Br- and Cl- are ubiquitous solutes in hydrological systems, both species have often been used as a reliable indicator of the origin of salinity due to its specific composition in various saline sources. In general, the content of bromide in groundwater is low (Hitchon et al., 1999). Nevertheless, high concentrations of this element sometimes occur in groundwater by pollution, interaction with seawater or reaction with evaporite deposits.
A contribution of evaporate dissolution leads to a low Br-/Cl- molar ratio (Cartwright et al., 2006 and Ghabayen et al., 2006) whereas anthropogenic sources give a ratio around 0.0005 for wastewater seepages or around 0.02 for agriculture return flows (Andreasen and Fleck, 1997; Ghabayen et al., 2006 and Vengosh et al., 1999). Finally, seawater has a Br-/Cl- molar ratio around 0.00015 in Mediterranean countries (Jones et al., 1999 and Vengosh et al., 1999). In water located south and middle of the study area, bromide concentration is as low as 0.145 meq/l (group A and group B); on the contrary, its content in waters of group C is high (up to 1.92 meq/l). Plot of Br- and Cl- concentrations, (Fig. 8,C) shows Br- excess relative to Cl- with a strong correlation coefficient (R2 = 0.95). The bromide content increases gradually according to the following sequence: group A →group B → group C along groundwater flowpath suggesting that Br- is released in the direction of groundwater flow. The Br- increase for the most saline samples could be explained by the degradation of organic matter which is known to be a source of Br- (Richter and Kreitler, 1993). Accordingly, intensive agricultural activities and irrigation-water returns to the aquifer are expected to be one of the major salinization sources to the aquifer.
Magnesium, among the major elements in groundwater, can be taken as representative of salt water occurrence, as it is seldom found with similar concentrations in groundwater (Hem, 1992).
In the study area, all magnesium contents are far below those of seawater (110.5 me/l), ranging from 0.88 to 66.6 me/l. The Mg2+ versus Cl- graph (Fig. 8, D) indicates an excess of Mg+2 in the more saline water (group C). This excess may be linked to the flushing of marine formations in the northern part of the study area.
Ca2+/Mg2+ values (Table 1) were all higher than the seawater ratio (0.2). The lowest value of 0.49 and the highest value of 2.4 were found in the group A (south region), whereas, the values of the more saline water, in the northern region, are close to 1.0. According to the interpretation of this index, the water in the study area appears to be of inland origin, because groundwater under marine influence would have values of about 0.2 (Morell et al., 1986) except where other processes such as cationic exchange intervene when the values could be>0.25.
The examination of the relationship between (Ca2+ + Mg2+) with respect to (HCO3-+ SO4
2-) can reveal the importance of carbonate, sulfate and silicate minerals in the dissolution processes. The 1:1 stoichiometry ratio for [Ca2+ + Mg2+] to [HCO3
- + SO42-] should exist if these ions are derived from simple dissolution of calcite,
dolomite and gypsum, then a charge balance should exist between the cations and the anions. As indicated in Fig. 8, E, a deficiency of (Ca2+ +Mg2+) relative to (HCO3
- +SO4 2-) exists in group A and 91% of group B
groundwater samples. Therefore, the excess negative charge of SO4 2- and HCO3
- must be balanced by Na+, the only other major cation, whereas, all the samples of group C are falling below the 1:1 trend, reflecting the requirement of cations from weathering of silicate rocks.
The HCO3-/Cl- values (Fig. 8, F), ranged from 0.005 in group C (northern region) to 4.2 in group A
(southern region). Values of this hydrogeochemical index given for inland waters are between 0.2 and 10 and for seawater between 0.05 and 0.02 (Custodio, 1987). Thus, the value less than 0.05 for the northern region (0.0152), (Table 1) might be explained as the case of marine origin sediments that had not been completely flushed by the water initially saturating them rather than the effect of seawater. Hydrochemical process controlling groundwater chemistry:
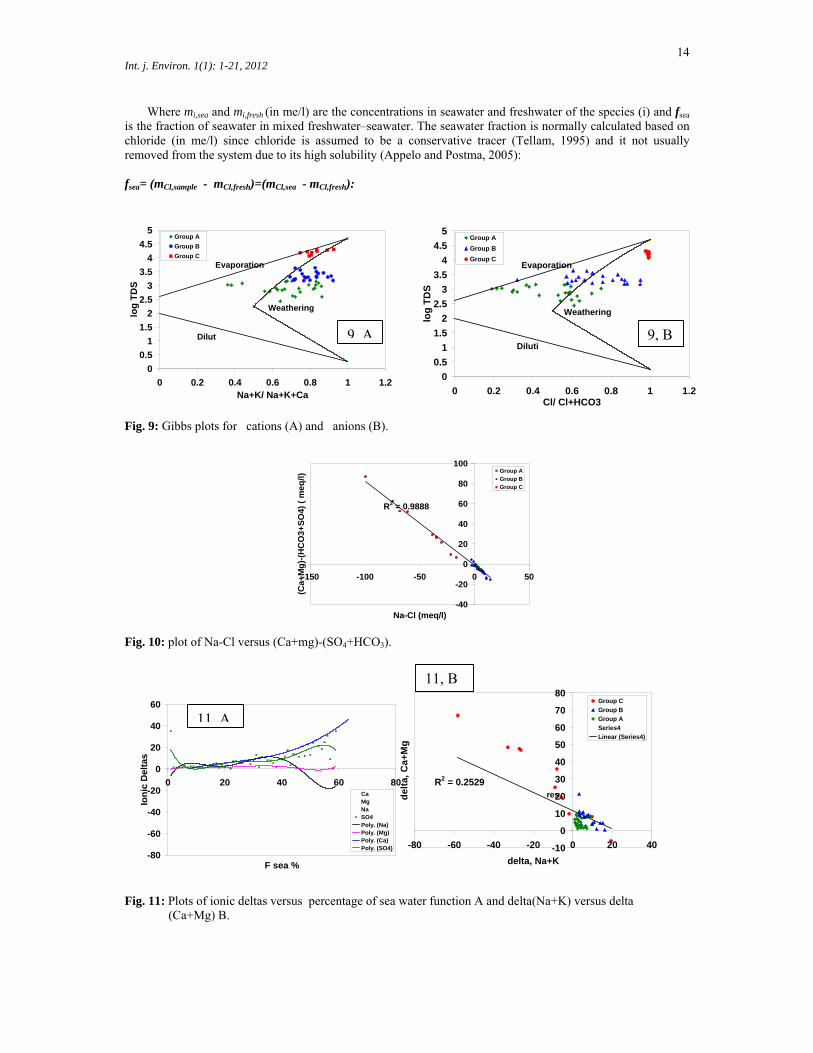
Gibbs diagram (Gibbs, 1970) represents anionic [Cl-/ (Cl- + HCO3
-)] and cationic [Na+/ (Na+ + Ca2+)] relations as a function of the Log (TDS) in the groundwater samples of the Quaternary aquifer. This diagram is widely used to assess the functional sources of dissolved chemical constituents, such as precipitation dominance, rock dominance and evaporation dominance. Figure 9 indicated that groundwater samples for all groups were individually scattered in the rock and evaporation dominance fields. Group A, (fresh water) and group B, (brackish water) show rock dominance, whereas group C shows more evaporation dominance.
Evaporation of water in the unsaturated zone is the main process in the evolvement of groundwater chemical composition. It greatly increases the concentration of ions formed by precipitation and deposition of evaporates that are eventually leached into the saturated zone, leading to high salinity of groundwater.
13 Int. j. Environ. 1(1): 1-21, 2012
Fig. 8: Relationships between major and minor ions and their ionic ratios for groundwater.
Ion exchange is another important process occurring in aquifer that responsible for the concentrations of
ions in groundwater, and therefore, plays a temporary buffer role when ionic concentrations are variable. The evidence for cation exchange is provided by a diagram of (Ca+2 +Mg+2)–(HCO3
- + SO4-2) as a function of (Na+ –
Cl-) in meq/l, as shown in Fig. 10. The (Na+ – Cl-) represents the amount of Na gained or lost relative to that provided by gypsum, calcite and dolomite dissolution. If cation exchange was an important composition-controlling process, the relation between these two parameters would exhibit an inverse proportional evolution, (Mc Lean et al., 2000). The groundwater samples plot is along a straight line (R2 = 0.988) indicating that ion exchange has taken place in the groundwater. Moreover, Fig. 10 indicates an increase in Na+ related to a decrease in (Ca2++Mg2+) or an increase in (HCO3
- + SO42-) with respect to group A and group B. This indicates
that almost all Na+, Ca2+ and Mg2+ participate in the ion-exchange reaction and may be considered as the dominant process that would explain the less mineralized Na/Ca–HCO3 water type (Garcia et al., 2001). It is also noteworthy that samples of group C implies that the cation exchange sites preferentially adsorb Na+ and discharge Ca2+ and Mg2+. Sources of salinity in groundwater:
The salinization process is often linked to cation-exchange reactions (Appelo and Geinaert, 1991; Appelo
and Postma, 2005 and Andersen et al., 2005). These ion-exchange processes account for the increase or decrease of the cations involved in the reactions. To understand and differentiate the sources of salinity and
other geochemical processes that take place in the aquifer during fresh/salt water mixing, ionic delta (△) and
saturation index (SI) were calculated. According to (Appelo and Postma, 2005) the ionic deltas were calculated based on the theoretical mixing of fresh/ salt water, and comparing the theoretical concentrations calculated from the chloride concentration of the sample with the actual concentration of each constituent found in the studied groundwater samples. The concentration of each ion (i) in the theoretical mixing of fresh/salt water (mi,mix) is: mi,mix = fsea x mi,sea +(1- fsea) x mi,fresh:
14 Int. j. Environ. 1(1): 1-21, 2012
Where mi,sea and mi,fresh (in me/l) are the concentrations in seawater and freshwater of the species (i) and fsea
is the fraction of seawater in mixed freshwater–seawater. The seawater fraction is normally calculated based on chloride (in me/l) since chloride is assumed to be a conservative tracer (Tellam, 1995) and it not usually removed from the system due to its high solubility (Appelo and Postma, 2005):
fsea= (mCl,sample - mCl,fresh)=(mCl,sea - mCl,fresh):
Fig. 9: Gibbs plots for cations (A) and anions (B).
Fig. 10: plot of Na-Cl versus (Ca+mg)-(SO4+HCO3).
Fig. 11: Plots of ionic deltas versus percentage of sea water function A and delta(Na+K) versus delta (Ca+Mg) B.
-80
-60
-40
-20
0
20
40
60
0 20 40 60 80
F sea %
Ion
ic D
elta
s
CaMgNaSO4Poly. (Na)Poly. (Mg)Poly. (Ca)Poly. (SO4)
0
0.5
1
1.5
2
2.5
3
3.5
4
4.5
5
0 0.2 0.4 0.6 0.8 1 1.2Cl/ Cl+HCO3
log
TD
S
Group A
Group B
Group C
Diluti
Weathering
Evaporation
0
0.5
1
1.5
2
2.5
3
3.5
4
4.5
5
0 0.2 0.4 0.6 0.8 1 1.2Na+K/ Na+K+Ca
log
TD
S
Group A
Group B
Group C
Evaporation
Weathering
Dilut
R2 = 0.9888
-40
-20
0
20
40
60
80
100
-150 -100 -50 0 50
Na-Cl (meq/l)
(Ca+
Mg
)-(H
CO
3+
SO
4) (
meq
/l)
Group A
Group B
Group C
11, B
R2 = 0.2529
-10
0
10
20
30
40
50
60
70
80
-80 -60 -40 -20 0 20 40
delta, Na+K
del
ta,
Ca+
Mg
Group C
Group B
Group A
Series4
Linear (Series4)
res
11, A
9, A 9, B

15 Int. j. Environ. 1(1): 1-21, 2012
Fig. 12: Plot of saturation index of calcite versus saturation index of dolomite. For each ion i, the difference between the concentration of the theoretical mixing and the measured one
simply represents the concentration resulting from any chemical reaction occurring with mixing: Dmi= mi,sample - mi,mix :
percentage of seawater fraction (fsw %) and A positive △mi indicates the groundwater to be increased for
species i, and a negative △mi indicates decrease compared to a simple non-reactive mixing. In this study, the
ionic delta (△mi) of Na++ K+, Ca2+, Mg2+, HCO3- and SO4
2- were calculated for all groundwater samples in
the study area (Table 3). The various geochemical processes that occur in the groundwater indicated that the process of hydrogeochemical changes in the Quaternary aquifer was complex and displayed a heterogeneous pattern in the studied ions.
The results show high saltwater contribution (Table 3). The aquifer contains high saltwater (up to 63.5 %) in its northern part, whereas the saltwater proportion ranged from 7.3 to 63.5% (mean 26.3%). It has been found that the fractions of saltwater are (mean 16.2 %) for group A, about double 31.2 % for group B and up to about four folds 63.5 % for group C. The most marked pattern could be observed in major cations. Overall, as the
percentage of saltwater increases, the water becomes increasingly in Ca2+ and Mg2+ while Na+ is decreased; △Ca
and △Mg behave in analogous trend, and reveal opposite trend to △Na+ △K+ ,Figure 11, A. The cation evolution
shows two different trends according to the increase of salinity. For the samples containing up to 31.2% saltwater (group A and group B), Ca2+, and Mg2+ are slightly variable (2.9 to 5.1 and -1.5 to 2.5 me/l, respectively) and are accompanied with Na+ Increase from 3.7 to 7.7%. This reveals an increase of cation exchange processes along the flowpath. Nevertheless, the increase of Na+ is more evidenced than the Ca+2 and Mg+2 and suggests that another process affects the Na+ content such as halite dissolution. These observations imply that mineral dissolution is the predominated process in group A and group B water. Samples containing more than 31.2 % salt water (group C) shows high decreases in Na++ K+ (up to -58.1 %) according to the increase of salinity. This variability could be linked with higher increase in Ca2+ up to about 54.1 % according to the increase salinity. For the most saline group (C), high calcium enrichment is accompanied by high sodium depletion. The heterogeneous patterns shown by these cations are most probably due to the direct contact between Na+ highly enriched water (seawater/saline) with Ca2+ highly enriched water (fresh groundwater).
In general, the anions decrease or increase seems to be limited and less important. To clarify the positive
trend of △Ca and △Mg, the △Ca + △Mg is plotted against △Na +△K for all groundwater samples. (Figure 11, B
exhibits quite obvious negative relationship (R2 = 0.92) and firmly confirmed the effect of reverse ion exchange reactions. This could explain the different types of exchange that can occur between groundwater and the clay matrix, (Robertson, 1991).
Saturation indices for equilibrium states of the groundwater:
To better understand the chemical changes that can occur in water as it moves through the ground during its
percolation, movement and storage in the aquifers represent, the key factors in the groundwater chemistry, the chemistry of the water and aquifer materials and the interactions between them are examined. One aspect of such geochemical interactions is the dissolution and precipitation of minerals along flow paths in the groundwater system. The saturation indices (SI) is a measure of the departure from equilibrium of the water with respect to various minerals phases as SI = log (KIAP / KSP), where KIAP is the ionic activity product,
R2 = 0.9746
0
0.5
1
1.5
2
2.5
3
3.5
4
4.5
5
0 0.5 1 1.5 2 2.5
SI, Calcite
SI,
Do
lom
ite
Group A
Group B
Group C

16 Int. j. Environ. 1(1): 1-21, 2012
Table 3: Percentage of seawater fractions, ionic deltas and saturation indices of groundwater Sample
No. ƒsw (%) ∆Na+ ∆K ∆ Ca ∆ Mg ∆ SO4 ∆ HCO3 Calcite Dolomite
Group A (Fresh water) 22* 17.92 2.86 4.562 1.603 3.917 4.983 0.01 26* 28.74 7.07 4.562 3.165 7.204 6.732 1.42 1.28 29* 17.43 7.15 1.485 -0.264 5.320 3.736 1.08 0.94 32 24.77 4.43 4.864 2.545 5.810 7.121 1.41 1.26 44 12.29 3.20 2.359 0.490 2.502 3.737 0.41 0.26 46 17.32 3.10 3.815 1.474 3.936 4.995 1.18 1.03 47 21.58 1.98 6.557 2.154 2.906 7.977 0.95 0.80 49 11.90 2.36 3.401 0.524 1.469 4.139 50 23.01 1.92 5.747 3.541 7.327 4.472 1.15 1.00 51* 14.67 4.44 1.527 1.512 2.958 4.240 1.21 1.07 52 10.71 1.70 2.243 1.284 2.436 3.045 1.15 1.01 55 17.13 3.98 3.453 1.454 2.065 6.178 0.54 0.40 58 14.26 5.68 1.162 0.348 2.621 4.451 0.66 0.57 59 9.71 2.41 1.843 0.586 1.168 3.704 60* 17.96 6.49 0.986 1.591 2.143 6.747 0.54 0.4 61 11.46 1.36 2.721 1.803 1.271 4.306 0.7 0.55 64 10.38 3.83 2.515 -0.901 0.226 4.710 0.50 0.35 65* 7.28 2.48 0.427 0.639 1.174 2.557 0.36 0.22 66 11.61 1.33 3.298 1.329 1.401 4.255 67 14.38 0.97 3.977 2.488 1.697 5.248 68* 17.68 6.55 1.527 0.991 4.871 3.740 1.07 0.93 69 17.81 2.00 2.188 4.651 1.834 7.145 0.69 0.55 70 11.95 4.49 1.304 0.469 1.603 4.091 1.71 1.57 71 33.42 9.06 5.440 2.774 5.517 10.633 2.18 2.03 72 8.83 2.04 2.180 0.443 1.117 3.045 1.57 1.42
Mean 16.17 3.715196 2.966 1.468 2.980 5.040 min 7.28 0.967083 0.427 -0.901 0.226 2.557 max 33.42 9.061394 6.557 4.651 7.327 10.633
Group B (Brackish water) 18* 27.13 3.38 6.972 4.212 11.398 1.167 0.17 0.02 20 35.68 16.19 2.372 -1.824 13.513 5.432 0.34 0.20 21 33.96 7.34 7.227 1.392 13.942 4.051 1.66 1.51 30 32.50 5.29 7.394 3.253 8.768 7.795 1.76 1.62 31 28.68 5.92 4.790 3.107 7.833 7.025 33 28.57 3.22 6.518 3.824 9.013 5.993 2.20 2.05 34 35.11 7.85 5.086 4.168 7.800 10.205 35 27.46 5.55 3.199 4.480 7.755 6.471 0.27 0.12 36 33.77 4.93 7.337 3.073 11.292 7.140 0.89 0.75 37* 40.34 13.89 2.544 1.853 17.359 4.690 0.64 0.5 38 31.76 6.91 5.050 3.512 8.138 8.152 40* 47.39 3.23 11.629 9.757 20.911 1.866 41 40.48 15.25 3.527 1.054 7.716 12.934 45* 26.38 12.07 1.630 -0.628 10.605 2.701 48* 34.16 8.46 4.042 4.206 12.965 4.482 53 27.09 9.84 2.950 1.211 4.274 8.817 1.82 1.63 54* 31.16 10.80 2.274 2.616 11.256 4.213 0.46 0.32 56 18.19 4.06 5.352 -1.334 3.246 6.867 57 25.71 3.04 5.802 3.392 5.119 8.358 0.65 0.50 62 24.48 3.84 7.642 0.894 1.825 10.283 1.51 1.37 63 25.73 9.92 4.103 -0.405 1.712 10.403 1.13 0.98
mean 31.23 7.665916 5.116 2.467 9.354 6.621 min 18.19 3.041127 1.630 -1.824 1.712 1.167 max 47.39 16.18675 11.629 9.757 20.911 12.934
Group C (Saline water) 17 63.51 -8.02 36.960 -1.228 35.052 0.751 19 41.05 -32.83 41.656 6.616 24.721 0.891 23 28.30 -58.18 54.182 12.657 18.593 1.045 24 48.87 -27.01 33.473 14.152 26.793 1.466 25 39.18 -8.98 33.785 -8.722 22.940 0.154 27 22.95 -1.87 29.820 -20.033 12.939 2.095 1.54 1.40 28 35.14 19.39 19.684 -25.670 21.569 0.171 39 54.90 -26.21 34.067 12.682 30.730 3.630 1.66 1.52 42 46.21 9.80 7.825 0.228 24.224 4.131 0.34 0.20 43 34.35 -5.75 13.531 5.744 12.073 8.746 1.66 1.51
mean 41.45 -13.9670 30.498 -0.357 22.963 2.308 min 22.95 -58.1804 7.825 -25.670 12.073 0.154 max 63.51 19.3870 54.182 14.152 35.052 8.746
17 Int. j. Environ. 1(1): 1-21, 2012
KSP is the solubility product, and SI is the saturation index of the concerned mineral. When the saturation indices of minerals are equal to zero, the solution is considered saturated with these minerals. Positive values indicate super-saturation with minerals (precipitation is possible) and negative values indicate under-saturation conditions (dissolution of the mineral is possible). The saturation indices SI) of the major mineral phases in the investigated groundwater samples were calculated using the software package NETPATH for windows, (El-Kadi et al., 2010). The obtained results (Table 2 & Figure 11) reflect that:
Except for 77 and 88 % of group A and group B samples, the SI of calcite and dolomite are close to or above zero confirming that the Ca2+ and Mg2+ increase is due to cation exchange and not to carbonate dissolution. Dolomite or calcite precipitation is likely to occur in the Quaternary aquifer. The most saline group(C) also show calcite supersaturation (SICalcite ~+1). The evolution of calcite and dolomite saturation indices shows a similar trend when plotted against the percentage of seawater fraction along groundwater flowpath (Fig. 12). Such trend shows the usual distribution in groundwater, where mineral saturation is gradually attained along the flowpath as a function of water residence time within the aquifer (Plummer et al., 1990).
Surface water-Groundwater pollution:
From surface water seepage to groundwater, the anthropogenic environmental impacts of sewage water
irrigation on the general groundwater quality will be evaluated according to the variations of these items: 1- Total organic carbon (TOC) 2- Chemical oxygen demand (COD) 3- Nitrate NO3
-
4- Ammonia (NH4)
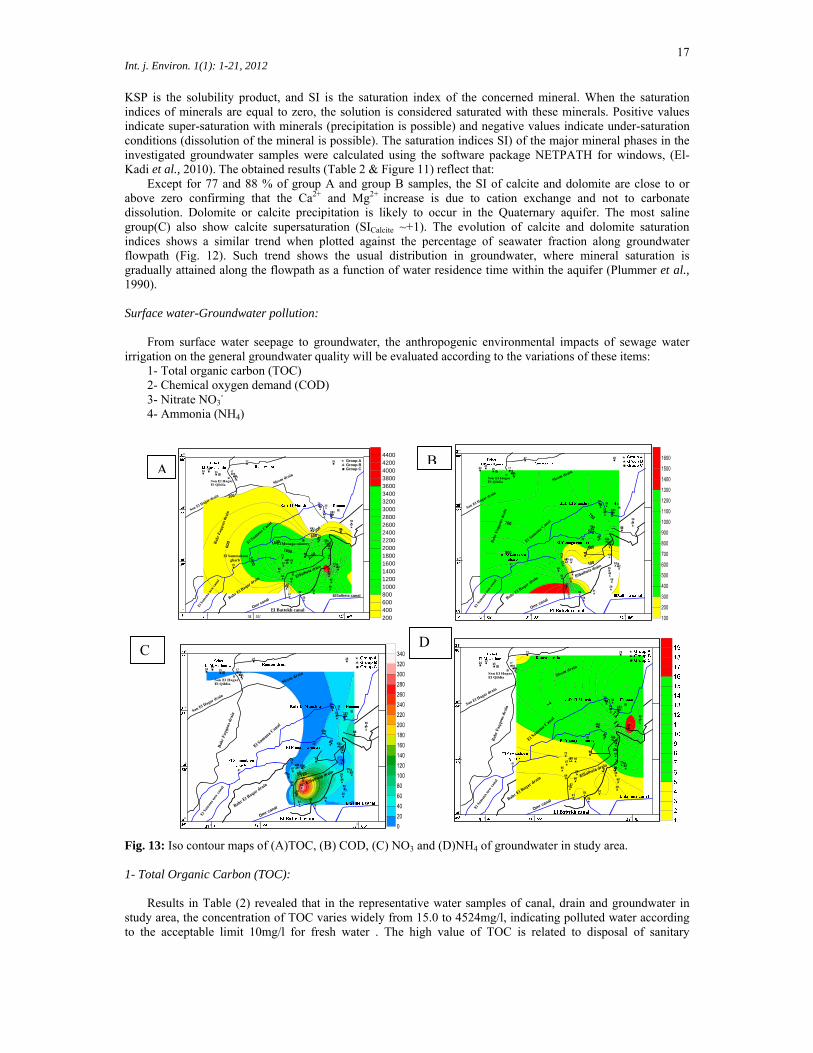
Fig. 13: Iso contour maps of (A)TOC, (B) COD, (C) NO3 and (D)NH4 of groundwater in study area.
1- Total Organic Carbon (TOC): Results in Table (2) revealed that in the representative water samples of canal, drain and groundwater in
study area, the concentration of TOC varies widely from 15.0 to 4524mg/l, indicating polluted water according to the acceptable limit 10mg/l for fresh water . The high value of TOC is related to disposal of sanitary
El Monaga country
31 55'
El Battekh canal
El Sammakeengharb
ElSalheia canal
Group AGroup BGroup C
200400600800100012001400160018002000220024002600280030003200340036003800400042004400
A
C D
B
18 Int. j. Environ. 1(1): 1-21, 2012
wastewater in agricultural canals and drains that infiltrate to such aquifer as well as downward infiltration of excess amount of irrigation water containing fertilizers man used and pesticides, Fig.(13, A)
In canal water, TOC varies from 580 to 2046mg/l with a mean of 1451mg/l while in drain surface water, is changed from 16 to 3972mg/l with a mean of 933mg/l. Also, the concentration of TOC in group A (fresh water) ranges from 49 to 4524mg/l and in group B (brackish water) ranges from 15 to 3089mg/l with a mean of 1032mg/l. On the other hand, in the group C (saline water) TOC ranges from 32-81mg/l with a mean of value 59.2mg/l. This means that, the water of groups A and B are more affected by the seepage of surface water than group C.
2- Chemical Oxygen demand (COD):
The results of the representative waters samples of canal, drain and groundwater have COD values that
vary from 9.7 mg/l to very high values of COD (1607 mg/l) with a mean value of 237mg/l. This means that, all samples have more than the acceptable level of pollution for fresh water (10 mg/l) except Nos. 5 and 8 from canal water, table 2. All water samples of fresh and brackish groundwater have the concentration greater than the saline groundwater due to the intensive drain ago of waste polluted water. This is attributed to excess amount of irrigation water containing organic manures fertilizers and pesticides beside the sewage wastewater and many industrial activities in the city, Fig. (13, B) 3- Nitrogen compounds:
The nitrogen compounds play an important role in many processes that takes place in natural water.
Nitrogen is also one of the basic components of proteins, so it can enter surface water in sewage and industrial wastewater from the breakdown of proteins and other nitrogenous compounds. Nitrogen fertilizers are used extensively in agriculture, and the excess overcrop requirements is mostly leached into drainage water. A-Nitrate content:
The concentration of NO3
- in the water samples of the study area, (canal, drain and groundwater) varies widely. For instances, its content in the groundwater samples ranges from 0.1 to 337.6mg/l with a mean of 47.8mg/l. In canal water samplers, low nitrate concentrations (3.5-37.6 mg/l) with a mean of 14.7mg/l are recorded except for samples Nos. 8 and 13 which have relatively high concentrations (24.3 and 37.6mg/l) but still below the level of pollution (45 mg/l) as in table (2). But, in drain water, the concentration ranges from 3.56- 81.4mg/l with a mean value of 24.2mg/l. On the other hand, the nitrate ion concentration in group A varies from 5.1-337.6mg/l with a mean of 80.5mg/l and in group B ranges from 0.1-81.4mg/l with a mean value of 42mg/l. Conversely, in group C, the concentration of NO3 in the representative groundwater samples is low, Fig. (13, C).
B- Ammonia content:
The concentration of NH4
+ in water samples, (canal, drain and groundwater) ranges from not detected to 21.6mg/l with a mean of 2.8mg/l. In canal water samples, NH4
+ inos have low concentration (1.3-3.6mg/l) with a mean of 2.3mg/l, table (2). But in drain water, the concentration ranges from 2.0- 18.9mg/l with a mean value of 8.6mg/l. The relatively high concentration of NO3+ and NH4
+compared to that of canal water is referred to the excess amount of nitrogen fertilizer and manures used in this cultivated area. On the hand, the NH4
+ ions concentration in group A varies from 0.02- 4.05mg/l with a mean of 1.1mg/l and in group B ranges from 0.008-21.6mg/l with a mean value of 3.47mg/l. Also, in group C, the concentration of NH4
+ ranges from 0.056-3.01mg/l with a mean value of 0.72mg/l. The increases of concentration are confirmed to the groundwater flow from southwest to northeast, Fig. (13, D).
Generally, the high concentration of nitrate ions and ammonia are due to the excess nitrogen manusing and fertilization, seepage of irrigation canals and drains as well as the disposal of sanitary wastewater rich in nitrate content in canals and drains water in some localities. Conclusion:
To improve groundwater quality of the quaternary aquifer of the Eastern Nile Delta and to avoid water
salinization and pollution problems, we recommend that: (1) Drilling of wells in the northern portion of the study area should be minimized, controlled or even
forbidden to avoid highly saline groundwater supply. (2) Treatment processes must be used for sewage and drainage water before irrigation.
19 Int. j. Environ. 1(1): 1-21, 2012
(3) Fertilizers use and additives in the agriculture areas, management must be reduce to prevent or minimized groundwater pollution. So, connecting an advanced sanitary drainage network in the urbanizing areas can solve this problem.
(4)Monitoring both surface and groundwater to detect and prevent the transport of pollution. In short, the results obtained can help in planning, protection and decision- making regarding the
groundwater management of the Quaternary aquifer in the Eastern Nile Delta.
References
American Society for Testing and Materials (ASTM), 2002. Water and environmental technology. Annual book of ASTM standards, U.S.A., Sec. 11, Vol.11.01, and 11.02, West Conshohocken. USA.
Andreasen, D.C. and W.B. Fleck, 1997. Use of bromide:chloride ratio to differentiate potential sources of chloride in a shallow, unconfined aquifer affected by brackish water intrusion, Hydrogeol. J, 5: 17-26.
Andersen, M.S., V. Nyvang, R. Jakobsen and D. Postma, 2005. Geochemical processes and solute transport at the seawater/freshwater interface of a sandy aquifer, Geochem Cosmochem Acta, 69: 3979-3994.
APHA, 1995, 1998. Standard methods for examination of water and waste water, 19th ed. American Public Health Association, Washington, DC,USA 2540C
Appelo, C.A.J. and W. Geinaert, 1991. Processes accompanying the intrusion of salt water. In: Breuck, WD (ed) Hydrogeology of salt water intrusion. A selection of SWIM papers, Int Contrib. Hydrogeol., 11: 291-303.
Appelo, C.A.J. and D. Postma, 2005. Geochemistry, groundwater and pollution, 2nd ed. Balkema, Rotterdam, Netherlands
Arlt, H.A., 1995. A hydrogeological study of the Nile Delta aquifer with emphasis on saltwater intrusion in the northern area. Dissertation, Berlin University, Berlin, Germany.
Cartwright, I., T.R. Weaver and L.K. Fifield, 2006. Cl/Br ratios and environmental isotopes as indicators of recharge variability and groundwater flow: an example from the southeast Murray Basin, Australia, Chem Geol., 231: 38-56.
Chebotarev, I.I., 1955. Metamorphism of natural waters in the crust of weathering. Geochem. et. Gosmochimica Acta, 8: 22-48.
Custodio, E., 1987. Hydrogeochemistry and tracers. In: Custodio E (ed) Groundwater problems in coastal areas studies and reports in hydrology. UNESCO, Paris, France., 213-269.
El-Dairy, M.D., 1980. Hydogeological studies on the eastern part of the Nile Delta using isotope technique. M.Sc. Thesis, Faculty of Science, Azhar University Egypt.
El-Fayoumy, I.F., 1968. Geology of groundwater supplies in the region of the Nile Delta. Dissertation. Cairo University, Egypt.
El-kadi, A.I., N.L. Plummer and p. Aggarwal, 2010. NETPATH-WIN: An Interactive User Version of the Mass-Balance Model, NETPATH." epartment of Geology and Geophysics and Water Resources Research Center, University of Hawaii at Manoa, Honolulu, Hawaii., 96822(808): 956-6331.
El Sayed, E.E., 2000. A Review article on Pleistocene aquifers in Egypt. Drpt. Of Geology, Fac.. Sci., Minia University, Egypt.
Farid, M.S., 1980. Nile Delta groundwater study. Dissertation, Cairo University, Egypt. Fishman, M.J. and L.C. Friedman, 1985. Methods for determination of inorganic substances in water and
fluvial sediments. U.S. Geol. Surv., Book 5, Chapter A1. Open File Report, 85-495, Denver, Colorado, U.S.A.
Garcia, M.G., M. Del Hidalgo, M.A. Blesa, 2001. Geochemistry of groundwater in the alluvial plain of Tucuman province, Argentina. Hydrogeol. J , 9: 597-610.
Geriesh, M.H., 1994. Hydrogeological and hydrogeochemical evaluation for the groundwater resources in the Suez Canal region, Egypt. Ph. D. Thesis, Fac. Sci., Suez Canal Univ. Egypt.
Ghabayen, S.M.S., M. McKee and M. Kemblowski, 2006. Ionic and isotopic ratios for identification of salinity sources and missing data in the Gaza aquifer, J Hydrol., 318: 360-373.
Gibbs, R.J., 1970. Mechanisms controlling world water chemistry. Science, 17: 1088-1090. Hamza, M.S., Aly, A.I.M., Nada, A.A., Awad, M.A. and Swailem, 1988. Estimation of seepage from Ismailia
canal using Iodine-131, Isotope praxis, 24(3): 110-114. Hem, J.D., 1985. Study and interpretation of the chemical characteristics of natural water (3rd ed.), U.S.
Geological Survey Water-Supply, 2254: 263. Hem, J.D., 1992. Study and interpretation of the chemical characteristics of natural waters. US Geological
Survey water supply paper 2254, Reston, USA Hitchon, B., E.H. Perkins and W.D. Gunter, 1999. SOLMINEQ.GW, introduction to ground water
geochemistry. Geoscience Publishing Ltd, Alberta, Canada
20 Int. j. Environ. 1(1): 1-21, 2012
Hussein, A.A.M., 2010. Chemical studies of water resources and their treatment for pollution control using nanotechnology technique in some localities in Eastern Nile Delta –Egypt. Ph.D. Thesis, Faculty of Science, Benha University, Egypt.
Jones, B.F., A. Vengosh, E. Rosenthal and Y. Yechieli, 1999. Geochemical investigations. In: Bear J, Cheng AHD, Sorek S, Quazar D, Herrera I (eds) Seawater intrusion in coastal aquifers. Kluwer, Dordrecht, pp: 51-71.
Keenan, L. and C.W. Fetter, 1994. Hydrogeology Laboratory Manual, Maxwell Macmillan International Edition, USA.
Kempe, S., 1984. Sinks of the anthropogenically enhanced carbon cycle in surface fresh water, J Geophys. Res., 89(D3): 4657-4676.
Khalil, J.B., M.Sh. Diab and S.A. Atta, 1985. Hydrochemical studies on the groundwater of the eastern part of the Nile Delta, Egypt. Annals of the Geological Survey of Egypt, 15: 339-349.
Langmuir, D., 1991. Aqueous environmental geochemistry. Prentice- Hall, New Jersey, USA. Livingstone, D.A., 1963. Data of geochemistry, 6th ed. US Geological Survey professional paper, 440-G, pp:
G1-G64. Mabrook, B., F. Swailem, R. El-Sheikh, and M. El-Diary, 1983. Shallow aquifer parameters and its influence on
ground water flow, Nile Delta, Egypt. In: Australian water resources council conference scenes, 8: Canberra, 187–197. Australia.
Mc Lean, W., J. Jankowski and N. Lavitt, 2000. Groundwater quality and sustainability in alluvial aquifer, Australia. In: Sililoo. et al. (ed) Groundwater, past achievement and future challenges. Bolkema, Rotterdamm, 567–573.the Netherlands
Morell, I., J. Me´dina, A. Pulido and R. Fernandez-Rubio, 1986. The use of bromide and strontium ions as indicators of marine intrusion to the aquifer of Torreblanca (Castellon, Spain). In: Ninth salt water intrusion meeting, delft, pp: 629-640.
Nada, A.A., 1984. Isotopic and hydrochemical studies on the groundwater of the eastern part of the Nile delta. Dissertation fac.jci, Cairo University, Egypt.
Piper, A.M., 1953. A graphic representation in the geochemical interpretation of groundwater analysis. American Geophysical Union Transactions, U.S.A., 25: 914-923.
Plummer, L.N., J.F. Busby, R.W. Lee and B.B. Hanshaw, 1990. Geochemical modeling of the Madison aquifer in part of Montana, Wyoming, and South Dakota, Water Resource Res., 26: 1981-2014.
Rainwater, F.H. and L.L. Thatcher, 1960. Methods for collection and analysis of water samples U.S. Geol. Survey. Water Supply. Paper No.1454, U.S.A., 301.
Richter, B.C. and C.W. Kreitler, 1993. Geochemical techniques for identifying sources of groundwater salinization. CRC Press, Boca Raton.
RIGW/IWACO, 1988. Identification of policy options groundwater development in the eastern Nile Delta Technical Note 70-120-88-06, Project Development and Management of Groundwater Resources in the Nile Valley and Delta, Cairo. Egypt.
RIGW-IWACO, 1992. Hydrogeological in Map of Egypt, 1:2000, 000.n Research Institute for Groundwater, Cairo, Egypt.
Robertson, F.N., 1991. Geochemistry of groundwater in alluvial basins of Arizona and adjacent parts of Nevada, New Mexico and California. US Geol. Surv. Prof. pp: 1406–C.
Salem, W.M., 1996. Application of isotopic and hydrochemical techniques to study groundwater in the Eastern Nile Delta and assessment of pollution in Lake Manzala. Dissertation, Fac.Sci, Cairo University, Egypt.
Sallouma, M., 1983. Hydrogeological and hydrochemical studies east of the Nile Delta. Dissertation, Fac.Sci, Ain Shams University, Egypt.
Serag el Din, H.M.A., 1989. Geological, hydrogeological and hydrological studies on the Nile Delta Quaternary aquifer. Dissertation, Fac.Sci, Mansoura University, Egypt.
Shata, A. and I. El-Fayoumy, 1969. Remarks on the Geological structure of Nile Delta. Proc., Hydrology of the Deltas of large Rivers, UNESCO, Bucharest, Romania.
Shata, A., I.F. El-Fayoumy, 1970. Remarks on the hydrology of the Nile Delta.In: Proceedings of Hydrology of Delta Symposium, UNESCO, Vol. II.
Tantawi, M.A., 1998. Hydrogeochemical and isotopic assessment of the Quaternary aquifer in the Eastern Nile Delta, Egypt. El Minia Science Bulletin., 11(1): 17-46.
Tellam, J.H., 1995. Hydrochemistry of the saline groundwaters of thelower Mersey Basin Permo-Triassic sandstone aquifer, UK. J Hydrol., 165: 45-84.
Vengosh, A., A.J. Spivack, Y. Artzi and A. Ayalon, 1999. Geochemical and boron, strontium, and oxygen isotopic constraints on the origin of the salinity in groundwater from the Mediterranean coast of Israel. Water Resour. Res., 35: 1877-1894.
21 Int. j. Environ. 1(1): 1-21, 2012
World Health Organization (WHO), 1996. Guidelines for drinking water quality. 2nd ed., Vol.2, Health criteria and other supporting information, 1996 (.940-949) and Addendum to Vol.2 1998 (.281-283) Geneva, Switzerland
Zaghloul, M.G.E.D., 1958. Flow distribution through the ground-water aquifer of the NileDelta. Dissertation, Fac.Sci, Alex. Uni., Egypt.