Embed Size (px)
Citation preview

REPUBLIC OF KENYA
THE NATIONAL TREASURY
POST-ELECTION ECONOMIC AND FISCAL REPORT
FEBRUARY2018
II
© Post-Election Economic and FinancialReport (PEFR) 2018
To obtain copies of the document, please contact:
Public Relations Office
National Treasury
Treasury Building
P. O. Box 30007
00100 City Square
NAIROBI, KENYA
Tel: +254-20-252-299
Fax: +254-20-341-082
The document is also available on the internet at: www.treasury.go.ke

III
Foreword
This Post-Election Economic and Fiscal report has been prepared when the global economic prospects are improving from a slump experienced in 2016 which was the lowest since the financial crisis. In emerging market and developing economies, activity is picking up causing upward revision of the world economic growth to 3.9 percent in 2018. These world developments prospects together with renewed investor confidence following successful elections bode well for accelerated growth prospects in Kenya.
In the last five years, the Government managed to maintain macroeconomic stability creating a conducive environment for investment and business prosperity. As a result, the economy expanded at an
average rate of 5.5 percent per year in the last five years (2013 - 2017) outperforming the average growth rate of 4.7 percent in the 2008 to 2012 and 5.2 percent in the period 2003-2007. The economy generated an average of 817,000 new jobs per year in the period 2013-2017, up from 656,500 jobs per year in the period 2008-2012. Inflation on the other hand remained low and within target following implementation of conducive monetary and fiscal policies. Similarly, interest rates remained low and stable while the exchange rate has remained competitive with less volatility as compared with the preceding period 2008-2012.
On infrastructure, the movement of goods and people around the country has improveddue to expansion of roads, railway, seaports and airports. The Government completed construction of Phase 1 of the Standard Gauge Railway (SGR) (Mombasa - Nairobi) in 2017 and has embarked on the construction of Phase 2A (Nairobi – Naivasha). The railway has significantly reduced transportation costs and eased the movement from Nairobi to Mombasa. Further on infrastructure, by the end of 2017 more than 6.1 million Kenyans had been connected to electricity compared to 2.3 million Kenyans connected in 2013.
Specific targeted policies and reforms have been implemented in most of the economic sectors that include expanding access to subsidized fertilizer and seeds to farmers to increase lands productivity, earn more incomes and make Kenya food secure. Incentives in the manufacturing sector include creation of industrial clusters, enactment of laws for Special Economic Zones, improving ease of doing business and expanding access to electricity.
On the social services, the Government equipped hospitals with specialized medical equipment, and expanded access to maternal health care in all public hospitals. Under the education sector, the Government increased capitation and abolished examination fees for both standard eight and form four candidates. The Government also provided free primary education, expanded the Digital Learning Program and more recently provided for free day secondary school education. In addition, thousands of orphans and vulnerable children, people living with disabilities and the elderly in our society continue to receive cash transfers through the social safety net program.
HENRY K. ROTICH, EGH CABINET SECRETARY FOR THE NATIONAL TREASURY

IV
Statement by the Permanent Secretary/National Treasury
This Post-Election and Economic and Financial Report (PEFR) is published in accordance with Section 27 of the Public Finance Management Act, 2012 which requires that the National Treasury arranges to publish a Post-Election Economic and Fiscal update not later than four months after the polling day of the General Election.
The Post-Election Economic and Fiscal update which gives the followingdetail all election related spending including:-
• direct election expenses such as those for the Independent Election and Boundaries Commission (IEBC) for the cost of elections and election materials;
• indirect election expenses such as allocations to police and security forces for the election year; and
• any other expenses related to the election specified in regulations or instructions.
In this regards, the National Treasury has prepared this report in accordance with the Public Finance Management Act, 2012. This provides the economic and fiscal updates with:-
• all policy decisions with material economic or fiscal implication that the Government made before the day on which the contents of the economic and fiscal updates were finalized;
• all other circumstances with material economic and fiscal implications of which the National Treasury was aware before those days; and
• a confirmation that the economic and fiscal update were prepared using the best professional judgment and information available before the economic and fiscal update were finalized.
The National Treasury accept overall responsibility for the integrity of the disclosures contained in this Update, and the consistency of the update information in accordance with the requirements of the Public Finance Management Act, 2012.
DR.KAMAU THUGGE, CBS PRINCIPALSECRETARY/ NATIONAL TREASURY

- 1 - | P a g e
Table of Contents Foreword ............................................................................................................................................... III
Statement by the Permanent Secretary/National Treasury ..................................................................... IV
Table of Contents ................................................................................................................................ - 1 -
List of Abbreviations ............................................................................................................................ - 3 -
CHAPTER ONE ..................................................................................................................................... - 4 -
1.0 Introduction .................................................................................................................................. - 4 -
1.1 Background .......................................................................................................................... - 4 -
2.0 Economic Developments ............................................................................................................... - 4 -
2.1 Global and Regional Economic Developments ............................................................................ - 4 -
2.2 Inflation ............................................................................................................................... - 6 -
2.3 Balance of Payments ............................................................................................................ - 7 -
2.4 Foreign Exchange Reserves .................................................................................................. - 7 -
2.5 Exchange Rates .................................................................................................................... - 7 -
2.6 Money and Credit ................................................................................................................ - 8 -
2.7 Interest Rates ....................................................................................................................... - 8 -
2.8 Capital Markets .................................................................................................................... - 8 -
3.0 Fiscal Developments ...................................................................................................................... - 9 -
3.1 Revenue ............................................................................................................................... - 9 -
3.2 Expenditure ........................................................................................................................ - 10 -
3.3 Fiscal Outturn .................................................................................................................... - 11 -
3.4 Financing ........................................................................................................................... - 11 -
3.4.1 External Financing ............................................................................................... - 11 -
3.4.2 Domestic Financing ........................................................................................ - 12 -
4.0 Macroeconomic Outlook ............................................................................................................. - 12 -
4.1 Economic Outlook .............................................................................................................. - 12 -
4.2 The Big Four Economic Plan ..................................................................................................... - 14 -
4.3 Enablers for the “The Big Four” Economic Plan ........................................................................ - 15 -
CHAPTER TWO .................................................................................................................................. - 18 -
5.0 Election Expenditure .............................................................................................................. - 18 -

- 2 - | P a g e
5.1 Overall Election Budget ...................................................................................................... - 18 -
5.2 Independent Electoral and Boundaries Commission (IEBC) ................................................. - 18 -
5.3 State Department for Interior ............................................................................................ - 19 -
5.4 Office of the Registrar of Political Parties ........................................................................... - 20 -
5.5 Direct Election Expenses .................................................................................................... - 20 -
5.6 Indirect Election Expenses .................................................................................................. - 20 -
CHAPTER THREE ................................................................................................................................ - 22 -
6.0 Conclusion ................................................................................................................................... - 22 -
7.0 Appendices ............................................................................................................................ - 23 -
Appendix 1: Summary of Expenditure forfor the Elections ............................................................ - 23 -
Appendix 2: Direct Expenses for for the Elections .......................................................................... - 24 -
Appendix 3: Indirect Expenses forfor the Elections ........................................................................ - 24 -
Appendix 4: Ministerial Expenditures, Period Ending 31st December, 2017 ................................... - 25 -
Appendix 5: Medium Term Macroeconomic indicators .................................................................. - 26 -

- 3 - | P a g e
List of Abbreviations
A-I-A Appropriation-In-Aid
BPS Budget Policy Statement
BN Billion
BROP Budget Review and Outlook Paper
COMESA Common Market of Eastern and Southern Africa
EAC East Africa Community
FY Financial Year
GDP Gross Domestic Product
ICT Information, Communication and Technology
IEBC Independent Electoral and Boundaries Commission
IFMIS Integrated Financial Management Information System
KSh. Kenya Shilling
NDA Net Domestic Assets
NIS National Intelligence Agencies
PAYE Pay-As-You-Earn
PEFR Post-Election and Economic and Financial Report
PFM Public Financial Management
TVET Technical and Vocational Education and Training
SGR Standard Gauge Railway
SMEs Small Medium Enterprises
US United States
USD US Dollar
VAT Value Added Tax

- 4 - | P a g e
CHAPTER ONE
1.0 Introduction
1.1 Background
1. This publication is based on the Public Financial Management Act (PFMA), 2012that requires the National Treasury to arrange to be published a Post-Election Economic and Fiscal Report (PEFR) not later than four months after the polling day for any general election. Further, it requires that such reports shall detail all election related spending,both direct and indirect, and shall be accompanied by a statement stating any policy decisions, circumstances with material economic or fiscal implications and a confirmation that the economic and fiscal update were prepared using the best professional judgment.
2. The National Treasury coordinated the preparation of this report through engagement of the Government entities that were involved in the management and execution of the August 2017 General Election and the October 2017 Presidential Repeat Election.
3. The objective of the PEFR is to provide a review of election related expenditure and evaluate economicperformance and how this impacted on the financial objectives and fiscal responsibility principles set out in the 2017 Budget Policy Statement (BPS). It alsoseeks to promote transparency and accountability in the financing of the general elections as well as how this has impacted the economic performance of the country.
4. This update is organized as follows: Section I gives the background,Section II highlights the recent economic and political developments and outlook in the country focusing on the policy decisions and other circumstances that have economic and fiscal implications. Section III provides an overview on budget implementation with a detailed account of all the direct and indirect election-related expenditures, while Section IV provides the conclusion.
2.0 Economic Developments
2.1 Global and Regional Economic Developments
5. Global economic growth is projected to rise to 3.9 percent in 2018 up from the estimated 3.7 percent in 2017 and 3.2 percent in 2016. The rise is supported by a broad-based upward revisions in the euro area, Japan, emerging Asia, emerging Europe, and Russia—where growth outcomes in the first half of 2017 were better than expected. The upward revision in these countries more than offset downward revisions for the United States and the United Kingdom.
6. In advanced economies, growth isprojected at 2.3 percent in 2018 and 2017, up from 1.7 percent in 2016 reflecting stronger activity in the United States, Canada, the Euro area, and Japan. In particular, the US economy is projected to expand to 2.7 percent in 2018 up from the

- 5 - | P a g e
estimated 2.3 percent in 2017 and 1.5 percent in 2016, as a result of supportive financial conditions and strong business and consumer confidence.
7. Among emerging market and developing economies, higher domestic demand in China and continued recovery in key emerging market economies supported growth in the first half of 2017. Growth in emerging and developing economies is projected to increase from 4.4 percent in 2016 to 4.7 percent in 2017 and 4.9 percent in 2018. The projected growth is driven primarily by the strengthening of growth in commodity exporters; a gradual increase in India’s growth rate and a lower but still high trend growth rate in China.
8. The broad-based slowdown in sub-Saharan Africa is easing and growth was expected to improvefrom 1.4 percent in 2016 to 2.6 percent in 2017 and further to 3.4 percent in 2018, partly supported by a recovery in growth of larger commodity exporters such as Nigeria and South Africa. In addition, the easing of drought conditions in the Eastern and Southern Africa have contributed to the positive outlook. However, downside risks have increased following policy uncertainties and delays in the implementation of policy adjustments in Nigeria and South Africa. Many of the faster growing economies in sub Saharan African economies continue to be driven by public spending, with debt levels and debt service costs rising.
9. In the East African Community (EAC) region, economic growth was estimated to stabilize at 5.4 percent in 2016 and 2017, a slowdown from a 6.1 percent growth in 2015. The prolonged effect of drought experienced in 2016 and continued in 2017, dampened agricultural output and GDP growth in Uganda, Tanzania and Rwanda. In addition, there was a slowdown in credit growth across countries in the region, which further reduced the growth. Further, insecurity and political tensions continued to constrain economic activities in countries such as Burundi, Somalia, and South Sudan. In 2018, economic growth for this region is projected to increase to 5.9 percent supported by a stable macroeconomic environment, ongoing infrastructure investments, and strong private consumption.
10. The Domestic economy remained resilient in 2017 due to a largely stable macroeconomic environment and the massive public infrastructure investments undertaken by the Government. According to the second quarter of the FY 2017/18 Quarterly Economic and Budgetary Review (QEBR), the economy grew by 4.4 percent in quarter 3, 5.0 percent in Quarter 2, and 4.7 percent in Quarter 1. However, uncertainty associated with political environment during the General Election coupled with effects of adverse weather conditions slowed down performance of most sectors of the economy.
11. Growth in the third quarter of 2017 was supported by strong activities in information and communication (9.0 percent); real estate (8.9 percent) and accommodation and restaurant (7.3 percent). However, growth was somewhat constrained by subdued performances in manufacturing, electricity and water supply, construction and financial intermediation sectors.

- 6 - | P a g e
12. Agricultural sector recovered in the third quarter of 2017 following improved weather conditions and grew by 3.1 percent representing 0.6 percentage points to GDP growth compared to a growth of 1.3 percent in the second quarter of 2017, this growth was however a slowdown from a 3.8 percent growth (0.7 percentage points to GDP growth) in the third quarter in 2016. The performance of the sector was supported by improvement in production of tea and horticultural products thereby reducing the effect of underperformances of the other sub-sectors on the overall growth of the sector.
13. The non-agricultural sector remained vibrant despite the subdued performance in the third quarter of 2017 largely on account of the heightened political activity. The sector grew by 5.0 percent in the third quarter of 2017 compared to a growth of 6.5 percent in the same quarter in 2016.
14. Services remain the main source of growth. It grew by 5.3 percent in the third quarter of 2017 compared to 6.6 percent in the same quarter in 2016. The slowdown was reflected in the subdued performance in accommodation and restaurant (7.3 percent), transport and storage (5.4 percent) and financial and insurance (2.4 percent).
15. Information and communication services maintained a strong growth of 9.0 percent in the third quarter of 2017 compared to a growth of 8.8 percent in the same quarter in 2016. This reflected strong demand (both households and firms) for telecom services, availability of affordable ICT gadgets and internet connectivity provided by the mobile and internet service providers, efforts by banks to lower costs by deploying new technologies and the ongoing ramping up of mobile banking operations.
16. Services contributed 2.8 percentage points to real GDP growth in the third quarter of 2017 largely supported by the Real Estate (0.8 percentage points) and Transport and Storage (0.4 percentage points) and Information and communication (0.3 percentage points).
17. The performance of Industry slowed to a growth of 3.3 percent in the third quarter of 2017 compared to a growth of 5.5 percent in the same quarter of 2016 following subdued performance of manufacturing (2.1 percent), electricity and water supply (4.8 percent) and construction (4.9 percent). The slow growth in the sector was partly attributed to the extended electioneering period, prompting investors to scale down construction activities. It, however, accounted for 0.6 percentage points to growth during the quarter largely driven by the Construction Sector which contributed 0.3 percentage points to growth.
2.2 Inflation
18. Overall month on month inflation declined below the Government’s 5.0 percent medium term target for the first time since June 2013. Inflation declined to 4.5 percent in December 2017 and 4.5 percent in December 2017 from 5.7 percent in October 2017. The decline was largely on account of continued decline in prices of key food items such as potatoes, kales, cabbages,

- 7 - | P a g e
oranges and mangoes due to favourable weather conditions. In the twelve month to December 2017, the average annual inflation rate was 8.0 percent compared to 6.3 percent in the same period in 2016.
2.3 Balance of Payments
19. The overall balance of payments position improved to a surplus of US$ 163.6 million (0.2 percent of GDP) in the year to December2017 from a deficit of US$ 129.0 million (0.2 percent of GDP) in the year to December2016 due to the improvement in the financial account that more than offset the widening current account deficit.
20. The current account balance was at a deficit of US$ 5,095.2 million (7.0 percent of GDP) in the year to December2017 from a deficit of US$ 3,652.8 million (5.2 percent of GDP) in the year to December2016. This reflects the widening of the trade account balance and the increased payments to foreign investors (due to high interest payments) despite an improvement in the secondary income account balance particularly increased workers’ remittances.
21. Flows in the Financial Account increased to US$ 5,300 million in December2017 compared with US$ 4137.4 million in December2016, with the surplus reflecting higher liabilities compared to assets. The financial inflows were mainly in form of Foreign Direct Investments and other investments which stood at US$ 379.9 million and US$ 5,863.6 million, respectively in December2017. Other investment inflows mainly included foreign financing for Government infrastructure projects.
2.4 Foreign Exchange Reserves
22. The banking system’s foreign exchange holding improved to US$ 9,645.7 million in December2017 down from US$ 9,587.5 million in December 2016. The official foreign exchange reserves held by the Central Bank remained strong at US$ 7,331.9 million (4.9 months of import cover) in December 2017 compared with US$ 7,572.9 million (5.0 months of import cover) in December2016 while commercial banks holdings was at US$ 2,313.8 million in 2017 from US$ 2,014.6 million in 2016.
2.5 Exchange Rates
23. The Kenya Shilling exchange rate remained broadly stable against major international currencies. As at December 2017, the shilling exchange rate against the Dollar was at KSh 103.1compared toKSh 102.1 in December 2016. Against the Euro and the Sterling pound, the Shilling weakened to KSh 122.0 and KSh 138.2 in December 2017 from KSh107.7 and KSh127.7 in December 2016, respectively.
24. The Kenya Shilling exchange rate continued to display relatively less volatility compared to most sub-Saharan Africancurrencies. This stability reflected resilient receipts from tea and horticulture despite lower export volumes due to adverse weather conditions in the first quarter

- 8 - | P a g e
of 2017. Additionally, receipts from tourism, coffee exports and Diaspora remittances remained strong during this period.
2.6 Money and Credit
25. Broad money supply, M3, grew by 9.5 percent in the year to December2017 compared to a growth of 3.7 percent in the year to December2016. The growth in M3 was largely on account of an increase of net domestic credit to the Government and the improvement in the contribution of net foreign assets.
26. Net Foreign Assets (NFA) of the banking system in the year to December2017 contracted by 8.1 percent from a growth of 0.8 percent over a similar period in 2016. The contraction in the NFA of the Central Bank is attributed to government payments and debt servicing while a pickup in growth of the NFA by other banking institutions is on account of decreased deposit holdings by banks abroad and other accounts payable
27. Meanwhile, net Domestic Assets (NDA) improved to a growth of 9.9 percent in the year to December2017 from the growth of 4.3 percent over a similar period in 2016. The pickup in growth in 2017 is due to an improvement in the growth of net domestic credit. Domestic credit improved to an annual growth of KSh225.1 billion (7.6 percent) in the year to December2017 compared to a growth of KSh179.3 billion (6.4 percent) in the year to December2016. The improvement reflects increased lending to the Government and private sector.
28. Private sector credit increased to 2.4 in December 2017 from from 2.0 percent in October 2017 and 1.7 percent in September 2017, reversing the downward trend witnessed since August 2015. However, this was a slowdown compared to the 4.1 percent growth in December2016. The real estate, manufacturing, trade, consumer durables and private households have continued on a net basis to receive credit flows from the banking sector since January 2017.
2.7 Interest Rates
29. Interest rates remained stable and low in the period December 2016 to December 2017. During this period, the policy rate (Central Bank Rate) was retained at 10.0 percent to anchor inflation expectations. The interbank rate has remained low at 7.3 percent in December 2017compared to5.9 percent in December 2016 due to ample liquidity in the money market, while the 91-day Treasury bill rate declined to 8.0 percent from 8.4 percent over the same period. The 182 day and the 364 day Treasury bills averaged 10.6 percent and 11.1 percent in December 2017 from 10.5 percent and 11.0 percent in December 2016, respectively.
30. The interest rate spread narrowed to 5.7 percent in October 2017 from 5.9 percent in October 2016 with the Commercial Banks’ average lending interest stabilizing at 13.7 percent over the same period. Meanwhile, the average commercial banks’ deposit rate increased to 8.0 percent in October 2017 from 7.8 percent in October 2016. Comparatively, Kenya has the lowest lending rates among the East African countries.

- 9 - | P a g e
2.8 Capital Markets
31. Activities at the stock market picked up in December 2017. The NSE 20 Share Index improved to 3,712 points in December 2017 from 3,157 points in December 2016 while Market Capitalization improved to KSh2,522 billion from KSh1,902 billion over the same period
3.0 Fiscal Developments
3.1 Revenue
32. By the end of December 2017, total cumulative revenue including A-I-A collected amounted to KSh 709.4 billion against a target of KSh 777.7 (second QEBR 2017/18). The performance was below target by KSh 68.3 billion. Ordinary revenue collection was KSh 656.9 billion against a target of KSh 701.7 billion an under performance of KSh 44.8 billion. Cumulative ministerial A-I-A recorded an under performance of KSh 23.5 billion for the period under review, reflecting under reporting by the ministries’ expenditure return for the period under review. However, Revenue collection increased by 5.2 per cent when compared to the same period in FY 2016/17.
33. As a proportion of GDP, the total cumulative revenue and grants in the period under review amounted to 8.29 per cent compared to 8.88 per cent in the corresponding period of the FY 2016/17. External grants amounted to KSh 7.8 billion against a target of KSh 25.4 billion, representing an under performance of KSh 17.6 billion.
34. The combined effect of the revenue and expenditure performance at end of December 2017, resulted to an overall fiscal deficit (including grants), of KSh 209.2 billion against a targeted deficit of KSh 226.2 billion. This deficit was financed through net foreign borrowing of KSh 24.1 billion, net domestic financing of KSh 183.6 billion and other domestic receipts of KSh 1.6 billion.
35. FY 2017/18 budget projection has been reviewed to reflect revenue performance by end December 2017 and to take into account expenditure rationalization necessitated by the accommodation of the emerging priorities and salary and election related expenditure pressures.
36. In the revised fiscal framework revenues are projected at KSh 1,643.1 billion or 19.0 percent of GDP from the budget level of KSh 1,704.5 billion or 19.6 percent of GDP in FY 2017/18. Total expenditures and net lending are projected at KSh 2,323.1 billion or 26.8 percent of GDP.
37. The deficit, inclusive of grants, is therefore projected at KSh 620.8 billion (equivalent to 7.2 percent of GDP). Borrowing from the domestic market is projected at KSh 293.8 billion, external borrowing at KSh. 323.2 billion and other domestic receipts at KSh 3.8 billion.

- 10 - | P a g e
3.2 Expenditure
38. The total expenditure and net lending for the period under review amounted to KSh 907.0 billion, against a target of KSh 1,029.3 billion. The shortfall of KSh 122.3 billion was attributed to lower absorption recorded in both recurrent and development expenditures by the National Government and County Governments. Recurrent expenditure for National Government amounted to KSh 629.7 billion (excl. KSh 17.4 billion for Parliament and Judiciary), against a target of KSh 594.4 billion, with underperformance mainly recorded in wages and salaries, pension and A-I-A which accounted for KSh 8.2 billion, KSh 8.6 billion and KSh 15.3 billion respectively.
39. Foreign interest payments amounted to KSh 40.2 billion, compared to KSh 25.2 billion in the same period of the FY 2016/17. The domestic interest payments totalled KSh 114.6 billion, which was higher than KSh 100.1 billion paid in the corresponding period of the previous financial year.
Table 1: Expenditure and Net Lending, Period Ending 31st December, 2017 (KSh Million)
Source: National Treasury
40. The total cumulative ministerial and other public agencies expenditure was KSh 638.0 billion against a target of KSh 899.0 billion (Table 1). Recurrent expenditure was KSh 465.9 billion against a target of KSh 590.6 billion, while development expenditure was KSh 172.1 billion against a target of KSh 308.5 billion. The percentage of total expenditures to the target was 71.0 per cent, while the percentage of total expenditures to the target for recurrent and development were 78.9 per cent and 55.8 per cent respectively, as at the end of the period under
2016/2017
Actual
Actual Targets
1. RECURRENT 520,361 629,666 594,402 35,264 21.0
Domestic Interest 100,088 114,630 97,057 17,573 14.5
Foreign Interest 25,210 40,215 41,279 (1,064) 59.5
Pensions 29,984 29,860 38,412 (8,552) (0.4)
Wages and Salaries 155,742 187,383 195,630 (8,247) 20.3
-
Operation and Maintence 209,337 257,579 222,025 35,554 23.0
O/W :Appropriation-in-Aid 36,637 39,724 54,994 (15,270) 8.4
-
2. DEVELOPMENT 274,744 175,262 258,185 (82,923) (36.2)
Development Pronects (Net) 152,831 123,295 140,603 (17,308) (19.3)
Payment of Guaranteed Loans 1,283 1,703 1,333 370 32.7
Appropriation-in-Aid 120,630 48,821 116,249 (67,428) (59.5)
3. County Governments 116,252 84,671 148,486 (63,815) (27.2)
4. Parliamentary Service 11,927 11,747 15,474 (3,727) -
5. Judicial Service 5,226 5,619 6,373 (754) -
6. Equalization Fund - 1,443 3,858 (2,415) -
7. CF - 0 2,500 (2,500) -
TOTAL EXPENDITURE 928,540 906,965 1,029,278 (122,313) (2.3)
2017/18
Deviation % Growth

- 11 - | P a g e
review. Out of the Total expenditure recurrent was 73.0 per cent and Development was 27.0 Per cent. As indicated earlier, the discrepancy between actual and target expenditures partly reflect the non-capture of the sub-National expenditures and hence under reporting by Ministries. These ministerial expenditures are therefore, provisional.
41. As at the end of 31stDecember, 2017, expenditures by the Ministry of Education, Science and Technology; Teachers Service Commission and Ministry of Health (Social Sector) accounted for 40.3 per cent of total recurrent expenditure. While the State Department for Interior, and Ministry of Defence accounted for 9.8 per cent and 10.7 per cent respectively.
42. Analysis of development outlay indicates that the Ministry of Energy and Petroleum (15.2 per cent) accounted for the largest share of the total development expenditures, followed by the Department for Infrastructure (14.8 per cent), Department of Transport (11.8 per cent) and the State Department Interior (5.5 per cent). The development expenditures in large ministries were below the target because of non-inclusion of expenditures from some donor funded projects.
3.3 Fiscal Outturn
43. Between July 1, 2017 and December 31, 2017, cumulative overall fiscal balance (on a commitment basis and excluding grants), amounted to KSh 197.6 billion (equivalent to 2.28 per cent of GDP) against a targeted deficit of KSh 251.6 billion (equivalent to 2.91 per cent of GDP). Over the same period in 2016, the fiscal deficit stood at KSh 254.4 billion (equivalent to 3.32 per cent of GDP). Including grants, the fiscal balance (on a commitment basis) deficit stood at 2.19 per cent of GDP against a targeted deficit of 2.61 per cent of GDP.
3.4 Financing
3.4.1 External Financing 44. Cumulative external financing for the period between July 1st 2017 and December 31st 2017 amounted to a net borrowing of KSh 24.1 billion (Table 2). Total disbursements (inflows) including Appropriations-in-Aid amounted to KSh 52.5 billion for the period ending 31st December, 2017 against a target of KSh 92.6 billion. The actual disbursement amount included KSh 5.4 billion Project cash loans, KSh 34.0 billion project loans A.I.A. and KSh 2.3 billion Programme loans. External repayments (outflows) of principal debt amounted to KSh 28.4 billion. The amount comprises of principal repayments due to bilateral multilateral organizations and Commercial amounting to KSh 9.5 billion, KSh 7.5 billion and KSh 11.3 billion, respectively.

- 12 - | P a g e
Table 2: External Financing, Period Ending 31st December, 2017 (KSh Million)
Source: National Treasury
3.4.2 Domestic Financing
45. By the end of December 2017, net domestic borrowing amounted to KSh 183.6 billion against a target borrowing of KSh163.5 billion. The borrowing comprised of KSh 108.9 billion from the Central Bank of Kenya, KSh 74.4 billion from Non-Banking Financial Institutions, KSh 3.2 billion from Non Residents, and a net repayment of KSh 2.9 billion to the Commercial Banks. Comparatively, for the same period in 2016, the net domestic borrowing amounted to KSh 164.6 billion, comprising of KSh 18.9 billion from commercial banks, KSh 1.1 billion from Non Residents, KSh 106.8 billion from Non-Banks and KSh 37.8 billion from the Central Bank of Kenya
46. The stock of Treasury Bills held by Non- Banks and Non-Residents recorded net increase of KSh 9.2 billion, and KSh 1.9 billion respectively, while the stock of Treasury Bills held by Commercial Banks decreased by KSh 70.3 billion. The stock of Fixed Rate Bonds held by Commercial Banks, Non-Residents and non-Banks recorded a net increase of KSh 45.5 billion, KSh 1.5 billion, and KSh 45.1 billion respectively.4.0 Macroeconomic Outlook
4.1 Economic Outlook
47. The good performance in global activity that began in 2016 gained momentum in 2017 and the trend is expected to be sustained in 2018 supported by notable improvements in investment, trade, and industrial production, coupled with strengthening business and consumer confidence. The global growth is projected to increase to 3.9 percent in 2018 up from 3.7 percent in 2017 and
Quarter II
2016/17
cummulative
quarter I
2017/18
Quarter II
2017/18
Actual Actual Target
DISBUSEMENTS: 129,060.34 16,285.20 36,217 52,502 92,581.23
Project Cash loans 11,473.31 2,094.24 3,284 5,378 16,247.38
Project loans A-I-A 30,976.00 14,190.96 19,849 34,040 58,028.85
Project Loans SGR_PHASE1&2A_AIA 72,839.09 - - - 18,005.00
Project Loans SGR_PHASE_2B_AIA - - - -
Commercial Financing 10,114.00 - 10,760 10,760 -
O/W syndicated loan - - - - -
Export Credit - - - - -
Programme Loans 3,657.94 - 2,324 2,324 300
EXTERNAL REPAYMENTS: 15,684.20 9,073.06 19,343.44 28,416.50 47,282.79
Bilateral(incl. Italy debt SWAP) 8,443.68 5,345.20 4,202.56 9,547.77 9,109.74
Mutliliteral (exc.IMF) 6,856.36 3,727.86 3,821.36 7,549.22 13,189.19
Commercial 384.16 - 11,319.51 11,319.51 24,982.86
NET FOREIGN FINANCING 113,376.14 7,212.13 16,873.82 24,085.95 45,299.44
Cummulative
Cecember 2017*
- 13 - | P a g e
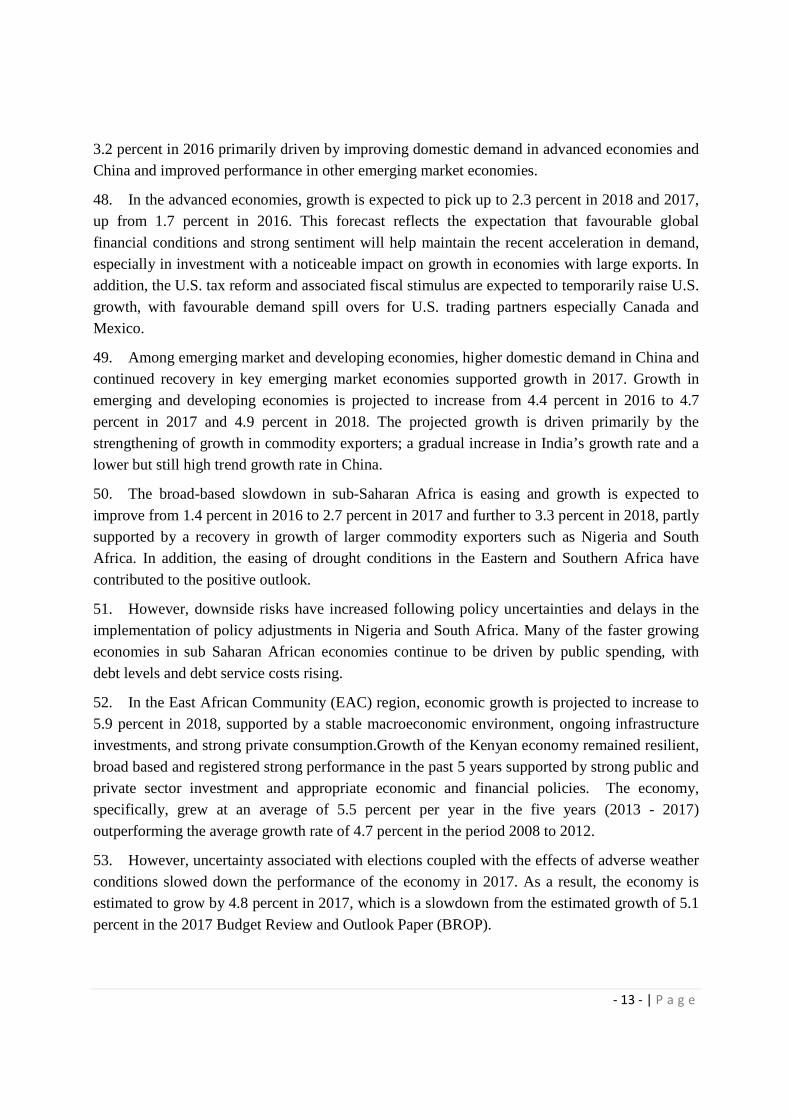
3.2 percent in 2016 primarily driven by improving domestic demand in advanced economies and China and improved performance in other emerging market economies.
48. In the advanced economies, growth is expected to pick up to 2.3 percent in 2018 and 2017, up from 1.7 percent in 2016. This forecast reflects the expectation that favourable global financial conditions and strong sentiment will help maintain the recent acceleration in demand, especially in investment with a noticeable impact on growth in economies with large exports. In addition, the U.S. tax reform and associated fiscal stimulus are expected to temporarily raise U.S. growth, with favourable demand spill overs for U.S. trading partners especially Canada and Mexico.
49. Among emerging market and developing economies, higher domestic demand in China and continued recovery in key emerging market economies supported growth in 2017. Growth in emerging and developing economies is projected to increase from 4.4 percent in 2016 to 4.7 percent in 2017 and 4.9 percent in 2018. The projected growth is driven primarily by the strengthening of growth in commodity exporters; a gradual increase in India’s growth rate and a lower but still high trend growth rate in China.
50. The broad-based slowdown in sub-Saharan Africa is easing and growth is expected to improve from 1.4 percent in 2016 to 2.7 percent in 2017 and further to 3.3 percent in 2018, partly supported by a recovery in growth of larger commodity exporters such as Nigeria and South Africa. In addition, the easing of drought conditions in the Eastern and Southern Africa have contributed to the positive outlook.
51. However, downside risks have increased following policy uncertainties and delays in the implementation of policy adjustments in Nigeria and South Africa. Many of the faster growing economies in sub Saharan African economies continue to be driven by public spending, with debt levels and debt service costs rising.
52. In the East African Community (EAC) region, economic growth is projected to increase to 5.9 percent in 2018, supported by a stable macroeconomic environment, ongoing infrastructure investments, and strong private consumption.Growth of the Kenyan economy remained resilient, broad based and registered strong performance in the past 5 years supported by strong public and private sector investment and appropriate economic and financial policies. The economy, specifically, grew at an average of 5.5 percent per year in the five years (2013 - 2017) outperforming the average growth rate of 4.7 percent in the period 2008 to 2012.
53. However, uncertainty associated with elections coupled with the effects of adverse weather conditions slowed down the performance of the economy in 2017. As a result, the economy is estimated to grow by 4.8 percent in 2017, which is a slowdown from the estimated growth of 5.1 percent in the 2017 Budget Review and Outlook Paper (BROP).

- 14 - | P a g e
54. This macroeconomic outlook faces risks from the global economies relates to uncertainties in the global financial markets particularly with regard to the U.S. economic and trade policies, normalization of monetary policy in the advanced economies and the Brexit outcome. The recent geopolitical tensions building around production and use of nuclear weapons if not addressed could weigh down global growth with negative impact on trade and financial flows.
55. Domestically, the economy will continue to be exposed to risks arising from adverse weather conditions until the mitigating measures of food security under “The Big Four” Plan are put in place. Additional risks could emanate from public expenditure pressures especially recurrent expenditures.
4.2 The Big Four Economic Plan
56. Under the Economic Transformation Agenda, the Government laid a solid foundation for Kenya’s industrialization as envisaged in the Kenya Vision 2030. The Government realizes that much more remains to be done to achieve our developmental objectives of creating jobs and wealth, ensuring continued inclusive growth, reducing poverty and more generally, achieving our Vision 2030 development objectives.
57. Building on the progress made so far and with the desire to decisively confront the three perennial challenges of unemployment, poverty and income inequality that this economy continues to face, the Government has identified four key strategic areas of focus under “The Big Four” over the next five years that will aim at accelerating broad based economic growth. The strategic areas Plan include:
58. Supporting value addition and raising the manufacturing sector’s share of GDP to 15 percent by 2022;The Government will target to increase the contribution of manufacturing sector to GDP from 9.2 percent in 2016 to 15 percent by 2022 by adding USD 2 to 3 billion to our GDP. It is expected that this will increase manufacturing sector jobs by more than 800,000. In order to achieve this targets, the Government will place special emphasis on Textile and Apparels; Leather products; Agro - processing; and Manufacturing of construction materials. Other important sectors will be Oil, Mining and Gas; Iron and Steel; ICT; and Fish Processing. Specific measures and incentives will be implemented to boost these sub-sectors and increase job creation. This will accelerate economic growth, create jobs and reduce poverty.
59. Enhancing Food and Nutrition Security to all Kenyans by 2022: The Government targets to ensure that all citizens enjoy food security and proper nutrition by 2022 by ensuring self-sufficiency in the production of maize, rice and potatoes among others. Specifically, Government intends to increase the production of maize from the current 40 million 90 kg bags annually to 67 million bags by 2022; rice from around 125,000 metric tonnes (MT) currently to 400,000 MT by 2022, and potatoes from the current 1.6 million tonnes to about 2.5 MT by 2022. This will be achieved through expansion of food production and supply, reduction of food prices to ensure affordability and support value addition in the food processing value chain. The

- 15 - | P a g e
Government will focus on enhancing large-scale production, boosting smallholder productivity and reducing the cost of food.
60. Providing Universal Health Coverage to Guarantee Quality and Affordable Healthcare to All Kenyans: Over the next five years, the Government targets 100 percent Universal Health Coverage (UHC) for all households. This will guarantee access to quality and affordable health care to all Kenyans. In order to realise this objective, the Government will focus on reconfiguring the National Hospital Insurance Fund (NHIF) and reforming the governance of private insurance companies. In particular, the Government will review and amend the NHIF Act to align it to the universal health coverage as well as review the laws governing private insurance companies to encourage investment by private health insurers and bring the cost of cover within the reach of every Kenyan.
61. Provision of Affordable and Decent Housing for All Kenyans: The Government is keen on delivering five hundred thousand housing units by 2022 in major cities across the country. This will provide decent homes, create an additional 350,000 jobs, provide market for manufacturers and suppliers and raise the contribution of real estate and construction sector to 14 percent of GDP. 96. To achieve this objective, the Government will implement policy and administrative reforms which are targeted at lowering the cost of construction and improving accessibility of affordable mortgages. The focus will be on raising low cost funds from public and private sectors for investment in large-scale housing production.
62. Investments in the above four areas is expected to transform lives by creating the much needed jobs enabling Kenyans meet their basic needs, improve living conditions, lower cost of living, and reduce poverty and inequality.
4.3 Enablers for the “The Big Four” Economic Plan
63. The Government successfully implemented the Economic Transformation Agenda during the last five years. This created a strong and solid foundation for economic transformation and industrialisation as envisaged in Kenya Vision 2030. Building on the progress made, the Government will continue with the implementation of programmes and policies under the Economic Transformation Agenda to support the realization of the “Big Four” Agenda. As such raft of policies will be implemented under the five thematic areas of the Transformation Agenda namely: Creating a conducive business environment for investment and job Creation; investing in infrastructure to unlock growth potential; investing in sectoral transformation for food security and broad based sustainable economic growth; investing in quality and accessible social services (health, education and social safety net); and consolidating gains in devolution for services delivery and enhanced rural development. The Government will continue to implement structural reforms in areas such as governance, financial sector and in public financial management with a view to ensure enhanced productivity and competitiveness

- 16 - | P a g e
64. Continuing investment in infrastructure: T he Government is still providing significant resources to the infrastructure sector especially in the energy, roads, rail, telecommunications and water sub-sectors to ease bottlenecks and reduce costs of doing business, while improving access to export markets. Investment in key infrastructure projects include the extension of the standard Gauge Railway to Naivasha and Malaba, geothermal power, electricity connectivity, major dams and expansion of ports. In addition, the Government will maximize on the geographical competitive advantage through modernizing the Port of Mombasa and expansion of Jomo Kenyatta International Airport (JKIA) to serve as the regional hub. This projects will be continued as they are vital for achieving our national development objectives of higher growth, employment creation and poverty reduction.
65. Deepening regional integration: While significant progress in integration has been achieved under the East Africa Community, there is much potential for expanded trade and investment in the COMESA and the rest of Africa. The Government will continue with collaborative infrastructure investment, and removing inefficient customs procedures including complicated rules of origin and other non-tariff barriers, in line with the existing Protocols.
66. Creating a conducive business environment: The “Big Four” Plan requires deliberatesteps to lower the cost of doing business across the country. In the last four years, tremendous progress has been made in this direction. As a result, Kenya’s ease of doing business improved from position 129 in 2014 to position 80 in 2017 according to World Bank’s Doing Business report. In addition, for two consecutive years (2016 and 2017), Kenya emerged as the third most reformed country in the world. Going forward, the Government will build on the rapid progress by taking measures such as cutting the number and cost of permits and licenses at both National and County levels. This is expected to further improve our Doing Business ranking in line with our ambition of being among the top 50 nations by 2020.
67. Promoting the use of Information, Communication and Technology (ICT): Use of ICT is important in reducing the cost of doing business and enhancing efficiency in service delivery. Over the last four years, the Government has implemented a number of initiatives to enhance the use of ICT including: the expansion of Optic Fibre Backbone Infrastructure across the Counties; recruiting and training of ICT graduates under the Presidential Digital Talent Programme; training of 10,000 youth on online jobs under Ajira Programme; and leveraging on ICT to improve Government service delivery through initiatives such as e-Procurement, Huduma Kenya, e-Citizen, iTax and IFMIS. Going forward, the Government will build on the progress made so far to improve ICT infrastructure and increase ICT skills and innovation in order to drive the attainment of “The Big Four” Plan.
68. Promoting Environmental Conservation and Water Supply: Environmental conservation and access to adequate supply of clean water is fundamental for the achievement of “The Big Four” Plan. A clean environment and adequate safe drinking water and sanitation do

- 17 - | P a g e
complement efforts towards improved primary health care and productivity of labour. In addition, adequate supply of water is essential for increased agricultural production, manufacturing activities and serving the rapidly urbanizing population.
69. The National Government working with County Governments will continue to invest in clean water supply, prioritize on construction of large-scale dams across the country to increase water storage, complete ongoing water projects in urban and rural areas in order to increase the number of people connected to safe piped water, protect wetlands and water towers and construct water harvesting and storage infrastructure across the country. In addition, the Government will continue to expand sanitation infrastructure in the urban areas by connecting more households with sewerage and establish proper waste management system.
70. Sustainable Management of Land for Social-Economic Development: In order to support the attainment of “the Big Four” Plan, the Government will establish a Land Bank to set aside land for commercial use such as industrialization and the construction of 500,000 affordable and decent houses. The Government will also fast track finalization of the Land Value Index Bill so as to make sure that Kenyans are informed of the indicative prices of land in different parts of the country, so as to control speculation. In addition, the Government will provide alternative forms of compensation such as equivalent value of land or government bonds, instead of focusing on monetary compensation. Further, the Government will fast track the approval of regulations for alternative dispute resolution mechanism. This will ensure that the public have an alternative method to resolving land disputes which is cheaper and faster.
71. Investing in Quality and Relevant Education for all Kenyans: In order to support “The Big Four” initiative, the Government will focus on improving and expanding the industry-led Technical and Vocational Education and Training (TVET) Colleges and Universities in order to equip the youth with relevant skills required to drive the industrialization agenda. The Government’s strategy will involve construction of more technical and vocational colleges in all the 290 Constituencies and equipping them with appropriate training equipment.
72. The Government will also develop more skilled and competitive workers through the planned “paid for” internship program that will lead to the absorption of more than 100,000 young Kenyans into the job market every year.
73. On curriculum reforms, the Government is currently piloting the new curriculum in nursery and lower primary schools. The next stages will involve developing curriculum designs and syllabi, curriculum support materials and teacher education curriculum ahead of the national roll-out. Once completed, the new curriculum will prepare learners to meet the 21st century needs, promote a focus on learning and competencies and develop quality and relevant skills for the job market.

- 18 - | P a g e
CHAPTERTWO
5.0 Election Expenditure
5.1 Overall Election Budget
74. The 2017 Elections were financed through two budgets of FY 2016/17 and 2017/8. The FY 2016/17 budget did the preparatory activities while the FY 2017/18 focused on the actual election. The General Election was prolonged after the Supreme Court nullified the August 8, 2017 results. This resulted to adjustment in the budget for both the direct and indirect expenses towards the General Election.
75. The total allocation for the 2017 General Election was KSh. 64.9 bn in two financial years of 2016/17 and 2017/18. During the preparatory phase, (FY 2016/17) the Government allocated KSh. 25.9 bn which is 40.0% of the total budget for election in the two financial years. The remaining 60.0% that translates to KSh. 39.0 bn was allocated in the FY 2017/18 budget (see table 3 and Appendix 1).
76. Out of the total allocation for the two financial years, KSh. 54.1 bn or 83.3% was spent by end of December 2017(unaudited accounts). This includes KSh. 22.6 bn representing in FY 2016/17 and KSh. 31.5 bn total allocation for FY 2017/18.
5.2 Independent Electoral and Boundaries Commission (IEBC)
77. Independent Electoral and Boundaries Commission was the principal agency during the preparation and conducting the August 2017 General Election and the repeat presidential election in October 2017. During the preparation phase, the Commission was responsible for registration of voters and revision of the voter's roll; registration of candidates for elections; voter education; regulation of money spent by a candidate or party; development of a code of conduct for candidates and parties; and monitoring of compliance with legislation on nomination of candidates by parties.After the election, the Commission was responsible for settlement of electoral disputes; facilitation of the observation, monitoring and evaluation of elections;
78. To undertake these functions, IEBC was allocated KSh.56.8bnin the two financial years (2016/17 and 2017/18) budget. This is composed of KSh. 23.4 bn in FY 2016/17 budget and 33.4 bn in FY 2017/18 budget.The budget for the Commission represented 87.5% of the total budget for the General Election during the two years.
79. The total expenditure for IEBC for the two financial years was KSh. 46.2 bn composed of KSh. 20.2 bn during the phase of election preparation in the FY 2016/17 and KSh. 26.0 bn during the actual election period between June and December 2017 as shown in table 3. This expenditure represents 89.4% and 85.5% of the total election expenditures for each year respectively. The Commission had an allocation of KSh. 475.7 million in the FY 2017/18 for

- 19 - | P a g e
security during the election period. Out of this amount, KSh. 470.0 million was spend for the exercise by end of December 2017. The expenditure for the Commission isbelow the approved exchequer allocation by KShs.7.3 bn.This variance is due to indirect expenses of activities that went beyond the reporting period of December 2017.
5.3 State Department for Interior
80. The Ministry of Interior and Coordination of National Government was in charge of security the whole Country and at the polling stations during the August 2017 General Election and October 2017 repeat Presidential Election. The IEBC hadsome provision to help facilitate security especially securing registration and polling stations, equipment and personnel. However, the electoral process require intense security before, during and after the election period.The main activities that require improved security include campaigns and nomination of candidates by the various political parties before the election date. The Ministry of Interior and Coordination of National Government has the responsibility to ensure security of all citizens is not compromised as they exercise their constitutional rights.
81. In this regard, the State Department for Interior had a global budget of KSh. 134.6 bn in the FY 2016/17and KSh. 79.2 bn in FY 2017/18. In respect to the General Election, the Ministry has an allocation of KSh.7.4 bn(KSh. 2.3 bn and KSh. 5.1 bn for FY 2016/17 and FY 2017/18 respectively) to cater for security operation costs during the electioneering period. The election allocation represented 5.5% of the total allocation for the State Department and 11.5% of the total election related allocation for the two years.
82. Out of the total allocation towards the 2017 general Election, the State Department was able to spend KSh. 7.4bn that represents 13.8% of the total expenditure for the General Election. The State Department utilised almost 100% of the total approved allocation for both FY 2016/17 and FY 2017/18.

- 20 - | P a g e
Table 3: Budgetary Allocation Analysis towards Election related expenditures
Source: The National Treasury
5.4 Office of the Registrar of Political Parties
83. During the two financial years, the Office of the Registrar of Political Parties was allocated KSh. 351.0 million for activities related to the general election. The allocation had KSh. 209.6 million for the FY 2016/17 and KSh. 141.4 for the FY 2017/18 budgets. Out of this allocation, the office spent KSh. 123.7 million during the election period. This expenditure represents a 35.2% of the total allocation for the two years.
5.5 Direct Election Expenses
84. Out of the overall expenditure for election related activities by the IEBC, State Department for Interior, National Intelligence Services, the Judiciary, The Presidency, and Office of the Registrar of Political Parties, it’s only IEBC and Office of the Registrar of Political Partieswhich carries the direct expenditures. Thus, with a budget estimate of KSh. 56.8 bntowards election related activities, the two agencies have an allocation to direct expenses amounting to KSh. 46.8 bn(see appendix2).
85. The IEBC expenses included the recruitment of election officials, training of election officials, registration of voters, inspection of voter registers, procurement of election materials and equipment, package and distribute election materials, clear candidates to participate in elections, hire of transport, essential equipment, facilities and other services
5.6 Indirect Election Expenses
86. Indirect allocation for the August 2017 General Election and the October 2017 repeat Presidential Election was KSh. 18.1 bn spread in the two financial years 2016/17 and 2017/18. Out of the total allocation, the government spent KSh. 13.9 bn on account of the indirect costs. This is 25.7% of the total election expenditure by end of December 2017.
Agency Approved
Estimates
Actual
Expenditure
Approved
Estimates
Actual
Expenditure
Approved
Estimates
Actual
Expenditure
IEBC 23,421,900,000 20,186,848,362 33,394,634,959 26,033,131,760 56,816,534,959 46,219,980,122
Office of the
Registrar of Political
Parties 209,600,000 65,148,835 141,431,660 58,580,874 351,031,660 123,729,709
Judiciary 20,000,000 20,000,000 137,953,695 137,953,695 157,953,695 157,953,695
Interior 2,300,000,000 2,300,000,000 5,146,260,260 5,146,260,260 7,446,260,260 7,446,260,260
The Presidency - - 32,500,000 32,500,000 32,500,000 32,500,000
Foreign Affaris - - 102,926,000 102,926,000 102,926,000 102,926,000
Broadcasting and
Telecommunication
- - 36,950,000 36,950,000 36,950,000 36,950,000
Arts and Culture - - 15,000,000 15,000,000 15,000,000 15,000,000
Total 25,951,500,000 22,571,997,197 39,007,656,574 31,563,302,589 64,959,156,574 54,135,299,786
2016/17 2017/18 Total

- 21 - | P a g e
87. The IEBC was allocatedKSh.10.1 bnfor indirect expenses for the general election which accounts to 15.5% of its total election budget and 55.5% of the total indirect election expenses. The indirect expenses budgeted on election related activities included allowances for security personnel, subsistence, communication, security operations, fuel and vehicle maintenance.
88. The Ministry of Interior and Coordination of National Government had a provision KSh. 7.4 bnfor indirect expenses related to security operations during the electioneeringperiodwhich accounts for 41.1% of the total indirect expenses. The expenditure included KSh. 2.5 bn in FY 2016/17 for security purposes and KSh. 5.0 bn in FY 2017/18 for security during the election period and KSh. 146.3 million in FY 2017/18 for security during the assumption of office function.
89. The National Intelligence Services presumes a normal budgetary operation with or without elections and thus their budgetary provisions are assumed in their normal budget which is mostly an indirect budget towards the election related activities.
90. The General Election generated many disputes that culminated in the courts of law. The Judiciary plays a key role in resolving these disputes. In this regard, the Judiciary spent KSh.157.9 million for the numerous disputes during the whole electioneering period.
91. In the FY 2017/18 budget, the Government spent KSh. 301.1 million for the assumption of office. The expenditure included KSh. 102.9 million for Ministry Foreign Affairs, KSh. 36.9 million for State Department for Broadcasting and Telecommunication, KSh 15.0 million for State Department for Arts and Culture and 146.3 million for State Department for Interior. These expenses were for preparation for the swearing in and enhanced security during the occasion.

- 22 - | P a g e
CHAPTERTHREE
6.0 Conclusion
92. This report has brought to the fore the critical areas of expenditure in relation to the general election. Most of the election related expenditures catered for the direct activities with a marginal expenditure catering for indirect and other related expenses. We remained steadfast in maintaining macroeconomic stability, even in the face of expenditure pressures associated with the adverse weather condition, salary demands from different unions and the prolonged period of the General Election.
93. TheGovernment will continue maintaining a stable macro-economic framework and fiscal discipline within the economy. In particular, greater transparency, accountability, and prudent management of public finances at both levels of government will be critical to achieve our vision 2030 initiatives.

- 23 - | P a g e
7.0 Appendices
Appendix 1: Summary of Expenditure for Elections in the FY 2016/17 and 2017/18
Budgets
Approved
Estimates
Actual
Expenditure
Approved
Estimates
Actual
Expenditure
Approved
Estimates
Actual
Expenditure
Recurrent 23,065,800,000 19,864,848,362 32,860,477,459 26,001,131,760 55,926,277,459 45,865,980,122
Direct Expenses 18,548,426,327 16,037,435,333 28,210,825,687 24,100,443,033 46,759,252,014 40,137,878,366
Indirect Expenses 4,517,373,673 3,827,413,029 4,649,651,772 1,900,688,727 9,167,025,445 5,728,101,756
Development 356,100,000 322,000,000 534,157,500 32,000,000 890,257,500 354,000,000
Indirect Expenses 356,100,000 322,000,000 534,157,500 32,000,000 890,257,500 354,000,000
Indirect Expenses - - - - - -
TOTAL 23,421,900,000 20,186,848,362 33,394,634,959 26,033,131,760 56,816,534,959 46,219,980,122
Approved
Estimates
Actual
Expenditure
Approved
Estimates
Actual
Expenditure
Approved
Estimates
Actual
Expenditure
Recurrent 209,600,000 65,148,835 141,431,660 58,580,874 351,031,660 123,729,709
Direct Expenses 34,000,000 27,344,921 49,870,000 43,455,507 83,870,000 70,800,428
Indirect Expenses 175,600,000 37,803,914 91,561,660 15,125,367 267,161,660 52,929,281
TOTAL 209,600,000 65,148,835 141,431,660 58,580,874 351,031,660 123,729,709
Approved
Estimates
Actual
Expenditure
Approved
Estimates
Actual
Expenditure
Approved
Estimates
Actual
Expenditure
Recurrent 2,300,000,000 2,300,000,000 5,146,260,260 5,146,260,260 7,446,260,260 7,446,260,260
Direct Expenses - -
Indirect Expenses 2,300,000,000 2,300,000,000 5,146,260,260 5,146,260,260 7,446,260,260 7,446,260,260
TOTAL 2,300,000,000 2,300,000,000 5,146,260,260 5,146,260,260 7,446,260,260 7,446,260,260
Approved
Estimates
Actual
Expenditure
Approved
Estimates
Actual
Expenditure
Approved
Estimates
Actual
Expenditure
Recurrent 20,000,000 20,000,000 137,953,695 137,953,695 157,953,695 157,953,695
Direct Expenses - - - - - -
Indirect Expenses 20,000,000 20,000,000 137,953,695 137,953,695 157,953,695 157,953,695
TOTAL 20,000,000 20,000,000 137,953,695 137,953,695 157,953,695 157,953,695
Approved
Estimates
Actual
Expenditure
Approved
Estimates
Actual
Expenditure
Approved
Estimates
Actual
Expenditure
Recurrent 102,926,000 102,926,000 102,926,000 102,926,000
Direct Expenses - -
Indirect Expenses 102,926,000 102,926,000 102,926,000 102,926,000
TOTAL - - 102,926,000 102,926,000 102,926,000 102,926,000
Approved
Estimates
Actual
Expenditure
Approved
Estimates
Actual
Expenditure
Approved
Estimates
Actual
Expenditure
Recurrent - - 36,950,000 36,950,000 36,950,000 36,950,000
Direct Expenses - -
Indirect Expenses 36,950,000 36,950,000 36,950,000 36,950,000
TOTAL - - 36,950,000 36,950,000 36,950,000 36,950,000
Approved
Estimates
Actual
Expenditure
Approved
Estimates
Actual
Expenditure
Approved
Estimates
Actual
Expenditure
Recurrent - - 15,000,000 15,000,000 15,000,000 15,000,000
Direct Expenses - -
Indirect Expenses 15,000,000 15,000,000 15,000,000 15,000,000
TOTAL - - 15,000,000 15,000,000 15,000,000 15,000,000
Approved
Estimates
Actual
Expenditure
Approved
Estimates
Actual
Expenditure
Approved
Estimates
Actual
Expenditure
Recurrent - - 32,500,000 32,500,000 32,500,000 32,500,000
Direct Expenses - -
Indirect Expenses 32,500,000 32,500,000 32,500,000 32,500,000
TOTAL - - 32,500,000 32,500,000 32,500,000 32,500,000
- -
Grand Total 25,951,500,000 22,571,997,197 39,007,656,574 31,563,302,589 64,959,156,574 54,135,299,786
Independent Electoral and Boundaries Commission
The Presidency
Office of the Registrar of Political Parties
State Department for Interior
The Judiciary
Ministry of Foreign Affairs
State Department for Broadcasting and Telecommunication
2016/17 2017/18 Total
2016/17 2017/18 Total
2016/17 2017/18 Total
State Department for Arts and Culture
Total
Total
Total 2016/17 2017/18
2016/17 2017/18
2016/17 2017/18
2016/17 2017/18 Total
2016/17 2017/18 Total

- 24 - | P a g e
Appendix 2: Direct Expensesfor Elections in the FY 2016/17 and 2017/18 Budgets
Appendix 3: Indirect Expensesfor Elections in the FY 2016/17 and 2017/18
Budgets
Direct Expenses
Agency
Approved
Estimates
Actual
Expenditure
Approved
Estimates
Actual
Expenditure
Approved
Estimates
Actual
Expenditure
IEBC 18,548,426,327 16,037,435,333 28,210,825,687 24,100,443,033 46,759,252,014 40,137,878,366
Office of the
Registrar of
Political Parties 34,000,000 27,344,921 49,870,000 43,455,507 83,870,000 70,800,428
Total 18,582,426,327 16,064,780,254 28,260,695,687 24,143,898,540 46,843,122,014 40,208,678,794
2016/17 2017/18 Total
Indirect Expenses
Agency Approved
Estimates
Actual
Expenditure
Approved
Estimates
Actual
Expenditure
Approved
Estimates
Actual
Expenditure
IEBC 4,873,473,673 4,149,413,029 5,183,809,272 1,932,688,727 10,057,282,945 6,082,101,756
Office of the
Registrar of Political
Parties 175,600,000 37,803,914 91,561,660 15,125,367 267,161,660 52,929,281
Judiciary 20,000,000 20,000,000 137,953,695 137,953,695 157,953,695 157,953,695
Interior 2,300,000,000 2,300,000,000 5,146,260,260 5,146,260,260 7,446,260,260 7,446,260,260
The Presidency - - 32,500,000 32,500,000 32,500,000 32,500,000
Foreign Affaris - - 102,926,000 102,926,000 102,926,000 102,926,000
Broadcasting and
Telecommunication - - 36,950,000 36,950,000 36,950,000 36,950,000
Arts and Culture - - 15,000,000 15,000,000 15,000,000 15,000,000
Total 7,369,073,673 6,507,216,943 10,746,960,887 7,419,404,049 18,116,034,560 13,926,620,992
2016/17 2017/18 Total

- 25 - | P a g e
Appendix 4: Ministerial Expenditures, Period Ending 31st December, 2017
(KSh Million)
*Provisional
Source: National Treasury
MINISTRY/DEPARTMENT/COMMISSIONSActual* Target Actual* Target Actual* Target
1011 The Presidency 3,347 4,138 (791) 164 393 (228) 3,511 4,531 (1,019) 77.5 1021 State Department for Interior 45,836 65,208 (19,373) 9,535 9,041 493 55,370 74,250 (18,879) 74.6 1023 State Department for Correctional Services 9,279 10,784 (1,505) 168 532 (364) 9,447 11,316 (1,869) 83.5 1032 State Department for Devolution 319 479 (159) 232 1,770 (1,538) 551 2,248 (1,697) 24.5 1033 State Department for Special Programmes 3,282 3,893 (611) 1,686 2,284 (599) 4,968 6,178 (1,210) 80.4 1034 State Department for Planning and Statistics 2,522 2,646 (123) 8,821 14,147 (5,326) 11,343 16,792 (5,449) 67.6
1041 Ministry of Defence 49,918 53,052 (3,134) - 23 (23) 49,918 53,075 (3,157) 94.1 1052 Ministry of Foreign Affairs 1,662 6,594 (4,932) 2 124 (122) 1,664 6,718 (5,054) 24.8 1063 State Department for Basic Education 62,320 49,774 12,545 1,911 4,608 (2,697) 64,230 54,382 9,848 118.1 1064 State Department for Vocational And Technical Training 1,171 1,241 (71) 5,926 7,001 (1,075) 7,097 8,243 (1,146) 86.1 1065 State Department for University Education 34,115 54,523 (20,408) 2,187 1,745 442 36,301 56,268 (19,966) 64.5 1071 The National Treasury 14,534 41,887 (27,353) 4,014 23,375 (19,360) 18,548 65,262 (46,713) 28.4 1081 Ministry of Health 12,799 17,018 (4,219) 9,510 15,011 (5,502) 22,308 32,029 (9,721) 69.7 1091 State Department for Infrastructure 22,430 27,201 (4,771) 25,540 64,994 (39,454) 47,970 92,195 (44,225) 52.0 1092 State Department for Transport 691 3,234 (2,544) 20,339 44,485 (24,145) 21,030 47,719 (26,689) 44.1 1093 State Department for Marine time Affairs 103 164 (61) - - - 103 164 (61) 62.7 1094 State Department for Housing & Urban Development 728 775 (47) 5,036 6,360 (1,324) 5,765 7,135 (1,370) 80.8 1095 State Department for Public Works 323 388 (66) 97 93 3 419 482 (62) 87.1 1103 State Department for Water Services 1,213 2,364 (1,151) 14,699 16,126 (1,428) 15,912 18,491 (2,579) 86.1 1104 State Department for Irrigation 199 437 (238) 3,313 7,079 (3,766) 3,512 7,516 (4,004) 46.7 1105 State Department of Environment 1,433 1,442 (9) 761 737 24 2,194 2,179 15 100.7 1106 State Department for Natural Resources 3,356 6,291 (2,935) 941 1,441 (500) 4,297 7,732 (3,435) 55.6 1112 Ministry of Lands and Physical Planning 1,067 1,118 (51) 1,184 1,730 (546) 2,251 2,848 (597) 79.0 1122State Department for Information Communication and Technology & Innovation 314 420 (106) 4,171 5,274 (1,103) 4,484 5,694 (1,209) 78.8 1123 State Department for Broadcasting & Telecommunications 1,277 1,468 (191) 87 191 (104) 1,364 1,659 (295) 82.2 1132 State Department for Sports Development 1,449 2,139 (690) 1,447 1,475 (28) 2,896 3,614 (718) 80.1 1133 State Department For Arts And Culture 1,409 1,468 (60) 200 219 (19) 1,609 1,688 (79) 95.3 1152 State Department of Energy 926 1,149 (223) 26,079 41,274 (15,195) 27,005 42,423 (15,419) 63.7 1153 State Department of Petroleum 66 86 (20) 616 1,923 (1,307) 681 2,009 (1,328) 33.9 1161 State Department for Agriculture 7,872 9,040 (1,168) 3,216 8,210 (4,993) 11,089 17,250 (6,161) 64.3 1162 State Department for Livestock 3,276 4,198 (922) 1,715 1,847 (132) 4,991 6,044 (1,053) 82.6 1164 State Department for Fisheries and The Blue Economy 847 816 31 63 229 (165) 910 1,045 (135) 87.1 1172 State Department for Investment and Industry 1,004 1,057 (52) 948 1,181 (233) 1,952 2,238 (286) 87.2 1173 State Department for Cooperatives 288 761 (473) 353 336 17 641 1,098 (457) 58.4 1174 State Department for Trade 741 1,079 (338) 3 82 (78) 745 1,161 (416) 64.1 1183 State Department for East African Integration 1,152 1,454 (301) - 33 (33) 1,152 1,486 (334) 77.5 1184 State Department for Labour 776 837 (62) 38 216 (178) 814 1,053 (240) 77.3 1185 State Department for Social Protection 3,880 9,052 (5,172) 6,195 7,258 (1,063) 10,075 16,310 (6,235) 61.8 1191 Ministry of Mining 307 600 (293) 59 924 (865) 366 1,524 (1,158) 24.0 1201 Ministry of Tourism 676 1,377 (701) 84 980 (896) 760 2,357 (1,597) 32.2 1211 State Department of Public Service and Youth Affairs 6,852 11,608 (4,757) 7,502 7,856 (354) 14,354 19,464 (5,110) 73.7 1212 State Department for Gender 319 665 (346) 1,509 1,533 (24) 1,829 2,198 (370) 83.2 1252 State Law Office and Department of Justice 1,815 2,116 (300) 10 284 (274) 1,825 2,400 (575) 76.0 1261 The Judiciary 5,534 6,258 (724) 968 1,605 (637) 6,502 7,863 (1,361) 82.7 1271 Ethics and Anti-Corruption Commission 1,592 1,609 (17) - 634 (634) 1,592 2,243 (651) 71.0 1281 National Intelligence Service 17,857 15,665 2,193 - - - 17,857 15,665 2,193 114.0 1291 Directorate of Public Prosecutions 852 1,051 (199) 2 1 1 854 1,052 (198) 81.2 1311 Registrar of Political Parties 344 432 (89) - - - 344 432 (89) 79.5 1321 Witness Protection Agency 131 224 (93) - - - 131 224 (93) 58.5 2011 Kenya National Commission on Human Rights 207 214 (8) - - - 207 214 (8) 96.5 2021 National Land Commission 535 457 78 73 75 (2) 608 532 76 114.2 2031 Independent Electoral and Boundaries Commission 25,390 32,860 (7,471) - 345 (345) 25,390 33,205 (7,815) 76.5 2041 Parliamentary Service Commission 3,906 4,959 (1,052) 695 1,191 (495) 4,602 6,149 (1,548) 74.8 2042 National Assembly 7,841 10,515 (2,674) - - - 7,841 10,515 (2,674) 74.6 2051 Judicial Service Commission 85 115 (30) - - - 85 115 (30) 73.8 2061 Commission on Revenue Allocation 112 203 (91) - - - 112 203 (91) 55.3 2071 Public Service Commission 665 711 (46) 5 15 (10) 670 726 (57) 92.2 2081 Salaries and Remuneration Commission 270 327 (57) - - - 270 327 (57) 82.5 2091 Teachers Service Commission 89,884 105,126 (15,242) - 59 (59) 89,884 105,185 (15,301) 85.5 2101 National Police Service Commission 172 229 (57) - 16 (16) 172 245 (73) 70.3 2111 Auditor General 1,898 2,514 (616) 12 70 (57) 1,911 2,584 (673) 73.9 2121 Controller of Budget 197 272 (75) - - - 197 272 (75) 72.5 2131 The Commission on Administrative Justice 186 207 (22) - - - 186 207 (22) 89.6 2141 National Gender and Equality Commission 173 178 (5) - - - 173 178 (5) 97.4 2151 Independent Policing Oversight Authority 127 378 (251) - 38 (38) 127 416 (289) 30.5
Total 465,851 590,550 (124,699) 172,116 308,471 (136,355) 637,967 899,021 (261,054) 71.0
% total expenditure to total target
Reccurent Development TotalDec-17 Variance Dec-17 Variance Dec-17 Variance
- 26 - | P a g e
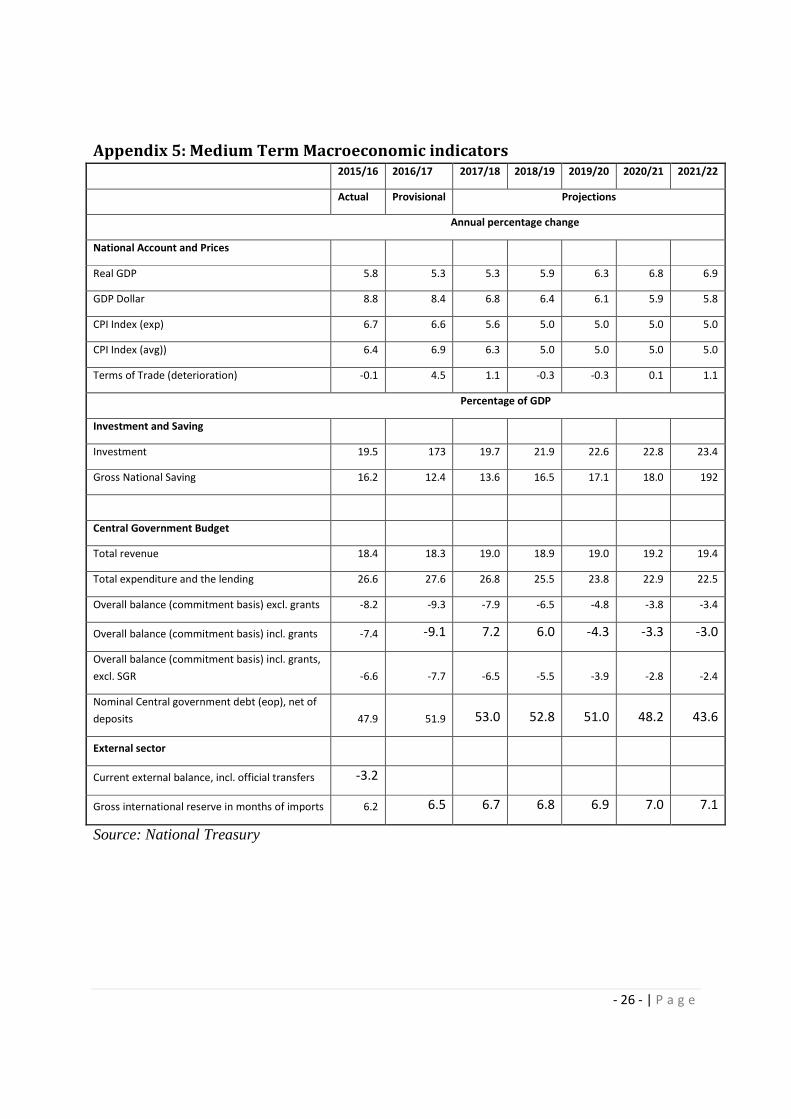
Appendix 5: Medium Term Macroeconomic indicators 2015/16 2016/17 2017/18 2018/19 2019/20 2020/21 2021/22
Actual Provisional Projections
Annual percentage change
National Account and Prices
Real GDP 5.8 5.3 5.3 5.9 6.3 6.8 6.9
GDP Dollar 8.8 8.4 6.8 6.4 6.1 5.9 5.8
CPI Index (exp) 6.7 6.6 5.6 5.0 5.0 5.0 5.0
CPI Index (avg)) 6.4 6.9 6.3 5.0 5.0 5.0 5.0
Terms of Trade (deterioration) -0.1 4.5 1.1 -0.3 -0.3 0.1 1.1
Percentage of GDP
Investment and Saving
Investment 19.5 173 19.7 21.9 22.6 22.8 23.4
Gross National Saving 16.2 12.4 13.6 16.5 17.1 18.0 192
Central Government Budget
Total revenue 18.4 18.3 19.0 18.9 19.0 19.2 19.4
Total expenditure and the lending 26.6 27.6 26.8 25.5 23.8 22.9 22.5
Overall balance (commitment basis) excl. grants -8.2 -9.3 -7.9 -6.5 -4.8 -3.8 -3.4
Overall balance (commitment basis) incl. grants -7.4 -9.1 7.2 6.0 -4.3 -3.3 -3.0
Overall balance (commitment basis) incl. grants,
excl. SGR -6.6 -7.7 -6.5 -5.5 -3.9 -2.8 -2.4
Nominal Central government debt (eop), net of
deposits 47.9 51.9 53.0 52.8 51.0 48.2 43.6
External sector
Current external balance, incl. official transfers -3.2
Gross international reserve in months of imports 6.2 6.5 6.7 6.8 6.9 7.0 7.1
Source: National Treasury