Embed Size (px)
Citation preview

June 22, 2016
Milliman Client Report
State Fiscal Year 2017 Medicaid Managed Care Capitation Rate Certification
July 1, 2016 through June 30, 2017
South Carolina Department of Health and Human Services
FINAL
Prepared for: Deirdra Singleton
Deputy Director of Health Programs
Prepared by: Jeremy D. Palmer FSA, MAAA Principal and Consulting Actuary Marlene T. Howard FSA, MAAA Consulting Actuary Carmen L. Laudenschlager ASA, MAAA Associate Actuary
111 Monument Circle
Suite 601
Indianapolis, IN 46204-5128 USA
Tel +1 317 639-1000
Fax +1 317 639-1001
milliman.com

Milliman Client Report
State Fiscal Year 2017 Rate Certification
SCM01-64
June 22, 2016
Table of Contents
INTRODUCTION & EXECUTIVE SUMMARY ...................................................................................................................... 1
Background ....................................................................................................................................................................... 1 Fiscal impact estimate ...................................................................................................................................................... 1
SECTION I. MEDICAID MANAGED CARE RATES ............................................................................................................. 3
1. GENERAL INFORMATION ........................................................................................................................................ 3
A. Annual basis ........................................................................................................................................................... 3 B. Documentation ........................................................................................................................................................ 3 C. Index ....................................................................................................................................................................... 3 D. Required elements .................................................................................................................................................. 4
i. Actuarial certification ....................................................................................................................................... 4 ii. Certified Capitation rates for each rate cell ...................................................................................................... 4 iii. Certified rates ranges ...................................................................................................................................... 4 iv. Program information ........................................................................................................................................ 4
(a) Managed care program ................................................................................................................................... 4 (b) Rating period ................................................................................................................................................... 4 (c) Covered populations ....................................................................................................................................... 4 (d) Eligibility criteria............................................................................................................................................... 6 (e) Covered services ............................................................................................................................................. 7
2. DATA ......................................................................................................................................................................... 8
A. Description of the data ............................................................................................................................................ 8
i. Description of the data ............................................................................................................................................ 8
(a) Types of data .................................................................................................................................................. 8 (b) Age of the data ................................................................................................................................................ 8 (c) Data sources ................................................................................................................................................... 8 (d) Sub-capitation ................................................................................................................................................. 8
ii. Availability and quality of the data ........................................................................................................................... 9
(a) Steps taken to validate the data ...................................................................................................................... 9 (b) Actuary’s assessment ................................................................................................................................... 10 (c) Data concerns ............................................................................................................................................... 10
iii. Use of encounter and fee-for-service data .................................................................................................... 10 iv. Use of managed care encounter data ........................................................................................................... 10 v. Reliance on a data book ................................................................................................................................ 10
B. Data adjustments .................................................................................................................................................. 10
i. Credibility adjustment .................................................................................................................................... 11 ii. Completion adjustment .................................................................................................................................. 11 iii. Errors found in the data ................................................................................................................................. 11 iv. Program change adjustments ....................................................................................................................... 12 v. Exclusion of payments or services from the data .......................................................................................... 20
3. PROJECTED BENEFIT COST AND TRENDS ........................................................................................................ 22
A. Development of projected benefit costs ................................................................................................................ 22

Milliman Client Report
State Fiscal Year 2017 Rate Certification
SCM01-64
June 22, 2016
i. Description of the data, assumptions, and methodologies .................................................................................... 22 ii. Material changes to the data, assumptions, and methodologies .......................................................................... 24
B. projected benefit cost trends ................................................................................................................................. 25
i. Description of the data, assumptions, and methodologies .................................................................................... 25
(a) Data ............................................................................................................................................................... 25 (b) Methodology .................................................................................................................................................. 25 (c) Comparisons ................................................................................................................................................. 26
ii. Benefit cost trend components ...................................................................................................................... 26 iii. Variation ........................................................................................................................................................ 26 iv. Material adjustments ..................................................................................................................................... 27 v. Any other adjustments ................................................................................................................................... 27
(a) Impact of managed care ................................................................................................................................ 27 (b) Trend changes other than utilization and unit cost ........................................................................................ 27
C. In lieu of services .................................................................................................................................................. 27 D. Retrospective eligibility periods ............................................................................................................................. 27
i. Health plan responsibility ............................................................................................................................... 27 ii. Claims information in base data..................................................................................................................... 27 iii. Enrollment treatment ..................................................................................................................................... 28 iv. Adjustments .................................................................................................................................................. 28
E. Final projected benefit costs ................................................................................................................................. 28 F. Impact of material changes ................................................................................................................................... 28
i. Change to covered benefits .......................................................................................................................... 28 ii. Change to payment requirements ................................................................................................................. 28 iii. Change to waiver requirements .................................................................................................................... 28 iv. Change due to litigation ................................................................................................................................. 28
G. Documentation of material changes ..................................................................................................................... 28
4. PASS-THROUGH PAYMENTS ................................................................................................................................ 29
A. Definition of pass-through payments .................................................................................................................... 29 B. Description of pass-through payments ................................................................................................................. 29
i. Description .................................................................................................................................................... 29 ii. Providers receiving the payment ................................................................................................................... 30 iii. Financing mechanism ................................................................................................................................... 30 iv. Historical payment amounts .......................................................................................................................... 30
C. Supplemental payments ....................................................................................................................................... 30
5. PROJECTED NON-BENEFIT COSTS ..................................................................................................................... 31
A. Data, assumptions and methodologies ................................................................................................................. 31
i. Description of the data, assumptions, and methodologies ............................................................................ 31
(a) Data ............................................................................................................................................................... 31 (b) Assumptions and methodology ..................................................................................................................... 31
ii. Material changes .......................................................................................................................................... 31
B. Non-benefit costs, by cost category ...................................................................................................................... 31 C. PMPM versus percentage ..................................................................................................................................... 32 D. Health insurer fee ................................................................................................................................................. 32
Milliman Client Report
State Fiscal Year 2017 Rate Certification
SCM01-64
June 22, 2016
i. Whether the fee is incorporated in the rates .................................................................................................. 32 ii. Fee year or data year .................................................................................................................................... 32 iii. Determination of fee impact to rates .............................................................................................................. 32 iv. Identification of long-term care benefits ......................................................................................................... 32
6. RATE RANGE DEVELOPMENT .............................................................................................................................. 33
A. Assumptions and methodology ............................................................................................................................. 33 B. Documentation ...................................................................................................................................................... 33
7. RISK MITIGATION AND RELATED CONTRACTUAL PROVISIONS ..................................................................... 34
A. Description of risk mitigation ................................................................................................................................. 34 B. Risk adjustment model and methodology ............................................................................................................. 34
i. Risk adjustment model .................................................................................................................................. 34 ii. Data and adjustments .................................................................................................................................... 34 iii. Changes from the prior year .......................................................................................................................... 34 iv. Frequency ..................................................................................................................................................... 35 v. How the risk scores will be used to adjust the capitation rates ...................................................................... 35 vi. An attestation that the risk adjustment is cost neutral ................................................................................... 35
C. Address cost neutrality .......................................................................................................................................... 35
i. Reason for uncertainty ................................................................................................................................... 35 ii. Risk adjustment model .................................................................................................................................. 35 iii. Data ............................................................................................................................................................... 35 iv. Relationship and interaction with risk adjustment .......................................................................................... 35 v. Frequency ..................................................................................................................................................... 35 vii. How the risk scores will be used to adjust the capitation rates ...................................................................... 35
D. Other risk sharing arrangements .......................................................................................................................... 35
i. Introduction .................................................................................................................................................... 35 ii. Methodology .................................................................................................................................................. 35 iii. Summary of Results ...................................................................................................................................... 37
E. Medical loss ratio .................................................................................................................................................. 37
i. Description ..................................................................................................................................................... 37 ii. Financial consequences ................................................................................................................................ 37
F. Reinsurance requirements and effect on capitation rates ..................................................................................... 37 G. Incentives and withholds ....................................................................................................................................... 38
i. Incentives ...................................................................................................................................................... 38 ii. Withholds ....................................................................................................................................................... 38 iii. Estimate of percent to be returned. ............................................................................................................... 38 iv. Effect on the capitation rates ......................................................................................................................... 38
8. OTHER RATE DEVELOPMENT CONSIDERATIONS ............................................................................................. 39
A. Different FMAP ..................................................................................................................................................... 39 B. Actuarially accepted practices and principles ....................................................................................................... 39
i. Reasonable, appropriate, and attainable ...................................................................................................... 39 ii. Outside the rate setting process ................................................................................................................... 39 iii. Rates within ranges ....................................................................................................................................... 39
9. PROCEDURES FOR RATE CERTIFICATION AND CONTRACT AMENDMENTS ................................................ 40
SECTION II. MEDICAID MANAGED CARE RATES WITH LONG-TERM SERVICES AND SUPPORTS ......................... 41
Milliman Client Report
State Fiscal Year 2017 Rate Certification
SCM01-64
June 22, 2016
SECTION III. NEW ADULT GROUP CAPITATION RATES ............................................................................................... 41
LIMITATIONS ..................................................................................................................................................................... 42
APPENDIX 1: ACTUARIAL CERTIFICATION
APPENDIX 2: CERTIFIED CAPITATION RATES
APPENDIX 3: FISCAL IMPACT SUMMARY
APPENDIX 4: IN-RATE CRITERIA
APPENDIX 5: UNADJUSTED SFY 2015 BASE DATA
APPENDIX 6: ADJUSTED SFY 2015 BASE DATA
APPENDIX 7: SFY 2017 CAPITATION RATE DEVELOPMENT
APPENDIX 8: MANAGED CARE EFFICIENCY ADJUSTMENTS
APPENDIX 9: SUPPLEMENTAL TEACHING PAYMENT DEVELOPMENT – UNADJUSTED STP
APPENDIX 10 : SUPPLEMENTAL TEACHING PAYMENT DEVELOPMENT – FINAL STP PMPM
Milliman Client Report
State Fiscal Year 2017 Rate Certification 1
SCM01-64
June 22, 2016
INTRODUCTION & EXECUTIVE SUMMARY
BACKGROUND
Milliman, Inc. (Milliman) has been retained by the State of South Carolina, Department of Health and Human Services (SCDHHS) to provide actuarial and consulting services related to the development of capitation rates for its Medicaid Managed Care Program effective July 1, 2016.
This letter provides documentation for the development of the actuarially sound capitation rates. It also includes the required actuarial certification in Appendix 1.
To facilitate review, this document has been organized in the same manner as the 2016 Managed Care Rate Setting Consultation Guide (2016 guide), released by CMS in September 2015. Sections 2 and 3 of the 2016 guide are not applicable to this certification, because the covered services do not include long term services and support (Section 2) and because the new adult group is not covered under this program (Section 3).
FISCAL IMPACT ESTIMATE
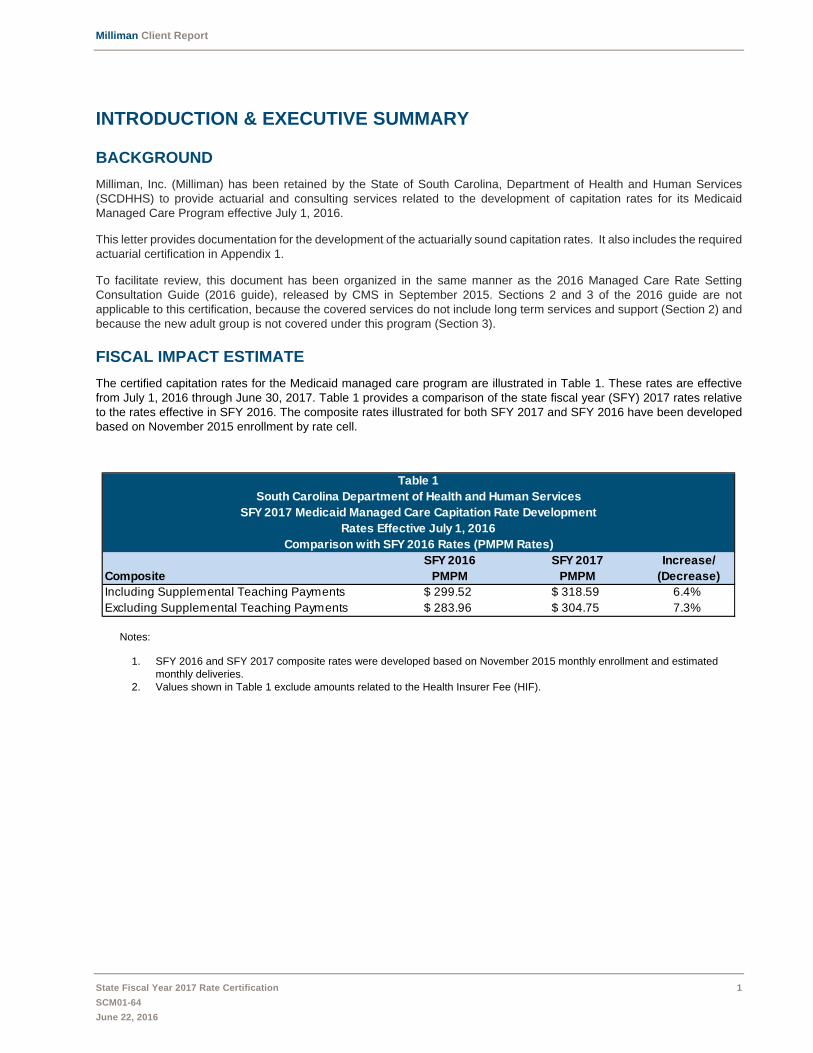
The certified capitation rates for the Medicaid managed care program are illustrated in Table 1. These rates are effective from July 1, 2016 through June 30, 2017. Table 1 provides a comparison of the state fiscal year (SFY) 2017 rates relative to the rates effective in SFY 2016. The composite rates illustrated for both SFY 2017 and SFY 2016 have been developed based on November 2015 enrollment by rate cell.
Notes:
1. SFY 2016 and SFY 2017 composite rates were developed based on November 2015 monthly enrollment and estimated monthly deliveries.
2. Values shown in Table 1 exclude amounts related to the Health Insurer Fee (HIF).
Table 1South Carolina Department of Health and Human Services
SFY 2017 Medicaid Managed Care Capitation Rate DevelopmentRates Effective July 1, 2016
Comparison with SFY 2016 Rates (PMPM Rates)SFY 2016 SFY 2017 Increase/
Composite PMPM PMPM (Decrease)Including Supplemental Teaching Payments $ 299.52 $ 318.59 6.4% Excluding Supplemental Teaching Payments $ 283.96 $ 304.75 7.3%
Milliman Client Report
State Fiscal Year 2017 Rate Certification 2
SCM01-64
June 22, 2016
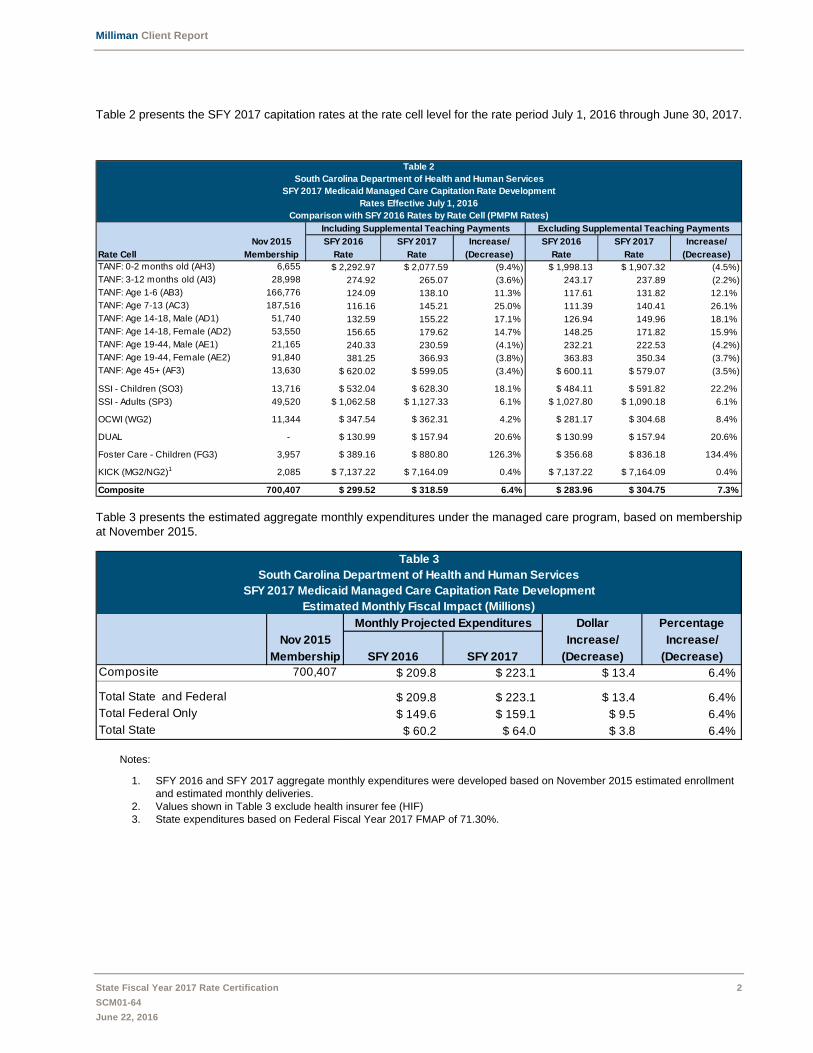
Table 2 presents the SFY 2017 capitation rates at the rate cell level for the rate period July 1, 2016 through June 30, 2017.
Table 3 presents the estimated aggregate monthly expenditures under the managed care program, based on membership at November 2015.
Notes:
1. SFY 2016 and SFY 2017 aggregate monthly expenditures were developed based on November 2015 estimated enrollment and estimated monthly deliveries.
2. Values shown in Table 3 exclude health insurer fee (HIF) 3. State expenditures based on Federal Fiscal Year 2017 FMAP of 71.30%.
Table 2South Carolina Department of Health and Human Services
SFY 2017 Medicaid Managed Care Capitation Rate DevelopmentRates Effective July 1, 2016
Comparison with SFY 2016 Rates by Rate Cell (PMPM Rates)
Including Supplemental Teaching Payments Excluding Supplemental Teaching Payments
Nov 2015 SFY 2016 SFY 2017 Increase/ SFY 2016 SFY 2017 Increase/
Rate Cell Membership Rate Rate (Decrease) Rate Rate (Decrease)TANF: 0-2 months old (AH3) 6,655 $ 2,292.97 $ 2,077.59 (9.4%) $ 1,998.13 $ 1,907.32 (4.5%)TANF: 3-12 months old (AI3) 28,998 274.92 265.07 (3.6%) 243.17 237.89 (2.2%)TANF: Age 1-6 (AB3) 166,776 124.09 138.10 11.3% 117.61 131.82 12.1% TANF: Age 7-13 (AC3) 187,516 116.16 145.21 25.0% 111.39 140.41 26.1% TANF: Age 14-18, Male (AD1) 51,740 132.59 155.22 17.1% 126.94 149.96 18.1% TANF: Age 14-18, Female (AD2) 53,550 156.65 179.62 14.7% 148.25 171.82 15.9% TANF: Age 19-44, Male (AE1) 21,165 240.33 230.59 (4.1%) 232.21 222.53 (4.2%)TANF: Age 19-44, Female (AE2) 91,840 381.25 366.93 (3.8%) 363.83 350.34 (3.7%)TANF: Age 45+ (AF3) 13,630 $ 620.02 $ 599.05 (3.4%) $ 600.11 $ 579.07 (3.5%)
SSI - Children (SO3) 13,716 $ 532.04 $ 628.30 18.1% $ 484.11 $ 591.82 22.2%
SSI - Adults (SP3) 49,520 $ 1,062.58 $ 1,127.33 6.1% $ 1,027.80 $ 1,090.18 6.1%
OCWI (WG2) 11,344 $ 347.54 $ 362.31 4.2% $ 281.17 $ 304.68 8.4%
DUAL - $ 130.99 $ 157.94 20.6% $ 130.99 $ 157.94 20.6%
Foster Care - Children (FG3) 3,957 $ 389.16 $ 880.80 126.3% $ 356.68 $ 836.18 134.4%
KICK (MG2/NG2)1 2,085 $ 7,137.22 $ 7,164.09 0.4% $ 7,137.22 $ 7,164.09 0.4%
Composite 700,407 $ 299.52 $ 318.59 6.4% $ 283.96 $ 304.75 7.3%
Table 3South Carolina Department of Health and Human Services
SFY 2017 Medicaid Managed Care Capitation Rate DevelopmentEstimated Monthly Fiscal Impact (Millions)
Monthly Projected Expenditures Dollar Percentage
Nov 2015 Increase/ Increase/
Membership SFY 2016 SFY 2017 (Decrease) (Decrease)Composite 700,407 $ 209.8 $ 223.1 $ 13.4 6.4%
Total State and Federal $ 209.8 $ 223.1 $ 13.4 6.4% Total Federal Only $ 149.6 $ 159.1 $ 9.5 6.4% Total State $ 60.2 $ 64.0 $ 3.8 6.4%
Milliman Client Report
State Fiscal Year 2017 Rate Certification 3
SCM01-64
June 22, 2016
SECTION I. MEDICAID MANAGED CARE RATES
1. GENERAL INFORMATION
This section provides information listed under the General Information section of the 2016 Managed Care Rate Setting Consultation Guide (2016 guide), Section I.
The capitation rates provided with this certification are “actuarially sound” for purposes of 42 CFR 438.6(c) of 67 FR 41097-41098 published on June 14, 2002, according to the following criteria:
The capitation rates have been developed in accordance with generally accepted actuarial principles and practices;
The capitation rates are appropriate for the Medicaid populations to be covered, and Medicaid services to be furnished under the contract; and,
The capitation rates meet the requirements of 42 CFR 438.6(c) of 67 FR 41097-41098.
To ensure compliance with generally accepted actuarial practices and regulatory requirements, we referred to published guidance from the American Academy of Actuaries (AAA), the Actuarial Standards Board, CMS, and federal regulations. Specifically, the following were referenced during the rate development:
Actuarial standards of practice applicable to Medicaid managed care rate setting which have been enacted as of the capitation rate certification date, including: ASOP 1 (Introductory Actuarial Standard of Practice); ASOP 5 (Incurred Health and Disability Claims); ASOP 23 (Data Quality); ASOP 25 (Credibility Procedures); ASOP 41 (Actuarial Communications); ASOP 45 (The Use of Health Status Based Risk Adjustment Methodologies); and ASOP 49 (Medicaid Managed Care Capitation Rate Development and Certification).
Federal regulation 42 CFR §438.6(c) of 67 FR 41097-41098.
2016 Medicaid Managed Care Rate Development Guide published by CMS on September 23, 2015.
Throughout this document, the term “actuarially sound” is defined as in ASOP 49:
“Medicaid capitation rates are “actuarially sound” if, for business for which the certification is being prepared and for the period covered by the certification, projected capitation rates and other revenue sources provide for all reasonable, appropriate, and attainable costs. For purposes of this definition, other revenue sources include, but are not limited to, expected reinsurance and governmental stop-loss cash flows, governmental risk-adjustment cash flows, and investment income. For purposes of this definition, costs include, but are not limited to, expected health benefits; health benefit settlement expenses; administrative expenses; the cost of capital, and government-mandated assessments, fees, and taxes.”
A. ANNUAL BASIS
The actuarial certification contained in this report is effective for the capitation rates for the one year rate period from July 1, 2016 through June 30, 2017.
B. DOCUMENTATION
This report contains appropriate documentation of all elements described in the rate certification, including data used, assumptions made, and methods for analyzing data and developing assumptions and adjustments.
C. INDEX
The index to this rate certification is the table of contents, found immediately after the title page. The index includes section numbers and related page numbers. Sections not relevant to this certification continue to be provided, with an explanation of why they are not applicable.
Milliman Client Report
State Fiscal Year 2017 Rate Certification 4
SCM01-64
June 22, 2016
D. REQUIRED ELEMENTS
i. Actuarial certification
The actuarial certification, signed by Jeremy D. Palmer, FSA, is in Appendix 1. Mr. Palmer meets the qualification standards established by the American Academy of Actuaries and follows the practice standards established by the Actuarial Standards Board, and certifies that the final rates meet the standards in 42 CFR §438.6(c) of 67 FR 41097-41098.
ii. Certified Capitation rates for each rate cell
The certified capitation rates by rate cell are illustrated in Table 2. Projected membership illustrated in Table 2 represents November 2015 enrollment. The estimated deliveries reflect an average of calendar year 2015 delivery counts. These rates represent the contracted capitation rates prior to risk adjustment.
iii. Certified rates ranges
We did not develop a rate range.
iv. Program information
(a) Managed care program
This certification was developed for the State of South Carolina Medicaid managed care program.
Medicaid health plans have been operating in South Carolina since 1996. In August 2007, SCDHHS implemented the South Carolina Healthy Connections Choices program to more effectively enroll members in health plans. Effective July 1, 2016 this program provides comprehensive services through five managed care organizations (MCO) on a statewide basis1.
Benefits covered under the Medicaid managed care program are comprehensive in nature. Certain services such as waiver services, non-emergency transportation, dental, and long-term nursing home stays are covered on a fee-for-service basis. Further detail on covered services can be found in Table 7 of this report.
(b) Rating period
This actuarial certification is effective for the one year rating period July 1, 2016 through June 30, 2017.
(c) Covered populations
Specific eligibility for the managed care program is defined by the individual’s Medicaid eligibility category as assigned by SCDHHS.
The following table outlines these specific SCDHHS Medicaid eligibility categories (also referenced as “payment categories” or “PCATs”) that are eligible for inclusion in the risk-based managed care program.
1 Six MCOs were operational in the SC Medicaid program during state fiscal year 2016.

Milliman Client Report
State Fiscal Year 2017 Rate Certification 5
SCM01-64
June 22, 2016
Table 4South Carolina Department of Health and Human Services
SFY 2017 Medicaid Managed Care Capitation Rate Development Managed Care Eligibility Payment Categories
PCAT Code Payment Category PCAT Code Payment Category
11 MAO (Extended/Transitional) 57 Katie Beckett/TEFRA 12 OCWI (Infants) 59 Low Income Families 13 MAO (Foster care/Adoption) 60 Regular Foster Care 16 Pass Along Eligibles 61 Foster Care Adults 17 Early Widows/Widowers 71 Breast and Cervical Cancer 18 Disabled Widows/Widowers 80 SSI 19 Disabled Adult Children 81 SSI With Essential Spouse 20 Pass Along Children 85 Optional Supplement 31 Title IV-E Foster Care 86 Optional Supplement & SSI 32 Aged, Blind, Disabled (ABD) 87 OCWI Pregnant Women /Infants 40 Working Disabled 88 OCWI Partners For Healthy Children 51 Title IV-E Adoption Assistance 91 Ribicoff Children
Dual eligible individuals (eligible for coverage by both Medicaid and Medicare) and individuals aged 65 or over are not eligible for enrollment into the managed care program. Any individual identified as dual eligible while enrolled in an MCO is retroactively adjusted to the dual capitation rate cell (discussed further below Table 6) for any such MCO-enrolled month, and are prospectively disenrolled from the managed care program.
Additionally, individuals denoted by any of the following recipient of a special program (RSP) indicators in Table 5 are not eligible for enrollment into the managed care program.
Table 5South Carolina Department of Health and Human Services
SFY 2017 Medicaid Managed Care Capitation Rate Development RSP Indicators Not Eligible for Managed Care Enrollment
RSP Code Payment Category RSP Code Payment Category
AUTW Autism Waiver HSCE Head & Spinal Cord Waiver - Established
CLTC Elderly Disabled Waiver HSCN Head & Spinal Cord Waiver - New
CSWE Community Supports Waiver – Established MCHS Hospice
CSWN Community Supports Waiver - New MCSC PACE DMRE DMR Waiver - Established NHTR Nursing Home Transition
DMRN DMR Waiver – New PRTF Psychiatric Residential Treatment Facility
HIVA HIV/AIDS Waiver VENT Ventilator Dependent Waiver

Milliman Client Report
State Fiscal Year 2017 Rate Certification 6
SCM01-64
June 22, 2016
The SFY 2017 capitation rate development covers the following capitation rate cells:
Table 6South Carolina Department of Health and Human Services
SFY 2017 Medicaid Managed Care Capitation Rate Development Managed Care Capitation Rate Cells
Rate Cell Rate Cell Indicator TANF: 0 – 2 months old AH3 TANF: 3 – 12 months old AI3 TANF: Age 1 – 6 AB3 TANF: Age 7 – 13 AC3 TANF: Age 14 – 18 Male AD1 TANF: Age 14 – 18 Female AD2 TANF: Age 19 – 44 Male AE1 TANF: Age 19 – 44 Female AE2 TANF: Age 45+ AF3 SSI – Children SO3 SSI – Adult SP3 OCWI WG2 DUAL Foster Care Children FG3 KICK MG2/NG2
Note that the Duals rate cell does not have a corresponding rate cell description, because individuals identified in this category are not considered eligible for managed care enrollment. This rate cell only applies to individuals who receive retroactive Medicare eligibility while enrolled in an MCO. The Dual rate cell represents the fee-for-service (FFS) equivalent value estimated for this population, which is then adjusted to reflect the managed care program. The capitation rate includes all Medicare crossover claims payments and expenditures related to services covered by Medicaid and not Medicare that are the responsibility of the MCOs for a dually eligible individual.
(d) Eligibility criteria
Most Medicaid beneficiaries are required to enroll in managed care on a mandatory basis. Medicaid beneficiaries who are on waivers, institutionalized, or dual-eligible are served on a fee-for-service basis or in the Prime program. Beneficiaries that may enroll in Medicaid managed care on a voluntary basis include SSI children, foster care children and children receiving adoption assistance. Further detail and clarification on managed care eligibility criteria can be found at the following link:
https://msp.scdhhs.gov/managedcare/sites/default/files/Pay%20cats%20and%20Managed%20Care%20Participation%20requirements%208-10-15_0.pdf

Milliman Client Report
State Fiscal Year 2017 Rate Certification 7
SCM01-64
June 22, 2016
(e) Covered services
The following table outlines the core benefits covered under the managed care capitation rate:
Table 7South Carolina Department of Health and Human Services
SFY 2017 Medicaid Managed Care Capitation Rate Development List of Core Benefits
Ambulance Transportation Hearing Aids and Hearing Aid Accessories Outpatient Services
Ancillary Medical Services Home Health Services Physician Services
Audiological Services
Hysterectomies, Sterilizations and Abortions (as covered in policy guidelines) Prescription Drugs
Chiropractic Services Independent Laboratory and X-Ray Services
Preventive and Rehabilitative Services for Primary Care Enhancement
Communicable Disease Services Inpatient Hospital Services
Psychiatric, Rehabilitative Behavioral Health, and associated outpatient mental health services
Disease Management
Institutional Long-Term Care Facilities/Nursing Homes for short-term stays
Rehabilitative Therapies for Children - Non-Hospital Based
Durable Medical Equipment Maternity Services Substance Abuse Early & Periodic Screening, Diagnosis and Treatment (EPSDT) / Well Child Newborn Hearing Screenings
Transplant and Transplant-Related Services
Family Planning Services Outpatient Pediatric AIDS Clinic Services (OPAC) Vision Care Services
Notes:
1. The managed care policies & procedures (P&P) manual indicates that MCOs are responsible for covering corneal transplants. With respect to other types of transplants as outlined in the P&P manual, MCOs are responsible for pre- and post-transplant services as documented in the manual.
2. The Hepatitis C class of prescriptions drugs is carved out of the managed care capitation rate 3. https://msp.scdhhs.gov/managedcare/sites/default/files/2014MCOContractAmendment1.pdf. Detailed
benefit coverage information for all Core Benefits in this table can be found within the Managed Care Policy and Procedure Manual.

Milliman Client Report
State Fiscal Year 2017 Rate Certification 8
SCM01-64
June 22, 2016
2. DATA
This section provides information on the data used to develop the capitation rates. The base SFY 2015 experience data described in this section is illustrated in Appendix 5.
A. DESCRIPTION OF THE DATA
i. Description of the data
(a) Types of data
The primary data sources used or referenced in the development of the capitation rates are the following:
Historical enrollment and eligibility files; Encounter data submitted by the MCOs; FFS claims for dual eligible individuals and rehabilitative behavioral health and associated outpatient mental health
services (RBHS) carve-in analysis; SFY 2017 MCO Rate-Setting Survey completed by each MCO; Statutory financial statement data; and, CRCS reports
(b) Age of the data
The data serving as the base experience in the capitation rate development process was incurred during SFY 2015. The encounter data for the SFY 2015 base period reflected encounters adjudicated and submitted through the monthly encounter data warehousing process through January 2016. The FFS data used in the analysis and development of the RBHS carve-in was incurred in July 2013 through November 2015, with paid run-out through January 2016.
The encounter data provided by SCDHHS was also used in the capitation rate development for the following purposes:
For the purposes of trend development, we reviewed encounter experience from SFY 2013 and SFY 2014. We observed encounter data incurred from October through December 2015 and paid and submitted through the
data warehousing process through January 2016 to estimate the adjustment that allocates specific services to the KICK payment from other rate cells, resulting from the conversion to ICD-10 diagnosis codes effective October 1, 2015.
The encounter data used in the development of the supplemental teaching physician (STP) payment reflected encounters incurred from October 2013 through September 2014, with paid run-out through January 2016.
We also summarized statutory financial statement data from calendar years 2014 and 2015. Financial statement data was collected using SNL Financial.
(c) Data sources
The historical claims and enrollment experience for the encounter data obtained through the encounter data warehousing process was provided to Milliman by Clemson, the data administrator for SCDHHS. Medicaid enrollment processed by MEDS and Curam were provided to us by SCDHHS for the purposes of validating the eligibility assignment in developing the SFY 2017 capitation rates. The sources of other data are noted in sections (a) and (b).
(d) Sub-capitation
The encounter data summaries have been adjusted to include estimated expenditures for sub-capitated claims, based on sub-capitated units reported by the MCOs in the encounter data. The additional expenditures were developed assuming that the average cost per unit for sub-capitated claims would be equal to the average cost per unit for other encounter claims in the specified service category.
Milliman Client Report
State Fiscal Year 2017 Rate Certification 9
SCM01-64
June 22, 2016
ii. Availability and quality of the data
(a) Steps taken to validate the data
The base experience used in the capitation rates primarily relies on encounter data submitted to SCDHHS by participating MCOs. The actuary, the MCOs, and SCDHHS all play a role in validating the quality of encounter data used in the development of the capitation rates.
The fee-for-service data is provided by SCDHHS. Milliman has many years of experience working with SCDHHS’s FFS data. Milliman performs routine reconciliation of SCDHHS’s financial data as part of the monthly data validation process and provides budgeting and forecasting assistance to the State, which involves aggregate claim reconciliation to SCDHHS’s financial statements.
The remainder of the validation section relates to encounter data used in the rate development.
Completeness
Encounter Data
Encounter data is summarized quarterly through the capitation rate calculation sheet (CRCS) process. Separate sets of summaries, by rate group, are prepared for each health plan. Each summary illustrates utilization, cost per service, and per member per month cost for the population, stratified by category of service. The format of each quarterly exhibit is similar to the base data exhibits that are provided as part of this certification (Appendix 5), allowing most data issues to be discovered before the annual capitation rate development process.
The quarterly CRCS reconciliation process allows for three months of run-out from the end of the reported calendar quarter. For example, the first report of the calendar year would include the following claims:
Services incurred January 1 through March 31 Paid on or before June 30
The actuary compares the CRCS summaries to summary totals submitted by the health plans. Where the difference between the plan’s encounter data and financial data is more than 3%, the plan is subject to a financial penalty per their contract with the state. Plans are rarely penalized, and the discrepancy is more commonly under 1%. The actuary also provides all the individual encounter claims back to the health plans for analysis. This allows the health plans to identify any claims that need to be resubmitted or research any discrepancies that may exist in the final summary.
Finally, we submitted encounter data validation letters to each of the MCOs to confirm that their summarized SFY 2015 data is appropriate for use in the development of the capitation rate.
The annual rate setting process for SFY 2017 uses one year of experience data, with seven months of run-out.
The SFY 2015 encounter data used in the development of the rates was adjudicated through January 31, 2016. The seven months of claims run-out after the end of the fiscal year results in incurred but not paid (IBNP) claim liability estimates having a limited effect on the estimated incurred expenditures for SFY 2015. However, as noted in this report, claims completion is applied to the encounter data for estimated SFY 2015 claims adjudicated after January 31, 2016.
Accuracy
Encounter Data
Checks for accuracy of the data begin with the health plans’ internal auditing and review processes.
When the data is submitted to SCDHHS, it is subjected to most of the validation checks SCDHHS applies to fee-for-service claims. For example, the data must contain a valid Medicaid recipient ID for an individual who was enrolled at the time the service was provided, and assigned to the health plan.
The state actuary also reviews the encounter data to ensure each claim is related to a covered individual and a covered service. The actuary also reviews the CRCS quarterly summaries to ensure that the data for each service is consistent across the health plans and when compared to prior historical period as applicable. Stratification by rate group facilitates this review, as it mitigates the impact of changes in population mix.

Milliman Client Report
State Fiscal Year 2017 Rate Certification 10
SCM01-64
June 22, 2016
The actuary also compares the encounter data with financial information submitted by each plan. To provide greater transparency to the MCOs in the data validation process for the SFY 2017 capitation rates, a summary was provided to each health plan that starts with total submitted encounter claims and identifies claims that have been removed from the base data summaries, such as Hepatitis C claims, voided claims, expenditures for non-state plan services, and claims that have been removed because of unmatched eligibility records.
(b) Actuary’s assessment
As required by Actuarial Standard of Practice (ASOP) No. 23, Data Quality, we disclose that Milliman has relied upon certain data and information provided by South Carolina Department of Health and Human Services and their vendors, primarily the health plans. The values presented in this letter are dependent upon this reliance.
We found the encounter and FFS data to be of appropriate quality for purposes of developing actuarially sound capitation rates. However, due to the potential under-reporting of encounter data expenditures as reported in the MCOs response to the SFY 2017 MCO Rate-Setting Survey, an adjustment has been made to increase the base data to a level consistent with historical reported comparisons documented in the CRCS process defined above
Encounter data validation letters were submitted to each of the MCOs to confirm that their summarized SFY 2015 data is appropriate for use in the development of the capitation rates. For plans that reported a material variance in their response to the SFY 2017 MCO Rate-Setting Survey, an adjustment has been made to increase the base data to a level consistent with historical reported comparisons documented in the CRCS process. This impacted two plans, resulting in a 0.6% increase to the aggregate SFY 2015 base data.
Additionally, two months of data beyond the run-out period (January 2016) were reviewed to capture any data that was submitted after the base data reports were finalized related to the SFY 2015 experience period. This review identified a significant amount of negative claim activity impacting the SFY 2015 base period data that would not be projected with the calculated completion factors. As such, this significant void activity was netted against the under-reported data identified in the MCO Surveys, resulting in a net increase of 0.4% to the SFY 2015 base data.
(c) Data concerns
We have not identified any material concerns with the quality or availability of the data, other than the under-reporting of encounter data as discussed in the previous section and adjusted for in the development of the actuarially sound capitation rates.
iii. Use of encounter and fee-for-service data
As all the populations that will be enrolled in managed care during the rate period were included in the risk-based managed care delivery system in the SFY 2015 base experience period, fee-for-service (FFS) data was not included in the base experience used to develop the capitation rates, with the exception of the dual rate cell. FFS experience was also used to estimate the impact of including SCDHHS’s policy decision to move all rehabilitative behavioral health services (RBHS) into the managed care delivery system.
iv. Use of managed care encounter data
Managed care encounter data was the primary data source used in the development of the capitation rates.
v. Reliance on a data book
Development of the capitation rates did not rely on a data book or other summarized data source. We were provided with detailed claims data for all covered services and populations. We created data books summarizing SFY 2015 encounter data, which were shared with SCDHHS and participating MCOs.
B. DATA ADJUSTMENTS
Capitation rates were developed primarily from SFY 2015 encounter data. Adjustments were made to the base experience for completion, reimbursement changes, and other program adjustments.

Milliman Client Report
State Fiscal Year 2017 Rate Certification 11
SCM01-64
June 22, 2016
i. Credibility adjustment
The South Carolina Medicaid managed care program populations, as represented in the base experience, were fully credible. No adjustments were made for credibility.
ii. Completion adjustment
The MCO data submitted by the health plans and the FFS data used in developing the capitation rates was analyzed separately to estimate claim completion factors. The base period encounter and FFS data reflects claims incurred during SFY 2015 (July 1, 2014 through June 30, 2015) and paid through January 2016. Separate sets of completion factors for the two data sources were developed by summarizing the claims data and applying traditional actuarial techniques to develop estimates of incurred but not paid (IBNP) liability.
First, we stratified the data by category of service, in the population groupings illustrated in Table 8. Claims for each of these population-service category stratifications were analyzed and formed into lag triangles by paid and incurred month. Claim completion factors were developed for each month of the base experience period, based on historical completion patterns. The monthly completion factors were applied to SFY 2015 experience to estimate the remaining claims liability for the fiscal year. Results were aggregated into annual completion factors for the fiscal year.
The claim completion factors applied to SFY 2015 data are illustrated by population and major service category in Table 8.
Notes:
1. Completion factors for the Dual population were developed from FFS source data. All other populations were developed from encounter data.
iii. Errors found in the data
Encounter data validation letters were submitted to each of the MCOs to confirm that their summarized SFY 2015 data is appropriate for use in the development of the capitation rates. For plans that reported a material variance in their response to the SFY 2017 MCO Rate-Setting Survey, an adjustment has been made to increase the base data to a level consistent with historical reported comparisons documented in the Capitation Rate Calculation Sheet (CRCS) process. This impacted two plans, resulting in a 0.6% increase to the SFY 2015 base data, primarily impacting hospital inpatient and outpatient services.
Additionally, two months of data beyond the run-out period (January 2016) were reviewed to capture any encounter data that was submitted after the base data reports were finalized. This review identified a significant amount of negative claim activity impacting the SFY 2015 base period data that would not be projected with the calculated completion factors. As such, this significant void activity was netted against the underreported data identified in the MCO Surveys, resulting in a net impact of 0.4% to the SFY 2015 base data.
Table 8South Carolina Department of Health and Human Services
SFY 2017 Medicaid Managed Care Capitation Rate DevelopmentCompletion Factors Applied to SFY 2015 Experience Data
Category of Service TANF/Foster SSI OCWI Dual KickHospital
Inpatient 1.026 1.011 1.006 1.026 1.003 Outpatient 1.005 1.009 1.004 1.022 1.005
Pharmacy 1.000 1.000 1.000 1.005 N/AAncillaries 1.006 1.007 1.010 1.035 N/APhysician 1.005 1.007 1.006 1.016 1.008
Milliman Client Report
State Fiscal Year 2017 Rate Certification 12
SCM01-64
June 22, 2016
iv. Program change adjustments
All program and reimbursement changes that have occurred in the Medicaid managed care program since July 1, 2014, the beginning of the base experience period used in the capitation rates, are described below.
A. Changes in Provider Reimbursement
Changes in provider reimbursement were evaluated by performing repricing analyses on the individual encounter data for inpatient hospital, outpatient hospital, and physician services. For each category of service, we reviewed the distribution of the MCO paid amount relative to the repriced value using Medicaid fee-for-service reimbursement. We established an upper and lower bound from this distribution to ensure we captured a representative sample of claims that encompassed the multimodal distribution of the repriced values relative to the MCO paid amounts. Additionally, we reviewed the upper and lower bounds to ensure we captured a representative volume of the encounter claims reflected in the SFY 2015 base data for the repricing and reimbursement adjustment analyses.
A.1. Inpatient Hospital Facility Reimbursement Changes
Effective October 1, 2014, inpatient hospital DRG base rates were increased by 2.5%. The rate increase did not apply to any medical education components of the hospital-specific per discharge rates.
Effective October 1, 2015, a revised inpatient hospital DRG base rate schedule was implemented and the pricing calculator was updated to coincide with the transition from APR DRG, version 28 to APR DRG, version 32.
To estimate the impact of this inpatient hospital reimbursement change, we performed a repricing analysis to evaluate individual encounter data claims using Medicaid fee-for-service reimbursement methodology. We began with all inpatient hospital claims, and excluded any claims where the MCO paid amount was either below 75% of the repriced value or above 125% of the repriced value to focus the analysis within a reasonable repricing bound. In addition, we excluded claims that did not find a match between the service provider ID and the listing of hospital-specific per discharge DRG rates provided by SCDHHS, and we also excluded nursing facility claims. The application of exclusion criteria resulted in the repricing of approximately 82% of total inpatient dollars.
Evaluation of the 82% sample of inpatient claims that were repriced indicated that MCO reimbursement is approximately 104.0% of the Medicaid fee schedule, on average.
This analysis, in conjunction with plan-reported information in the MCO surveys, and discussion with SCDHHS indicates that 1% efficiency can be achieved for inpatient hospital services. Consequently, we adjusted the MCO encounter data by a factor of 0.99.
Table 9 presents the composite inpatient hospital adjustment by rate cell resulting from the application of the current Medicaid fee schedule to base period repriced encounter data and adjusted FFS data for the Dual rate cell.

Milliman Client Report
State Fiscal Year 2017 Rate Certification 13
SCM01-64
June 22, 2016
Notes:
1. Slight variation between the product of individual component factors and the final adjustment may exist due to truncation of the individual adjustment factors.
For each rate cell, more detailed adjustment factors are applied at the category of service level and can be found in the “reimbursement adjustment” column of Appendix 7.
A.2. Outpatient Hospital Facility Reimbursement Changes
Effective October 1, 2014, outpatient hospital multipliers were increased by 2.5%. The rate increase did not apply to any medical education components of the outpatient multipliers.
Effective October 1, 2015, hospital-specific outpatient multipliers were re-configured to establish a floor at the 15th percentile and a cap at the 65th percentile, based on hospital ranking of outpatient multipliers at October 1, 2013. The floor was set at the October 2014 outpatient multiplier for the hospital at the 15th percentile and the cap was set at the October 2014 outpatient multiplier for the hospital at the 65th percentile.
For hospitals that are not impacted by the October 1, 2015 normalization, the October 2014 hospital-specific multiplier values will apply. We have utilized October 1, 2015 hospital-specific outpatient multiplier information supplied by SCDHHS to estimate the prospective adjustment factor for this reimbursement change.
Similar to the method used to develop the adjustment factor for inpatient hospital reimbursement, we performed a repricing analysis on the outpatient hospital data to evaluate individual claims using Medicaid fee-for-service reimbursement methodology and excluded any claims where the MCO paid amount was either below 75% of the repriced value or above 125% of the repriced value. In addition, we excluded claims that did not find a match between the service provider ID and the listing of hospital-specific outpatient multipliers provided by SCDHHS. The application of exclusion criteria resulted in the repricing of approximately 65% of total outpatient dollars.
Table 9
South Carolina Department of Health and Human Services
SFY 2017 Medicaid Managed Care Capitation Rate Development
Composite Inpatient Hospital Adjustment Factors by Rate Cell
Base Data October 2014 October 2015 Inpatient Hospital
Rate Cell Adjustment Reimbursement Reimbursement Adjustment
TANF: 0-2 months old (AH3) 0.9900 1.0064 0.9573 0.9539TANF: 3-12 months old (AI3) 0.9900 1.0045 1.0121 1.0065TANF: Age 1-6 (AB3) 0.9900 1.0058 1.0237 1.0194TANF: Age 7-13 (AC3) 0.9900 1.0055 1.0155 1.0109TANF: Age 14-18, Male (AD1) 0.9900 1.0062 1.0224 1.0184TANF: Age 14-18, Female (AD2) 0.9900 1.0052 1.0214 1.0165TANF: Age 19-44, Male (AE1) 0.9900 1.0065 1.0147 1.0111TANF: Age 19-44, Female (AE2) 0.9900 1.0060 1.0221 1.0179TANF: Age 45+ (AF3) 0.9900 1.0054 1.0174 1.0128
SSI - Children (SO3) 0.9900 1.0061 1.0169 1.0128
SSI - Adults (SP3) 0.9900 1.0062 0.9865 0.9827
OCWI (WG2) 0.9900 1.0081 0.9822 0.9803
DUAL 1.0000 1.0062 0.9848 0.9909
Foster Care - Children (FG3) 0.9900 1.0038 0.9728 0.9667
KICK (MG2/NG2) 0.9900 1.0067 1.1060 1.1023

Milliman Client Report
State Fiscal Year 2017 Rate Certification 14
SCM01-64
June 22, 2016
Table 10 presents the composite outpatient hospital adjustment by rate cell resulting from the application of the current Medicaid fee schedule to base period data included in the repricing analysis.
For each rate cell, more detailed adjustment factors are applied at the category of service level and can be found in the “reimbursement adjustment” column of Appendix 7.
A.3. Physician Reimbursement Changes
Effective January 1, 2015, SCDHHS implemented an enhanced fee schedule for qualifying physicians providing evaluation & management services. Teaching physicians who qualify for the supplemental teaching payment are not eligible for the enhanced fee. Effective July 1, 2015, the enhanced fee schedule was revised to reflect the different FFS reimbursement that applies for services performed in a facility versus those performed in a non-facility setting for the qualifying providers and services described above.
To develop the adjustment factor for physician reimbursement, we performed a repricing analysis to evaluate individual encounter data claims using Medicaid fee-for-service reimbursement methodology at the current Medicaid fee schedule.
The review of the distribution of MCO paid amounts relative to the repriced values using Medicaid fee-for-service reimbursement methodology for physician and ancillary services indicated a more consistent reimbursement methodology between the MCOs and Medicaid fee-for-service for physician services than in the facility setting. A more prominent mode existed in the distribution with very little unusual activity in the tails of the distribution. As such, we increased the upper and lower bounds to capture more of the physician claims in the repricing analysis.
We began with all non-FQHC physician claims, and excluded any claims where the MCO paid amount was either below 50% of the repriced value or above 150% of the repriced value, to focus the analysis within a reasonable repricing bound. The application of exclusion criteria resulted in the repricing of approximately 89% of total non-FQHC physician dollars.
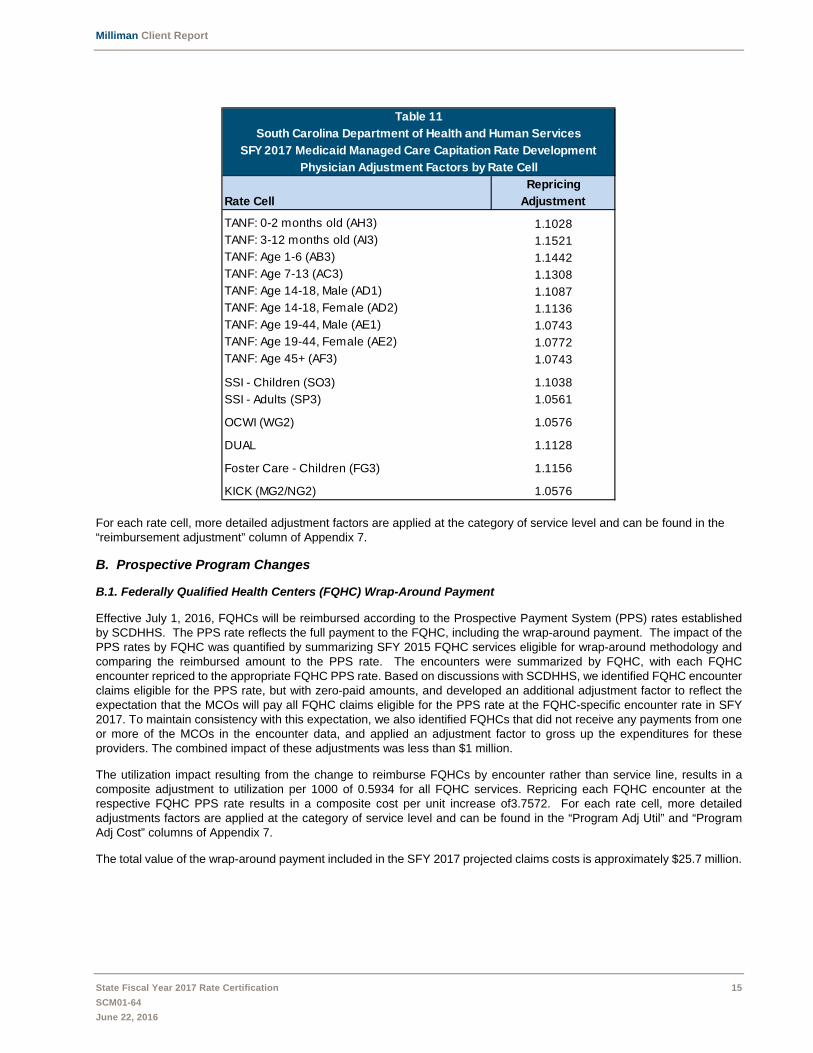
Table 11 presents the results of the physician repricing analysis:
Table 10
South Carolina Department of Health and Human Services
SFY 2017 Medicaid Managed Care Capitation Rate DevelopmentComposite Outpatient Hospital Adjustment Factors by Rate Cell
October 2014 October 2015 Outpatient Hospital
Rate Cell Reimbursement Reimbursement Adjustment
TANF: 0-2 months old (AH3) 1.0064 0.9895 0.9958
TANF: 3-12 months old (AI3) 1.0055 0.9878 0.9932
TANF: Age 1-6 (AB3) 1.0054 0.9890 0.9943
TANF: Age 7-13 (AC3) 1.0056 0.9885 0.9940
TANF: Age 14-18, Male (AD1) 1.0058 0.9883 0.9940
TANF: Age 14-18, Female (AD2) 1.0053 0.9901 0.9954
TANF: Age 19-44, Male (AE1) 1.0059 0.9903 0.9961
TANF: Age 19-44, Female (AE2) 1.0055 0.9897 0.9952
TANF: Age 45+ (AF3) 1.0056 0.9883 0.9939
SSI - Children (SO3) 1.0056 0.9827 0.9882
SSI - Adults (SP3) 1.0062 0.9878 0.9939
OCWI (WG2) 1.0076 0.9889 0.9963
DUAL 1.0061 0.9874 0.9934
Foster Care - Children (FG3) 1.0056 0.9882 0.9937
KICK (MG2/NG2) 1.0000 1.0000 1.0000
Milliman Client Report
State Fiscal Year 2017 Rate Certification 15
SCM01-64
June 22, 2016
For each rate cell, more detailed adjustment factors are applied at the category of service level and can be found in the “reimbursement adjustment” column of Appendix 7.
B. Prospective Program Changes
B.1. Federally Qualified Health Centers (FQHC) Wrap-Around Payment
Effective July 1, 2016, FQHCs will be reimbursed according to the Prospective Payment System (PPS) rates established by SCDHHS. The PPS rate reflects the full payment to the FQHC, including the wrap-around payment. The impact of the PPS rates by FQHC was quantified by summarizing SFY 2015 FQHC services eligible for wrap-around methodology and comparing the reimbursed amount to the PPS rate. The encounters were summarized by FQHC, with each FQHC encounter repriced to the appropriate FQHC PPS rate. Based on discussions with SCDHHS, we identified FQHC encounter claims eligible for the PPS rate, but with zero-paid amounts, and developed an additional adjustment factor to reflect the expectation that the MCOs will pay all FQHC claims eligible for the PPS rate at the FQHC-specific encounter rate in SFY 2017. To maintain consistency with this expectation, we also identified FQHCs that did not receive any payments from one or more of the MCOs in the encounter data, and applied an adjustment factor to gross up the expenditures for these providers. The combined impact of these adjustments was less than $1 million.
The utilization impact resulting from the change to reimburse FQHCs by encounter rather than service line, results in a composite adjustment to utilization per 1000 of 0.5934 for all FQHC services. Repricing each FQHC encounter at the respective FQHC PPS rate results in a composite cost per unit increase of3.7572. For each rate cell, more detailed adjustments factors are applied at the category of service level and can be found in the “Program Adj Util” and “Program Adj Cost” columns of Appendix 7.
The total value of the wrap-around payment included in the SFY 2017 projected claims costs is approximately $25.7 million.
Table 11
South Carolina Department of Health and Human Services
SFY 2017 Medicaid Managed Care Capitation Rate Development
Physician Adjustment Factors by Rate Cell
Repricing
Rate Cell Adjustment
TANF: 0-2 months old (AH3) 1.1028TANF: 3-12 months old (AI3) 1.1521TANF: Age 1-6 (AB3) 1.1442TANF: Age 7-13 (AC3) 1.1308TANF: Age 14-18, Male (AD1) 1.1087TANF: Age 14-18, Female (AD2) 1.1136TANF: Age 19-44, Male (AE1) 1.0743TANF: Age 19-44, Female (AE2) 1.0772TANF: Age 45+ (AF3) 1.0743
SSI - Children (SO3) 1.1038
SSI - Adults (SP3) 1.0561
OCWI (WG2) 1.0576
DUAL 1.1128
Foster Care - Children (FG3) 1.1156
KICK (MG2/NG2) 1.0576

Milliman Client Report
State Fiscal Year 2017 Rate Certification 16
SCM01-64
June 22, 2016
B.2. Rehabilitative Behavioral Health Services
Prior to July 1, 2016, all rehabilitative behavioral health and associated outpatient mental health services, excluding DAODAS and LIPS providers, were paid on a fee-for-service basis. Beginning on July 1, 2016, all RBHS services provided to managed care enrollees by the following agencies and providers will be newly included in the managed care capitation rate:
Department of Mental Health (DMH) Providers
Department of Mental Health (DMH)
Department of Health and Human Services (DHHS) Providers
Private RBHS providers Clubhouse providers Therapeutic daycares
Other State Agencies
Medical University of South Carolina (MUSC) Department of Juvenile Justice (DJJ) Department of Education (DOE) school districts approved by SCDHHS
We estimated the impact of including RBHS services in the managed care program effective July 1, 2016 by summarizing and analyzing all RBHS fee-for-service expenditures related to MCO enrolled members for the period July 2013 through November 2015. Expenditures for SFY 2014 and SFY 2015 were summarized and stratified by agency and provider. Table 12 provides a high-level summary of the aggregate RBHS PMPM by state fiscal year and agency.
The following adjustments were made to the SFY 2015 RBHS base experience data.
Completion Adjustment
Completion factors were applied by individual rate cell consistent with the factors illustrated in Table 8.
Utilization Trend
Annual utilization trend of 2% was applied to all SFY 2015 utilization, consistent with the physician and ancillary trends illustrated in Table 16.
Reimbursement Changes
A repricing analysis was performed to evaluate the individual fee-for-service claims at the July 1, 2016 fee schedule.
Effective March 1, 2015, SCDHHS implemented a change for the following DHHS providers: clubhouse, therapeutic daycares, and private providers. The estimated impact of this change is a decrease of 4.1%.
Effective July 1, 2016, SCDHHS will implement a change to the Medicaid fee schedule for all DMH providers. The estimated impact of this change is an increase of 12.6%.
Table 12South Carolina Department of Health and Human Services
SFY 2017 Medicaid Managed Care Capitation Rate DevelopmentRBHS Analysis
SFY 2014 & SFY 2015 Base Experience Data (PMPMs)SFY 2014 SFY 2015
Agency/ProviderMCO Member
MonthsExpenditures
($ millions) PMPMMCO Member
MonthsExpenditures
($ millions) PMPMDMH Providers 7,022,996 $ 51.3 $ 7.30 9,011,330 $ 62.9 $ 6.98DHHS Providers 7,022,996 18.8 2.68 9,011,330 80.9 8.98 Other State Agencies 7,022,996 14.4 2.06 9,011,330 14.6 1.62 Total 7,022,996 $ 84.5 $ 12.04 9,011,330 $ 158.5 $ 17.59

Milliman Client Report
State Fiscal Year 2017 Rate Certification 17
SCM01-64
June 22, 2016
No fee schedule change is expected for all other state agencies.
Managed Care Efficiency
We applied percentage adjustments to the SFY 2015 experience data for DHHS private providers to reflect the utilization differential between the SFY 2015 base experience period and the levels targeted for the projection period managed care environment. The managed care adjustments were applied to the DHHS private providers only, and more specifically to certain categories defined for this rate-setting exercise.
A significant portion of the projected utilization improvement for the SFY 2017 contract period has already been realized based on targeted efforts by SCDHHS beginning in February 2015 to identify nine providers with unusual practice patterns and remove them from the approved provider list. Within nine months, only 15% of the individuals receiving services from the first four targeted providers continued to get services as of November 2015. We expect similar results for the remaining five providers targeted by SCDHHS. These providers are identified as “SCDHHS Targeted Providers” in Table 13 below.
Based on discussions with SCDHHS, we identified 9 providers who primarily serve the Therapeutic Foster Care (TFC) sub-population through community supports services. The TFC sub-population is a specialized group of individuals who are primarily in the Foster Care population (but can be identified in other rate cells) who are able to access community supports services that are not subject to the level of prior authorization required for other RBHS providers and services. Because of this SCDHHS policy, we did not apply a managed care efficiency adjustment to the providers identified by SCDHHS as “TFC providers”. In order to identify all SFY 2015 base experience data associated with the TFC providers, SCDHHS has provided us with the list of TFC providers included in the base data.
For the remaining DHHS private providers, the SFY 2014 and SFY 2015 utilization by provider was analyzed to determine practice pattern changes that occurred on or after July 1, 2014 when SCDHHS instituted policy changes that removed the state agency-initiated 254 prior authorization requirement for private providers. The capacity of the private providers increased significantly in SFY 2015, as the number of providers, excluding SCDHHS targeted providers and the TFC providers, grew from 39 in SFY 2014 to 68 in SFY 2015.
The managed care efficiency factor takes into account this growth in the number of providers and reflects a more consistent case load by provider and service intensity mix as observed among the private providers in SFY 2014. The resulting managed care factor for “all other private providers” is 0.70, to reflect an expected utilization savings of 30%.
No managed care adjustments have been applied for any providers classified as DMH, MUSC, DJJ, DOE, clubhouse providers, therapeutic daycares, or TFC providers.
Table 13 provides a summary of the development of the composite RBHS benefit cost PMPM carve-in.

Milliman Client Report
State Fiscal Year 2017 Rate Certification 18
SCM01-64
June 22, 2016
Notes:
1. Estimated PMPMs exclude Duals 2. Average composite completion factors have been illustrated in Table 13. Actual completion factors applied by category of service.
Additional detail by rate cell is included in Appendix 7.
Table 13South Carolina Department of Health and Human Services
SFY 2017 Medicaid Managed Care Capitation Rate DevelopmentRBHS Analysis
SFY 2017 Projected PMPM
Agency/Provider
SFY 2015PMPM
CompletionFactor Trend
ReimbursementChange
Managed Care
SFY 2017PMPM
DHHS Providers
SCDHHS Targeted Private Providers $ 2.32 1.0167 1.0404 0.9594 0.1500 $ 0.35
Therapeutic Foster Care Providers 1.46 1.0167 1.0404 0.9594 1.0000 1.48
All Other Private Providers 4.51 1.0167 1.0404 0.9594 0.7000 3.20
Clubhouse Providers 0.25 1.0167 1.0404 0.9594 1.0000 0.25
Therapeutic Daycares 0.29 1.0167 1.0404 0.9594 1.0000 0.30
Alcohol & Drug Abuse 0.16 1.0167 1.0404 1.0000 1.0000 0.17
DMH Providers
DMH $ 6.98 1.0167 1.0404 1.1255 1.0000 $ 8.31
Other State Agencies
MUSC $ 0.99 1.0167 1.0404 1.0000 1.0000 $ 1.05
DJJ 0.00 1.0167 1.0404 1.0000 1.0000 0.00
DOE School Districts 0.63 1.0167 1.0404 1.0000 1.0000 0.67
Total $ 17.59 $ 15.78
Adjustments

Milliman Client Report
State Fiscal Year 2017 Rate Certification 19
SCM01-64
June 22, 2016
C. Changes in Covered Population
C.1. Redetermination
Review of emerging enrollment beyond the end of SFY 2015 indicates significant shifts in enrollment beginning in September 2015, as a result of eligibility redetermination activity performed by SCDHHS. Observation of emerging enrollment indicates changes to the underlying morbidity of the TANF Child (older than age 1) and TANF Adult populations compared to the SFY 2015 base period. We have utilized a Medicaid Rx risk scoring analysis to estimate an adjustment factor at the major population level for TANF Child (older than age 1) and TANF Adult populations. Our analysis consisted of calculating risk score relativities for each month beginning September 2015 and ending December 2015, compared to the risk scores calculated for the SFY 2015 base period, and taking the average of these relativities to arrive at the adjustment factor to recognize the impact of redetermination on the appropriate rate cells.
Table 14 provides a summary of the redetermination analysis.
C.2. OCWI Eligibility
OCWI eligibility decreased significantly in January 2015 as a result of SCDHHS efforts to evaluate OCWI eligibility status for all currently-enrolled OCWI individuals. Approximately 8,700 members were dis-enrolled as a result of this process. A list of all dis-enrolled OCWI individuals was provided by SCDHHS to evaluate the impact of these individuals with limited claims activity on the OCWI base period data. An adjustment was made by calculating the impact of removing the dis-enrolled members claims and eligibility data from the entire SFY 2015 base period. The resulting impact was an 8.2% increase to the OCWI rate cell.
C.3. Newborn Enrollment
Disruptions in processing eligibility for newborns caused a delay in newborn enrollment into the managed care program. We reviewed FFS data for all MCO-enrolled newborns to quantify the impact of the delayed enrollment into the managed care program. We identified approximately $8.6 million in FFS expenditures for MCO-enrolled individuals in the 0-2 month capitation rate cell. An adjustment was made to increase the encounter base data by $8.6 million, an increase of 5.9% to the 0-2 month rate cell, to reflect this enrollment issue.
C.4. Incarcerated Individuals
Incarcerated individuals are not eligible for the managed care program. We reviewed eligibility information provided by SCDHHS and observed approximately 2,000 member months for incarcerated individuals with limited benefits in the SFY 2015 base experience period. While the impact of adjusting the base period to reflect the removal of incarcerated individuals and claims was less than 0.02% in composite, the adjustment to the TANF 19-44 Male rate cell was approximately a 0.3% increase.
D. ICD-10 Conversion – Rate Cell Allocation Impacts
Effective October 1, 2015, diagnosis code reporting was converted from ICD-9 to ICD-10 diagnosis codes. For the capitation rate development, diagnosis codes are used to allocate maternity-related physician services and outpatient delivery services to the KICK rate cell. In consultation with SCDHHS, the KICK criteria was updated to reflect the ICD-10 conversion.
Table 14
South Carolina Department of Health and Human Services
SFY 2017 Medicaid Managed Care Capitation Rate Development
Retermination Adjustment Factors by Population
Medicaid Rx v5.4 Risk Score-Concurrent Relative Morbidity to SFY 2015
Population SFY 2015 Sept 2015 Oct 2015 Nov 2015 Dec 2015 Sept 2015 Oct 2015 Nov 2015 Dec 2015
SelectionAdjustment
Factor
TANF: Child 0.7176 0.7367 0.7353 0.7387 0.7370 102.7% 102.5% 102.9% 102.7% 1.0269
TANF: Adult 0.5725 0.6153 0.6096 0.6115 0.6121 107.5% 106.5% 106.8% 106.9% 1.0692

Milliman Client Report
State Fiscal Year 2017 Rate Certification 20
SCM01-64
June 22, 2016
To estimate the impact of this change on the SFY 2017 contract period, we observed encounter data incurred from October through December 2015 and paid and submitted through the data warehousing process through January 2016 to identify movement of specific services to the KICK payment from other rate cells. An adjustment was made by estimating the “new” services that would be allocated to the KICK rate cell, with an equal off-setting adjustment from the corresponding female rate cells. This adjustment is included in the “Other Base Adj Util” column of Appendix 6.
E. Program changes deemed immaterial to benefit expenses in the rate period
Adjustment factors were developed for policy and program changes estimated to materially affect the managed care program during SFY 2017 that are not fully reflected in the SFY 2015 base experience. Program adjustments were made in the rate development process to the extent a policy or reimbursement change is deemed to have a material cost impact to the MCOs. We defined a program adjustment to be ‘material’ if the total benefit expense for any individual rate cell is impacted by more than 0.1%. The following is a list of program adjustments deemed immaterial based on our review of the experience data and policy change.
MCO Coverage of Incontinence Supplies. Effective July 1, 2014, coverage of incontinence supplies was added to the managed care benefits. Because the incontinence supplies benefit was implemented on July 1, 2014, we examined emerging utilization and cost of the benefit to determine if usage of the benefit had not yet met long-term levels in SFY 2015. We did not observe any material change in utilization during the course of the 12 month period.
Nutritional Counseling. Effective August 1, 2015, coverage of obesity management services for adult beneficiaries with a Body mass Index (BMI) of 30 and greater who are currently not seeking gastric bypass surgery was added to the managed care capitation rate. We observed emerging experience through December 2015 and identified less than $5,000 of expenditures related to nutritional counseling services. Therefore, we did not find justification to reflect a program adjustment.
Emergency Transportation. HCPCS codes A0426 and A0428 were not included in the SCDHHS fee schedule prior to January 2016 and have not been covered consistently by the MCOs. Clarification has been provided to all MCOs regarding their contractual requirement to cover these services. Based on analysis by SCDHHS and a review of fee-for-service claims during the base period for A0426 and A0428 for MCO-enrolled members, the impact was deemed immaterial.
v. Exclusion of payments or services from the data
The following adjustments were made to the base experience data to reflect non-state plan services, pharmacy rebates, third party liability recoveries, non-encounter claims payments, and state plan services not covered by the capitation rate.
A. Services excluded from initial base data summaries
A.1. Hepatitis C Pharmacy Expenditures
Hepatitis C drugs were carved out of the managed care pharmacy benefit effective July 1, 2015. Therefore, we excluded all Hepatitis C expenditures from the SFY 2015 base data to more appropriately reflect the current managed care covered services. Appendix 4 provides a list of the NDC codes used to identify Hepatitis C expenditures. Approximately $9.3 million was excluded from the initial base data summaries included in Appendix 5. Each of the MCOs received a report documenting their plan-specific Hepatitis C expenditures removed from the base data in the capitation rate development.
A.2. Other Non-State Plan Services
We excluded all services included in the encounter data that do not reflect approved state plan services (nor are an approved in-lieu of service), such as circumcision. All claims for circumcision services, totaling approximately $0.2 million, were excluded from the initial base data summaries included in Appendix 5.
Milliman Client Report
State Fiscal Year 2017 Rate Certification 21
SCM01-64
June 22, 2016
B. Adjustments made to base data
B.1. State Plan Services Not Covered by the Capitation Rate
We adjusted the base experience data for services included in the encounter data that do not reflect covered benefits in the managed care program. These adjustments were developed based on our review of the SFY 2015 encounter data and application of the in-rate criteria provided by SCDHHS and included in Appendix 4. Approximately $1.1 million was removed from the base experience data related to inpatient transplant claims.
B.2. Pharmacy Rebates
Pharmacy expenditures were reduced by the composite supplemental rebate percentage during the SFY 2015 historical experience period reported by the MCOs in the SFY 2017 MCO Survey. The estimated adjustment factor of 0.9733 was uniformly applied to the pharmacy service category of each rate cell in Appendix 6.
B.3. Third Party Liability/Fraud and Abuse
In addition to actual cost avoidance reflected in the encounter data, we estimated additional third party liability (TPL) and fraud recoveries based on an analysis of the base period data and information submitted by the MCOs.
These data sources indicated that approximately 0.13% of total claims were recovered and not reflected in the baseline experience data. The estimated adjustment factor of 0.9987 was uniformly applied to each service category and rate cell in Appendix 6.
B.4. Non-encounter Claims Payment
We made an adjustment to the encounter data base experience period to reflect non-claim payments made to providers for items such as shared savings payments, quality incentives, and other similar provider incentive payments that are not reflected in the base data or in other components of the capitation rate. In total, the MCOs have reported approximately $8.4 million in payments that are included in the benefit cost component of the capitation rate development and have been reflected in an adjustment factor of 1.0041, uniformly applied to each service category and rate cell in Appendix 6.

Milliman Client Report
State Fiscal Year 2017 Rate Certification 22
SCM01-64
June 22, 2016
3. PROJECTED BENEFIT COST AND TRENDS
This section provides information on the development of projected benefit costs in the capitation rates.
A. DEVELOPMENT OF PROJECTED BENEFIT COSTS
i. Description of the data, assumptions, and methodologies
This section of the report outlines the data, assumptions, and methodology used to project the benefit costs to the rating period. The baseline benefit costs were developed using the following steps:
Step 1: Create unadjusted cost model summaries for the managed care population
The capitation rates were primarily developed from historical claims and enrollment data from the managed care enrolled populations. The data utilized to prepare the base period cost models consisted of SFY 2015 incurred encounter data that has been submitted by the MCOs. The information is summarized in Appendix 5 and is stratified by capitation rate cell and by major category of service. The exhibits in Appendix 5 reflect unadjusted summaries of the SFY 2015 base period data and are the combination of the MCO-specific encounter data summaries that were validated by each MCO.
Step 2: Apply historical and other adjustments to cost model summaries
As documented in the previous section, utilization and cost per service rates from the base experience period were adjusted for a number of items, including but not limited to: incomplete data adjustments, covered population changes, pharmacy rebates, TPL, and policy and program changes that occurred during SFY 2015.
Step 3: Adjust for prospective program and policy changes and trend to SFY 2017
We adjusted the SFY 2015 base experience for known policy and program changes that have occurred or are expected to be implemented between the base period and the end of the SFY 2017 rate period. In the previous section, we documented these items and the adjustment factors for each covered population. Assumed trend factors were applied for 24 months to the adjusted utilization and unit cost values, or per member per month (PMPM) values, as appropriate, from the midpoint of the base experience period (January 1, 2015) to the midpoint of the rate period (January 1, 2017).
Adjustments were applied to the adjusted benefit cost values to reflect changes in benefits between the base period and effective rate period. Additionally, we targeted improvements in managed care efficiency for specific rate cells and service categories that are estimated to impact projected 2016 benefit expense. The resulting PMPMs established the adjusted benefit expense by population rate cell for the rating period.
Material adjustments that were previously noted
The following material adjustments were applied to recognize changes to provider reimbursement, prospective program adjustments, changes to covered populations, and the reallocation of certain services to the KICK payment from other rate cells, and were documented in the prior section (2.B. Data Adjustments):
Inpatient hospital reimbursement Outpatient hospital reimbursement Physician reimbursement Addition of FQHC wrap-around payments Addition of RBHS Population adjustments for redetermination, OCWI rate cell, delay in newborn enrollment, and incarcerated
individuals Rate cell reallocations resulting from ICD-9 to ICD-10 diagnosis code conversion
Additionally, the following adjustments were applied to either reduce or increase the base data benefit cost for certain service and payment exclusions:
Non-state plan services Pharmacy rebates Hepatitis C drug treatments

Milliman Client Report
State Fiscal Year 2017 Rate Certification 23
SCM01-64
June 22, 2016
Transplant services outside the scope of the managed care capitation rate TPL/Fraud and Abuse Non-encounter claim payments
Other material adjustments - managed care efficiency
We calculated percentage adjustments to the experience data to reflect the utilization and cost per unit differential between the base experience and the levels targeted for the projection period managed care environment. We developed the targeted managed care efficiency adjustments through a review and analysis of SFY 2015 base period utilization levels achieved by each MCO, the NYU Center for Health and Public Service Research (CHPSR) Emergency Department Algorithm, and the AHRQ prevention quality indicators (PQI).
Emergency Room Services - For the outpatient hospital emergency room service category and the corresponding physician emergency room visits category, we reviewed the classification of claims using the NYU CHPSR Emergency Department Algorithm.
The NYU CHPSR tool classifies emergency room utilization into four (4) primary categories as well as categories that are excluded from the grouping. The four categories include: Non-emergency, Emergency/Primary Care Treatable, Emergency–Preventable/Avoidable, and Emergency–Not Preventable/Avoidable. Subsequent to the review of the experience into these defined categories, we developed specific adjustments for the first three categories to reflect the target utilization levels for the managed care plans. The following illustrates the adjustments by emergency room classification:
Non-emergency – 10% Reduction
Emergency/Primary Care Treatable – 5% Reduction
Emergency – Preventable/Avoidable – 2% Reduction
When applying the adjustments listed above, reductions were taken from level 1 emergency room claims first, followed by level 2 and level 3 claims if applicable. No adjustments were made to level 4 or level 5 emergency room claims. In coordination with determination of the managed care adjustments for hospital outpatient emergency room services, we assumed that most emergency room visits reduced would be replaced with an office visit. The utilization of professional office visits was increased proportionately.
Inpatient Hospital Services – We applied managed care adjustments to reflect higher levels of care management relative to the SFY 2015 base experience period. We identified potentially avoidable admissions using the AHRQ PQIs. Inpatient hospital managed care adjustments were developed by applying a 20% reduction to readmissions for the same DRG within 30 days, and a 10% reduction to potentially avoidable inpatient admissions for select PQIs. No adjustments were made to corresponding inpatient physician charges to account for the potential shift of these services to an ambulatory setting. Additionally, nursing facility claims were excluded from this analysis. The table below outlines the PQIs included in our analysis.
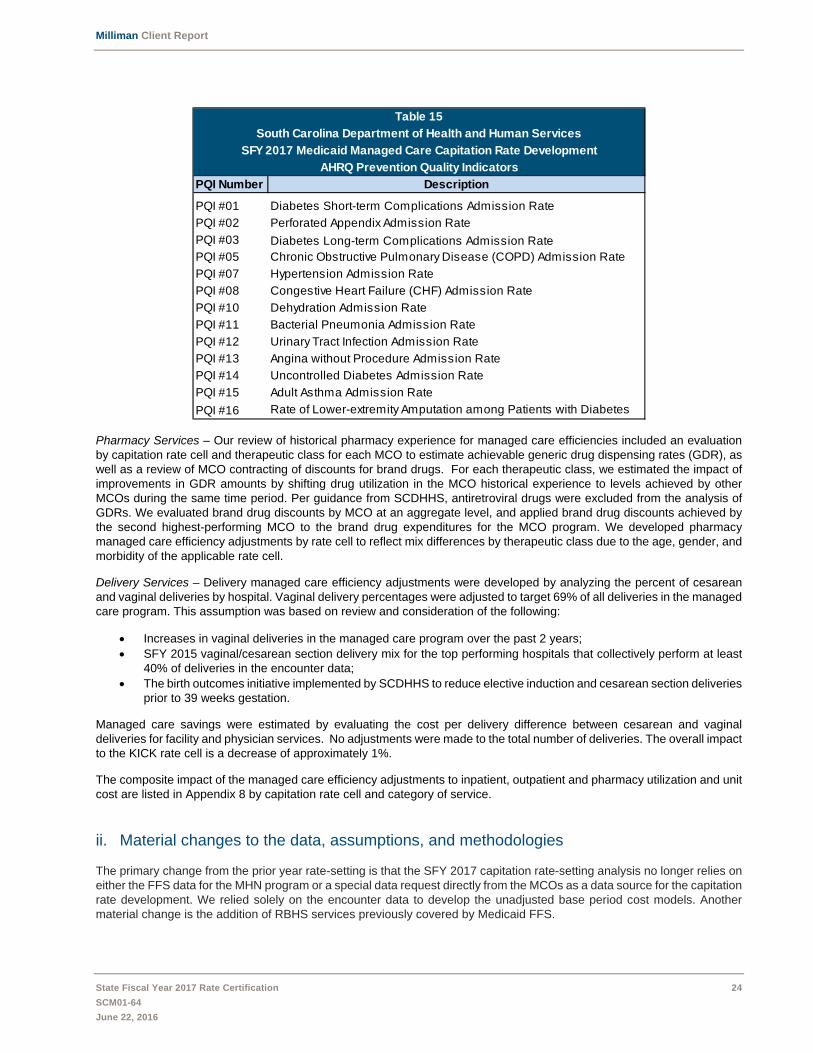
Milliman Client Report
State Fiscal Year 2017 Rate Certification 24
SCM01-64
June 22, 2016
Pharmacy Services – Our review of historical pharmacy experience for managed care efficiencies included an evaluation by capitation rate cell and therapeutic class for each MCO to estimate achievable generic drug dispensing rates (GDR), as well as a review of MCO contracting of discounts for brand drugs. For each therapeutic class, we estimated the impact of improvements in GDR amounts by shifting drug utilization in the MCO historical experience to levels achieved by other MCOs during the same time period. Per guidance from SCDHHS, antiretroviral drugs were excluded from the analysis of GDRs. We evaluated brand drug discounts by MCO at an aggregate level, and applied brand drug discounts achieved by the second highest-performing MCO to the brand drug expenditures for the MCO program. We developed pharmacy managed care efficiency adjustments by rate cell to reflect mix differences by therapeutic class due to the age, gender, and morbidity of the applicable rate cell.
Delivery Services – Delivery managed care efficiency adjustments were developed by analyzing the percent of cesarean and vaginal deliveries by hospital. Vaginal delivery percentages were adjusted to target 69% of all deliveries in the managed care program. This assumption was based on review and consideration of the following:
Increases in vaginal deliveries in the managed care program over the past 2 years; SFY 2015 vaginal/cesarean section delivery mix for the top performing hospitals that collectively perform at least
40% of deliveries in the encounter data; The birth outcomes initiative implemented by SCDHHS to reduce elective induction and cesarean section deliveries
prior to 39 weeks gestation.
Managed care savings were estimated by evaluating the cost per delivery difference between cesarean and vaginal deliveries for facility and physician services. No adjustments were made to the total number of deliveries. The overall impact to the KICK rate cell is a decrease of approximately 1%.
The composite impact of the managed care efficiency adjustments to inpatient, outpatient and pharmacy utilization and unit cost are listed in Appendix 8 by capitation rate cell and category of service.
ii. Material changes to the data, assumptions, and methodologies
The primary change from the prior year rate-setting is that the SFY 2017 capitation rate-setting analysis no longer relies on either the FFS data for the MHN program or a special data request directly from the MCOs as a data source for the capitation rate development. We relied solely on the encounter data to develop the unadjusted base period cost models. Another material change is the addition of RBHS services previously covered by Medicaid FFS.
Table 15
South Carolina Department of Health and Human Services
SFY 2017 Medicaid Managed Care Capitation Rate Development
AHRQ Prevention Quality Indicators
PQI Number Description
PQI #01 Diabetes Short-term Complications Admission Rate
PQI #02 Perforated Appendix Admission Rate
PQI #03 Diabetes Long-term Complications Admission RatePQI #05 Chronic Obstructive Pulmonary Disease (COPD) Admission Rate
PQI #07 Hypertension Admission Rate
PQI #08 Congestive Heart Failure (CHF) Admission Rate
PQI #10 Dehydration Admission Rate
PQI #11 Bacterial Pneumonia Admission Rate
PQI #12 Urinary Tract Infection Admission Rate
PQI #13 Angina without Procedure Admission Rate
PQI #14 Uncontrolled Diabetes Admission Rate
PQI #15 Adult Asthma Admission Rate
PQI #16 Rate of Lower-extremity Amputation among Patients with Diabetes

Milliman Client Report
State Fiscal Year 2017 Rate Certification 25
SCM01-64
June 22, 2016
We have utilized FFS data for the managed care-enrolled population to estimate the added cost to the managed care program related to this benefit carve-in. All material assumptions are documented in this rate certification document and the overall methodology utilized to develop the capitation rates is consistent with the prior rate-setting analysis.
B. PROJECTED BENEFIT COST TRENDS
i. Description of the data, assumptions, and methodologies
This section discusses the data, assumptions, and methodologies used to develop the benefit cost trends, i.e., the annualized projected change in benefit costs from the historical base period (SFY 2015) to the SFY 2017 rating period of this certification. We evaluated prospective trend rates using historical experience for the South Carolina Medicaid managed care program, as well as external data sources.
(a) Data
The primary data used to develop benefit cost trends is historical claims and encounter from the covered populations. Data used for trend development included three years of cost and utilization experience, from SFY 2013 through the base experience data period (SFY 2015).
External data sources that were referenced include:
National Health Expenditure (NHE) projections developed by the CMS office of the actuary, specifically those related to Medicaid. Please note that as these are expenditure projections, projected growth reflects not only unit cost and utilization, but also aggregate enrollment growth and enrollment mix changes such as aging. For trends used in this certification, we are interested only in unit cost and utilization trends, so in general, our combinations of unit cost and utilization trends should be lower than NHE trends. NHE tables and documentation may be found in the location listed below: https://www.cms.gov/research-statistics-data-and-systems/statistics-trends-and-reports/nationalhealthexpenddata/nationalhealthaccountsprojected.html
Express Scripts 2015 Drug Trend Report – Medicaid (March 2016) found in the location listed below: https://lab.express-scripts.com/lab/~/media/e2c9d19240e94fcf893b706e13068750.ashx
Other sources: We also reviewed internal sources that are not publicly available, such as historical experience from other programs and trends used by other Milliman actuaries.
(b) Methodology
For internal SCDHHS data, historical utilization and per member per month cost data was stratified by month, rate cell, and category of service. The data was adjusted for completion and normalized for historical program and reimbursement changes. Additionally, we applied risk scores to normalize the experience data for the impact of any morbidity differences in the covered population. We developed trend rates to adjust the base experience data (midpoint of January 1, 2015) forward 24 months to the midpoint of the contract period, January 1, 2017.
For most service categories, the trend rates were applied to utilization only, while reimbursement was explicitly addressed in section 2B of this certification report. An exception to this method applies to pharmacy services, where trend rates have been estimated for both utilization and unit cost.
Trend rates were developed by population (TANF Adult, TANF Child, SSI Adult, SSI Child, OCWI, Dual and Kick) and by service category. For the foster care children population, we have used the same pharmacy trend rates as for the TANF child population.
Trend development was supported by historical claims and encounter experience from the covered populations. As part of the analysis, historical data was normalized for reimbursement and population mix changes, and stratified by population and major service category. Exponential and linear regression methods were utilized to project experience during the contract period, and rolling 12-month and 6-month trends were calculated to identify changes in the underlying patterns over time.
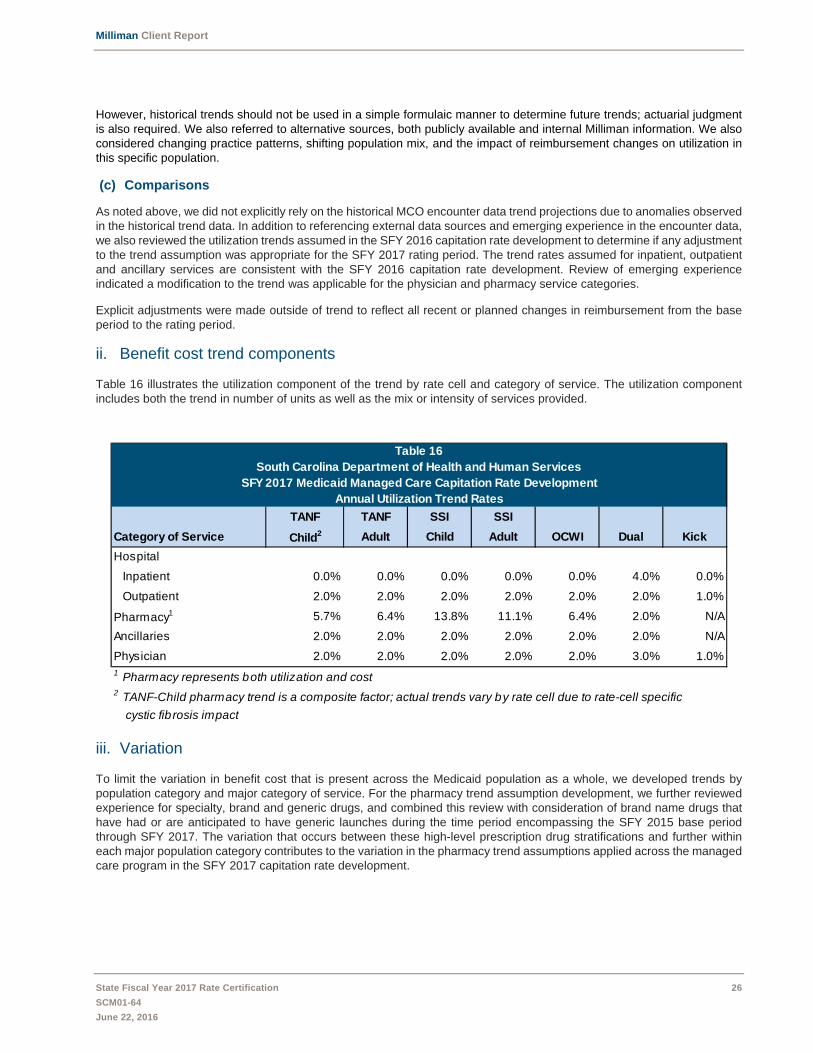
Milliman Client Report
State Fiscal Year 2017 Rate Certification 26
SCM01-64
June 22, 2016
However, historical trends should not be used in a simple formulaic manner to determine future trends; actuarial judgment is also required. We also referred to alternative sources, both publicly available and internal Milliman information. We also considered changing practice patterns, shifting population mix, and the impact of reimbursement changes on utilization in this specific population.
(c) Comparisons
As noted above, we did not explicitly rely on the historical MCO encounter data trend projections due to anomalies observed in the historical trend data. In addition to referencing external data sources and emerging experience in the encounter data, we also reviewed the utilization trends assumed in the SFY 2016 capitation rate development to determine if any adjustment to the trend assumption was appropriate for the SFY 2017 rating period. The trend rates assumed for inpatient, outpatient and ancillary services are consistent with the SFY 2016 capitation rate development. Review of emerging experience indicated a modification to the trend was applicable for the physician and pharmacy service categories.
Explicit adjustments were made outside of trend to reflect all recent or planned changes in reimbursement from the base period to the rating period.
ii. Benefit cost trend components
Table 16 illustrates the utilization component of the trend by rate cell and category of service. The utilization component includes both the trend in number of units as well as the mix or intensity of services provided.
iii. Variation
To limit the variation in benefit cost that is present across the Medicaid population as a whole, we developed trends by population category and major category of service. For the pharmacy trend assumption development, we further reviewed experience for specialty, brand and generic drugs, and combined this review with consideration of brand name drugs that have had or are anticipated to have generic launches during the time period encompassing the SFY 2015 base period through SFY 2017. The variation that occurs between these high-level prescription drug stratifications and further within each major population category contributes to the variation in the pharmacy trend assumptions applied across the managed care program in the SFY 2017 capitation rate development.
Table 16South Carolina Department of Health and Human Services
SFY 2017 Medicaid Managed Care Capitation Rate DevelopmentAnnual Utilization Trend Rates
TANF TANF SSI SSI
Category of Service Child2 Adult Child Adult OCWI Dual Kick
Hospital
Inpatient 0.0% 0.0% 0.0% 0.0% 0.0% 4.0% 0.0%
Outpatient 2.0% 2.0% 2.0% 2.0% 2.0% 2.0% 1.0%
Pharmacy1 5.7% 6.4% 13.8% 11.1% 6.4% 2.0% N/A
Ancillaries 2.0% 2.0% 2.0% 2.0% 2.0% 2.0% N/A
Physician 2.0% 2.0% 2.0% 2.0% 2.0% 3.0% 1.0%1 Pharmacy represents both utilization and cost2 TANF-Child pharmacy trend is a composite factor; actual trends vary by rate cell due to rate-cell specific
cystic fibrosis impact

Milliman Client Report
State Fiscal Year 2017 Rate Certification 27
SCM01-64
June 22, 2016
iv. Material adjustments
We made explicit adjustments to the historical data analyzed for trends in an effort to normalize the data for historical reimbursement adjustments and changing populations, and extract underlying trend information; however, as noted above, there were still anomalies that were present in the data and contributed to unreasonable trend patterns.
As a result, we used actuarial judgment to adjust the trends derived from historical experience in cases where the resulting trends did not appear reasonably sustainable, or were not within consensus parameters derived from other sources.
For many rate cells and categories of services, raw model output was outside of a range of reasonable results. In these situations, we relied on the sources identified to develop prospective trend.
The baseline pharmacy trend was adjusted to reflect the impact of cystic fibrosis drugs that were not reflected in our experience period. We analyzed the prevalence of cystic fibrosis by rate cell to develop an estimated annualized impact of the introduction of new cystic fibrosis treatments. Assumptions related to the cost of cystic fibrosis medications, the population eligible to receive treatment, and the take-up rate of new treatments were utilized to develop the impact of cystic fibrosis medications on pharmacy expenditures. Table 17 illustrates the impact of this adjustment on Rx cost trend.
v. Any other adjustments
(a) Impact of managed care
We did not adjust the trend rates to reflect a managed care impact on utilization or unit cost. The capitation rates have an explicit adjustment for the managed care adjustments.
(b) Trend changes other than utilization and unit cost
We did not adjust the benefit cost trend for changes other than utilization or unit cost.
C. IN LIEU OF SERVICES
The projected benefit costs do not include costs for in lieu of services.
D. RETROSPECTIVE ELIGIBILITY PERIODS
i. Health plan responsibility
MCOs are not responsible for paying claims incurred during the retroactive eligibility period.
ii. Claims information in base data
There are no claims for retroactive eligibility periods in the base period encounter data.
Table 17
South Carolina Department of Health and Human Services
SFY 2017 Medicaid Managed Care Capitation Rate DevelopmentAnnualized Cystic Fibrosis Pharmacy Trend Adjustment
Base Rx Cystic Fibrosis Total Rx
Category of Service Cost Trend Rx Impact Cost Trend
TANF: Rate Cells Below Age 7 5.0% 0.0% 5.0%
TANF: Age 7-13 5.0% 0.5% 5.6%
TANF: Age 14-18 and Foster Care 5.0% 1.5% 6.6%
TANF: Adult and OCWI 5.0% 1.4% 6.4%
SSI - Children 12.0% 1.6% 13.8%
SSI - Adults 10.0% 1.0% 11.1%
Milliman Client Report
State Fiscal Year 2017 Rate Certification 28
SCM01-64
June 22, 2016
iii. Enrollment treatment
Enrollment is treated consistently with claims. We have not included retrospective eligibility in the base experience period.
iv. Adjustments
No adjustments are necessary.
E. FINAL PROJECTED BENEFIT COSTS
Final projected benefit costs are documented by program and rate cell in Appendix 7.
F. IMPACT OF MATERIAL CHANGES
This section relates to material changes to covered benefits or services since the last rate certification. The last rate certification was for the SFY 2016 rating period.
i. Change to covered benefits
Material changes to covered benefits have been described in program adjustments described in Section 2.B.iv. Program Change Adjustments. We have made adjustments for the following changes in covered benefits:
Addition of RBHS and associated outpatient mental health services effective July 1, 2016
ii. Change to payment requirements
Material changes to required provider payments have been described in program adjustments described in Section 2.B.iv. Program Change Adjustments. We have made adjustments for the following changes in payment requirements since the SFY 2016 rate certification:
Addition of FQHC wrap payment to reflect total FQHC reimbursement at the PPS rate for qualifying services in the capitation rate, effective July 1, 2016.
RBHS services fee schedule for DMH providers
iii. Change to waiver requirements
There were no material changes related to waiver requirements or conditions.
iv. Change due to litigation
There were no material changes due to litigation.
G. DOCUMENTATION OF MATERIAL CHANGES
Material changes to covered benefits and provider payments have been described in program adjustments described in Section 2.B.iv. Program Change Adjustments. This information includes the data, assumptions, and methodology used in developing the adjustment, estimated impact by population, and aggregate impact on the managed care program’s benefit expense. Non-material changes to covered benefits or provider payments have also been described in this section of the report.

Milliman Client Report
State Fiscal Year 2017 Rate Certification 29
SCM01-64
June 22, 2016
4. PASS-THROUGH PAYMENTS
This section provides information on the pass-through payments reflected in the SFY 2017 capitation rates.
A. DEFINITION OF PASS-THROUGH PAYMENTS
Supplemental Teaching Physician (STP) Payments: The STP payment program was developed to provide supplemental teaching payments to providers (i.e. Medical Universities or hospitals) of teaching physicians who are employed by or under contract with South Carolina Medical Universities and/or their component units. The STP payment that is made to qualifying providers accounts for the productivity loss and resulting revenue loss incurred by the teaching physicians from either direct supervision of or involvement with residents and/or medical students who are providing patient care. These amounts are paid to the providers of teaching physicians by the health plans, but are not included in the contracted rates between the MCOs and the teaching physicians.
B. DESCRIPTION OF PASS-THROUGH PAYMENTS
i. Description
SCDHHS implemented the original STP payment methodology effective October 1, 2001. The original payment methodology allowed for additional reimbursement at 35% of each teaching physician’s billed charges to providers qualifying for STP payments.. This payment was made in addition to the regular Medicaid FFS or MCO claims payment amount.
Effective April 1, 2016, SCDHHS has revised the STP payment methodology to come into compliance with the CMS approved Physician UPL Guidance document. SCDHHS has chosen to use the Average Commercial Rate (ACR) Model as described in the CMS document. Under the plan amendment submitted to CMS, the STP payment is determined based upon the aggregate difference between the average commercial rate of each STP provider’s top 5 commercial carriers (excluding those not subject to market forces) and the Medicaid payment (including TPL and co-pays) for each billable procedure code based upon a base year claims period and commercial rate period trended forward to the SFY 2017 payment period.
The STP amounts for the SFY 2017 capitation rates are calculated under the ACR method. The following methodology was utilized to develop the STP PMPM:
1. Summarize the FFY 2014 encounter expenditures eligible for supplemental teaching payments using the FFY 2014 teaching physician list provided by SCDHHS for the SFY 2017 capitation rate-setting process. Add estimated patient copay and third-party liability amounts to FFY 2014 expenditures to develop total payment received by the physician.
2. Reprice each of the FFY 2014 encounter physician claims by multiplying the number of incurred units for each procedure code by the individual STP provider’s FFY 2014 ACR for that procedure code.
3. Trend the FFY 2014 ACR amounts obtained in Step 2 by an annual trend rate established by SCDHHS of 2.16% for 33 months to estimate the SFY 2017 ACR payments for the services incurred by the eligible teaching physicians.
4. Deduct total physician payment (developed in Step 1) from ACR (developed in Step 3) for each physician claim to calculate the STP amount.
5. Adjust the STP payment amounts obtained in Step 4 using utilization trend and other adjustment factors specific to the physician and ancillary service categories to estimate projected SFY 2017 STP PMPMs.
Note that STP expenditures for services covered by the KICK payment are allocated across the applicable female capitation rate cells, in proportion to the KICK payments made for individuals in the representative rate cells. Consistent with SCDHHS’s payment methodology, supplemental teaching payments are not calculated for the DUAL rate cell.
The change in the methodology used to calculate the STP amounts results in a decrease of approximately16% when compared to the original methodology. This change is consistent with the reduction observed in the FFS analysis performed by SCDHHS.

Milliman Client Report
State Fiscal Year 2017 Rate Certification 30
SCM01-64
June 22, 2016
Appendices 9 and 10 document the development of the STP PMPMs that are added to the SFY 2017 capitation rates
ii. Providers receiving the payment
The payments are received by providers with teaching physicians who are employed by or under contract with South Carolina Medical Universities and/or their component units. A list of teaching physicians during FFY 2014 was provided by SCDHHS for the SFY 2017 capitation rate-setting process.
iii. Financing mechanism
The STP payment program is funded via intergovernmental transfers from non-state owned governmental hospitals, the MUSC School of Medicine, the University of South Carolina, and the SC Area Health Education Consortium (which receives annual state appropriations from the SC General Assembly).
iv. Historical payment amounts
Historical pass-through payments for the Supplemental Teaching Physicians program were approximately $111.7 million in SFY 2015 and are estimated at $133.5 million in SFY 2016.
C. SUPPLEMENTAL PAYMENTS
There are no supplemental payments incorporated in the SFY 2017 managed care capitation rates.
Milliman Client Report
State Fiscal Year 2017 Rate Certification 31
SCM01-64
June 22, 2016
5. PROJECTED NON-BENEFIT COSTS
This section provides information on the development of projected non-benefit costs.
A. DATA, ASSUMPTIONS AND METHODOLOGIES
i. Description of the data, assumptions, and methodologies
(a) Data
The primary data sources used in the development of the state fiscal year 2017 non-benefit costs are listed below:
Calendar Year 2015 administrative costs as reported in the Managed Care Survey completed by each MCO Statutory financial statement data for each of the MCOs. Average non-benefit costs from the financial statements of Medicaid health plans nationally, as summarized by
Palmer, Pettit, and McCulla. A link to the 2014 report (published in June 2015) is here: http://us.milliman.com/uploadedFiles/insight/2015/medicaid-admin-cost-analysis-2014.pdf
(b) Assumptions and methodology
In developing non-benefit costs, we reviewed historical administrative expenses for the managed care program along with national Medicaid health plan administrative expenses. We considered the size of participating health plans and the resulting economies of scale that could be achieved, along with the benefits covered and the demographics of the population.
Historical reported administrative expenses by MCO were compared to statutory financial statements for consistency. Calendar year 2015 administrative expenses were adjusted for the assumed economies of scale that could be achieved due to continued maturity of the managed care program, as well as increased revenue for enhanced FQHC reimbursement and carve-in of RBHS expenditures, which may not require a proportional increase in administrative expenditures.
ii. Material changes
There are no material changes to the data, assumptions, or methodology used to develop the projected non-benefit cost.
B. NON-BENEFIT COSTS, BY COST CATEGORY
Administrative expenses have not been developed from the ground up (based on individual components). However, individual components were reviewed within MCO-reported survey information and financial statement data. We did rely on MCO-reported information to allocate the administrative expense percentage between general administrative costs and care management expenses.
The SFY 2017 non-benefit cost allowance is applied as a percentage of the capitation rates excluding supplemental teaching payments, as illustrated in Table 18 below.
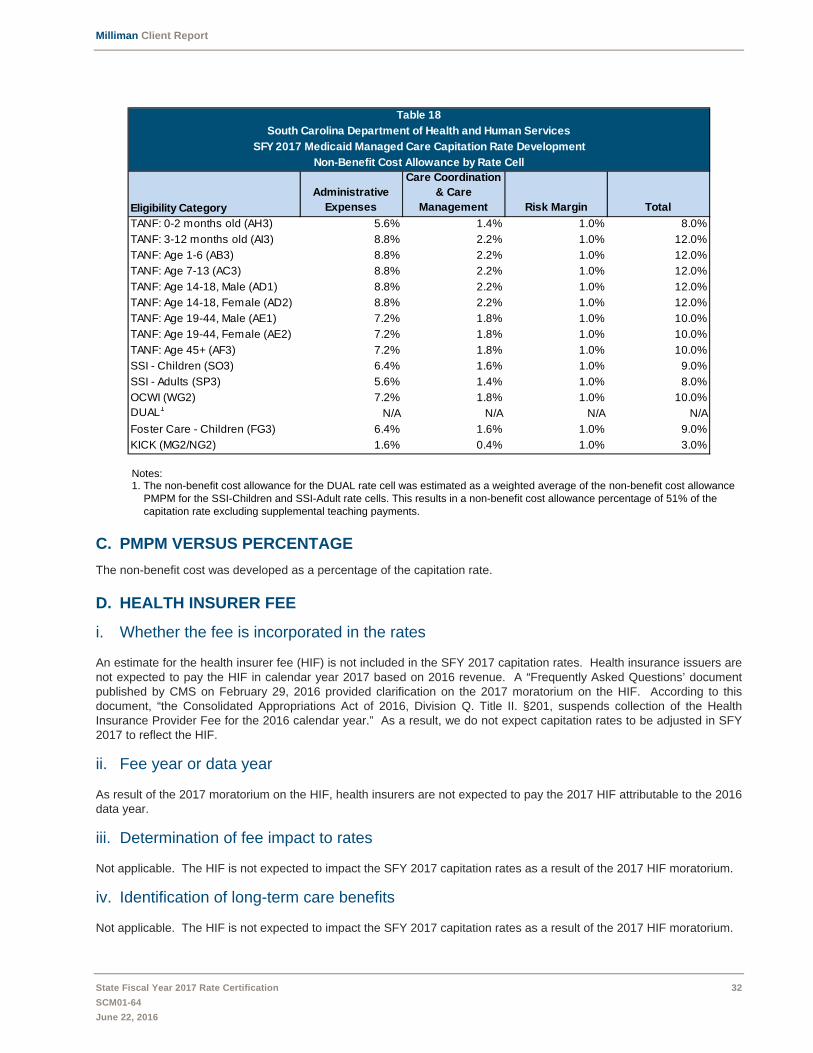
Milliman Client Report
State Fiscal Year 2017 Rate Certification 32
SCM01-64
June 22, 2016
Notes: 1. The non-benefit cost allowance for the DUAL rate cell was estimated as a weighted average of the non-benefit cost allowance
PMPM for the SSI-Children and SSI-Adult rate cells. This results in a non-benefit cost allowance percentage of 51% of the capitation rate excluding supplemental teaching payments.
C. PMPM VERSUS PERCENTAGE
The non-benefit cost was developed as a percentage of the capitation rate.
D. HEALTH INSURER FEE
i. Whether the fee is incorporated in the rates
An estimate for the health insurer fee (HIF) is not included in the SFY 2017 capitation rates. Health insurance issuers are not expected to pay the HIF in calendar year 2017 based on 2016 revenue. A “Frequently Asked Questions’ document published by CMS on February 29, 2016 provided clarification on the 2017 moratorium on the HIF. According to this document, “the Consolidated Appropriations Act of 2016, Division Q. Title II. §201, suspends collection of the Health Insurance Provider Fee for the 2016 calendar year.” As a result, we do not expect capitation rates to be adjusted in SFY 2017 to reflect the HIF.
ii. Fee year or data year
As result of the 2017 moratorium on the HIF, health insurers are not expected to pay the 2017 HIF attributable to the 2016 data year.
iii. Determination of fee impact to rates
Not applicable. The HIF is not expected to impact the SFY 2017 capitation rates as a result of the 2017 HIF moratorium.
iv. Identification of long-term care benefits
Not applicable. The HIF is not expected to impact the SFY 2017 capitation rates as a result of the 2017 HIF moratorium.
Table 18
South Carolina Department of Health and Human Services
SFY 2017 Medicaid Managed Care Capitation Rate Development
Non-Benefit Cost Allowance by Rate Cell
Eligibility Category
Administrative Expenses
Care Coordination & Care
Management Risk Margin Total
TANF: 0-2 months old (AH3) 5.6% 1.4% 1.0% 8.0%
TANF: 3-12 months old (AI3) 8.8% 2.2% 1.0% 12.0%
TANF: Age 1-6 (AB3) 8.8% 2.2% 1.0% 12.0%
TANF: Age 7-13 (AC3) 8.8% 2.2% 1.0% 12.0%
TANF: Age 14-18, Male (AD1) 8.8% 2.2% 1.0% 12.0%
TANF: Age 14-18, Female (AD2) 8.8% 2.2% 1.0% 12.0%
TANF: Age 19-44, Male (AE1) 7.2% 1.8% 1.0% 10.0%
TANF: Age 19-44, Female (AE2) 7.2% 1.8% 1.0% 10.0%
TANF: Age 45+ (AF3) 7.2% 1.8% 1.0% 10.0%
SSI - Children (SO3) 6.4% 1.6% 1.0% 9.0%
SSI - Adults (SP3) 5.6% 1.4% 1.0% 8.0%
OCWI (WG2) 7.2% 1.8% 1.0% 10.0%DUAL1 N/A N/A N/A N/A
Foster Care - Children (FG3) 6.4% 1.6% 1.0% 9.0%
KICK (MG2/NG2) 1.6% 0.4% 1.0% 3.0%

Milliman Client Report
State Fiscal Year 2017 Rate Certification 33
SCM01-64
June 22, 2016
6. RATE RANGE DEVELOPMENT
A. ASSUMPTIONS AND METHODOLOGY
Not applicable, a rate range has not been developed.
B. DOCUMENTATION
Not applicable, a rate range has not been developed.

Milliman Client Report
State Fiscal Year 2017 Rate Certification 34
SCM01-64
June 22, 2016
7. RISK MITIGATION AND RELATED CONTRACTUAL PROVISIONS
This section provides information on the risk mitigation included in the contract.
A. DESCRIPTION OF RISK MITIGATION
The SFY 2017 managed care capitation rates have been developed as full risk rates. The MCO entity assumes risk for the cost of services covered under the contract and incurs loss if the cost of furnishing the services exceeds the payments under the contract.
Risk Adjustment
The composite rates for TANF Children, TANF Adult, SSI Children, and SSI Adult populations will be prospectively risk adjusted by health plan to reflect estimated prospective morbidity differences in the underlying population enrolling with each health plan.
Risk Pool for FQHC Reimbursement
Effective for SFY 2017, SCDHHS will maintain a cost-neutral risk pool for FQHC utilization and expenditures. To the extent a MCO receives a higher proportion of FQHC expenditures in relation to other MCOs, the MCO will receive additional reimbursement. Conversely a MCO receiving a lower portion of FQHC expenditures will be required to pay into the risk pool.
Withholds and Incentives
For SFY 2017, the MCO will be eligible for return of withhold payments up to 1.5% of capitation revenue, based on the MCO’s performance of certain quality measures specified by the managed care contract. Any amount that is not earned back through achievement of the withhold measures will fund a bonus pool that is distributed to the high-performing MCOs in the program.
Incentive payments for “Patient-Centered Medical Homes (PCMH)” are not included within the certified capitation rate. As such, these incentives are paid by SCDHHS to the MCOs through gross level adjustments (GLAs). Additional details about the PCMH incentive payment program can be found within the “MCO Policy and Procedure Guide” under the “Provider Quality Incentive Programs” section. Approximate historical and anticipated incentive payments for the PCMH program are as follows:
SFY 2015: $5.0 million – approximately 0.2% increase over estimated capitation premium SFY 2016: $6.9 million – approximately 0.3% increase over estimated capitation premium SFY 2017 (anticipated): $8 million – approximately 0.3% over estimated capitation premium
B. RISK ADJUSTMENT MODEL AND METHODOLOGY
i. Risk adjustment model
The TANF Adult, TANF Children, SSI Adult, and SSI Children populations will be risk-adjusted using Medicaid Rx or CDPS+Rx risk scoring models. Review of data quality at the time of risk adjustment will determine the methodology used. Risk adjustment is performed on a budget neutral basis for each of the four defined populations.
ii. Data and adjustments
Data quality will be re-evaluated at a later date to determine the most appropriate risk adjustment model to utilize, depending on the quality of the encounter data. The time period of the data utilized will be determined based on selection of the most appropriate risk adjustment model for the July 1, 2016 through December 31, 2016 period and the January 1, 2017 through June 30, 2017 time period.
iii. Changes from the prior year
There are no material changes from the methodology utilized in the prior year.

Milliman Client Report
State Fiscal Year 2017 Rate Certification 35
SCM01-64
June 22, 2016
iv. Frequency
Risk score updates are anticipated to be performed on a semi-annual basis.
v. How the risk scores will be used to adjust the capitation rates
Risk scores developed by MCO will be used to adjust MCO capitation payments.
vi. An attestation that the risk adjustment is cost neutral
The SCDHHS risk adjustment is designed to be cost neutral. Relative risk scores will be normalized to result in a composite risk score of 1.000 for each population group, across all plans.
C. ADDRESS COST NEUTRALITY
i. Reason for uncertainty
The risk sharing-models used in the development of the SFY 2017 rates are cost neutral.
ii. Risk adjustment model
Not applicable.
iii. Data
Not applicable.
iv. Relationship and interaction with risk adjustment
Not applicable.
v. Frequency
Not applicable.
vii. How the risk scores will be used to adjust the capitation rates
Not applicable.
D. OTHER RISK SHARING ARRANGEMENTS
i. Introduction
SCDHHS will implement a cost-neutral risk pool for SFY 2017 for all FQHC services subject to the FQHC wrap-around payment. The risk pool is being implemented to address the higher costs associated with FQHC encounters and the potential for the prevalence of FQHC beneficiaries to vary between MCOs. To the extent a MCO receives a higher proportion of FQHC expenditures in relation to other MCOs, the MCO will receive additional reimbursement. Conversely, a MCO receiving a lower proportion of FQHC expenditures will be required to pay into the risk pool. The development of the risk pool does not impact the capitation rate development process.
ii. Methodology
The SFY 2017 FQHC risk pool aggregate amounts will be developed using the estimated SFY 2017 FQHC benefit expense PMPM (including the FQHC wrap payment) included in the SFY 2017 capitation rates, multiplied by the actual SFY 2017 membership by rate cell.

Milliman Client Report
State Fiscal Year 2017 Rate Certification 36
SCM01-64
June 22, 2016
The estimated SFY 2017 FQHC PMPM is developed on a prospective basis and is based on a review of historical FQHC expenditures through June 2015 and supplemental information provided by SCDHHS related to actual FQHC wrap payments made for SFY 2015. Program and policy changes developed for the SFY 2017 managed care capitation rates impacting FQHC expenditures were applied to the base experience. The estimated SFY 2017 FQHC wrap-around payment impact by rate cell is included in the “Program Adj Util” and “Program Adj Cost” columns of Appendix 7.
Please note that the estimated SFY 2017 FQHC PMPM is based on the historical FQHC expenditures, with no smoothing adjustment across rate cell. Therefore, certain rate cells may have estimated SFY 2017 FQHC expenditures while other rate cells may not have any or significantly lower estimated SFY 2017 FQHC expenditures.
Tables 19 and 20 illustrate a sample calculation of MCO payment/receipt of FQHC risk pool funds under two scenarios. The first scenario illustrates the payment/receipt of funds in the event total FQHC expenditures are greater than the risk pool funds, while the second scenario illustrates payment/receipt of funds in the event total FQHC expenditures are less than the risk pool funds.
Table 19
South Carolina Department of Health and Human Services
SFY 2017 Medicaid Managed Care Capitation Rate Development
Rates Effective July 1, 2016
Total FQHC Experience Greater Than Pool Funds
MCOActual SFY
2017 Member Months
Estimated SFY 2017 FQHC
PMPM
Estimated SFY 2017 FQHC
Expenditures
Actual SFY 2017 FQHC
Expenditures
Distribution of Actual FQHC
Costs
Distribution Applied to Estimated
Costs
Additional Payment/
Recoupment
Plan A 10,000 $ 5.00 $ 50,000 $ 80,000 14.55% $72,727 $ 22,727
Plan B 30,000 $ 5.00 $ 150,000 $ 180,000 32.73% $163,636 $ 13,636
Plan C 20,000 $ 5.00 $ 100,000 $ 80,000 14.55% $72,727 $ (27,273)
Plan D 15,000 $ 5.00 $ 75,000 $ 90,000 16.36% $81,818 $ 6,818
Plan E 25,000 $ 5.00 $ 125,000 $ 120,000 21.82% $109,091 $ (15,909)
All Plans 100,000 $ 5.00 $ 500,000 $ 550,000 100.00% $500,000 $ 0
MCOActual SFY
2017 Member Months
Estimated SFY 2017 FQHC
PMPM
Estimated SFY 2017 FQHC
Expenditures
Actual SFY 2017 FQHC
Expenditures
Distribution of Actual FQHC
Costs
Distribution Applied to Estimated
Costs
Additional Payment/
Recoupment
Plan A 10,000 $ 5.00 $ 50,000 $ 60,000 12.50% $62,500 $ 12,500
Plan B 30,000 $ 5.00 $ 150,000 $ 145,000 30.21% $151,042 $ 1,042
Plan C 20,000 $ 5.00 $ 100,000 $ 90,000 18.75% $93,750 $ (6,250)
Plan D 15,000 $ 5.00 $ 75,000 $ 80,000 16.67% $83,333 $ 8,333
Plan E 25,000 $ 5.00 $ 125,000 $ 105,000 21.88% $109,375 $ (15,625)
All Plans 100,000 $ 5.00 $ 500,000 $ 480,000 100.00% $500,000 $ 0
South Carolina Department of Health and Human Services
SFY 2017 Medicaid Managed Care Capitation Rate Development
Rates Effective July 1, 2016
Total FQHC Experience Less Than Pool Funds
Table 20

Milliman Client Report
State Fiscal Year 2017 Rate Certification 37
SCM01-64
June 22, 2016
iii. Summary of Results
Table 21 illustrates the estimated SFY 2017 member months, FQHC PMPM, and risk pool expenditures by rate cell.
Please note that the estimated SFY 2017 FQHC PMPM will not be updated with actual SFY 2017 FQHC experience, but the actual SFY 2017 membership will be used to develop the aggregate expenditures in the FQHC risk pool development.
E. MEDICAL LOSS RATIO
i. Description
SCDHHS’s provider agreement establishes a minimum medical loss ratio (MLR) of 86% for the Medicaid managed care population. The specific language from the provider agreement effective July 1, 2016 should be referenced for final contract specifications and definitions.
ii. Financial consequences Financial consequences of the minimum MLR requirements are specified in the provider agreement. However, in general, the MCO will be required to repay any amounts below the 86.0% minimum MLR.
F. REINSURANCE REQUIREMENTS AND EFFECT ON CAPITATION RATES
There are no reinsurance requirements for MCOs contracted with SCDHHS for the Medicaid managed care program.
Table 21
South Carolina Department of Health and Human Services
SFY 2017 Medicaid Managed Care Capitation Rate Development
Rates Effective July 1, 2016
FQHC Risk Pool by Rate Cell
Estimated SFY 2017 Estimated SFY 2017 Estimated
Rate Cell Member Months FQHC PMPM Expenditures
TANF: 0-2 months old (AH3) 79,860 $ 17.56 $ 1,402,342
TANF: 3-12 months old (AI3) 347,976 10.01 3,483,240
TANF: Age 1-6 (AB3) 2,001,312 4.67 9,346,127
TANF: Age 7-13 (AC3) 2,250,192 3.72 8,370,714
TANF: Age 14-18, Male (AD1) 620,880 2.57 1,595,662
TANF: Age 14-18, Female (AD2) 642,600 4.12 2,647,512
TANF: Age 19-44, Male (AE1) 253,980 2.11 535,898
TANF: Age 19-44, Female (AE2) 1,102,080 5.45 6,006,336
TANF: Age 45+ (AF3) 163,560 8.14 1,331,378
SSI - Children (SO3) 164,592 $ 5.86 964,509
SSI - Adults (SP3) 594,240 9.22 5,478,893
OCWI (WG2) 136,128 $ 3.12 424,719
DUAL - $ 0.00 -
Foster Care - Children (FG3) 47,484 $ 8.88 421,658
KICK (MG2/NG2) 25,020 $ 80.34 2,010,107
Composite 8,404,884 $ 5.24 $ 44,019,094

Milliman Client Report
State Fiscal Year 2017 Rate Certification 38
SCM01-64
June 22, 2016
G. INCENTIVES AND WITHHOLDS
i. Incentives
Incentive payments under this plan are below 105% of the certified rates paid under the contract. Please see section iii for additional discussion on incentive payments.
ii. Withholds
SCDHHS has established a quality withhold of 1.5% of the capitation rate net of supplemental teaching payments, and will determine the return of the withhold based on review of each MCO’s HEDIS data and the MCO’s compliance with the quality measures established in each MCO’s contract with SCDHHS.
The capitation rates shown in this letter are illustrated before offset for the withhold amount; however, the SFY 2017 capitation rates documented in this report are actuarially sound after adjustment for the amount of the withhold not expected to be earned.
iii. Estimate of percent to be returned.
In SFY 2014 and SFY 2015, the MCOs in aggregate received 89% and 96%, respectively, of available withhold funds from SCDHHS through first pass and bonus pool distributions. Withholds and incentives are treated separately for federal regulations; therefore, we reviewed the first pass and bonus pool distribution as separate components. Based on the design of the withhold program, SCDHHS expects that 70%-75% of the withhold is earned back through the first pass. Based on this information, we believe that a reasonable assumption of return of withhold to the managed care program through first pass is 70% to 75% of the 1.5% withhold amount. By design, the incentive amount represented by the bonus pool is significantly less than 5% of the certified rates. Therefore, the total amount of incentive payments in the managed care program is below 105% of the certified rates paid under the contract.
iv. Effect on the capitation rates
The rate is certified as actuarially sound after adjustment for the amount of the withhold not expected to be earned.
Milliman Client Report
State Fiscal Year 2017 Rate Certification 39
SCM01-64
June 22, 2016
8. OTHER RATE DEVELOPMENT CONSIDERATIONS
A. DIFFERENT FMAP
All populations receive the regular state FMAP of 71.30% for FFY 2017. The enhanced FMAP percentage for CHIP and family planning expenditures in South Carolina is 100% and 90%, respectively. These enhanced amounts are not reflected in the values provided in Appendix 3.
B. ACTUARIALLY ACCEPTED PRACTICES AND PRINCIPLES
i. Reasonable, appropriate, and attainable
In our judgment, all adjustments to the capitation rates, or to any portion of the capitation rates, reflect reasonable, appropriate, and attainable costs. To our knowledge, there are no reasonable, appropriate, and attainable costs that have not been included in the certification.
ii. Outside the rate setting process
There are no adjustments to the rates performed outside the rate setting process.
iii. Rates within ranges
Not applicable, as this certification is not providing a rate range. The final contracted rates should match the rates certified in this report.

Milliman Client Report
State Fiscal Year 2017 Rate Certification 40
SCM01-64
June 22, 2016
9. PROCEDURES FOR RATE CERTIFICATION AND CONTRACT AMENDMENTS
In general, a new rate certification will be submitted when the rates change. The following exceptions are allowed:
1. A contract amendment that does not affect the rates. 2. Risk adjustment, under a methodology described in the initial certification, changes the rates paid to the plans.
In case 1 listed above, a contract amendment must still be submitted to CMS.
Milliman Client Report
State Fiscal Year 2017 Rate Certification 41
SCM01-64
June 22, 2016
SECTION II. MEDICAID MANAGED CARE RATES WITH LONG-TERM SERVICES AND SUPPORTS
Section II of the 2016 guidance is not applicable to the SCDHHS Medicaid managed care program. Managed long-term services and supports (MLTSS) are not covered benefits. Enrollees who have been approved for long term institutional care, waiver services, or institutional hospice care will be dis-enrolled from the managed care program and served under the FFS delivery system. Skilled nursing facility services are covered under this program only for stays generally less than 60 days. ICF/ID, PRTF, and home and community based (HCBS) waiver services are not covered.
SECTION III. NEW ADULT GROUP CAPITATION RATES
Section III of the 2016 guidance is not applicable to the SCDHHS Medicaid managed care program.
Milliman Client Report
State Fiscal Year 2017 Rate Certification 42
SCM01-64
June 22, 2016
LIMITATIONS
The information contained in this letter was prepared as documentation of the actuarially sound capitation rates for the Medicaid managed care program in the State of South Carolina. The information may not be appropriate for any other purpose.
The information contained in this letter, including the enclosures, has been prepared for SCDHHS and their consultants and advisors. It is our understanding that the information contained in this letter will be shared with CMS and may be utilized in a public document. To the extent that the information contained in this letter is provided to third parties, the letter should be distributed in its entirety. Any user of the data must possess a certain level of expertise in actuarial science and healthcare modeling so as not to misinterpret the data presented.
Milliman makes no representations or warranties regarding the contents of this letter to third parties. Likewise, third parties are instructed that they are to place no reliance upon this letter prepared for SCDHHS by Milliman that would result in the creation of any duty or liability under any theory of law by Milliman or its employees to third parties. Other parties receiving this letter must rely upon their own experts in drawing conclusions about the capitation rates, assumptions, and trends.
Although the capitation rates have been certified as actuarially sound, the capitation rates may not be appropriate for any individual MCO. Results will differ if actual experience is different from the assumptions contained in the capitation rate setting documentation. SCDHHS and Milliman provide no guarantee, either written or implied, that the data and information is 100% accurate or error free.
Milliman has relied on information provided by SCDHHS and the participating Medicaid MCOs in the development of the SFY 2017 capitation rates. We have relied upon SCDHHS and the MCOs for the accuracy of the data and accept it without audit. To the extent that the data provided are not accurate, the capitation rate development would need to be modified to reflect revised information.
The services provided by Milliman to SCDHHS were performed under the signed consulting agreement between Milliman and SCDHHS dated July 1, 2015.
Guidelines issued by the American Academy of Actuaries require actuaries to include their professional qualifications in all actuarial communications. The authors of this report are members of the American Academy of Actuaries and meet the qualification standards for performing the analyses contained herein.

Milliman Client Report
State Fiscal Year 2017 Rate Certification
SCM01-64
June 22, 2016
APPENDIX 1: ACTUARIAL CERTIFICATION

Milliman Client Report
State Fiscal Year 2017 Rate Certification
SCM01-64
June 22, 2016
State of South Carolina Department of Health and Human Services
Risk Based Managed Care Program Capitation Rates Effective July 1, 2016 through June 30, 2017
Actuarial Certification
I, Jeremy D. Palmer, am a Principal and Consulting Actuary with the firm of Milliman, Inc. I am a Member of the American Academy of Actuaries and a Fellow of the Society of Actuaries. I meet the qualification standards established by the American Academy of Actuaries and have followed the standards of practice established by the Actuarial Standards Board. I have been employed by the State of South Carolina and am generally familiar with the state-specific Medicaid program, eligibility rules, and benefit provisions.
The capitation rates provided with this certification are considered “actuarially sound” for purposes of 42 CFR 438.6(c), according to the following criteria:
the capitation rates have been developed in accordance with generally accepted actuarial principles and practices; the capitation rates are appropriate for the Medicaid populations to be covered, and Medicaid services to be furnished
under the contract; and, the capitation rates meet the requirements of 42 CFR 438.6(c) of 67 FR 41097-41098 published on June 14, 2002.
For the purposes of this certification “actuarial soundness” is defined as in ASOP 49:
“Medicaid capitation rates are “actuarially sound” if, for business for which the certification is being prepared and for the period covered by the certification, projected capitation rates and other revenue sources provide for all reasonable, appropriate, and attainable costs. For purposes of this definition, other revenue sources include, but are not limited to, expected reinsurance and governmental stop-loss cash flows, governmental risk-adjustment cash flows, and investment income. For purposes of this definition, costs include, but are not limited to, expected health benefits; health benefit settlement expenses; administrative expenses; the cost of capital, and government-mandated assessments, fees, and taxes.”
The assumptions used in the development of the “actuarially sound” capitation rates have been documented in my correspondence with the State of South Carolina. The “actuarially sound” capitation rates that are associated with this certification are effective for the rate period July 1, 2016 through June 30, 2017
The capitation rates are considered actuarially after adjustment for the amount of the withhold not expected to be earned.
The “actuarially sound” capitation rates are based on a projection of future events. Actual experience may be expected to vary from the experience assumed in the rates.
In developing the “actuarially sound” capitation rates, I have relied upon data and information provided by the State. I have relied upon the State for audit of the data. However, I did review the data for reasonableness and consistency.
The capitation rates developed may not be appropriate for any specific health plan. An individual health plan will need to review the rates in relation to the benefits that it will be obligated to provide. The health plan should evaluate the rates in the context of its own experience, expenses, capital and surplus, and profit requirements prior to agreeing to contract with the State. The health plan may require rates above, equal to, or below the “actuarially sound” capitation rates that are associated with this certification.
Jeremy D. Palmer, FSA Member, American Academy of Actuaries
June 22, 2016 Date

Milliman Client Report
State Fiscal Year 2017 Rate Certification
SCM01-64
June 22, 2016
APPENDIX 2: CERTIFIED CAPITATION RATES

6/22/2016
Appendix 2
South Carolina Department of Health and Human ServicesSFY 2017 Medicaid Managed Care Capitation Rate Development
Rate Change Summary: SFY 2017 over SFY 2016 Rates
With STP Without STP
Rate Cell GenderRate Cell
DescriptionNov-15
EnrollmentSFY 2016
Rates SFY 2017 RatesTotal Rate
ChangeSFY 2016
Rates SFY 2017 RatesTotal Rate
Change
TANF: 0-2 months old Unisex AH3 6,655 $ 2,292.97 $ 2,077.59 (9.4%) $ 1,998.13 $ 1,907.32 (4.5%)TANF: 3-12 months old Unisex AI3 28,998 274.92 265.07 (3.6%) 243.17 237.89 (2.2%)TANF: Age 1-6 Unisex AB3 166,776 124.09 138.10 11.3% 117.61 131.82 12.1% TANF: Age 7-13 Unisex AC3 187,516 116.16 145.21 25.0% 111.39 140.41 26.1% TANF: Age 14-18 Male AD1 51,740 132.59 155.22 17.1% 126.94 149.96 18.1% TANF: Age 14-18 Female AD2 53,550 156.65 179.62 14.7% 148.25 171.82 15.9% TANF: Age 19-44 Male AE1 21,165 240.33 230.59 (4.1%) 232.21 222.53 (4.2%)TANF: Age 19-44 Female AE2 91,840 381.25 366.93 (3.8%) 363.83 350.34 (3.7%)TANF: Age 45+ Unisex AF3 13,630 $ 620.02 $ 599.05 (3.4%) $ 600.11 $ 579.07 (3.5%)
SSI - Children Unisex SO3 13,716 $ 532.04 $ 628.30 18.1% $ 484.11 $ 591.82 22.2% SSI - Adults Unisex SP3 49,520 $ 1,062.58 $ 1,127.33 6.1% $ 1,027.80 $ 1,090.18 6.1%
OCWI Unisex WG2 11,344 $ 347.54 $ 362.31 4.2% $ 281.17 $ 304.68 8.4%
DUAL Unisex - $ 130.99 $ 157.94 20.6% $ 130.99 $ 157.94 20.6%
Foster Care - Children Unisex FG3 3,957 $ 389.16 $ 880.80 126.3% $ 356.68 $ 836.18 134.4%
KICK Female MG2/NG2 2,085 $ 7,137.22 $ 7,164.09 0.4% $ 7,137.22 $ 7,164.09 0.4%
Total 700,407 $ 299.52 $ 318.59 6.4% $ 283.96 $ 304.75 7.3%
Milliman, Inc.Page 1 of 1
Milliman Client Report
State Fiscal Year 2017 Rate Certification
SCM01-64
June 22, 2016
APPENDIX 3: FISCAL IMPACT SUMMARY

6/22/2016
Appendix 3
South Carolina Department of Health and Human ServicesSFY 2017 Medicaid Managed Care Capitation Rate Development
Estimated Monthly Fiscal Impact - Including Supplemental Teaching Payments
SFY 2016 SFY 2017 Increase/(Decrease)Federal Monthly Federal Monthly Federal Monthly
November 2015 Capitation Projected Monthly Expenditures Capitation Projected Monthly Expenditures Total Monthly ExpendituresRate Cell Membership Rate Expenditures (at 71.3%) Rate Expenditures (at 71.3%) Expenditures (at 71.3%)
TANF - 0 - 2 Months, Male & Female (AH3) 6,655 $ 2,292.97 $ 15,259,715 $ 10,880,177 $ 2,077.59 $ 13,826,361 $ 9,858,196 $ (1,433,354) $ (1,021,981)TANF - 3 - 12 Months, Male & Female (AI3) 28,998 274.92 7,972,130 5,684,129 265.07 7,686,500 5,480,474 (285,630) (203,654) TANF - Age 1 - 6, Male & Female (AB3) 166,776 124.09 20,695,234 14,755,702 138.10 23,031,766 16,421,649 2,336,532 1,665,947 TANF - Age 7 - 13, Male & Female (AC3) 187,516 116.16 21,781,859 15,530,465 145.21 27,229,198 19,414,418 5,447,340 3,883,953 TANF - Age 14 - 18, Male (AD1) 51,740 132.59 6,860,207 4,891,327 155.22 8,031,083 5,726,162 1,170,876 834,835 TANF - Age 14 - 18, Female (AD2) 53,550 156.65 8,388,608 5,981,077 179.62 9,618,651 6,858,098 1,230,044 877,021 TANF - Age 19 - 44, Male (AE1) 21,165 240.33 5,086,584 3,626,735 230.59 4,880,437 3,479,752 (206,147) (146,983) TANF - Age 19 - 44, Female (AE2) 91,840 381.25 35,014,000 24,964,982 366.93 33,698,851 24,027,281 (1,315,149) (937,701) TANF - Age 45+, Male & Female (AF3) 13,630 $ 620.02 8,450,873 6,025,472 $ 599.05 8,165,052 5,821,682 (285,821) (203,790)
SSI - Children (SO3) 13,716 $ 532.04 $ 7,297,461 $ 5,203,089 $ 628.30 $ 8,617,763 $ 6,144,465 $ 1,320,302 $ 941,375SSI - Adults (SP3) 49,520 $ 1,062.58 $ 52,618,962 $ 37,517,320 $ 1,127.33 $ 55,825,382 $ 39,803,497 $ 3,206,420 $ 2,286,177
OCWI (WG2) 11,344 $ 347.54 $ 3,942,494 $ 2,810,998 $ 362.31 $ 4,110,045 $ 2,930,462 $ 167,551 $ 119,464
DUAL - $ 130.99 $ 0 $ 0 $ 157.94 $ 0 $ 0 $ 0 $ 0
Foster Care Children (FG3) 3,957 $ 389.16 $ 1,539,906 $ 1,097,953 $ 880.80 $ 3,485,326 $ 2,485,037 $ 1,945,419 $ 1,387,084
KICK (MG2/NG2) 2,085 $ 7,137.22 $ 14,881,104 $ 10,610,227 $ 7,164.09 $ 14,937,128 $ 10,650,172 $ 56,024 $ 39,945
TOTAL 700,407 $ 299.52 $ 209,789,135 $ 149,579,653 $ 318.59 $ 223,143,541 $ 159,101,345 $ 13,354,407 $ 9,521,692
Milliman, Inc.Page 1 of 1

Milliman Client Report
State Fiscal Year 2017 Rate Certification
SCM01-64
June 22, 2016
APPENDIX 4: IN-RATE CRITERIA

6/22/2016
Eligibility CriteriaEligibility File
Type Notes
Recipient
RecipientRecipientRecipientRecipient See Methodology and Results - GeneralRecipient See Methodology and Results - Medical Benefits
RSPNote: The in-rate criteria only includes claims with a valid member record at the time services were rendered.
Claim Criteria
Nursing Home Claims
Claim Type Provider Type Provider Specialty Criteria
G 00 AnyInclude claims where the last 2 bytes of Billing Provider Number = SB or first byte of Billing Provider Number = V or Service Category = 11
Note only provider type 00 are included in rate setting for D claim types
UB-04 ClaimsClaim Type Provider Type Provider Specialty Criteria
Z 01 Any Exclude if Provider Control Facility in (010, 011)
Z 01 AnyExclude if ICD-9 diagnosis code 33.50, 33.51, 33.52, 33.6, 37.51, 46.97, 50.51, 50.59,52.80,52.82, 52.83, V42.0-42.4, and V42.6 -V42.9
Z All AnyExclude if APR-DRG = 001-1, 001-2, 001-3, 001-4, 002-1, 002-2, 002-3, 002-4, 003-1, 003-2, 003-3, 003-4, 006-1, 006-2, 006-3, 006-4, 440-1, 440-2, 440-3, 440-4
Z 01 Any Exclude if Provider Category of Service = 04 AND DRG =998Z 02 Any Exclude if Provider Control Facility in (010, 011)Z 02 Any Exclude if Principle Surgical Procedures in (96.54, 23.01-24.99)
Note only provider type (01, 02) are included in rate setting for Z claim types
HIC ClaimsClaim Type Provider Type Provider Specialty Criteria
A All AnyExclude if Provider Type is not (10, 19, 20, 21, 22, 32, 33, 34, 35, 36, 37, 38, 41, 60, 76, 80, 81, 82, 84)
A or B
10, 19, 20, 21, 32, 33, 35, 37, 60, 70, 76, 80, 81, 82, 84 Any Exclude all Procedure Codes that begin with “D”
A All AnyExclude if diagnosis code 33.50, 33.51, 33.52, 33.6, 37.51, 46.97, 50.51, 50.59,52.80,52.82, 52.83, V42.0-42.4, and V42.6 -V42.9
A All Any Exclude hearing aid and hearing aid accessories for any one over the age of 21
A 10 20
Exclude Procedure Codes (96103, 96120, 96127, 96154, G9004 THROUGH G9011, H0046, H2018, H2019, H2020, H2029, S5105, S5145, S9485, T1007, T1015, T1016, T1017, T1023, T0124)
A 10 28
Exclude Procedure Codes (96127, 96154, 99402, H0025, H0040, H0046, H2012, H2015, H2018, H2020, H2021, H2022, H2029, S5145, S9484, S9537, T1007, T1015, T2023, W0021, X2300, X9529, X9542, X9750, X9756, X9757, X9758, X9759, X9760,T1016, T1017)
A 10 90 Exclude Procedure Codes (T1016, T1017)
A 10 91
Exclude Procedure Codes ( H0045, H0046, H1010, H2020, H2021, H2022, S0265, S0315, S0316, S0317, S3870, S5102, S5165, S9446, S9470, S9482, T1000, T1002, T1007, T1015, T1016, T1017, T1025, T1026, T1027, T2023, X9322)
A 10 92Exclude Procedure Code (H2021, H2022, S9482, T1007, T1015, T1016, T1017, T2023 X2300)
A 21 78 Exclude if Provider Number = TR0003/NPI 1669523528
A 22 51Exclude if Procedure Code in (T1016, T1017, T1027, T1002) AND Provider Number in (DHEC01-DHEC46, DHEC59)
A 22 51Exclude if Primary Diagnosis in COMDHEC table AND Provider Number in (DHEC01-DHEC46, DHEC59)
A 22 95
Exclude if legacy provider ID begins with SD AND procedure code is (92500 THROUGH 92599, 97000 THROUGH 97999, L3808, S9152, C1000, T1002, T1003, T2003, T1015, T1024, V5011, V5090, V5275)
A 22 95 Exclude if legacy provider ID MC0022 AND procedure code is (T1016, T1017)
Long Term Care Exclusion
Exclude where RSP Program Indicator is: 2,3,4,5,6,7,8,9,A,C,D,F,J,K,L,M,P,Q,R,S,T,V
Appendix 4
South Carolina Department of Health and Human ServicesSFY 2017 Medicaid Managed Care Capitation Rate Development
In-Rate Criteria for Services Covered Under Managed Care Capitation Rate
Criteria
Exclude Recipient Payment Categories:10,14,15,33,48,50,52,54,55,70,90
Exclude Recipient Limited Benefit Indicators: E, I, CExclude if age >= 65 on date of serviceExclude Dual eligible members Retroactive Eligibility
Milliman, Inc. Page 1 of 2
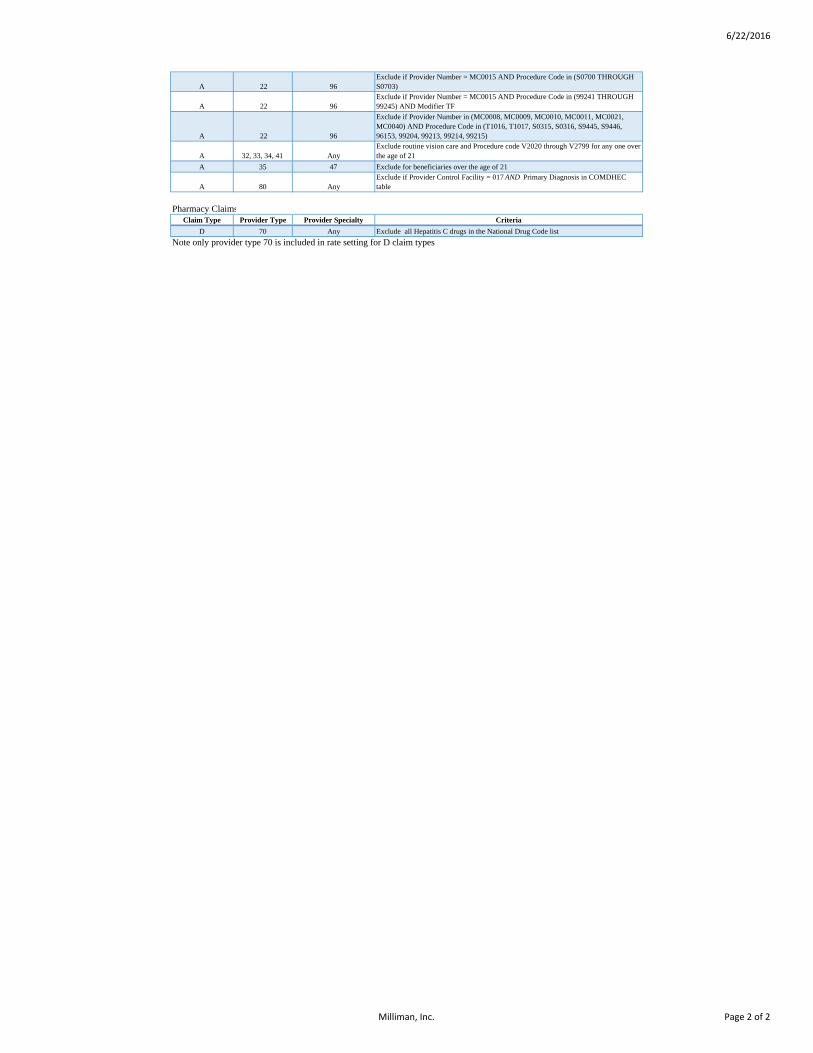
6/22/2016
A 22 96Exclude if Provider Number = MC0015 AND Procedure Code in (S0700 THROUGH S0703)
A 22 96Exclude if Provider Number = MC0015 AND Procedure Code in (99241 THROUGH 99245) AND Modifier TF
A 22 96
Exclude if Provider Number in (MC0008, MC0009, MC0010, MC0011, MC0021, MC0040) AND Procedure Code in (T1016, T1017, S0315, S0316, S9445, S9446, 96153, 99204, 99213, 99214, 99215)
A 32, 33, 34, 41 AnyExclude routine vision care and Procedure code V2020 through V2799 for any one over the age of 21
A 35 47 Exclude for beneficiaries over the age of 21
A 80 AnyExclude if Provider Control Facility = 017 AND Primary Diagnosis in COMDHEC table
Pharmacy ClaimsClaim Type Provider Type Provider Specialty Criteria
D 70 Any Exclude all Hepatitis C drugs in the National Drug Code list Note only provider type 70 is included in rate setting for D claim types
Milliman, Inc. Page 2 of 2

South Carolina Department of Health and Human Services
National Drug Code List – Hepatitis C Drugs
NDC BRAND NAME GENERIC NAME
61958180101 HARVONI LEDIPASVIR/SOFOSBUVIR
00074309328 VIEKIRA PAK OMBITA/PARITAP/RITON/DASABUVIR
00004008694 COPEGUS RIBAVIRIN
00004035009 PEGASYS PEGINTERFERON ALFA-2A
00004035039 PEGASYS PEGINTERFERON ALFA-2A
00004035239 PEGASYS PEGINTERFERON ALFA-2A
00004035730 PEGASYS PEGINTERFERON ALFA-2A
00004036030 PEGASYS PROCLICK PEGINTERFERON ALFA-2A
00004036530 PEGASYS PROCLICK PEGINTERFERON ALFA-2A
00074319716 MODERIBA RIBAVIRIN
00074322456 MODERIBA RIBAVIRIN
00074323956 MODERIBA RIBAVIRIN
00074327156 MODERIBA RIBAVIRIN
00074328256 MODERIBA RIBAVIRIN
00085119403 REBETOL RIBAVIRIN
00085123601 REBETRON 1200 RIBAVIRIN/INTERFERON ALFA-2B,R
00085123602 REBETRON 1000 RIBAVIRIN/INTERFERON ALFA-2B,R
00085123603 REBETRON 600 RIBAVIRIN/INTERFERON ALFA-2B,R
00085124101 REBETRON 1200 RIBAVIRIN/INTERFERON ALFA-2B,R
00085124102 REBETRON 1000 RIBAVIRIN/INTERFERON ALFA-2B,R
00085124103 REBETRON 600 RIBAVIRIN/INTERFERON ALFA-2B,R
00085125801 REBETRON 1200 RIBAVIRIN/INTERFERON ALFA-2B,R
00085125802 REBETRON 1000 RIBAVIRIN/INTERFERON ALFA-2B,R
00085125803 REBETRON 600 RIBAVIRIN/INTERFERON ALFA-2B,R
00085127901 PEGINTRON PEGINTERFERON ALFA-2B
00085129101 PEGINTRON PEGINTERFERON ALFA-2B
00085129701 PEGINTRON REDIPEN PEGINTERFERON ALFA-2B
00085129702 PEGINTRON REDIPEN PEGINTERFERON ALFA-2B
00085130401 PEGINTRON PEGINTERFERON ALFA-2B
00085131601 PEGINTRON REDIPEN PEGINTERFERON ALFA-2B
00085131602 PEGINTRON REDIPEN PEGINTERFERON ALFA-2B
00085131801 REBETOL RIBAVIRIN
00085132301 PEGINTRON REDIPEN PEGINTERFERON ALFA-2B
00085132302 PEGINTRON REDIPEN PEGINTERFERON ALFA-2B
00085132704 REBETOL RIBAVIRIN
00085135105 REBETOL RIBAVIRIN
00085136801 PEGINTRON PEGINTERFERON ALFA-2B
00085137001 PEGINTRON REDIPEN PEGINTERFERON ALFA-2B
00085137002 PEGINTRON REDIPEN PEGINTERFERON ALFA-2B
00085138507 REBETOL RIBAVIRIN
00085435301 PEGINTRON PEGINTERFERON ALFA-2B
00085435401 PEGINTRON PEGINTERFERON ALFA-2B
00085435501 PEGINTRON PEGINTERFERON ALFA-2B
00085435601 PEGINTRON PEGINTERFERON ALFA-2B
00093722758 RIBAVIRIN RIBAVIRIN
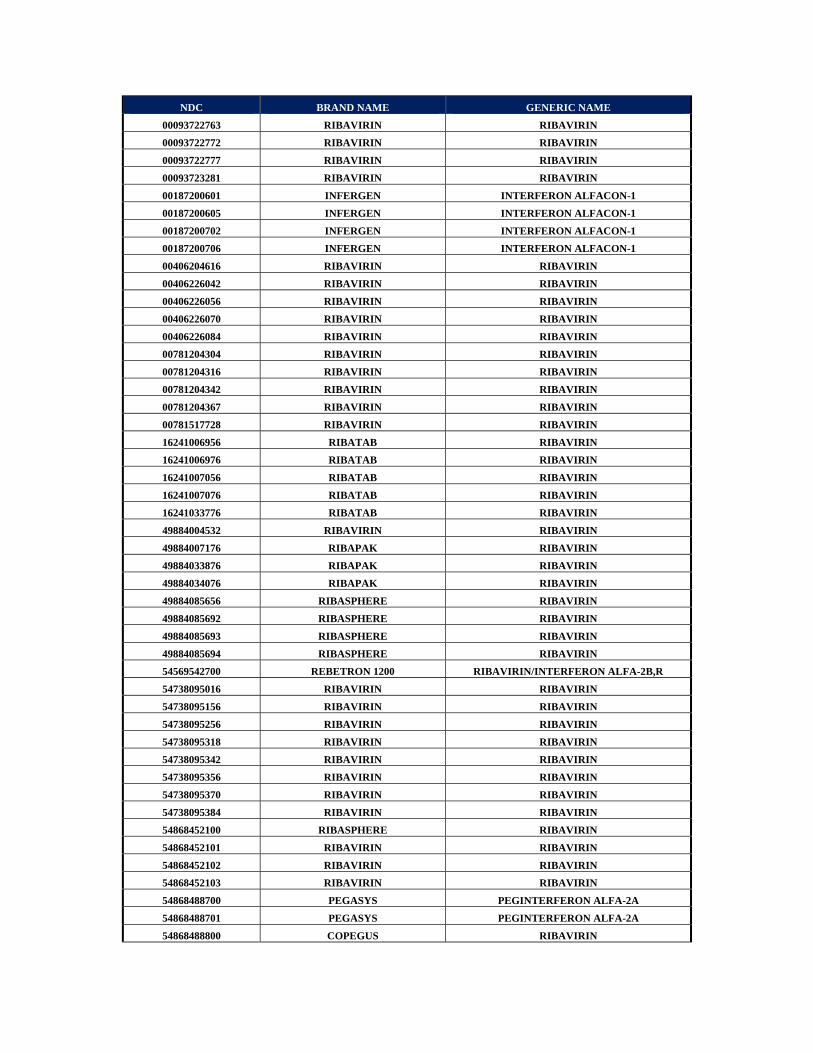
NDC BRAND NAME GENERIC NAME
00093722763 RIBAVIRIN RIBAVIRIN
00093722772 RIBAVIRIN RIBAVIRIN
00093722777 RIBAVIRIN RIBAVIRIN
00093723281 RIBAVIRIN RIBAVIRIN
00187200601 INFERGEN INTERFERON ALFACON-1
00187200605 INFERGEN INTERFERON ALFACON-1
00187200702 INFERGEN INTERFERON ALFACON-1
00187200706 INFERGEN INTERFERON ALFACON-1
00406204616 RIBAVIRIN RIBAVIRIN
00406226042 RIBAVIRIN RIBAVIRIN
00406226056 RIBAVIRIN RIBAVIRIN
00406226070 RIBAVIRIN RIBAVIRIN
00406226084 RIBAVIRIN RIBAVIRIN
00781204304 RIBAVIRIN RIBAVIRIN
00781204316 RIBAVIRIN RIBAVIRIN
00781204342 RIBAVIRIN RIBAVIRIN
00781204367 RIBAVIRIN RIBAVIRIN
00781517728 RIBAVIRIN RIBAVIRIN
16241006956 RIBATAB RIBAVIRIN
16241006976 RIBATAB RIBAVIRIN
16241007056 RIBATAB RIBAVIRIN
16241007076 RIBATAB RIBAVIRIN
16241033776 RIBATAB RIBAVIRIN
49884004532 RIBAVIRIN RIBAVIRIN
49884007176 RIBAPAK RIBAVIRIN
49884033876 RIBAPAK RIBAVIRIN
49884034076 RIBAPAK RIBAVIRIN
49884085656 RIBASPHERE RIBAVIRIN
49884085692 RIBASPHERE RIBAVIRIN
49884085693 RIBASPHERE RIBAVIRIN
49884085694 RIBASPHERE RIBAVIRIN
54569542700 REBETRON 1200 RIBAVIRIN/INTERFERON ALFA-2B,R
54738095016 RIBAVIRIN RIBAVIRIN
54738095156 RIBAVIRIN RIBAVIRIN
54738095256 RIBAVIRIN RIBAVIRIN
54738095318 RIBAVIRIN RIBAVIRIN
54738095342 RIBAVIRIN RIBAVIRIN
54738095356 RIBAVIRIN RIBAVIRIN
54738095370 RIBAVIRIN RIBAVIRIN
54738095384 RIBAVIRIN RIBAVIRIN
54868452100 RIBASPHERE RIBAVIRIN
54868452101 RIBAVIRIN RIBAVIRIN
54868452102 RIBAVIRIN RIBAVIRIN
54868452103 RIBAVIRIN RIBAVIRIN
54868488700 PEGASYS PEGINTERFERON ALFA-2A
54868488701 PEGASYS PEGINTERFERON ALFA-2A
54868488800 COPEGUS RIBAVIRIN

NDC BRAND NAME GENERIC NAME
54868503500 REBETOL RIBAVIRIN
54868503600 PEGINTRON REDIPEN PEGINTERFERON ALFA-2B
54868503601 PEGINTRON REDIPEN PEGINTERFERON ALFA-2B
55513055401 INFERGEN INTERFERON ALFACON-1
55513055406 INFERGEN INTERFERON ALFACON-1
55513056201 INFERGEN INTERFERON ALFACON-1
55513056206 INFERGEN INTERFERON ALFACON-1
55513092601 INFERGEN INTERFERON ALFACON-1
55513092606 INFERGEN INTERFERON ALFACON-1
55513092701 INFERGEN INTERFERON ALFACON-1
55513092706 INFERGEN INTERFERON ALFACON-1
59930152301 RIBAVIRIN RIBAVIRIN
59930152302 RIBAVIRIN RIBAVIRIN
59930152303 RIBAVIRIN RIBAVIRIN
59930152304 RIBAVIRIN RIBAVIRIN
64116003101 INFERGEN INTERFERON ALFACON-1
64116003106 INFERGEN INTERFERON ALFACON-1
64116003124 INFERGEN INTERFERON ALFACON-1
64116003901 INFERGEN INTERFERON ALFACON-1
64116003906 INFERGEN INTERFERON ALFACON-1
64116003924 INFERGEN INTERFERON ALFACON-1
65862020768 RIBAVIRIN RIBAVIRIN
65862029018 RIBAVIRIN RIBAVIRIN
65862029042 RIBAVIRIN RIBAVIRIN
65862029056 RIBAVIRIN RIBAVIRIN
65862029070 RIBAVIRIN RIBAVIRIN
65862029084 RIBAVIRIN RIBAVIRIN
66435010118 RIBASPHERE RIBAVIRIN
66435010142 RIBASPHERE RIBAVIRIN
66435010156 RIBASPHERE RIBAVIRIN
66435010170 RIBASPHERE RIBAVIRIN
66435010184 RIBASPHERE RIBAVIRIN
66435010216 RIBASPHERE RIBAVIRIN
66435010356 RIBASPHERE RIBAVIRIN
66435010456 RIBASPHERE RIBAVIRIN
66435010556 RIBAPAK RIBAVIRIN
66435010599 RIBAPAK RIBAVIRIN
66435010656 RIBAPAK RIBAVIRIN
66435010699 RIBAPAK RIBAVIRIN
66435010756 RIBAPAK RIBAVIRIN
66435010799 RIBAPAK RIBAVIRIN
66435010856 RIBAPAK RIBAVIRIN
66435010899 RIBAPAK RIBAVIRIN
66435020115 INFERGEN INTERFERON ALFACON-1
66435020195 INFERGEN INTERFERON ALFACON-1
66435020196 INFERGEN INTERFERON ALFACON-1
66435020199 INFERGEN INTERFERON ALFACON-1
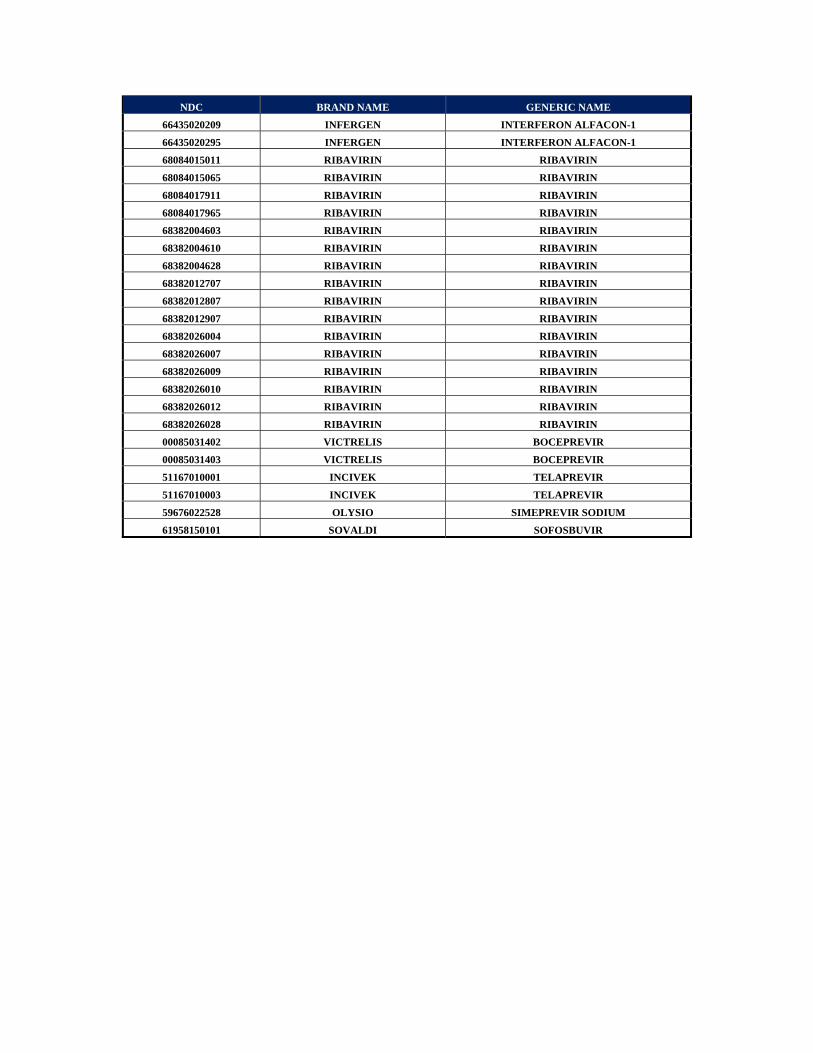
NDC BRAND NAME GENERIC NAME
66435020209 INFERGEN INTERFERON ALFACON-1
66435020295 INFERGEN INTERFERON ALFACON-1
68084015011 RIBAVIRIN RIBAVIRIN
68084015065 RIBAVIRIN RIBAVIRIN
68084017911 RIBAVIRIN RIBAVIRIN
68084017965 RIBAVIRIN RIBAVIRIN
68382004603 RIBAVIRIN RIBAVIRIN
68382004610 RIBAVIRIN RIBAVIRIN
68382004628 RIBAVIRIN RIBAVIRIN
68382012707 RIBAVIRIN RIBAVIRIN
68382012807 RIBAVIRIN RIBAVIRIN
68382012907 RIBAVIRIN RIBAVIRIN
68382026004 RIBAVIRIN RIBAVIRIN
68382026007 RIBAVIRIN RIBAVIRIN
68382026009 RIBAVIRIN RIBAVIRIN
68382026010 RIBAVIRIN RIBAVIRIN
68382026012 RIBAVIRIN RIBAVIRIN
68382026028 RIBAVIRIN RIBAVIRIN
00085031402 VICTRELIS BOCEPREVIR
00085031403 VICTRELIS BOCEPREVIR
51167010001 INCIVEK TELAPREVIR
51167010003 INCIVEK TELAPREVIR
59676022528 OLYSIO SIMEPREVIR SODIUM
61958150101 SOVALDI SOFOSBUVIR

Milliman Client Report
State Fiscal Year 2017 Rate Certification
SCM01-64
June 22, 2016
APPENDIX 5: UNADJUSTED SFY 2015 BASE DATA
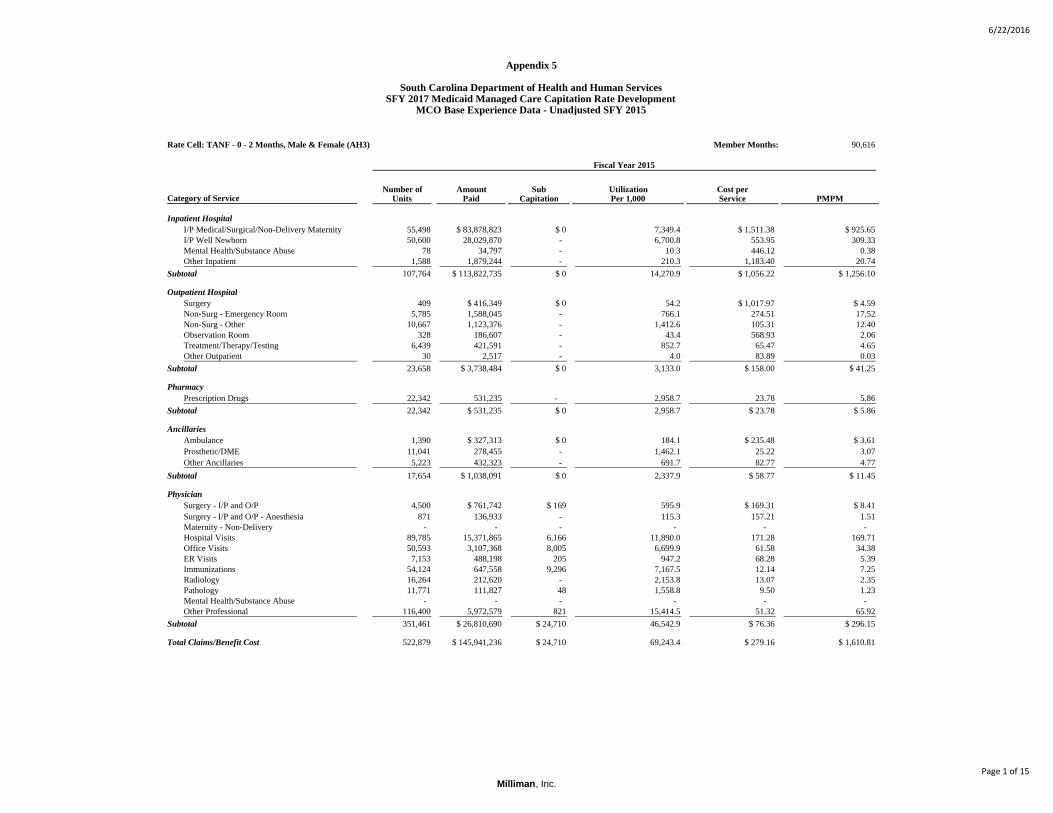
6/22/2016
Appendix 5
South Carolina Department of Health and Human ServicesSFY 2017 Medicaid Managed Care Capitation Rate Development
MCO Base Experience Data - Unadjusted SFY 2015
Rate Cell: TANF - 0 - 2 Months, Male & Female (AH3) Member Months: 90,616
Fiscal Year 2015
Number of Amount Sub Utilization Cost perUnits Paid Capitation Per 1,000 Service PMPM
Inpatient HospitalI/P Medical/Surgical/Non-Delivery Maternity 55,498 $ 83,878,823 $ 0 7,349.4 $ 1,511.38 $ 925.65I/P Well Newborn 50,600 28,029,870 - 6,700.8 553.95 309.33 Mental Health/Substance Abuse 78 34,797 - 10.3 446.12 0.38 Other Inpatient 1,588 1,879,244 - 210.3 1,183.40 20.74
Subtotal 107,764 $ 113,822,735 $ 0 14,270.9 $ 1,056.22 $ 1,256.10
Outpatient HospitalSurgery 409 $ 416,349 $ 0 54.2 $ 1,017.97 $ 4.59Non-Surg - Emergency Room 5,785 1,588,045 - 766.1 274.51 17.52 Non-Surg - Other 10,667 1,123,376 - 1,412.6 105.31 12.40 Observation Room 328 186,607 - 43.4 568.93 2.06 Treatment/Therapy/Testing 6,439 421,591 - 852.7 65.47 4.65 Other Outpatient 30 2,517 - 4.0 83.89 0.03
Subtotal 23,658 $ 3,738,484 $ 0 3,133.0 $ 158.00 $ 41.25
PharmacyPrescription Drugs 22,342 531,235 - 2,958.7 23.78 5.86
Subtotal 22,342 $ 531,235 $ 0 2,958.7 $ 23.78 $ 5.86
AncillariesAmbulance 1,390 $ 327,313 $ 0 184.1 $ 235.48 $ 3.61Prosthetic/DME 11,041 278,455 - 1,462.1 25.22 3.07 Other Ancillaries 5,223 432,323 - 691.7 82.77 4.77
Subtotal 17,654 $ 1,038,091 $ 0 2,337.9 $ 58.77 $ 11.45
PhysicianSurgery - I/P and O/P 4,500 $ 761,742 $ 169 595.9 $ 169.31 $ 8.41Surgery - I/P and O/P - Anesthesia 871 136,933 - 115.3 157.21 1.51 Maternity - Non-Delivery - - - - - - Hospital Visits 89,785 15,371,865 6,166 11,890.0 171.28 169.71 Office Visits 50,593 3,107,368 8,005 6,699.9 61.58 34.38 ER Visits 7,153 488,198 205 947.2 68.28 5.39 Immunizations 54,124 647,558 9,296 7,167.5 12.14 7.25 Radiology 16,264 212,620 - 2,153.8 13.07 2.35 Pathology 11,771 111,827 48 1,558.8 9.50 1.23 Mental Health/Substance Abuse - - - - - - Other Professional 116,400 5,972,579 821 15,414.5 51.32 65.92
Subtotal 351,461 $ 26,810,690 $ 24,710 46,542.9 $ 76.36 $ 296.15
Total Claims/Benefit Cost 522,879 $ 145,941,236 $ 24,710 69,243.4 $ 279.16 $ 1,610.81
Category of Service
Milliman, Inc.Page 1 of 15
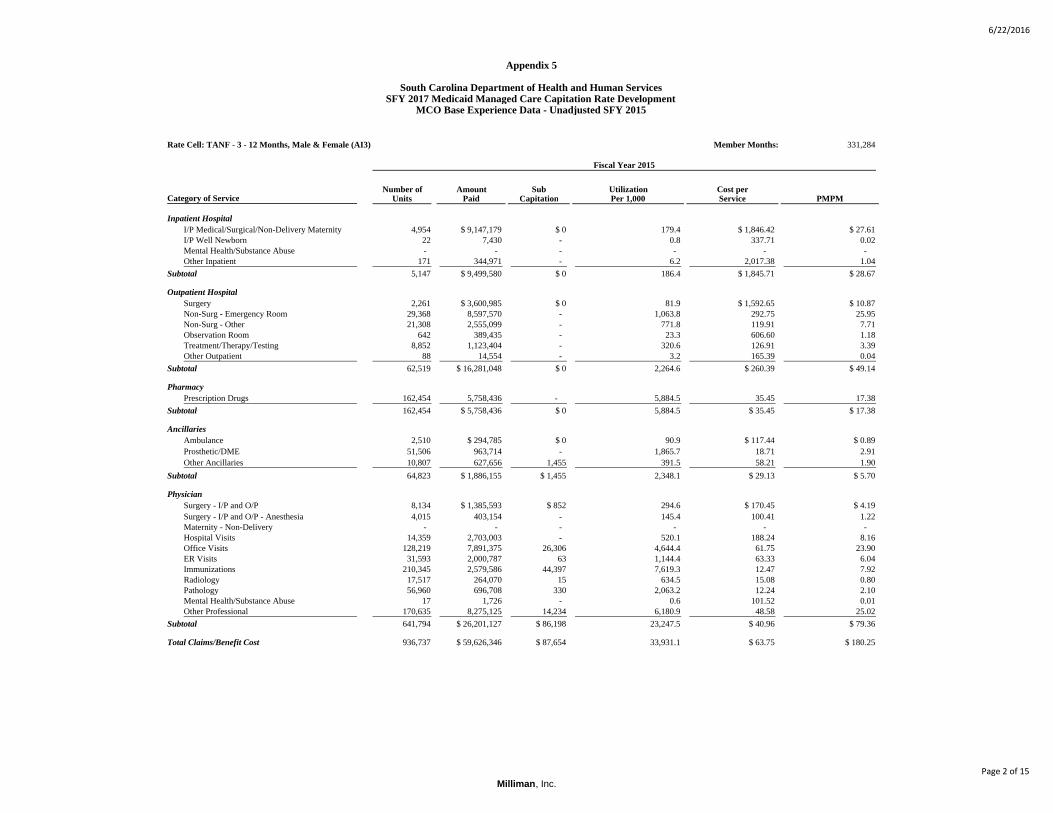
6/22/2016
Appendix 5
South Carolina Department of Health and Human ServicesSFY 2017 Medicaid Managed Care Capitation Rate Development
MCO Base Experience Data - Unadjusted SFY 2015
Rate Cell: TANF - 3 - 12 Months, Male & Female (AI3) Member Months: 331,284
Fiscal Year 2015
Number of Amount Sub Utilization Cost perUnits Paid Capitation Per 1,000 Service PMPM
Inpatient HospitalI/P Medical/Surgical/Non-Delivery Maternity 4,954 $ 9,147,179 $ 0 179.4 $ 1,846.42 $ 27.61I/P Well Newborn 22 7,430 - 0.8 337.71 0.02 Mental Health/Substance Abuse - - - - - - Other Inpatient 171 344,971 - 6.2 2,017.38 1.04
Subtotal 5,147 $ 9,499,580 $ 0 186.4 $ 1,845.71 $ 28.67
Outpatient HospitalSurgery 2,261 $ 3,600,985 $ 0 81.9 $ 1,592.65 $ 10.87Non-Surg - Emergency Room 29,368 8,597,570 - 1,063.8 292.75 25.95 Non-Surg - Other 21,308 2,555,099 - 771.8 119.91 7.71 Observation Room 642 389,435 - 23.3 606.60 1.18 Treatment/Therapy/Testing 8,852 1,123,404 - 320.6 126.91 3.39 Other Outpatient 88 14,554 - 3.2 165.39 0.04
Subtotal 62,519 $ 16,281,048 $ 0 2,264.6 $ 260.39 $ 49.14
PharmacyPrescription Drugs 162,454 5,758,436 - 5,884.5 35.45 17.38
Subtotal 162,454 $ 5,758,436 $ 0 5,884.5 $ 35.45 $ 17.38
AncillariesAmbulance 2,510 $ 294,785 $ 0 90.9 $ 117.44 $ 0.89Prosthetic/DME 51,506 963,714 - 1,865.7 18.71 2.91 Other Ancillaries 10,807 627,656 1,455 391.5 58.21 1.90
Subtotal 64,823 $ 1,886,155 $ 1,455 2,348.1 $ 29.13 $ 5.70
PhysicianSurgery - I/P and O/P 8,134 $ 1,385,593 $ 852 294.6 $ 170.45 $ 4.19Surgery - I/P and O/P - Anesthesia 4,015 403,154 - 145.4 100.41 1.22 Maternity - Non-Delivery - - - - - - Hospital Visits 14,359 2,703,003 - 520.1 188.24 8.16 Office Visits 128,219 7,891,375 26,306 4,644.4 61.75 23.90 ER Visits 31,593 2,000,787 63 1,144.4 63.33 6.04 Immunizations 210,345 2,579,586 44,397 7,619.3 12.47 7.92 Radiology 17,517 264,070 15 634.5 15.08 0.80 Pathology 56,960 696,708 330 2,063.2 12.24 2.10 Mental Health/Substance Abuse 17 1,726 - 0.6 101.52 0.01 Other Professional 170,635 8,275,125 14,234 6,180.9 48.58 25.02
Subtotal 641,794 $ 26,201,127 $ 86,198 23,247.5 $ 40.96 $ 79.36
Total Claims/Benefit Cost 936,737 $ 59,626,346 $ 87,654 33,931.1 $ 63.75 $ 180.25
Category of Service
Milliman, Inc.Page 2 of 15

6/22/2016
Appendix 5
South Carolina Department of Health and Human ServicesSFY 2017 Medicaid Managed Care Capitation Rate Development
MCO Base Experience Data - Unadjusted SFY 2015
Rate Cell: TANF - Age 1 - 6, Male & Female (AB3) Member Months: 2,335,515
Fiscal Year 2015
Number of Amount Sub Utilization Cost perUnits Paid Capitation Per 1,000 Service PMPM
Inpatient HospitalI/P Medical/Surgical/Non-Delivery Maternity 8,891 $ 16,171,157 $ 0 45.7 $ 1,818.82 $ 6.92I/P Well Newborn - - - - - - Mental Health/Substance Abuse 83 91,557 - 0.4 1,103.09 0.04 Other Inpatient 270 529,439 - 1.4 1,960.89 0.23
Subtotal 9,244 $ 16,792,152 $ 0 47.5 $ 1,816.42 $ 7.19
Outpatient HospitalSurgery 12,909 $ 17,188,482 $ 0 66.3 $ 1,331.51 $ 7.36Non-Surg - Emergency Room 114,634 34,537,200 - 589.0 301.28 14.79 Non-Surg - Other 54,849 6,208,470 - 281.8 113.19 2.66 Observation Room 1,414 1,022,023 - 7.3 722.79 0.44 Treatment/Therapy/Testing 39,271 6,042,979 - 201.8 153.88 2.59 Other Outpatient 951 254,059 - 4.9 267.15 0.11
Subtotal 224,028 $ 65,253,213 $ 0 1,151.1 $ 291.37 $ 27.95
PharmacyPrescription Drugs 972,521 40,391,417 - 4,996.9 41.53 17.29
Subtotal 972,521 $ 40,391,417 $ 0 4,996.9 $ 41.53 $ 17.29
AncillariesAmbulance 9,312 $ 968,323 $ 0 47.8 $ 103.99 $ 0.41Prosthetic/DME 149,597 1,995,671 - 768.6 13.34 0.85 Other Ancillaries 62,220 2,618,824 353,237 319.7 47.77 1.27
Subtotal 221,129 $ 5,582,818 $ 353,237 1,136.2 $ 26.72 $ 2.53
PhysicianSurgery - I/P and O/P 41,222 $ 5,663,364 $ 2,474 211.8 $ 137.45 $ 2.43Surgery - I/P and O/P - Anesthesia 23,165 2,123,362 - 119.0 91.66 0.91 Maternity - Non-Delivery 1 32 - 0.0 31.57 - Hospital Visits 12,763 1,420,892 1,114 65.6 111.42 0.61 Office Visits 553,668 33,702,898 137,275 2,844.8 61.12 14.49 ER Visits 122,877 7,559,141 615 631.3 61.52 3.24 Immunizations 243,877 3,019,592 44,808 1,253.1 12.57 1.31 Radiology 65,702 1,068,269 33 337.6 16.26 0.46 Pathology 338,716 3,861,558 3,286 1,740.3 11.41 1.65 Mental Health/Substance Abuse 19,208 1,967,045 - 98.7 102.41 0.84 Other Professional 1,097,782 30,059,800 59,647 5,640.5 27.44 12.90
Subtotal 2,518,981 $ 90,445,953 $ 249,253 12,942.7 $ 36.01 $ 38.84
Total Claims/Benefit Cost 3,945,903 $ 218,465,553 $ 602,490 20,274.4 $ 55.52 $ 93.80
Category of Service
Milliman, Inc.Page 3 of 15

6/22/2016
Appendix 5
South Carolina Department of Health and Human ServicesSFY 2017 Medicaid Managed Care Capitation Rate Development
MCO Base Experience Data - Unadjusted SFY 2015
Rate Cell: TANF - Age 7 - 13, Male & Female (AC3) Member Months: 2,421,425
Fiscal Year 2015
Number of Amount Sub Utilization Cost perUnits Paid Capitation Per 1,000 Service PMPM
Inpatient HospitalI/P Medical/Surgical/Non-Delivery Maternity 6,167 $ 13,806,939 $ 0 30.6 $ 2,238.84 $ 5.70I/P Well Newborn - - - - - - Mental Health/Substance Abuse 2,665 2,052,649 - 13.2 770.22 0.85 Other Inpatient 176 292,924 - 0.9 1,664.34 0.12
Subtotal 9,008 $ 16,152,511 $ 0 44.6 $ 1,794.62 $ 6.67
Outpatient HospitalSurgery 7,898 $ 10,524,295 $ 0 39.1 $ 1,332.53 $ 4.35Non-Surg - Emergency Room 70,360 21,579,642 - 348.7 306.70 8.91 Non-Surg - Other 36,927 4,200,850 - 183.0 113.76 1.73 Observation Room 992 586,832 - 4.9 591.56 0.24 Treatment/Therapy/Testing 33,952 6,080,005 - 168.3 179.08 2.51 Other Outpatient 401 127,421 - 2.0 317.76 0.05
Subtotal 150,530 $ 43,099,044 $ 0 746.0 $ 286.17 $ 17.79
PharmacyPrescription Drugs 1,174,789 84,827,810 - 5,822.0 72.21 35.03
Subtotal 1,174,789 $ 84,827,810 $ 0 5,822.0 $ 72.21 $ 35.03
AncillariesAmbulance 6,759 $ 691,547 $ 0 33.5 $ 102.31 $ 0.29Prosthetic/DME 242,224 2,058,087 - 1,200.4 8.50 0.85 Other Ancillaries 145,477 3,496,152 1,056,184 720.9 31.29 1.88
Subtotal 394,460 $ 6,245,786 $ 1,056,184 1,954.8 $ 18.54 $ 3.02
PhysicianSurgery - I/P and O/P 32,709 $ 4,348,259 $ 1,330 162.1 $ 132.98 $ 1.80Surgery - I/P and O/P - Anesthesia 10,299 1,016,240 - 51.0 98.67 0.42 Maternity - Non-Delivery - - - - - - Hospital Visits 11,620 1,011,417 261 57.6 87.06 0.42 Office Visits 455,734 27,265,470 122,175 2,258.5 60.10 11.31 ER Visits 75,427 4,759,276 - 373.8 63.10 1.97 Immunizations 110,403 1,375,915 28,845 547.1 12.72 0.58 Radiology 79,696 1,604,934 302 395.0 20.14 0.66 Pathology 301,706 3,119,864 2,256 1,495.2 10.35 1.29 Mental Health/Substance Abuse 56,988 5,590,906 - 282.4 98.11 2.31 Other Professional 826,819 16,973,144 83,901 4,097.5 20.63 7.04
Subtotal 1,961,401 $ 67,065,426 $ 239,070 9,720.2 $ 34.32 $ 27.80
Total Claims/Benefit Cost 3,690,188 $ 217,390,579 $ 1,295,254 18,287.6 $ 59.26 $ 90.31
Category of Service
Milliman, Inc.Page 4 of 15
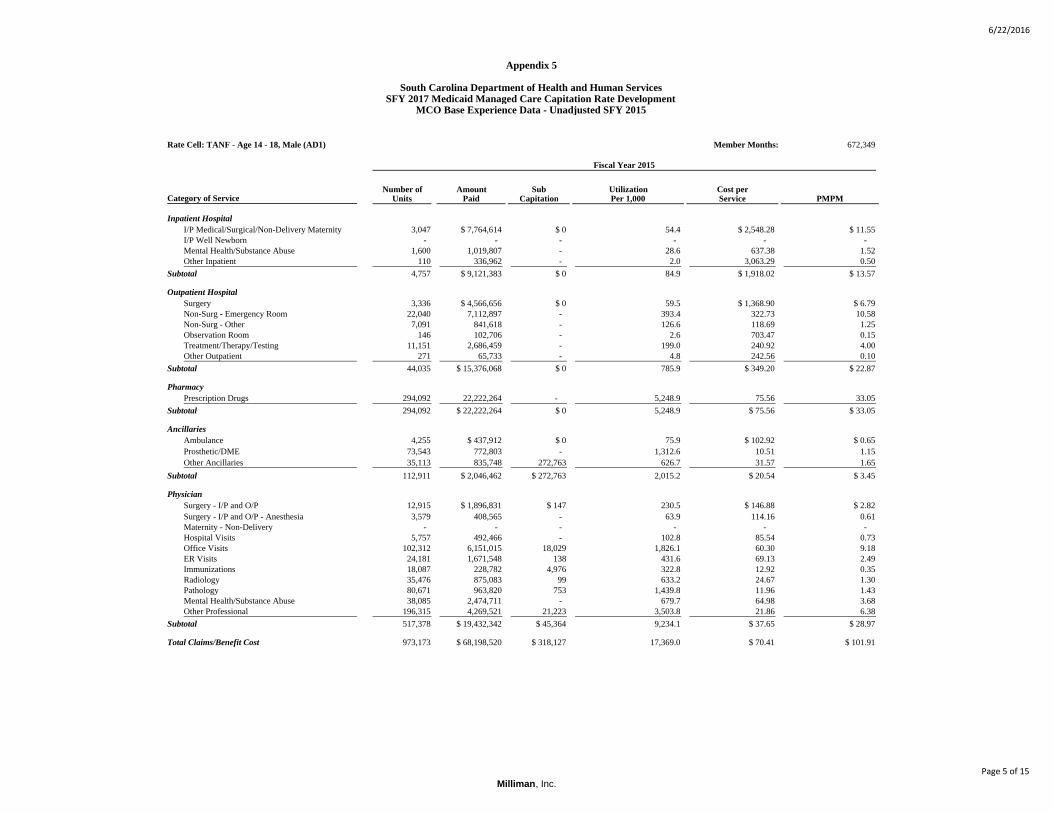
6/22/2016
Appendix 5
South Carolina Department of Health and Human ServicesSFY 2017 Medicaid Managed Care Capitation Rate Development
MCO Base Experience Data - Unadjusted SFY 2015
Rate Cell: TANF - Age 14 - 18, Male (AD1) Member Months: 672,349
Fiscal Year 2015
Number of Amount Sub Utilization Cost perUnits Paid Capitation Per 1,000 Service PMPM
Inpatient HospitalI/P Medical/Surgical/Non-Delivery Maternity 3,047 $ 7,764,614 $ 0 54.4 $ 2,548.28 $ 11.55I/P Well Newborn - - - - - - Mental Health/Substance Abuse 1,600 1,019,807 - 28.6 637.38 1.52 Other Inpatient 110 336,962 - 2.0 3,063.29 0.50
Subtotal 4,757 $ 9,121,383 $ 0 84.9 $ 1,918.02 $ 13.57
Outpatient HospitalSurgery 3,336 $ 4,566,656 $ 0 59.5 $ 1,368.90 $ 6.79Non-Surg - Emergency Room 22,040 7,112,897 - 393.4 322.73 10.58 Non-Surg - Other 7,091 841,618 - 126.6 118.69 1.25 Observation Room 146 102,706 - 2.6 703.47 0.15 Treatment/Therapy/Testing 11,151 2,686,459 - 199.0 240.92 4.00 Other Outpatient 271 65,733 - 4.8 242.56 0.10
Subtotal 44,035 $ 15,376,068 $ 0 785.9 $ 349.20 $ 22.87
PharmacyPrescription Drugs 294,092 22,222,264 - 5,248.9 75.56 33.05
Subtotal 294,092 $ 22,222,264 $ 0 5,248.9 $ 75.56 $ 33.05
AncillariesAmbulance 4,255 $ 437,912 $ 0 75.9 $ 102.92 $ 0.65Prosthetic/DME 73,543 772,803 - 1,312.6 10.51 1.15 Other Ancillaries 35,113 835,748 272,763 626.7 31.57 1.65
Subtotal 112,911 $ 2,046,462 $ 272,763 2,015.2 $ 20.54 $ 3.45
PhysicianSurgery - I/P and O/P 12,915 $ 1,896,831 $ 147 230.5 $ 146.88 $ 2.82Surgery - I/P and O/P - Anesthesia 3,579 408,565 - 63.9 114.16 0.61 Maternity - Non-Delivery - - - - - - Hospital Visits 5,757 492,466 - 102.8 85.54 0.73 Office Visits 102,312 6,151,015 18,029 1,826.1 60.30 9.18 ER Visits 24,181 1,671,548 138 431.6 69.13 2.49 Immunizations 18,087 228,782 4,976 322.8 12.92 0.35 Radiology 35,476 875,083 99 633.2 24.67 1.30 Pathology 80,671 963,820 753 1,439.8 11.96 1.43 Mental Health/Substance Abuse 38,085 2,474,711 - 679.7 64.98 3.68 Other Professional 196,315 4,269,521 21,223 3,503.8 21.86 6.38
Subtotal 517,378 $ 19,432,342 $ 45,364 9,234.1 $ 37.65 $ 28.97
Total Claims/Benefit Cost 973,173 $ 68,198,520 $ 318,127 17,369.0 $ 70.41 $ 101.91
Category of Service
Milliman, Inc.Page 5 of 15

6/22/2016
Appendix 5
South Carolina Department of Health and Human ServicesSFY 2017 Medicaid Managed Care Capitation Rate Development
MCO Base Experience Data - Unadjusted SFY 2015
Rate Cell: TANF - Age 14 - 18, Female (AD2) Member Months: 690,438
Fiscal Year 2015
Number of Amount Sub Utilization Cost perUnits Paid Capitation Per 1,000 Service PMPM
Inpatient HospitalI/P Medical/Surgical/Non-Delivery Maternity 3,006 $ 6,390,819 $ 0 52.2 $ 2,126.02 $ 9.26I/P Well Newborn - - - - - - Mental Health/Substance Abuse 2,411 1,674,465 - 41.9 694.51 2.43 Other Inpatient 226 288,779 - 3.9 1,277.78 0.42
Subtotal 5,643 $ 8,354,063 $ 0 98.1 $ 1,481.35 $ 12.11
Outpatient HospitalSurgery 4,265 $ 4,962,687 $ 0 74.1 $ 1,163.58 $ 7.19Non-Surg - Emergency Room 37,300 11,915,156 - 648.3 319.44 17.26 Non-Surg - Other 12,469 1,638,574 - 216.7 131.41 2.37 Observation Room 899 329,482 - 15.6 366.50 0.48 Treatment/Therapy/Testing 21,289 3,909,652 - 370.0 183.65 5.66 Other Outpatient 427 136,226 - 7.4 319.03 0.20
Subtotal 76,649 $ 22,891,777 $ 0 1,332.2 $ 298.69 $ 33.16
PharmacyPrescription Drugs 435,812 20,210,712 - 7,574.5 46.37 29.27
Subtotal 435,812 $ 20,210,712 $ 0 7,574.5 $ 46.37 $ 29.27
AncillariesAmbulance 6,560 $ 592,792 $ 0 114.0 $ 90.36 $ 0.86Prosthetic/DME 101,781 828,537 - 1,769.0 8.14 1.20 Other Ancillaries 60,824 1,997,505 615,992 1,057.1 42.97 3.79
Subtotal 169,165 $ 3,418,834 $ 615,992 2,940.1 $ 23.88 $ 5.85
PhysicianSurgery - I/P and O/P 12,692 $ 1,766,997 $ 696 220.6 $ 139.28 $ 2.56Surgery - I/P and O/P - Anesthesia 3,897 413,418 - 67.7 106.09 0.60 Maternity - Non-Delivery 1,748 63,455 - 30.4 36.30 0.09 Hospital Visits 7,905 572,749 - 137.4 72.45 0.83 Office Visits 154,476 9,241,693 25,617 2,684.8 59.99 13.42 ER Visits 39,628 2,881,016 73 688.7 72.70 4.17 Immunizations 19,690 248,771 5,409 342.2 12.91 0.37 Radiology 38,916 1,182,027 91 676.4 30.38 1.71 Pathology 213,377 2,576,805 2,188 3,708.6 12.09 3.74 Mental Health/Substance Abuse 25,094 1,780,030 - 436.1 70.93 2.58 Other Professional 1,343,819 4,679,152 5,320 23,355.9 3.49 6.78
Subtotal 1,861,242 $ 25,406,113 $ 39,393 32,348.9 $ 13.67 $ 36.85
Total Claims/Benefit Cost 2,548,511 $ 80,281,499 $ 655,385 44,293.8 $ 31.76 $ 117.24
Category of Service
Milliman, Inc.Page 6 of 15
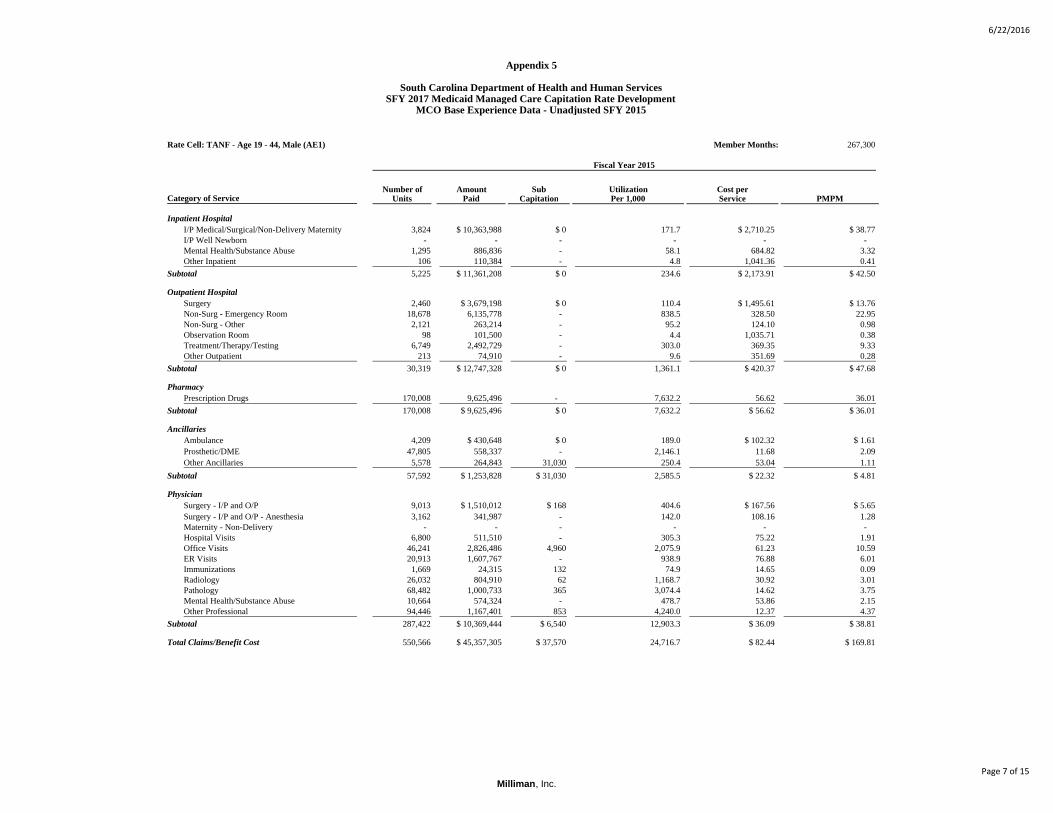
6/22/2016
Appendix 5
South Carolina Department of Health and Human ServicesSFY 2017 Medicaid Managed Care Capitation Rate Development
MCO Base Experience Data - Unadjusted SFY 2015
Rate Cell: TANF - Age 19 - 44, Male (AE1) Member Months: 267,300
Fiscal Year 2015
Number of Amount Sub Utilization Cost perUnits Paid Capitation Per 1,000 Service PMPM
Inpatient HospitalI/P Medical/Surgical/Non-Delivery Maternity 3,824 $ 10,363,988 $ 0 171.7 $ 2,710.25 $ 38.77I/P Well Newborn - - - - - - Mental Health/Substance Abuse 1,295 886,836 - 58.1 684.82 3.32 Other Inpatient 106 110,384 - 4.8 1,041.36 0.41
Subtotal 5,225 $ 11,361,208 $ 0 234.6 $ 2,173.91 $ 42.50
Outpatient HospitalSurgery 2,460 $ 3,679,198 $ 0 110.4 $ 1,495.61 $ 13.76Non-Surg - Emergency Room 18,678 6,135,778 - 838.5 328.50 22.95 Non-Surg - Other 2,121 263,214 - 95.2 124.10 0.98 Observation Room 98 101,500 - 4.4 1,035.71 0.38 Treatment/Therapy/Testing 6,749 2,492,729 - 303.0 369.35 9.33 Other Outpatient 213 74,910 - 9.6 351.69 0.28
Subtotal 30,319 $ 12,747,328 $ 0 1,361.1 $ 420.37 $ 47.68
PharmacyPrescription Drugs 170,008 9,625,496 - 7,632.2 56.62 36.01
Subtotal 170,008 $ 9,625,496 $ 0 7,632.2 $ 56.62 $ 36.01
AncillariesAmbulance 4,209 $ 430,648 $ 0 189.0 $ 102.32 $ 1.61Prosthetic/DME 47,805 558,337 - 2,146.1 11.68 2.09 Other Ancillaries 5,578 264,843 31,030 250.4 53.04 1.11
Subtotal 57,592 $ 1,253,828 $ 31,030 2,585.5 $ 22.32 $ 4.81
PhysicianSurgery - I/P and O/P 9,013 $ 1,510,012 $ 168 404.6 $ 167.56 $ 5.65Surgery - I/P and O/P - Anesthesia 3,162 341,987 - 142.0 108.16 1.28 Maternity - Non-Delivery - - - - - - Hospital Visits 6,800 511,510 - 305.3 75.22 1.91 Office Visits 46,241 2,826,486 4,960 2,075.9 61.23 10.59 ER Visits 20,913 1,607,767 - 938.9 76.88 6.01 Immunizations 1,669 24,315 132 74.9 14.65 0.09 Radiology 26,032 804,910 62 1,168.7 30.92 3.01 Pathology 68,482 1,000,733 365 3,074.4 14.62 3.75 Mental Health/Substance Abuse 10,664 574,324 - 478.7 53.86 2.15 Other Professional 94,446 1,167,401 853 4,240.0 12.37 4.37
Subtotal 287,422 $ 10,369,444 $ 6,540 12,903.3 $ 36.09 $ 38.81
Total Claims/Benefit Cost 550,566 $ 45,357,305 $ 37,570 24,716.7 $ 82.44 $ 169.81
Category of Service
Milliman, Inc.Page 7 of 15
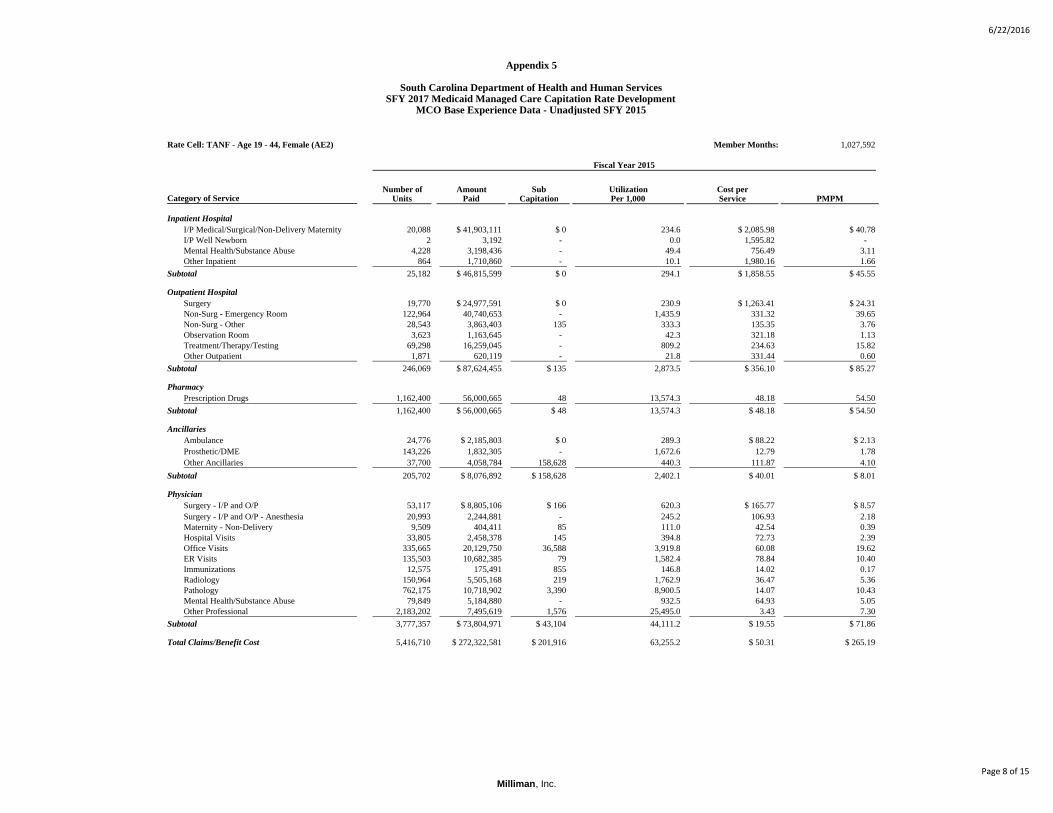
6/22/2016
Appendix 5
South Carolina Department of Health and Human ServicesSFY 2017 Medicaid Managed Care Capitation Rate Development
MCO Base Experience Data - Unadjusted SFY 2015
Rate Cell: TANF - Age 19 - 44, Female (AE2) Member Months: 1,027,592
Fiscal Year 2015
Number of Amount Sub Utilization Cost perUnits Paid Capitation Per 1,000 Service PMPM
Inpatient HospitalI/P Medical/Surgical/Non-Delivery Maternity 20,088 $ 41,903,111 $ 0 234.6 $ 2,085.98 $ 40.78I/P Well Newborn 2 3,192 - 0.0 1,595.82 - Mental Health/Substance Abuse 4,228 3,198,436 - 49.4 756.49 3.11 Other Inpatient 864 1,710,860 - 10.1 1,980.16 1.66
Subtotal 25,182 $ 46,815,599 $ 0 294.1 $ 1,858.55 $ 45.55
Outpatient HospitalSurgery 19,770 $ 24,977,591 $ 0 230.9 $ 1,263.41 $ 24.31Non-Surg - Emergency Room 122,964 40,740,653 - 1,435.9 331.32 39.65 Non-Surg - Other 28,543 3,863,403 135 333.3 135.35 3.76 Observation Room 3,623 1,163,645 - 42.3 321.18 1.13 Treatment/Therapy/Testing 69,298 16,259,045 - 809.2 234.63 15.82 Other Outpatient 1,871 620,119 - 21.8 331.44 0.60
Subtotal 246,069 $ 87,624,455 $ 135 2,873.5 $ 356.10 $ 85.27
PharmacyPrescription Drugs 1,162,400 56,000,665 48 13,574.3 48.18 54.50
Subtotal 1,162,400 $ 56,000,665 $ 48 13,574.3 $ 48.18 $ 54.50
AncillariesAmbulance 24,776 $ 2,185,803 $ 0 289.3 $ 88.22 $ 2.13Prosthetic/DME 143,226 1,832,305 - 1,672.6 12.79 1.78 Other Ancillaries 37,700 4,058,784 158,628 440.3 111.87 4.10
Subtotal 205,702 $ 8,076,892 $ 158,628 2,402.1 $ 40.01 $ 8.01
PhysicianSurgery - I/P and O/P 53,117 $ 8,805,106 $ 166 620.3 $ 165.77 $ 8.57Surgery - I/P and O/P - Anesthesia 20,993 2,244,881 - 245.2 106.93 2.18 Maternity - Non-Delivery 9,509 404,411 85 111.0 42.54 0.39 Hospital Visits 33,805 2,458,378 145 394.8 72.73 2.39 Office Visits 335,665 20,129,750 36,588 3,919.8 60.08 19.62 ER Visits 135,503 10,682,385 79 1,582.4 78.84 10.40 Immunizations 12,575 175,491 855 146.8 14.02 0.17 Radiology 150,964 5,505,168 219 1,762.9 36.47 5.36 Pathology 762,175 10,718,902 3,390 8,900.5 14.07 10.43 Mental Health/Substance Abuse 79,849 5,184,880 - 932.5 64.93 5.05 Other Professional 2,183,202 7,495,619 1,576 25,495.0 3.43 7.30
Subtotal 3,777,357 $ 73,804,971 $ 43,104 44,111.2 $ 19.55 $ 71.86
Total Claims/Benefit Cost 5,416,710 $ 272,322,581 $ 201,916 63,255.2 $ 50.31 $ 265.19
Category of Service
Milliman, Inc.Page 8 of 15

6/22/2016
Appendix 5
South Carolina Department of Health and Human ServicesSFY 2017 Medicaid Managed Care Capitation Rate Development
MCO Base Experience Data - Unadjusted SFY 2015
Rate Cell: TANF - Age 45+, Male & Female (AF3) Member Months: 157,692
Fiscal Year 2015
Number of Amount Sub Utilization Cost perUnits Paid Capitation Per 1,000 Service PMPM
Inpatient HospitalI/P Medical/Surgical/Non-Delivery Maternity 7,001 $ 16,412,421 $ 0 532.8 $ 2,344.30 $ 104.08I/P Well Newborn - - - - - - Mental Health/Substance Abuse 647 432,869 - 49.2 669.04 2.75 Other Inpatient 330 574,289 - 25.1 1,740.27 3.64
Subtotal 7,978 $ 17,419,579 $ 0 607.1 $ 2,183.56 $ 110.47
Outpatient HospitalSurgery 3,280 $ 5,535,626 $ 0 249.6 $ 1,687.69 $ 35.10Non-Surg - Emergency Room 11,401 4,400,503 - 867.6 385.98 27.91 Non-Surg - Other 4,431 604,406 - 337.2 136.40 3.83 Observation Room 334 201,598 - 25.4 603.59 1.28 Treatment/Therapy/Testing 16,607 5,722,197 - 1,263.8 344.57 36.29 Other Outpatient 364 163,936 - 27.7 450.37 1.04
Subtotal 36,417 $ 16,628,265 $ 0 2,771.3 $ 456.61 $ 105.45
PharmacyPrescription Drugs 331,109 17,722,907 - 25,196.6 53.53 112.39
Subtotal 331,109 $ 17,722,907 $ 0 25,196.6 $ 53.53 $ 112.39
AncillariesAmbulance 3,567 $ 348,325 $ 0 271.4 $ 97.65 $ 2.21Prosthetic/DME 76,368 843,676 - 5,811.4 11.05 5.35 Other Ancillaries 6,019 513,270 85 458.0 85.29 3.26
Subtotal 85,954 $ 1,705,271 $ 85 6,540.9 $ 19.85 $ 10.82
PhysicianSurgery - I/P and O/P 16,091 $ 2,788,016 $ 693 1,224.5 $ 173.31 $ 17.68Surgery - I/P and O/P - Anesthesia 5,524 605,879 - 420.4 109.68 3.84 Maternity - Non-Delivery 23 938 - 1.8 40.80 0.01 Hospital Visits 10,308 770,301 - 784.4 74.73 4.88 Office Visits 72,614 4,436,992 12,500 5,525.8 61.28 28.22 ER Visits 13,726 1,174,281 - 1,044.5 85.55 7.45 Immunizations 3,431 46,522 590 261.1 13.73 0.30 Radiology 37,969 1,447,371 38 2,889.4 38.12 9.18 Pathology 120,215 1,644,398 944 9,148.1 13.69 10.43 Mental Health/Substance Abuse 6,893 438,823 - 524.5 63.66 2.78 Other Professional 290,200 2,871,387 584 22,083.6 9.90 18.21
Subtotal 576,994 $ 16,224,907 $ 15,350 43,907.9 $ 28.14 $ 102.98
Total Claims/Benefit Cost 1,038,452 $ 69,700,930 $ 15,436 79,023.8 $ 67.14 $ 442.11
Category of Service
Milliman, Inc.Page 9 of 15
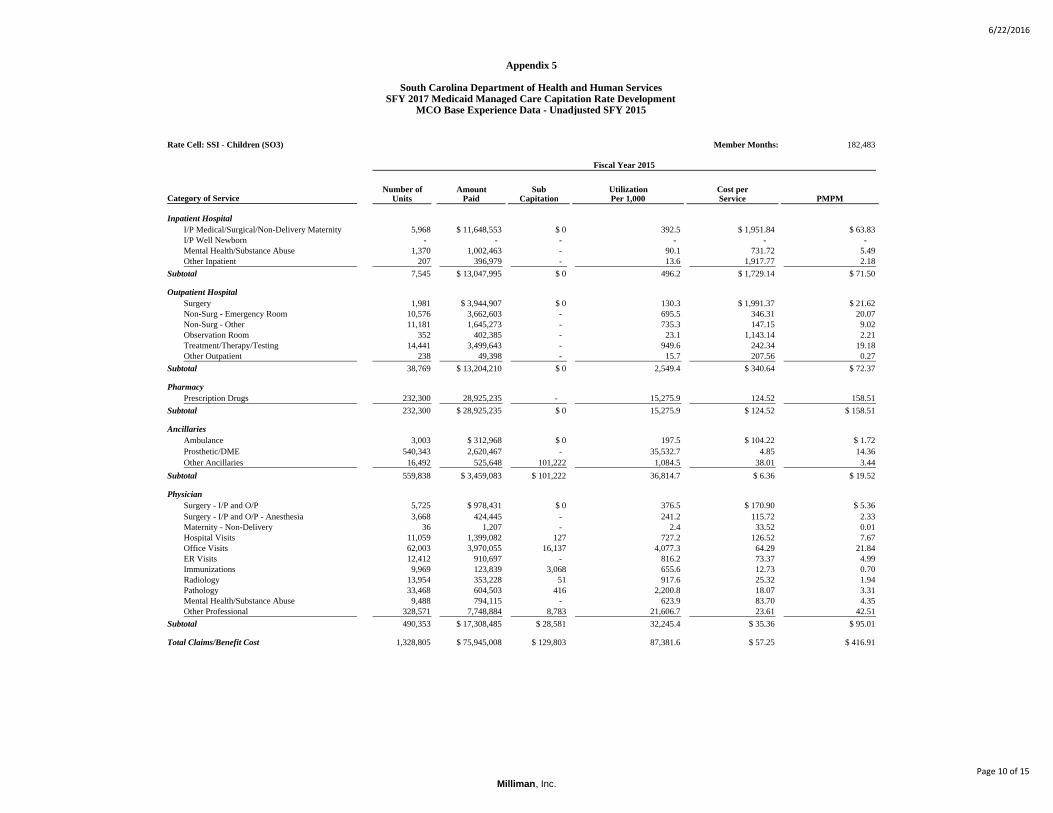
6/22/2016
Appendix 5
South Carolina Department of Health and Human ServicesSFY 2017 Medicaid Managed Care Capitation Rate Development
MCO Base Experience Data - Unadjusted SFY 2015
Rate Cell: SSI - Children (SO3) Member Months: 182,483
Fiscal Year 2015
Number of Amount Sub Utilization Cost perUnits Paid Capitation Per 1,000 Service PMPM
Inpatient HospitalI/P Medical/Surgical/Non-Delivery Maternity 5,968 $ 11,648,553 $ 0 392.5 $ 1,951.84 $ 63.83I/P Well Newborn - - - - - - Mental Health/Substance Abuse 1,370 1,002,463 - 90.1 731.72 5.49 Other Inpatient 207 396,979 - 13.6 1,917.77 2.18
Subtotal 7,545 $ 13,047,995 $ 0 496.2 $ 1,729.14 $ 71.50
Outpatient HospitalSurgery 1,981 $ 3,944,907 $ 0 130.3 $ 1,991.37 $ 21.62Non-Surg - Emergency Room 10,576 3,662,603 - 695.5 346.31 20.07 Non-Surg - Other 11,181 1,645,273 - 735.3 147.15 9.02 Observation Room 352 402,385 - 23.1 1,143.14 2.21 Treatment/Therapy/Testing 14,441 3,499,643 - 949.6 242.34 19.18 Other Outpatient 238 49,398 - 15.7 207.56 0.27
Subtotal 38,769 $ 13,204,210 $ 0 2,549.4 $ 340.64 $ 72.37
PharmacyPrescription Drugs 232,300 28,925,235 - 15,275.9 124.52 158.51
Subtotal 232,300 $ 28,925,235 $ 0 15,275.9 $ 124.52 $ 158.51
AncillariesAmbulance 3,003 $ 312,968 $ 0 197.5 $ 104.22 $ 1.72Prosthetic/DME 540,343 2,620,467 - 35,532.7 4.85 14.36 Other Ancillaries 16,492 525,648 101,222 1,084.5 38.01 3.44
Subtotal 559,838 $ 3,459,083 $ 101,222 36,814.7 $ 6.36 $ 19.52
PhysicianSurgery - I/P and O/P 5,725 $ 978,431 $ 0 376.5 $ 170.90 $ 5.36Surgery - I/P and O/P - Anesthesia 3,668 424,445 - 241.2 115.72 2.33 Maternity - Non-Delivery 36 1,207 - 2.4 33.52 0.01 Hospital Visits 11,059 1,399,082 127 727.2 126.52 7.67 Office Visits 62,003 3,970,055 16,137 4,077.3 64.29 21.84 ER Visits 12,412 910,697 - 816.2 73.37 4.99 Immunizations 9,969 123,839 3,068 655.6 12.73 0.70 Radiology 13,954 353,228 51 917.6 25.32 1.94 Pathology 33,468 604,503 416 2,200.8 18.07 3.31 Mental Health/Substance Abuse 9,488 794,115 - 623.9 83.70 4.35 Other Professional 328,571 7,748,884 8,783 21,606.7 23.61 42.51
Subtotal 490,353 $ 17,308,485 $ 28,581 32,245.4 $ 35.36 $ 95.01
Total Claims/Benefit Cost 1,328,805 $ 75,945,008 $ 129,803 87,381.6 $ 57.25 $ 416.91
Category of Service
Milliman, Inc.Page 10 of 15

6/22/2016
Appendix 5
South Carolina Department of Health and Human ServicesSFY 2017 Medicaid Managed Care Capitation Rate Development
MCO Base Experience Data - Unadjusted SFY 2015
Rate Cell: SSI - Adults (SP3) Member Months: 595,525
Fiscal Year 2015
Number of Amount Sub Utilization Cost perUnits Paid Capitation Per 1,000 Service PMPM
Inpatient HospitalI/P Medical/Surgical/Non-Delivery Maternity 85,611 $ 168,929,439 $ 0 1,725.1 $ 1,973.22 $ 283.66I/P Well Newborn 6 12,988 - 0.1 2,164.58 0.02 Mental Health/Substance Abuse 13,733 9,133,214 - 276.7 665.06 15.34 Other Inpatient 2,900 4,489,724 - 58.4 1,548.18 7.54
Subtotal 102,250 $ 182,565,363 $ 0 2,060.4 $ 1,785.44 $ 306.56
Outpatient HospitalSurgery 15,639 $ 24,250,910 $ 0 315.1 $ 1,550.67 $ 40.72Non-Surg - Emergency Room 77,299 30,901,016 - 1,557.6 399.76 51.89 Non-Surg - Other 31,006 4,352,343 - 624.8 140.37 7.31 Observation Room 2,871 1,436,344 - 57.9 500.29 2.41 Treatment/Therapy/Testing 72,773 32,712,444 - 1,466.4 449.51 54.93 Other Outpatient 1,787 783,928 - 36.0 438.68 1.32
Subtotal 201,375 $ 94,436,983 $ 0 4,057.8 $ 468.96 $ 158.58
PharmacyPrescription Drugs 1,671,785 147,135,210 88 33,686.9 88.01 247.07
Subtotal 1,671,785 $ 147,135,210 $ 88 33,686.9 $ 88.01 $ 247.07
AncillariesAmbulance 56,421 $ 4,968,411 $ 0 1,136.9 $ 88.06 $ 8.34Prosthetic/DME 1,103,512 9,163,057 - 22,236.1 8.30 15.39 Other Ancillaries 50,662 4,058,787 15,441 1,020.9 80.42 6.84
Subtotal 1,210,595 $ 18,190,255 $ 15,441 24,393.8 $ 15.04 $ 30.57
PhysicianSurgery - I/P and O/P 66,628 $ 11,207,630 $ 0 1,342.6 $ 168.21 $ 18.82Surgery - I/P and O/P - Anesthesia 22,637 2,570,403 - 456.1 113.55 4.32 Maternity - Non-Delivery 671 26,120 - 13.5 38.93 0.04 Hospital Visits 143,146 10,279,598 287 2,884.4 71.81 17.26 Office Visits 292,715 17,428,532 48,661 5,898.3 59.71 29.35 ER Visits 98,052 8,647,200 353 1,975.8 88.19 14.52 Immunizations 15,512 227,798 1,211 312.6 14.76 0.38 Radiology 192,516 7,369,014 498 3,879.3 38.28 12.37 Pathology 538,262 7,255,306 3,007 10,846.1 13.48 12.19 Mental Health/Substance Abuse 31,656 1,916,773 - 637.9 60.55 3.22 Other Professional 2,430,765 24,813,214 2,297 48,980.6 10.21 41.67
Subtotal 3,832,560 $ 91,741,588 $ 56,314 77,227.2 $ 23.95 $ 154.14
Total Claims/Benefit Cost 7,018,565 $ 534,069,401 $ 71,842 141,426.1 $ 76.10 $ 896.92
Category of Service
Milliman, Inc.Page 11 of 15
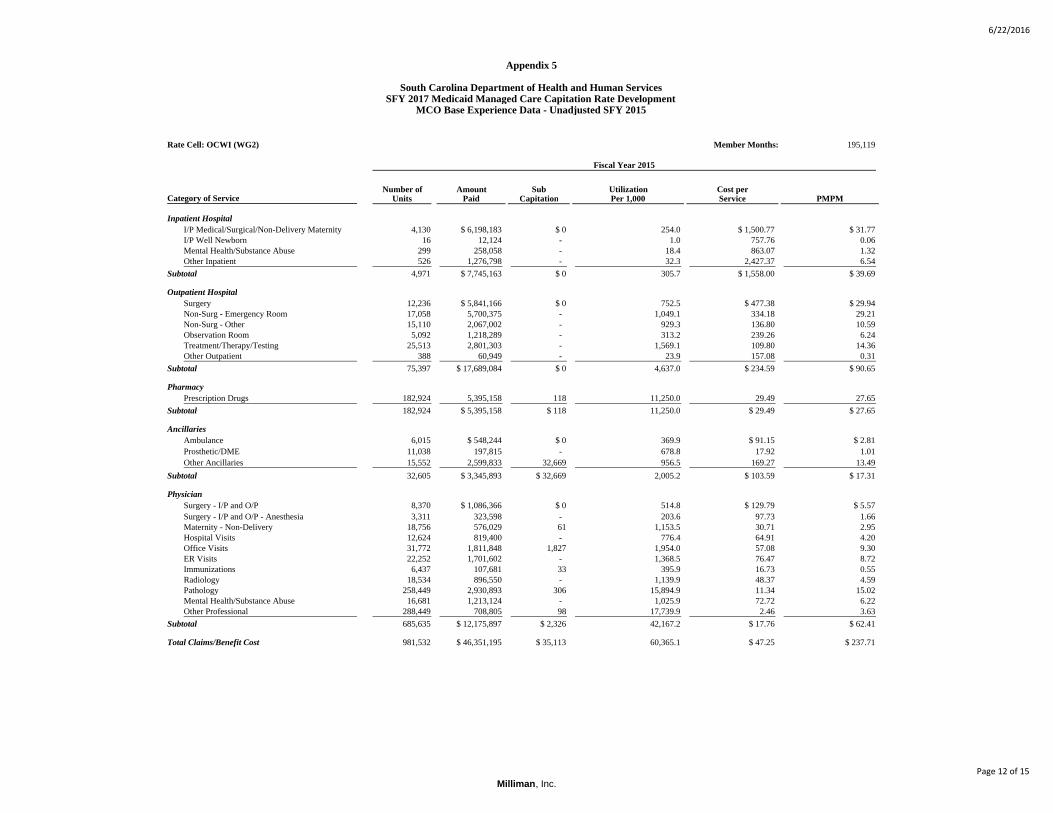
6/22/2016
Appendix 5
South Carolina Department of Health and Human ServicesSFY 2017 Medicaid Managed Care Capitation Rate Development
MCO Base Experience Data - Unadjusted SFY 2015
Rate Cell: OCWI (WG2) Member Months: 195,119
Fiscal Year 2015
Number of Amount Sub Utilization Cost perUnits Paid Capitation Per 1,000 Service PMPM
Inpatient HospitalI/P Medical/Surgical/Non-Delivery Maternity 4,130 $ 6,198,183 $ 0 254.0 $ 1,500.77 $ 31.77I/P Well Newborn 16 12,124 - 1.0 757.76 0.06 Mental Health/Substance Abuse 299 258,058 - 18.4 863.07 1.32 Other Inpatient 526 1,276,798 - 32.3 2,427.37 6.54
Subtotal 4,971 $ 7,745,163 $ 0 305.7 $ 1,558.00 $ 39.69
Outpatient HospitalSurgery 12,236 $ 5,841,166 $ 0 752.5 $ 477.38 $ 29.94Non-Surg - Emergency Room 17,058 5,700,375 - 1,049.1 334.18 29.21 Non-Surg - Other 15,110 2,067,002 - 929.3 136.80 10.59 Observation Room 5,092 1,218,289 - 313.2 239.26 6.24 Treatment/Therapy/Testing 25,513 2,801,303 - 1,569.1 109.80 14.36 Other Outpatient 388 60,949 - 23.9 157.08 0.31
Subtotal 75,397 $ 17,689,084 $ 0 4,637.0 $ 234.59 $ 90.65
PharmacyPrescription Drugs 182,924 5,395,158 118 11,250.0 29.49 27.65
Subtotal 182,924 $ 5,395,158 $ 118 11,250.0 $ 29.49 $ 27.65
AncillariesAmbulance 6,015 $ 548,244 $ 0 369.9 $ 91.15 $ 2.81Prosthetic/DME 11,038 197,815 - 678.8 17.92 1.01 Other Ancillaries 15,552 2,599,833 32,669 956.5 169.27 13.49
Subtotal 32,605 $ 3,345,893 $ 32,669 2,005.2 $ 103.59 $ 17.31
PhysicianSurgery - I/P and O/P 8,370 $ 1,086,366 $ 0 514.8 $ 129.79 $ 5.57Surgery - I/P and O/P - Anesthesia 3,311 323,598 - 203.6 97.73 1.66 Maternity - Non-Delivery 18,756 576,029 61 1,153.5 30.71 2.95 Hospital Visits 12,624 819,400 - 776.4 64.91 4.20 Office Visits 31,772 1,811,848 1,827 1,954.0 57.08 9.30 ER Visits 22,252 1,701,602 - 1,368.5 76.47 8.72 Immunizations 6,437 107,681 33 395.9 16.73 0.55 Radiology 18,534 896,550 - 1,139.9 48.37 4.59 Pathology 258,449 2,930,893 306 15,894.9 11.34 15.02 Mental Health/Substance Abuse 16,681 1,213,124 - 1,025.9 72.72 6.22 Other Professional 288,449 708,805 98 17,739.9 2.46 3.63
Subtotal 685,635 $ 12,175,897 $ 2,326 42,167.2 $ 17.76 $ 62.41
Total Claims/Benefit Cost 981,532 $ 46,351,195 $ 35,113 60,365.1 $ 47.25 $ 237.71
Category of Service
Milliman, Inc.Page 12 of 15

6/22/2016
Appendix 5
South Carolina Department of Health and Human ServicesSFY 2017 Medicaid Managed Care Capitation Rate Development
MCO Base Experience Data - Unadjusted SFY 2015
Rate Cell: DUAL Member Months: 572,430
Fiscal Year 2015
Number of Amount Sub Utilization Cost perUnits Paid Capitation Per 1,000 Service PMPM
Inpatient HospitalI/P Medical/Surgical/Non-Delivery Maternity 36,527 $ 9,247,819 $ 0 765.7 $ 253.18 $ 16.16I/P Well Newborn - - - - - - Mental Health/Substance Abuse 2,538 480,208 - 53.2 189.21 0.84 Inpatient Maternity Delivery 253 80,634 - 5.3 318.71 0.14 Other Inpatient 8,115 647,277 - 170.1 79.76 1.13
Subtotal 47,433 $ 10,455,937 $ 0 994.4 $ 220.47 $ 18.27
Outpatient HospitalSurgery 6,920 $ 1,065,599 $ 0 145.1 $ 153.99 $ 1.86Non-Surg - Emergency Room 45,384 2,670,235 - 951.4 58.84 4.66 Non-Surg - Other 20,346 554,829 - 426.5 27.27 0.97 Observation Room 1,418 69,909 - 29.7 49.30 0.12 Treatment/Therapy/Testing 22,686 1,608,955 - 475.6 70.92 2.81 Outpatient Maternity Delivery 3 74 - 0.1 24.58 - Other Outpatient 588 126,059 - 12.3 214.39 0.22
Subtotal 97,345 $ 6,095,659 $ 0 2,040.7 $ 62.57 $ 10.64
PharmacyPrescription Drugs 24,255 749,411 - 508.5 30.90 1.31
Subtotal 24,255 $ 749,411 $ 0 508.5 $ 30.90 $ 1.31
AncillariesAmbulance 1,681 $ 92,733 $ 0 35.2 $ 55.17 $ 0.16Prosthetic/DME 602,230 1,482,093 - 12,624.7 2.46 2.59 Other Ancillaries 51,503 1,276,750 - 1,079.7 24.79 2.23
Subtotal 655,414 $ 2,851,576 $ 0 13,739.6 $ 4.35 $ 4.98
PhysicianSurgery - I/P and O/P 22,607 $ 573,831 $ 0 473.9 $ 25.38 $ 1.00Surgery - I/P and O/P - Anesthesia 7,986 129,564 - 167.4 16.22 0.23 Maternity - Non-Delivery 110 404 - 2.3 3.67 - Hospital Visits 35,599 700,697 - 746.3 19.68 1.22 Office Visits 106,355 2,710,500 - 2,229.5 25.49 4.74 ER Visits 14,991 455,467 - 314.3 30.38 0.80 Immunizations 1,313 10,240 - 27.5 7.80 0.02 Radiology 38,802 742,422 - 813.4 19.13 1.30 Pathology 60,824 213,150 - 1,275.1 3.50 0.37 Mental Health/Substance Abuse 3,692 180,238 - 77.4 48.82 0.31 Maternity – Delivery 64 17,322 - 1.3 270.66 0.03 Maternity – Delivery - Anesthesia 76 3,350 - 1.6 44.08 0.01 Maternity - Delivery - Office Visits 490 9,258 - 10.3 18.89 0.02 Maternity - Delivery - Radiology 359 5,450 - 7.5 15.18 0.01 Other Professional 1,826,034 3,070,027 - 38,279.6 1.68 5.36
Subtotal 2,119,302 $ 8,821,919 $ 0 44,427.5 $ 4.16 $ 15.42
Total Claims/Benefit Cost 2,943,749 $ 28,974,503 $ 0 61,710.7 $ 9.84 $ 50.62
Category of Service
Milliman, Inc.Page 13 of 15

6/22/2016
Appendix 5
South Carolina Department of Health and Human ServicesSFY 2017 Medicaid Managed Care Capitation Rate Development
MCO Base Experience Data - Unadjusted SFY 2015
Rate Cell: Foster Care Children (FG3) Member Months: 43,992
Fiscal Year 2015
Number of Amount Sub Utilization Cost perUnits Paid Capitation Per 1,000 Service PMPM
Inpatient HospitalI/P Medical/Surgical/Non-Delivery Maternity 1,085 $ 1,632,025 $ 0 296.0 $ 1,504.17 $ 37.10I/P Well Newborn 176 77,289 - 48.0 439.14 1.76 Mental Health/Substance Abuse 1,141 678,506 - 311.2 594.66 15.42 Other Inpatient 69 140,298 - 18.8 2,033.30 3.19
Subtotal 2,471 $ 2,528,118 $ 0 674.0 $ 1,023.20 $ 57.47
Outpatient HospitalSurgery 332 $ 434,939 $ 0 90.6 $ 1,310.06 $ 9.89Non-Surg - Emergency Room 1,976 616,033 - 539.0 311.76 14.00 Non-Surg - Other 2,312 261,754 - 630.7 113.22 5.95 Observation Room 49 27,438 - 13.4 559.97 0.62 Treatment/Therapy/Testing 1,950 277,683 - 531.9 142.40 6.31 Other Outpatient 49 8,479 - 13.4 173.04 0.19
Subtotal 6,668 $ 1,626,326 $ 0 1,818.9 $ 243.84 $ 36.96
PharmacyPrescription Drugs 49,384 3,385,908 - 13,470.8 68.56 76.97
Subtotal 49,384 $ 3,385,908 $ 0 13,470.8 $ 68.56 $ 76.97
AncillariesAmbulance 809 $ 76,030 $ 0 220.7 $ 93.98 $ 1.73Prosthetic/DME 33,468 136,217 - 9,129.3 4.07 3.10 Other Ancillaries 2,326 89,484 3,436 634.5 39.95 2.11
Subtotal 36,603 $ 301,731 $ 3,436 9,984.5 $ 8.34 $ 6.94
PhysicianSurgery - I/P and O/P 1,224 $ 184,419 $ 151 333.9 $ 150.79 $ 4.20Surgery - I/P and O/P - Anesthesia 573 59,858 - 156.3 104.46 1.36 Maternity - Non-Delivery 18 444 - 4.9 24.68 0.01 Hospital Visits 3,866 416,638 - 1,054.6 107.77 9.47 Office Visits 16,204 1,035,840 5,591 4,420.1 64.27 23.67 ER Visits 2,250 164,236 - 613.7 72.99 3.73 Immunizations 6,290 76,814 715 1,715.8 12.33 1.76 Radiology 2,567 57,584 - 700.2 22.43 1.31 Pathology 10,125 151,811 300 2,761.9 15.02 3.46 Mental Health/Substance Abuse 16,495 1,478,226 - 4,499.5 89.62 33.60 Other Professional 72,637 1,392,712 652 19,813.7 19.18 31.67
Subtotal 132,249 $ 5,018,580 $ 7,410 36,074.5 $ 38.00 $ 114.24
Total Claims/Benefit Cost 227,375 $ 12,860,663 $ 10,845 62,022.7 $ 56.61 $ 292.58
Category of Service
Milliman, Inc.Page 14 of 15
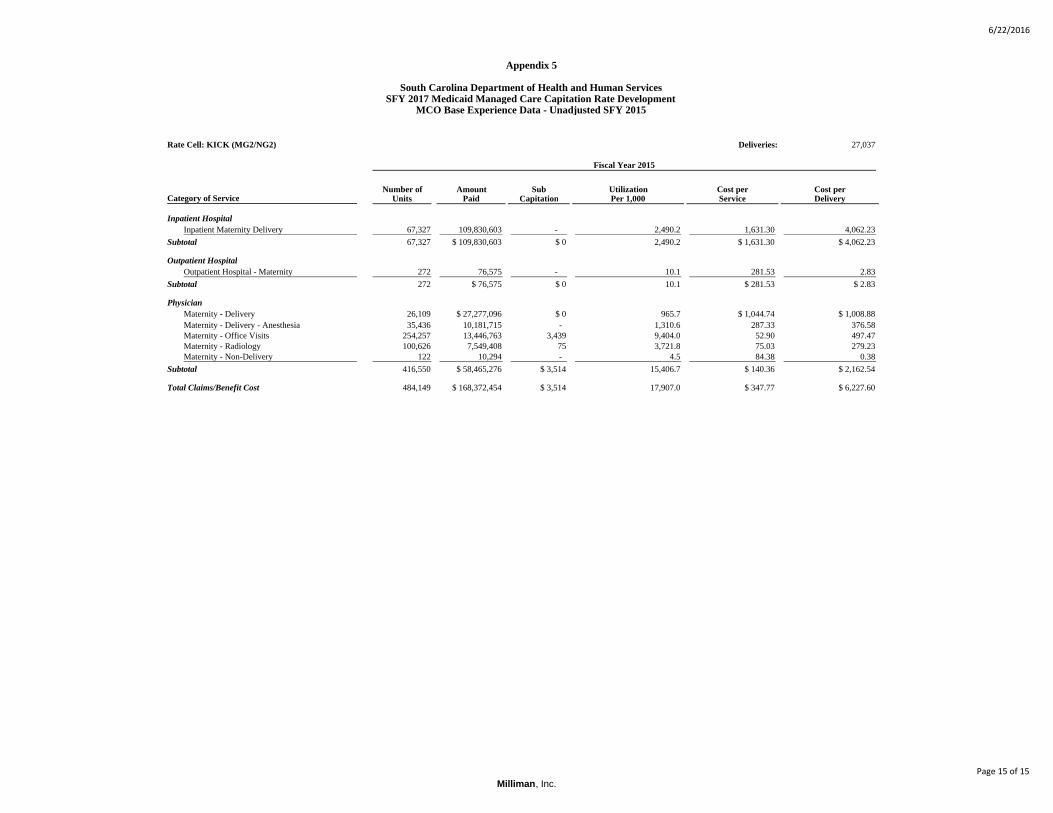
6/22/2016
Appendix 5
South Carolina Department of Health and Human ServicesSFY 2017 Medicaid Managed Care Capitation Rate Development
MCO Base Experience Data - Unadjusted SFY 2015
Rate Cell: KICK (MG2/NG2) Deliveries: 27,037
Fiscal Year 2015
Number of Amount Sub Utilization Cost per Cost perUnits Paid Capitation Per 1,000 Service Delivery
Inpatient HospitalInpatient Maternity Delivery 67,327 109,830,603 - 2,490.2 1,631.30 4,062.23
Subtotal 67,327 $ 109,830,603 $ 0 2,490.2 $ 1,631.30 $ 4,062.23
Outpatient HospitalOutpatient Hospital - Maternity 272 76,575 - 10.1 281.53 2.83
Subtotal 272 $ 76,575 $ 0 10.1 $ 281.53 $ 2.83
PhysicianMaternity - Delivery 26,109 $ 27,277,096 $ 0 965.7 $ 1,044.74 $ 1,008.88Maternity - Delivery - Anesthesia 35,436 10,181,715 - 1,310.6 287.33 376.58 Maternity - Office Visits 254,257 13,446,763 3,439 9,404.0 52.90 497.47 Maternity - Radiology 100,626 7,549,408 75 3,721.8 75.03 279.23 Maternity - Non-Delivery 122 10,294 - 4.5 84.38 0.38
Subtotal 416,550 $ 58,465,276 $ 3,514 15,406.7 $ 140.36 $ 2,162.54
Total Claims/Benefit Cost 484,149 $ 168,372,454 $ 3,514 17,907.0 $ 347.77 $ 6,227.60
Category of Service
Milliman, Inc.Page 15 of 15
Milliman Client Report
State Fiscal Year 2017 Rate Certification
SCM01-64
June 22, 2016
APPENDIX 6: ADJUSTED SFY 2015 BASE DATA

6/22/2016
Appendix 6
South Carolina Department of Health and Human ServicesSFY 2017 Medicaid Managed Care Capitation Rate Development
MCO Base Experience Data Adjustments - SFY 2015
Rate Cell: TANF - 0 - 2 Months, Male & Female (AH3) SFY 2015 Member Months: 90,616
SFY 2015 Unadjusted Data 2015 Adjustments SFY 2015 Adjusted Data
Utilization Cost per Completion Program Program Mgd Care Mgd Care Other Base Other Base Utilization Cost perPer 1,000 Service PMPM Adj Util Adj Util Adj Cost Adj Util Adj Cost Adj Util Adj Cost Per 1,000 Service PMPM
Inpatient HospitalI/P Medical/Surgical/Non-Delivery Maternity 7,349.4 $ 1,511.38 $ 925.65 1.0256 1.0000 1.0000 0.9990 1.0000 1.0688 1.0029 8,048.1 $ 1,515.77 $ 1,016.59I/P Well Newborn 6,700.8 553.95 309.33 1.0256 1.0000 1.0000 0.9990 1.0000 1.0708 1.0029 7,351.5 555.56 340.35 Mental Health/Substance Abuse 10.3 446.12 0.38 1.0256 1.0000 1.0000 0.9990 1.0000 1.0072 1.0029 10.7 442.74 0.39 Other Inpatient 210.3 1,183.40 20.74 1.0256 1.0000 1.0000 0.9990 1.0000 1.0072 1.0029 217.0 1,186.92 21.46
Subtotal 14,270.9 $ 1,056.22 $ 1,256.10 15,627.3 $ 1,058.76 $ 1,378.80
Outpatient HospitalSurgery 54.2 $ 1,017.97 $ 4.59 1.0048 1.0000 1.0000 1.0000 1.0000 1.0224 1.0029 55.6 $ 1,019.89 $ 4.73Non-Surg - Emergency Room 766.1 274.51 17.52 1.0048 1.0000 1.0000 0.9696 1.0115 1.0783 1.0029 804.8 278.39 18.67 Non-Surg - Other 1,412.6 105.31 12.40 1.0048 1.0000 1.0000 1.0000 1.0000 1.0679 1.0029 1,515.8 105.64 13.34 Observation Room 43.4 568.93 2.06 1.0048 1.0000 1.0000 1.0000 1.0000 1.0425 1.0029 45.5 570.76 2.16 Treatment/Therapy/Testing 852.7 65.47 4.65 1.0048 1.0000 1.0000 1.0000 1.0000 1.0459 1.0029 896.1 65.63 4.90 Other Outpatient 4.0 83.89 0.03 1.0048 1.0000 1.0000 1.0000 1.0000 14.7441 1.0029 58.9 90.88 0.45
Subtotal 3,133.0 $ 158.00 $ 41.25 3,376.7 $ 157.27 $ 44.26
PharmacyPrescription Drugs 2,958.7 23.78 5.86 1.0001 1.0000 1.0000 1.0000 0.9974 1.0539 0.9761 3,118.5 23.14 6.01
Subtotal 2,958.7 $ 23.78 $ 5.86 3,118.5 $ 23.14 $ 6.01
AncillariesAmbulance 184.1 $ 235.48 $ 3.61 1.0058 1.0000 1.0000 1.0000 1.0000 1.0577 1.0029 195.8 $ 236.02 $ 3.85Prosthetic/DME 1,462.1 25.22 3.07 1.0058 1.0000 1.0000 1.0000 1.0000 1.0370 1.0029 1,525.0 25.27 3.21 Other Ancillaries 691.7 82.77 4.77 1.0058 1.0000 1.0000 1.0000 1.0000 1.2597 1.0029 876.3 83.00 6.06
Subtotal 2,337.9 $ 58.77 $ 11.45 2,597.2 $ 60.64 $ 13.12
PhysicianSurgery - I/P and O/P 595.9 $ 169.31 $ 8.41 1.0051 1.0000 1.0000 1.0000 1.0000 1.0737 1.0029 643.1 $ 169.84 $ 9.10Surgery - I/P and O/P - Anesthesia 115.3 157.21 1.51 1.0051 1.0000 1.0000 1.0000 1.0000 1.0449 1.0029 121.1 157.55 1.59 Maternity - Non-Delivery - - - 1.0051 1.0000 1.0000 1.0000 1.0000 1.0038 1.0029 - - - Hospital Visits 11,890.0 171.28 169.71 1.0051 1.0000 1.0000 1.0000 1.0000 1.0403 1.0029 12,432.2 171.78 177.96 Office Visits 6,699.9 61.58 34.38 1.0051 1.0000 1.0000 1.0033 1.0000 1.0704 1.0029 7,231.9 61.76 37.22 ER Visits 947.2 68.28 5.39 1.0051 1.0000 1.0000 0.9696 1.0115 1.0618 1.0029 980.2 69.27 5.66 Immunizations 7,167.5 12.14 7.25 1.0051 1.0000 1.0000 1.0000 1.0000 1.0423 1.0029 7,508.8 12.17 7.62 Radiology 2,153.8 13.07 2.35 1.0051 1.0000 1.0000 1.0000 1.0000 1.0424 1.0029 2,256.6 13.13 2.47 Pathology 1,558.8 9.50 1.23 1.0051 1.0000 1.0000 1.0000 1.0000 1.0584 1.0029 1,658.2 9.50 1.31 Mental Health/Substance Abuse - - - 1.0051 1.0000 1.0000 1.0000 1.0000 1.0038 1.0029 - - - Other Professional 15,414.5 51.32 65.92 1.0051 1.0000 1.0000 1.0000 1.0000 1.0666 1.0029 16,525.0 51.47 70.87
Subtotal 46,542.9 $ 76.36 $ 296.15 49,357.1 $ 76.29 $ 313.81
Total Claims/Benefit Cost 69,243.4 $ 279.16 $ 1,610.81 74,076.7 $ 284.46 $ 1,756.00
Category of Service
Milliman, Inc.Page 1 of 15

6/22/2016
Appendix 6
South Carolina Department of Health and Human ServicesSFY 2017 Medicaid Managed Care Capitation Rate Development
MCO Base Experience Data Adjustments - SFY 2015Rate Cell: TANF - 3 - 12 Months, Male & Female (AI3) SFY 2015 Member Months: 331,284
SFY 2015 Unadjusted Data 2015 Adjustments SFY 2015 Adjusted Data
Utilization Cost per Completion Program Program Mgd Care Mgd Care Other Base Other Base Utilization Cost perPer 1,000 Service PMPM Adj Util Adj Util Adj Cost Adj Util Adj Cost Adj Util Adj Cost Per 1,000 Service PMPM
Inpatient HospitalI/P Medical/Surgical/Non-Delivery Maternity 179.4 $ 1,846.42 $ 27.61 1.0256 1.0000 1.0000 0.9840 1.0043 1.0072 1.0029 182.4 $ 1,859.65 $ 28.27I/P Well Newborn 0.8 337.71 0.02 1.0256 1.0000 1.0000 0.9840 1.0043 1.0072 1.0029 0.8 303.34 0.02 Mental Health/Substance Abuse - - - 1.0256 1.0000 1.0000 0.9840 1.0043 1.0072 1.0029 - - - Other Inpatient 6.2 2,017.38 1.04 1.0256 1.0000 1.0000 0.9840 1.0043 1.0072 1.0029 6.3 2,029.36 1.06
Subtotal 186.4 $ 1,845.71 $ 28.67 189.5 $ 1,858.64 $ 29.35
Outpatient HospitalSurgery 81.9 $ 1,592.65 $ 10.87 1.0048 1.0000 1.0000 1.0000 1.0000 1.0020 1.0029 82.5 $ 1,597.30 $ 10.98Non-Surg - Emergency Room 1,063.8 292.75 25.95 1.0048 1.0000 1.0000 0.9571 1.0160 1.0020 1.0029 1,025.1 298.27 25.48 Non-Surg - Other 771.8 119.91 7.71 1.0048 1.0000 1.0000 1.0000 1.0000 1.0020 1.0029 777.1 120.22 7.79 Observation Room 23.3 606.60 1.18 1.0048 1.0000 1.0000 1.0000 1.0000 1.0020 1.0029 23.4 610.67 1.19 Treatment/Therapy/Testing 320.6 126.91 3.39 1.0048 1.0000 1.0000 1.0000 1.0000 1.0020 1.0029 322.8 127.24 3.42 Other Outpatient 3.2 165.39 0.04 1.0048 1.0000 1.0000 1.0000 1.0000 1.0020 1.0029 3.2 151.02 0.04
Subtotal 2,264.6 $ 260.39 $ 49.14 2,234.1 $ 262.63 $ 48.90
PharmacyPrescription Drugs 5,884.5 35.45 17.38 1.0001 1.0000 1.0000 1.0000 0.9960 1.0000 0.9761 5,885.1 34.46 16.90
Subtotal 5,884.5 $ 35.45 $ 17.38 5,885.1 $ 34.46 $ 16.90
AncillariesAmbulance 90.9 $ 117.44 $ 0.89 1.0058 1.0000 1.0000 1.0000 1.0000 1.0038 1.0029 91.8 $ 117.81 $ 0.90Prosthetic/DME 1,865.7 18.71 2.91 1.0058 1.0000 1.0000 1.0000 1.0000 1.0038 1.0029 1,883.6 18.77 2.95 Other Ancillaries 391.5 58.21 1.90 1.0058 1.0000 1.0000 1.0000 1.0000 1.0038 1.0029 395.2 58.41 1.92
Subtotal 2,348.1 $ 29.13 $ 5.70 2,370.7 $ 29.21 $ 5.77
PhysicianSurgery - I/P and O/P 294.6 $ 170.45 $ 4.19 1.0051 1.0000 1.0000 1.0000 1.0000 1.0038 1.0029 297.3 $ 171.15 $ 4.24Surgery - I/P and O/P - Anesthesia 145.4 100.41 1.22 1.0051 1.0000 1.0000 1.0000 1.0000 1.0038 1.0029 146.7 100.96 1.23 Maternity - Non-Delivery - - - 1.0051 1.0000 1.0000 1.0000 1.0000 1.0038 1.0029 - - - Hospital Visits 520.1 188.24 8.16 1.0051 1.0000 1.0000 1.0000 1.0000 1.0038 1.0029 524.8 188.81 8.26 Office Visits 4,644.4 61.75 23.90 1.0051 1.0000 1.0000 1.0093 1.0000 1.0038 1.0029 4,729.4 61.93 24.41 ER Visits 1,144.4 63.33 6.04 1.0051 1.0000 1.0000 0.9571 1.0160 1.0038 1.0029 1,105.1 64.54 5.94 Immunizations 7,619.3 12.47 7.92 1.0051 1.0000 1.0000 1.0000 1.0000 1.0038 1.0029 7,687.2 12.51 8.01 Radiology 634.5 15.08 0.80 1.0051 1.0000 1.0000 1.0000 1.0000 1.0038 1.0029 640.2 15.17 0.81 Pathology 2,063.2 12.24 2.10 1.0051 1.0000 1.0000 1.0000 1.0000 1.0038 1.0029 2,081.6 12.25 2.12 Mental Health/Substance Abuse 0.6 101.52 0.01 1.0051 1.0000 1.0000 1.0000 1.0000 1.0038 1.0029 0.6 195.44 0.01 Other Professional 6,180.9 48.58 25.02 1.0051 1.0000 1.0000 1.0000 1.0000 1.0038 1.0029 6,236.0 48.72 25.32
Subtotal 23,247.5 $ 40.96 $ 79.36 23,448.9 $ 41.12 $ 80.36
Total Claims/Benefit Cost 33,931.1 $ 63.75 $ 180.25 34,128.3 $ 63.74 $ 181.27
Category of Service
Milliman, Inc.Page 2 of 15

6/22/2016
Appendix 6
South Carolina Department of Health and Human ServicesSFY 2017 Medicaid Managed Care Capitation Rate Development
MCO Base Experience Data Adjustments - SFY 2015Rate Cell: TANF - Age 1 - 6, Male & Female (AB3) SFY 2015 Member Months: 2,335,515
SFY 2015 Unadjusted Data 2015 Adjustments SFY 2015 Adjusted Data
Utilization Cost per Completion Program Program Mgd Care Mgd Care Other Base Other Base Utilization Cost perPer 1,000 Service PMPM Adj Util Adj Util Adj Cost Adj Util Adj Cost Adj Util Adj Cost Per 1,000 Service PMPM
Inpatient HospitalI/P Medical/Surgical/Non-Delivery Maternity 45.7 $ 1,818.82 $ 6.92 1.0256 1.0000 1.0000 0.9669 1.0051 1.0242 1.0005 46.4 $ 1,827.95 $ 7.07I/P Well Newborn - - - 1.0256 1.0000 1.0000 0.9669 1.0051 1.0343 1.0029 - - - Mental Health/Substance Abuse 0.4 1,103.09 0.04 1.0256 1.0000 1.0000 0.9669 1.0051 1.0343 1.0029 0.4 1,134.57 0.04 Other Inpatient 1.4 1,960.89 0.23 1.0256 1.0000 1.0000 0.9669 1.0051 1.0343 1.0029 1.4 2,005.46 0.24
Subtotal 47.5 $ 1,816.42 $ 7.19 48.3 $ 1,826.90 $ 7.35
Outpatient HospitalSurgery 66.3 $ 1,331.51 $ 7.36 1.0048 1.0000 1.0000 1.0000 1.0000 1.0290 1.0029 68.6 $ 1,335.44 $ 7.63Non-Surg - Emergency Room 589.0 301.28 14.79 1.0048 1.0000 1.0000 0.9572 1.0149 1.0290 1.0029 582.9 306.70 14.90 Non-Surg - Other 281.8 113.19 2.66 1.0048 1.0000 1.0000 1.0000 1.0000 1.0290 1.0029 291.4 113.59 2.76 Observation Room 7.3 722.79 0.44 1.0048 1.0000 1.0000 1.0000 1.0000 1.0290 1.0029 7.5 728.86 0.46 Treatment/Therapy/Testing 201.8 153.88 2.59 1.0048 1.0000 1.0000 1.0000 1.0000 1.0290 1.0029 208.6 154.48 2.69 Other Outpatient 4.9 267.15 0.11 1.0048 1.0000 1.0000 1.0000 1.0000 1.0290 1.0029 5.1 270.93 0.11
Subtotal 1,151.1 $ 291.37 $ 27.95 1,164.1 $ 294.26 $ 28.54
PharmacyPrescription Drugs 4,996.9 41.53 17.29 1.0001 1.0000 1.0000 1.0000 0.9940 1.0269 0.9761 5,131.8 40.29 17.23
Subtotal 4,996.9 $ 41.53 $ 17.29 5,131.8 $ 40.29 $ 17.23
AncillariesAmbulance 47.8 $ 103.99 $ 0.41 1.0058 1.0000 1.0000 1.0000 1.0000 1.0308 1.0029 49.6 $ 103.13 $ 0.43Prosthetic/DME 768.6 13.34 0.85 1.0058 1.0000 1.0000 1.0000 1.0000 1.0308 1.0029 796.9 13.31 0.88 Other Ancillaries 319.7 47.77 1.27 1.0058 1.0000 1.0000 1.0000 1.0000 1.0308 1.0029 331.4 47.81 1.32
Subtotal 1,136.2 $ 26.72 $ 2.53 1,178.0 $ 26.80 $ 2.63
PhysicianSurgery - I/P and O/P 211.8 $ 137.45 $ 2.43 1.0051 1.0000 1.0000 1.0000 1.0000 1.0308 1.0029 219.4 $ 138.08 $ 2.52Surgery - I/P and O/P - Anesthesia 119.0 91.66 0.91 1.0051 1.0000 1.0000 1.0000 1.0000 1.0308 1.0029 123.3 92.01 0.95 Maternity - Non-Delivery 0.0 31.57 - 1.0051 1.0000 1.0000 1.0000 1.0000 1.0308 1.0029 0.0 - - Hospital Visits 65.6 111.42 0.61 1.0051 1.0000 1.0000 1.0000 1.0000 1.0308 1.0029 67.9 111.95 0.63 Office Visits 2,844.8 61.12 14.49 1.0051 1.0000 1.0000 1.0084 1.0000 1.0308 1.0029 2,972.1 61.30 15.18 ER Visits 631.3 61.52 3.24 1.0051 1.0000 1.0000 0.9572 1.0149 1.0308 1.0029 626.1 62.68 3.27 Immunizations 1,253.1 12.57 1.31 1.0051 1.0000 1.0000 1.0000 1.0000 1.0308 1.0029 1,298.2 12.58 1.36 Radiology 337.6 16.26 0.46 1.0051 1.0000 1.0000 1.0000 1.0000 1.0308 1.0029 349.8 16.40 0.48 Pathology 1,740.3 11.41 1.65 1.0051 1.0000 1.0000 1.0000 1.0000 1.0308 1.0029 1,803.1 11.41 1.71 Mental Health/Substance Abuse 98.7 102.41 0.84 1.0051 1.0000 1.0000 1.0000 1.0000 1.0308 1.0029 102.3 102.43 0.87 Other Professional 5,640.5 27.44 12.90 1.0051 1.0000 1.0000 1.0000 1.0000 1.0308 1.0029 5,843.8 27.52 13.40
Subtotal 12,942.7 $ 36.01 $ 38.84 13,406.1 $ 36.15 $ 40.39
Total Claims/Benefit Cost 20,274.4 $ 55.52 $ 93.80 20,928.2 $ 55.12 $ 96.14
Category of Service
Milliman, Inc.Page 3 of 15

6/22/2016
Appendix 6
South Carolina Department of Health and Human ServicesSFY 2017 Medicaid Managed Care Capitation Rate Development
MCO Base Experience Data Adjustments - SFY 2015Rate Cell: TANF - Age 7 - 13, Male & Female (AC3) SFY 2015 Member Months: 2,421,425
SFY 2015 Unadjusted Data 2015 Adjustments SFY 2015 Adjusted Data
Utilization Cost per Completion Program Program Mgd Care Mgd Care Other Base Other Base Utilization Cost perPer 1,000 Service PMPM Adj Util Adj Util Adj Cost Adj Util Adj Cost Adj Util Adj Cost Per 1,000 Service PMPM
Inpatient HospitalI/P Medical/Surgical/Non-Delivery Maternity 30.6 $ 2,238.84 $ 5.70 1.0256 1.0000 1.0000 0.9721 1.0004 1.0218 0.9738 31.1 $ 2,180.30 $ 5.66I/P Well Newborn - - - 1.0256 1.0000 1.0000 0.9721 1.0004 1.0343 1.0029 - - - Mental Health/Substance Abuse 13.2 770.22 0.85 1.0256 1.0000 1.0000 0.9721 1.0004 1.0343 1.0029 13.6 774.86 0.88 Other Inpatient 0.9 1,664.34 0.12 1.0256 1.0000 1.0000 0.9721 1.0004 1.0343 1.0029 0.9 1,656.42 0.12
Subtotal 44.6 $ 1,794.62 $ 6.67 45.7 $ 1,750.71 $ 6.66
Outpatient HospitalSurgery 39.1 $ 1,332.53 $ 4.35 1.0048 1.0000 1.0000 1.0000 1.0000 1.0290 1.0029 40.5 $ 1,337.52 $ 4.51Non-Surg - Emergency Room 348.7 306.70 8.91 1.0048 1.0000 1.0000 0.9630 1.0129 1.0290 1.0029 347.2 311.49 9.01 Non-Surg - Other 183.0 113.76 1.73 1.0048 1.0000 1.0000 1.0000 1.0000 1.0290 1.0029 189.2 113.77 1.79 Observation Room 4.9 591.56 0.24 1.0048 1.0000 1.0000 1.0000 1.0000 1.0290 1.0029 5.1 587.53 0.25 Treatment/Therapy/Testing 168.3 179.08 2.51 1.0048 1.0000 1.0000 1.0000 1.0000 1.0290 1.0029 174.0 179.53 2.60 Other Outpatient 2.0 317.76 0.05 1.0048 1.0000 1.0000 1.0000 1.0000 1.0290 1.0029 2.1 302.80 0.05
Subtotal 746.0 $ 286.17 $ 17.79 758.0 $ 288.46 $ 18.22
PharmacyPrescription Drugs 5,822.0 72.21 35.03 1.0001 1.0000 1.0000 1.0000 0.9872 1.0269 0.9761 5,979.2 69.57 34.67
Subtotal 5,822.0 $ 72.21 $ 35.03 5,979.2 $ 69.57 $ 34.67
AncillariesAmbulance 33.5 $ 102.31 $ 0.29 1.0058 1.0000 1.0000 1.0000 1.0000 1.0308 1.0029 34.7 $ 104.19 $ 0.30Prosthetic/DME 1,200.4 8.50 0.85 1.0058 1.0000 1.0000 1.0000 1.0000 1.0308 1.0029 1,244.6 8.52 0.88 Other Ancillaries 720.9 31.29 1.88 1.0058 1.0000 1.0000 1.0000 1.0000 1.0308 1.0029 747.5 31.38 1.95
Subtotal 1,954.8 $ 18.54 $ 3.02 2,026.7 $ 18.59 $ 3.14
PhysicianSurgery - I/P and O/P 162.1 $ 132.98 $ 1.80 1.0051 1.0000 1.0000 1.0000 1.0000 1.0308 1.0029 167.9 $ 133.64 $ 1.87Surgery - I/P and O/P - Anesthesia 51.0 98.67 0.42 1.0051 1.0000 1.0000 1.0000 1.0000 1.0308 1.0029 52.9 99.03 0.44 Maternity - Non-Delivery - - - 1.0051 1.0000 1.0000 1.0000 1.0000 1.0308 1.0029 - - - Hospital Visits 57.6 87.06 0.42 1.0051 1.0000 1.0000 1.0000 1.0000 1.0308 1.0029 59.7 87.78 0.44 Office Visits 2,258.5 60.10 11.31 1.0051 1.0000 1.0000 1.0054 1.0000 1.0308 1.0029 2,352.6 60.27 11.82 ER Visits 373.8 63.10 1.97 1.0051 1.0000 1.0000 0.9630 1.0129 1.0308 1.0029 372.9 64.24 2.00 Immunizations 547.1 12.72 0.58 1.0051 1.0000 1.0000 1.0000 1.0000 1.0308 1.0029 566.9 12.76 0.60 Radiology 395.0 20.14 0.66 1.0051 1.0000 1.0000 1.0000 1.0000 1.0308 1.0029 409.2 20.11 0.69 Pathology 1,495.2 10.35 1.29 1.0051 1.0000 1.0000 1.0000 1.0000 1.0308 1.0029 1,549.1 10.38 1.34 Mental Health/Substance Abuse 282.4 98.11 2.31 1.0051 1.0000 1.0000 1.0000 1.0000 1.0308 1.0029 292.6 98.44 2.40 Other Professional 4,097.5 20.63 7.04 1.0051 1.0000 1.0000 1.0000 1.0000 1.0308 1.0029 4,245.3 20.68 7.31
Subtotal 9,720.2 $ 34.32 $ 27.80 10,069.0 $ 34.44 $ 28.90
Total Claims/Benefit Cost 18,287.6 $ 59.26 $ 90.31 18,878.6 $ 58.22 $ 91.59
Category of Service
Milliman, Inc.Page 4 of 15
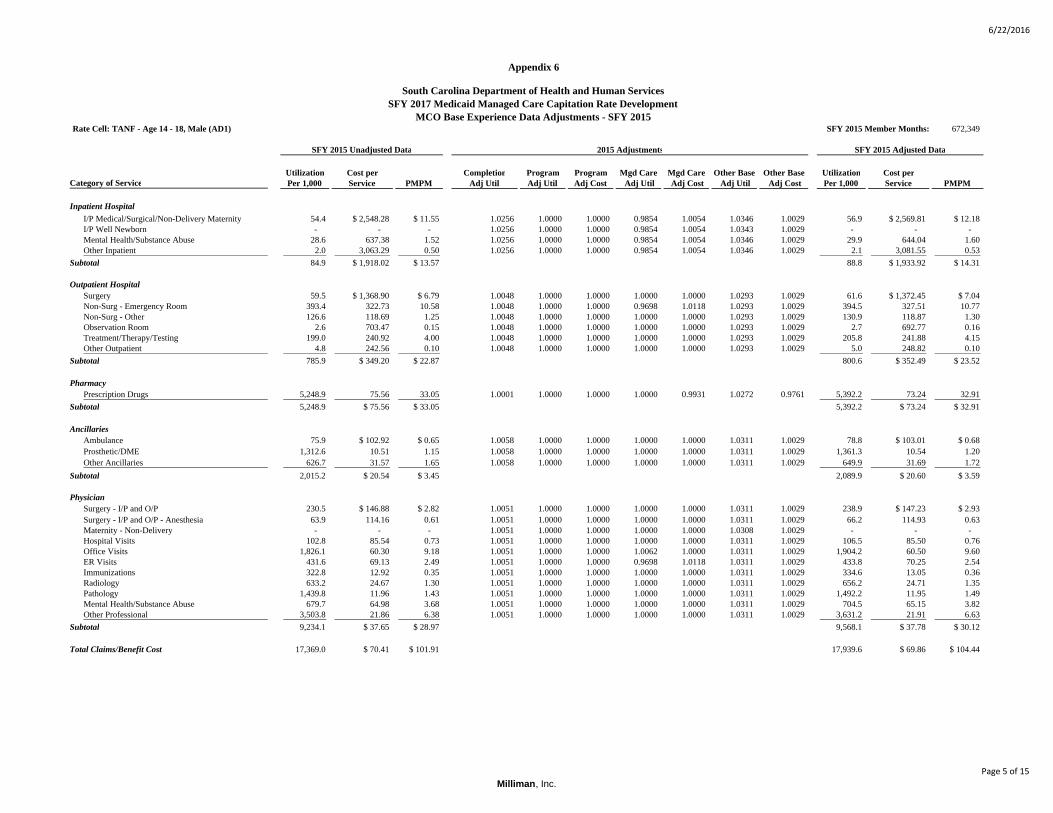
6/22/2016
Appendix 6
South Carolina Department of Health and Human ServicesSFY 2017 Medicaid Managed Care Capitation Rate Development
MCO Base Experience Data Adjustments - SFY 2015Rate Cell: TANF - Age 14 - 18, Male (AD1) SFY 2015 Member Months: 672,349
SFY 2015 Unadjusted Data 2015 Adjustments SFY 2015 Adjusted Data
Utilization Cost per Completion Program Program Mgd Care Mgd Care Other Base Other Base Utilization Cost perPer 1,000 Service PMPM Adj Util Adj Util Adj Cost Adj Util Adj Cost Adj Util Adj Cost Per 1,000 Service PMPM
Inpatient HospitalI/P Medical/Surgical/Non-Delivery Maternity 54.4 $ 2,548.28 $ 11.55 1.0256 1.0000 1.0000 0.9854 1.0054 1.0346 1.0029 56.9 $ 2,569.81 $ 12.18I/P Well Newborn - - - 1.0256 1.0000 1.0000 0.9854 1.0054 1.0343 1.0029 - - - Mental Health/Substance Abuse 28.6 637.38 1.52 1.0256 1.0000 1.0000 0.9854 1.0054 1.0346 1.0029 29.9 644.04 1.60 Other Inpatient 2.0 3,063.29 0.50 1.0256 1.0000 1.0000 0.9854 1.0054 1.0346 1.0029 2.1 3,081.55 0.53
Subtotal 84.9 $ 1,918.02 $ 13.57 88.8 $ 1,933.92 $ 14.31
Outpatient HospitalSurgery 59.5 $ 1,368.90 $ 6.79 1.0048 1.0000 1.0000 1.0000 1.0000 1.0293 1.0029 61.6 $ 1,372.45 $ 7.04Non-Surg - Emergency Room 393.4 322.73 10.58 1.0048 1.0000 1.0000 0.9698 1.0118 1.0293 1.0029 394.5 327.51 10.77 Non-Surg - Other 126.6 118.69 1.25 1.0048 1.0000 1.0000 1.0000 1.0000 1.0293 1.0029 130.9 118.87 1.30 Observation Room 2.6 703.47 0.15 1.0048 1.0000 1.0000 1.0000 1.0000 1.0293 1.0029 2.7 692.77 0.16 Treatment/Therapy/Testing 199.0 240.92 4.00 1.0048 1.0000 1.0000 1.0000 1.0000 1.0293 1.0029 205.8 241.88 4.15 Other Outpatient 4.8 242.56 0.10 1.0048 1.0000 1.0000 1.0000 1.0000 1.0293 1.0029 5.0 248.82 0.10
Subtotal 785.9 $ 349.20 $ 22.87 800.6 $ 352.49 $ 23.52
PharmacyPrescription Drugs 5,248.9 75.56 33.05 1.0001 1.0000 1.0000 1.0000 0.9931 1.0272 0.9761 5,392.2 73.24 32.91
Subtotal 5,248.9 $ 75.56 $ 33.05 5,392.2 $ 73.24 $ 32.91
AncillariesAmbulance 75.9 $ 102.92 $ 0.65 1.0058 1.0000 1.0000 1.0000 1.0000 1.0311 1.0029 78.8 $ 103.01 $ 0.68Prosthetic/DME 1,312.6 10.51 1.15 1.0058 1.0000 1.0000 1.0000 1.0000 1.0311 1.0029 1,361.3 10.54 1.20 Other Ancillaries 626.7 31.57 1.65 1.0058 1.0000 1.0000 1.0000 1.0000 1.0311 1.0029 649.9 31.69 1.72
Subtotal 2,015.2 $ 20.54 $ 3.45 2,089.9 $ 20.60 $ 3.59
PhysicianSurgery - I/P and O/P 230.5 $ 146.88 $ 2.82 1.0051 1.0000 1.0000 1.0000 1.0000 1.0311 1.0029 238.9 $ 147.23 $ 2.93Surgery - I/P and O/P - Anesthesia 63.9 114.16 0.61 1.0051 1.0000 1.0000 1.0000 1.0000 1.0311 1.0029 66.2 114.93 0.63 Maternity - Non-Delivery - - - 1.0051 1.0000 1.0000 1.0000 1.0000 1.0308 1.0029 - - - Hospital Visits 102.8 85.54 0.73 1.0051 1.0000 1.0000 1.0000 1.0000 1.0311 1.0029 106.5 85.50 0.76 Office Visits 1,826.1 60.30 9.18 1.0051 1.0000 1.0000 1.0062 1.0000 1.0311 1.0029 1,904.2 60.50 9.60 ER Visits 431.6 69.13 2.49 1.0051 1.0000 1.0000 0.9698 1.0118 1.0311 1.0029 433.8 70.25 2.54 Immunizations 322.8 12.92 0.35 1.0051 1.0000 1.0000 1.0000 1.0000 1.0311 1.0029 334.6 13.05 0.36 Radiology 633.2 24.67 1.30 1.0051 1.0000 1.0000 1.0000 1.0000 1.0311 1.0029 656.2 24.71 1.35 Pathology 1,439.8 11.96 1.43 1.0051 1.0000 1.0000 1.0000 1.0000 1.0311 1.0029 1,492.2 11.95 1.49 Mental Health/Substance Abuse 679.7 64.98 3.68 1.0051 1.0000 1.0000 1.0000 1.0000 1.0311 1.0029 704.5 65.15 3.82 Other Professional 3,503.8 21.86 6.38 1.0051 1.0000 1.0000 1.0000 1.0000 1.0311 1.0029 3,631.2 21.91 6.63
Subtotal 9,234.1 $ 37.65 $ 28.97 9,568.1 $ 37.78 $ 30.12
Total Claims/Benefit Cost 17,369.0 $ 70.41 $ 101.91 17,939.6 $ 69.86 $ 104.44
Category of Service
Milliman, Inc.Page 5 of 15

6/22/2016
Appendix 6
South Carolina Department of Health and Human ServicesSFY 2017 Medicaid Managed Care Capitation Rate Development
MCO Base Experience Data Adjustments - SFY 2015Rate Cell: TANF - Age 14 - 18, Female (AD2) SFY 2015 Member Months: 690,438
SFY 2015 Unadjusted Data 2015 Adjustments SFY 2015 Adjusted Data
Utilization Cost per Completion Program Program Mgd Care Mgd Care Other Base Other Base Utilization Cost perPer 1,000 Service PMPM Adj Util Adj Util Adj Cost Adj Util Adj Cost Adj Util Adj Cost Per 1,000 Service PMPM
Inpatient HospitalI/P Medical/Surgical/Non-Delivery Maternity 52.2 $ 2,126.02 $ 9.26 1.0256 1.0000 1.0000 0.9865 1.0004 1.0344 1.0029 54.7 $ 2,133.92 $ 9.72I/P Well Newborn - - - 1.0256 1.0000 1.0000 0.9865 1.0004 1.0343 1.0029 - - - Mental Health/Substance Abuse 41.9 694.51 2.43 1.0256 1.0000 1.0000 0.9865 1.0004 1.0344 1.0029 43.9 698.18 2.55 Other Inpatient 3.9 1,277.78 0.42 1.0256 1.0000 1.0000 0.9865 1.0004 1.0344 1.0029 4.1 1,287.35 0.44
Subtotal 98.1 $ 1,481.35 $ 12.11 102.6 $ 1,486.59 $ 12.72
Outpatient HospitalSurgery 74.1 $ 1,163.58 $ 7.19 1.0048 1.0000 1.0000 1.0000 1.0000 1.0218 1.0029 76.1 $ 1,167.33 $ 7.40Non-Surg - Emergency Room 648.3 319.44 17.26 1.0048 1.0000 1.0000 0.9598 1.0154 1.0290 1.0029 643.3 325.35 17.44 Non-Surg - Other 216.7 131.41 2.37 1.0048 1.0000 1.0000 1.0000 1.0000 1.0290 1.0029 224.1 131.61 2.46 Observation Room 15.6 366.50 0.48 1.0048 1.0000 1.0000 1.0000 1.0000 1.0290 1.0029 16.2 369.71 0.50 Treatment/Therapy/Testing 370.0 183.65 5.66 1.0048 1.0000 1.0000 1.0000 1.0000 1.0290 1.0029 382.6 184.10 5.87 Other Outpatient 7.4 319.03 0.20 1.0048 1.0000 1.0000 1.0000 1.0000 1.0290 1.0029 7.7 324.33 0.21
Subtotal 1,332.2 $ 298.69 $ 33.16 1,349.9 $ 301.16 $ 33.88
PharmacyPrescription Drugs 7,574.5 46.37 29.27 1.0001 1.0000 1.0000 1.0000 0.9933 1.0269 0.9761 7,779.1 44.96 29.15
Subtotal 7,574.5 $ 46.37 $ 29.27 7,779.1 $ 44.96 $ 29.15
AncillariesAmbulance 114.0 $ 90.36 $ 0.86 1.0058 1.0000 1.0000 1.0000 1.0000 1.0308 1.0029 118.2 $ 90.78 $ 0.89Prosthetic/DME 1,769.0 8.14 1.20 1.0058 1.0000 1.0000 1.0000 1.0000 1.0308 1.0029 1,834.0 8.16 1.25 Other Ancillaries 1,057.1 42.97 3.79 1.0058 1.0000 1.0000 1.0000 1.0000 1.0308 1.0029 1,096.0 43.15 3.94
Subtotal 2,940.1 $ 23.88 $ 5.85 3,048.3 $ 23.95 $ 6.08
PhysicianSurgery - I/P and O/P 220.6 $ 139.28 $ 2.56 1.0051 1.0000 1.0000 1.0000 1.0000 1.0308 1.0029 228.5 $ 139.67 $ 2.66Surgery - I/P and O/P - Anesthesia 67.7 106.09 0.60 1.0051 1.0000 1.0000 1.0000 1.0000 1.0308 1.0029 70.2 106.61 0.62 Maternity - Non-Delivery 30.4 36.30 0.09 1.0051 1.0000 1.0000 1.0000 1.0000 1.0308 1.0029 31.5 35.65 0.09 Hospital Visits 137.4 72.45 0.83 1.0051 1.0000 1.0000 1.0000 1.0000 1.0308 1.0029 142.3 72.70 0.86 Office Visits 2,684.8 59.99 13.42 1.0051 1.0000 1.0000 1.0092 1.0000 1.0308 1.0029 2,807.2 60.16 14.07 ER Visits 688.7 72.70 4.17 1.0051 1.0000 1.0000 0.9598 1.0154 1.0308 1.0029 684.9 73.99 4.22 Immunizations 342.2 12.91 0.37 1.0051 1.0000 1.0000 1.0000 1.0000 1.0308 1.0029 354.6 13.01 0.38 Radiology 676.4 30.38 1.71 1.0051 1.0000 1.0000 1.0000 1.0000 1.0308 1.0029 700.8 30.43 1.78 Pathology 3,708.6 12.09 3.74 1.0051 1.0000 1.0000 1.0000 1.0000 1.0308 1.0029 3,842.3 12.14 3.89 Mental Health/Substance Abuse 436.1 70.93 2.58 1.0051 1.0000 1.0000 1.0000 1.0000 1.0308 1.0029 451.9 71.19 2.68 Other Professional 23,355.9 3.49 6.78 1.0051 1.0000 1.0000 1.0000 1.0000 1.0308 1.0029 24,198.1 3.49 7.04
Subtotal 32,348.9 $ 13.67 $ 36.85 33,512.2 $ 13.72 $ 38.31
Total Claims/Benefit Cost 44,293.8 $ 31.76 $ 117.24 45,792.1 $ 31.48 $ 120.13
Category of Service
Milliman, Inc.Page 6 of 15

6/22/2016
Appendix 6
South Carolina Department of Health and Human ServicesSFY 2017 Medicaid Managed Care Capitation Rate Development
MCO Base Experience Data Adjustments - SFY 2015Rate Cell: TANF - Age 19 - 44, Male (AE1) SFY 2015 Member Months: 267,300
SFY 2015 Unadjusted Data 2015 Adjustments SFY 2015 Adjusted Data
Utilization Cost per Completion Program Program Mgd Care Mgd Care Other Base Other Base Utilization Cost perPer 1,000 Service PMPM Adj Util Adj Util Adj Cost Adj Util Adj Cost Adj Util Adj Cost Per 1,000 Service PMPM
Inpatient HospitalI/P Medical/Surgical/Non-Delivery Maternity 171.7 $ 2,710.25 $ 38.77 1.0256 1.0000 1.0000 0.9867 1.0024 1.0806 1.0029 187.7 $ 2,724.43 $ 42.62I/P Well Newborn - - - 1.0256 1.0000 1.0000 0.9867 1.0024 1.0769 1.0029 - - - Mental Health/Substance Abuse 58.1 684.82 3.32 1.0256 1.0000 1.0000 0.9867 1.0024 1.0806 1.0029 63.6 688.92 3.65 Other Inpatient 4.8 1,041.36 0.41 1.0256 1.0000 1.0000 0.9867 1.0024 1.0806 1.0029 5.2 1,039.38 0.45
Subtotal 234.6 $ 2,173.91 $ 42.50 256.5 $ 2,185.75 $ 46.72
Outpatient HospitalSurgery 110.4 $ 1,495.61 $ 13.76 1.0048 1.0000 1.0000 1.0000 1.0000 1.0750 1.0029 119.3 $ 1,499.48 $ 14.91Non-Surg - Emergency Room 838.5 328.50 22.95 1.0048 1.0000 1.0000 0.9671 1.0141 1.0750 1.0029 875.9 334.03 24.38 Non-Surg - Other 95.2 124.10 0.98 1.0048 1.0000 1.0000 1.0000 1.0000 1.0735 1.0031 102.7 123.89 1.06 Observation Room 4.4 1,035.71 0.38 1.0048 1.0000 1.0000 1.0000 1.0000 1.0750 1.0029 4.8 1,039.48 0.41 Treatment/Therapy/Testing 303.0 369.35 9.33 1.0048 1.0000 1.0000 1.0000 1.0000 1.0750 1.0029 327.3 370.59 10.11 Other Outpatient 9.6 351.69 0.28 1.0048 1.0000 1.0000 1.0000 1.0000 1.0750 1.0029 10.3 352.40 0.30
Subtotal 1,361.1 $ 420.37 $ 47.68 1,440.3 $ 426.34 $ 51.17
PharmacyPrescription Drugs 7,632.2 56.62 36.01 1.0001 1.0000 1.0000 1.0000 0.9833 1.0727 0.9760 8,187.9 54.34 37.07
Subtotal 7,632.2 $ 56.62 $ 36.01 8,187.9 $ 54.34 $ 37.07
AncillariesAmbulance 189.0 $ 102.32 $ 1.61 1.0058 1.0000 1.0000 1.0000 1.0000 1.0764 1.0030 204.6 $ 102.55 $ 1.75Prosthetic/DME 2,146.1 11.68 2.09 1.0058 1.0000 1.0000 1.0000 1.0000 1.0769 1.0029 2,324.6 11.72 2.27 Other Ancillaries 250.4 53.04 1.11 1.0058 1.0000 1.0000 1.0000 1.0000 1.0769 1.0029 271.2 53.35 1.21
Subtotal 2,585.5 $ 22.32 $ 4.81 2,800.4 $ 22.39 $ 5.22
PhysicianSurgery - I/P and O/P 404.6 $ 167.56 $ 5.65 1.0051 1.0000 1.0000 1.0000 1.0000 1.0769 1.0029 438.0 $ 168.05 $ 6.13Surgery - I/P and O/P - Anesthesia 142.0 108.16 1.28 1.0051 1.0000 1.0000 1.0000 1.0000 1.0769 1.0029 153.6 108.52 1.39 Maternity - Non-Delivery - - - 1.0051 1.0000 1.0000 1.0000 1.0000 1.0732 1.0029 - - - Hospital Visits 305.3 75.22 1.91 1.0051 1.0000 1.0000 1.0000 1.0000 1.0769 1.0029 330.4 75.30 2.07 Office Visits 2,075.9 61.23 10.59 1.0051 1.0000 1.0000 1.0126 1.0000 1.0767 1.0028 2,274.8 61.39 11.64 ER Visits 938.9 76.88 6.01 1.0051 1.0000 1.0000 0.9671 1.0141 1.0768 1.0028 982.7 78.12 6.40 Immunizations 74.9 14.65 0.09 1.0051 1.0000 1.0000 1.0000 1.0000 1.0769 1.0029 81.1 14.46 0.10 Radiology 1,168.7 30.92 3.01 1.0051 1.0000 1.0000 1.0000 1.0000 1.0769 1.0029 1,265.0 31.00 3.27 Pathology 3,074.4 14.62 3.75 1.0051 1.0000 1.0000 1.0000 1.0000 1.0767 1.0029 3,327.1 14.68 4.07 Mental Health/Substance Abuse 478.7 53.86 2.15 1.0051 1.0000 1.0000 1.0000 1.0000 1.0769 1.0029 518.2 54.05 2.33 Other Professional 4,240.0 12.37 4.37 1.0051 1.0000 1.0000 1.0000 1.0000 1.0769 1.0028 4,589.3 12.40 4.74
Subtotal 12,903.3 $ 36.09 $ 38.81 13,960.2 $ 36.23 $ 42.14
Total Claims/Benefit Cost 24,716.7 $ 82.44 $ 169.81 26,645.3 $ 82.12 $ 182.33
Category of Service
Milliman, Inc.Page 7 of 15

6/22/2016
Appendix 6
South Carolina Department of Health and Human ServicesSFY 2017 Medicaid Managed Care Capitation Rate Development
MCO Base Experience Data Adjustments - SFY 2015Rate Cell: TANF - Age 19 - 44, Female (AE2) SFY 2015 Member Months: 1,027,592
SFY 2015 Unadjusted Data 2015 Adjustments SFY 2015 Adjusted Data
Utilization Cost per Completion Program Program Mgd Care Mgd Care Other Base Other Base Utilization Cost perPer 1,000 Service PMPM Adj Util Adj Util Adj Cost Adj Util Adj Cost Adj Util Adj Cost Per 1,000 Service PMPM
Inpatient HospitalI/P Medical/Surgical/Non-Delivery Maternity 234.6 $ 2,085.98 $ 40.78 1.0256 1.0000 1.0000 0.9823 1.0035 1.0774 1.0029 254.6 $ 2,099.45 $ 44.55I/P Well Newborn 0.0 1,595.82 - 1.0256 1.0000 1.0000 0.9823 1.0035 1.0774 1.0029 0.0 - - Mental Health/Substance Abuse 49.4 756.49 3.11 1.0256 1.0000 1.0000 0.9823 1.0035 1.0774 1.0029 53.6 760.71 3.40 Other Inpatient 10.1 1,980.16 1.66 1.0256 1.0000 1.0000 0.9823 1.0035 1.0774 1.0029 11.0 1,986.96 1.81
Subtotal 294.1 $ 1,858.55 $ 45.55 319.2 $ 1,870.66 $ 49.76
Outpatient HospitalSurgery 230.9 $ 1,263.41 $ 24.31 1.0048 1.0000 1.0000 1.0000 1.0000 1.0645 1.0029 246.9 $ 1,267.23 $ 26.08Non-Surg - Emergency Room 1,435.9 331.32 39.65 1.0048 1.0000 1.0000 0.9582 1.0167 1.0717 1.0029 1,481.7 337.86 41.72 Non-Surg - Other 333.3 135.35 3.76 1.0048 1.0000 1.0000 1.0000 1.0000 1.0715 1.0029 358.9 135.76 4.06 Observation Room 42.3 321.18 1.13 1.0048 1.0000 1.0000 1.0000 1.0000 1.0713 1.0028 45.5 321.40 1.22 Treatment/Therapy/Testing 809.2 234.63 15.82 1.0048 1.0000 1.0000 1.0000 1.0000 1.0718 1.0029 871.5 235.27 17.09 Other Outpatient 21.8 331.44 0.60 1.0048 1.0000 1.0000 1.0000 1.0000 1.0713 1.0033 23.5 330.62 0.65
Subtotal 2,873.5 $ 356.10 $ 85.27 3,028.0 $ 359.87 $ 90.81
PharmacyPrescription Drugs 13,574.3 48.18 54.50 1.0001 1.0000 1.0000 1.0000 0.9778 1.0696 0.9761 14,520.5 45.98 55.64
Subtotal 13,574.3 $ 48.18 $ 54.50 14,520.5 $ 45.98 $ 55.64
AncillariesAmbulance 289.3 $ 88.22 $ 2.13 1.0058 1.0000 1.0000 1.0000 1.0000 1.0735 1.0029 312.4 $ 88.60 $ 2.31Prosthetic/DME 1,672.6 12.79 1.78 1.0058 1.0000 1.0000 1.0000 1.0000 1.0737 1.0029 1,806.2 12.81 1.93 Other Ancillaries 440.3 111.87 4.10 1.0058 1.0000 1.0000 1.0000 1.0000 1.0731 1.0034 475.2 112.13 4.44
Subtotal 2,402.1 $ 40.01 $ 8.01 2,593.8 $ 40.13 $ 8.67
PhysicianSurgery - I/P and O/P 620.3 $ 165.77 $ 8.57 1.0051 1.0000 1.0000 1.0000 1.0000 1.0736 1.0029 669.3 $ 166.27 $ 9.27Surgery - I/P and O/P - Anesthesia 245.2 106.93 2.18 1.0051 1.0000 1.0000 1.0000 1.0000 1.0737 1.0029 264.6 107.02 2.36 Maternity - Non-Delivery 111.0 42.54 0.39 1.0051 1.0000 1.0000 1.0000 1.0000 1.0736 1.0029 119.8 42.27 0.42 Hospital Visits 394.8 72.73 2.39 1.0051 1.0000 1.0000 1.0000 1.0000 1.0737 1.0029 426.0 72.86 2.59 Office Visits 3,919.8 60.08 19.62 1.0051 1.0000 1.0000 1.0145 1.0000 1.0736 1.0029 4,291.1 60.24 21.54 ER Visits 1,582.4 78.84 10.40 1.0051 1.0000 1.0000 0.9582 1.0167 1.0736 1.0029 1,636.1 80.42 10.96 Immunizations 146.8 14.02 0.17 1.0051 1.0000 1.0000 1.0000 1.0000 1.0735 1.0028 158.4 13.93 0.18 Radiology 1,762.9 36.47 5.36 1.0051 1.0000 1.0000 1.0000 1.0000 1.0736 1.0029 1,902.3 36.59 5.80 Pathology 8,900.5 14.07 10.43 1.0051 1.0000 1.0000 1.0000 1.0000 1.0736 1.0028 9,604.3 14.10 11.29 Mental Health/Substance Abuse 932.5 64.93 5.05 1.0051 1.0000 1.0000 1.0000 1.0000 1.0737 1.0029 1,006.3 65.18 5.47 Other Professional 25,495.0 3.43 7.30 1.0051 1.0000 1.0000 1.0000 1.0000 1.0737 1.0029 27,513.6 3.45 7.90
Subtotal 44,111.2 $ 19.55 $ 71.86 47,591.9 $ 19.61 $ 77.79
Total Claims/Benefit Cost 63,255.2 $ 50.31 $ 265.19 68,053.5 $ 49.84 $ 282.67
Category of Service
Milliman, Inc.Page 8 of 15
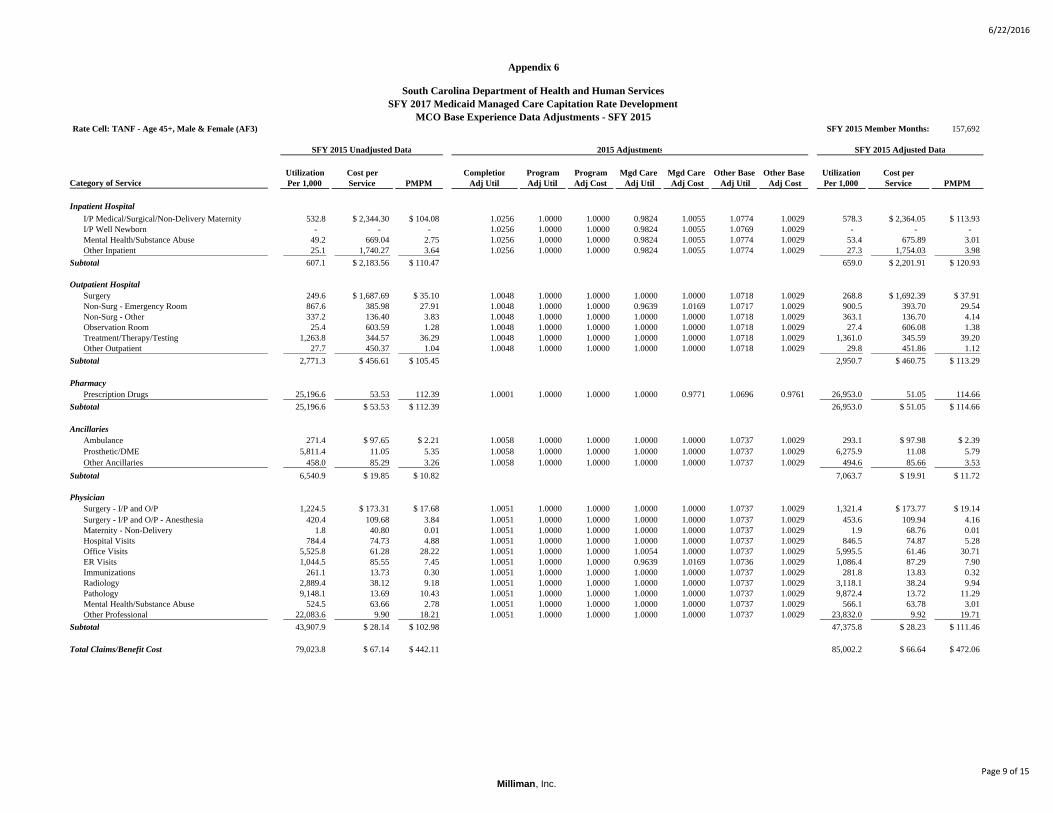
6/22/2016
Appendix 6
South Carolina Department of Health and Human ServicesSFY 2017 Medicaid Managed Care Capitation Rate Development
MCO Base Experience Data Adjustments - SFY 2015Rate Cell: TANF - Age 45+, Male & Female (AF3) SFY 2015 Member Months: 157,692
SFY 2015 Unadjusted Data 2015 Adjustments SFY 2015 Adjusted Data
Utilization Cost per Completion Program Program Mgd Care Mgd Care Other Base Other Base Utilization Cost perPer 1,000 Service PMPM Adj Util Adj Util Adj Cost Adj Util Adj Cost Adj Util Adj Cost Per 1,000 Service PMPM
Inpatient HospitalI/P Medical/Surgical/Non-Delivery Maternity 532.8 $ 2,344.30 $ 104.08 1.0256 1.0000 1.0000 0.9824 1.0055 1.0774 1.0029 578.3 $ 2,364.05 $ 113.93I/P Well Newborn - - - 1.0256 1.0000 1.0000 0.9824 1.0055 1.0769 1.0029 - - - Mental Health/Substance Abuse 49.2 669.04 2.75 1.0256 1.0000 1.0000 0.9824 1.0055 1.0774 1.0029 53.4 675.89 3.01 Other Inpatient 25.1 1,740.27 3.64 1.0256 1.0000 1.0000 0.9824 1.0055 1.0774 1.0029 27.3 1,754.03 3.98
Subtotal 607.1 $ 2,183.56 $ 110.47 659.0 $ 2,201.91 $ 120.93
Outpatient HospitalSurgery 249.6 $ 1,687.69 $ 35.10 1.0048 1.0000 1.0000 1.0000 1.0000 1.0718 1.0029 268.8 $ 1,692.39 $ 37.91Non-Surg - Emergency Room 867.6 385.98 27.91 1.0048 1.0000 1.0000 0.9639 1.0169 1.0717 1.0029 900.5 393.70 29.54 Non-Surg - Other 337.2 136.40 3.83 1.0048 1.0000 1.0000 1.0000 1.0000 1.0718 1.0029 363.1 136.70 4.14 Observation Room 25.4 603.59 1.28 1.0048 1.0000 1.0000 1.0000 1.0000 1.0718 1.0029 27.4 606.08 1.38 Treatment/Therapy/Testing 1,263.8 344.57 36.29 1.0048 1.0000 1.0000 1.0000 1.0000 1.0718 1.0029 1,361.0 345.59 39.20 Other Outpatient 27.7 450.37 1.04 1.0048 1.0000 1.0000 1.0000 1.0000 1.0718 1.0029 29.8 451.86 1.12
Subtotal 2,771.3 $ 456.61 $ 105.45 2,950.7 $ 460.75 $ 113.29
PharmacyPrescription Drugs 25,196.6 53.53 112.39 1.0001 1.0000 1.0000 1.0000 0.9771 1.0696 0.9761 26,953.0 51.05 114.66
Subtotal 25,196.6 $ 53.53 $ 112.39 26,953.0 $ 51.05 $ 114.66
AncillariesAmbulance 271.4 $ 97.65 $ 2.21 1.0058 1.0000 1.0000 1.0000 1.0000 1.0737 1.0029 293.1 $ 97.98 $ 2.39Prosthetic/DME 5,811.4 11.05 5.35 1.0058 1.0000 1.0000 1.0000 1.0000 1.0737 1.0029 6,275.9 11.08 5.79 Other Ancillaries 458.0 85.29 3.26 1.0058 1.0000 1.0000 1.0000 1.0000 1.0737 1.0029 494.6 85.66 3.53
Subtotal 6,540.9 $ 19.85 $ 10.82 7,063.7 $ 19.91 $ 11.72
PhysicianSurgery - I/P and O/P 1,224.5 $ 173.31 $ 17.68 1.0051 1.0000 1.0000 1.0000 1.0000 1.0737 1.0029 1,321.4 $ 173.77 $ 19.14Surgery - I/P and O/P - Anesthesia 420.4 109.68 3.84 1.0051 1.0000 1.0000 1.0000 1.0000 1.0737 1.0029 453.6 109.94 4.16 Maternity - Non-Delivery 1.8 40.80 0.01 1.0051 1.0000 1.0000 1.0000 1.0000 1.0737 1.0029 1.9 68.76 0.01 Hospital Visits 784.4 74.73 4.88 1.0051 1.0000 1.0000 1.0000 1.0000 1.0737 1.0029 846.5 74.87 5.28 Office Visits 5,525.8 61.28 28.22 1.0051 1.0000 1.0000 1.0054 1.0000 1.0737 1.0029 5,995.5 61.46 30.71 ER Visits 1,044.5 85.55 7.45 1.0051 1.0000 1.0000 0.9639 1.0169 1.0736 1.0029 1,086.4 87.29 7.90 Immunizations 261.1 13.73 0.30 1.0051 1.0000 1.0000 1.0000 1.0000 1.0737 1.0029 281.8 13.83 0.32 Radiology 2,889.4 38.12 9.18 1.0051 1.0000 1.0000 1.0000 1.0000 1.0737 1.0029 3,118.1 38.24 9.94 Pathology 9,148.1 13.69 10.43 1.0051 1.0000 1.0000 1.0000 1.0000 1.0737 1.0029 9,872.4 13.72 11.29 Mental Health/Substance Abuse 524.5 63.66 2.78 1.0051 1.0000 1.0000 1.0000 1.0000 1.0737 1.0029 566.1 63.78 3.01 Other Professional 22,083.6 9.90 18.21 1.0051 1.0000 1.0000 1.0000 1.0000 1.0737 1.0029 23,832.0 9.92 19.71
Subtotal 43,907.9 $ 28.14 $ 102.98 47,375.8 $ 28.23 $ 111.46
Total Claims/Benefit Cost 79,023.8 $ 67.14 $ 442.11 85,002.2 $ 66.64 $ 472.06
Category of Service
Milliman, Inc.Page 9 of 15
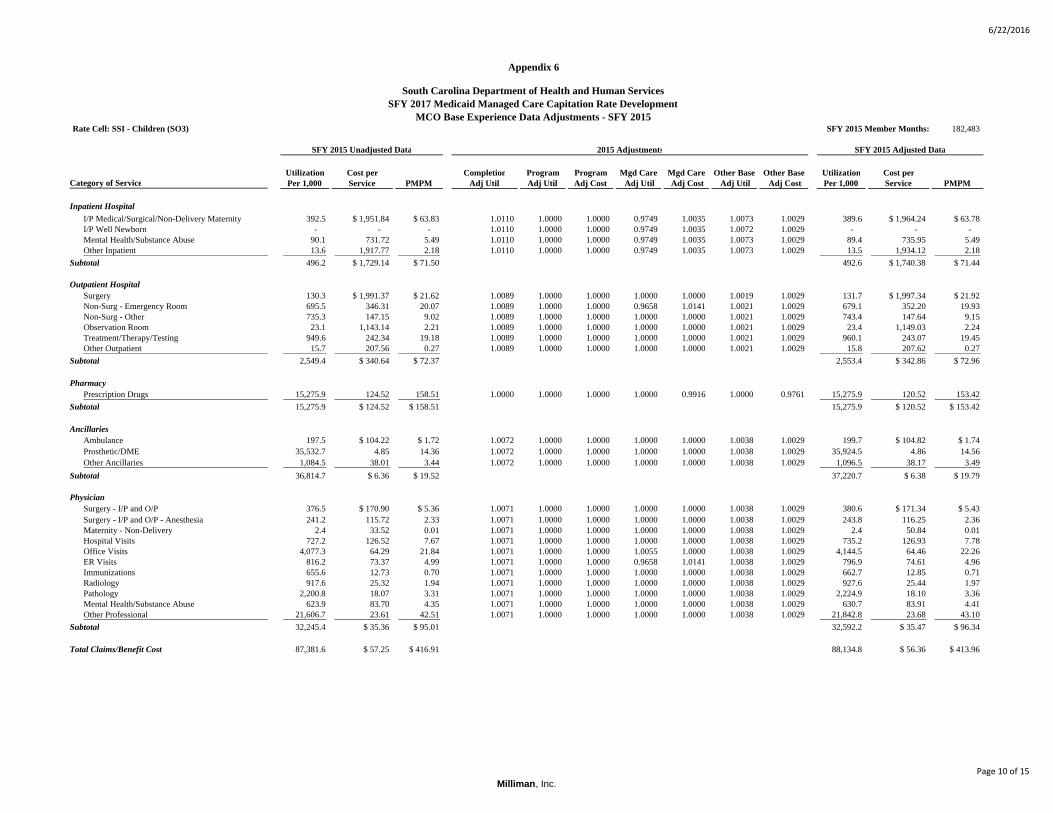
6/22/2016
Appendix 6
South Carolina Department of Health and Human ServicesSFY 2017 Medicaid Managed Care Capitation Rate Development
MCO Base Experience Data Adjustments - SFY 2015Rate Cell: SSI - Children (SO3) SFY 2015 Member Months: 182,483
SFY 2015 Unadjusted Data 2015 Adjustments SFY 2015 Adjusted Data
Utilization Cost per Completion Program Program Mgd Care Mgd Care Other Base Other Base Utilization Cost perPer 1,000 Service PMPM Adj Util Adj Util Adj Cost Adj Util Adj Cost Adj Util Adj Cost Per 1,000 Service PMPM
Inpatient HospitalI/P Medical/Surgical/Non-Delivery Maternity 392.5 $ 1,951.84 $ 63.83 1.0110 1.0000 1.0000 0.9749 1.0035 1.0073 1.0029 389.6 $ 1,964.24 $ 63.78I/P Well Newborn - - - 1.0110 1.0000 1.0000 0.9749 1.0035 1.0072 1.0029 - - - Mental Health/Substance Abuse 90.1 731.72 5.49 1.0110 1.0000 1.0000 0.9749 1.0035 1.0073 1.0029 89.4 735.95 5.49 Other Inpatient 13.6 1,917.77 2.18 1.0110 1.0000 1.0000 0.9749 1.0035 1.0073 1.0029 13.5 1,934.12 2.18
Subtotal 496.2 $ 1,729.14 $ 71.50 492.6 $ 1,740.38 $ 71.44
Outpatient HospitalSurgery 130.3 $ 1,991.37 $ 21.62 1.0089 1.0000 1.0000 1.0000 1.0000 1.0019 1.0029 131.7 $ 1,997.34 $ 21.92Non-Surg - Emergency Room 695.5 346.31 20.07 1.0089 1.0000 1.0000 0.9658 1.0141 1.0021 1.0029 679.1 352.20 19.93 Non-Surg - Other 735.3 147.15 9.02 1.0089 1.0000 1.0000 1.0000 1.0000 1.0021 1.0029 743.4 147.64 9.15 Observation Room 23.1 1,143.14 2.21 1.0089 1.0000 1.0000 1.0000 1.0000 1.0021 1.0029 23.4 1,149.03 2.24 Treatment/Therapy/Testing 949.6 242.34 19.18 1.0089 1.0000 1.0000 1.0000 1.0000 1.0021 1.0029 960.1 243.07 19.45 Other Outpatient 15.7 207.56 0.27 1.0089 1.0000 1.0000 1.0000 1.0000 1.0021 1.0029 15.8 207.62 0.27
Subtotal 2,549.4 $ 340.64 $ 72.37 2,553.4 $ 342.86 $ 72.96
PharmacyPrescription Drugs 15,275.9 124.52 158.51 1.0000 1.0000 1.0000 1.0000 0.9916 1.0000 0.9761 15,275.9 120.52 153.42
Subtotal 15,275.9 $ 124.52 $ 158.51 15,275.9 $ 120.52 $ 153.42
AncillariesAmbulance 197.5 $ 104.22 $ 1.72 1.0072 1.0000 1.0000 1.0000 1.0000 1.0038 1.0029 199.7 $ 104.82 $ 1.74Prosthetic/DME 35,532.7 4.85 14.36 1.0072 1.0000 1.0000 1.0000 1.0000 1.0038 1.0029 35,924.5 4.86 14.56 Other Ancillaries 1,084.5 38.01 3.44 1.0072 1.0000 1.0000 1.0000 1.0000 1.0038 1.0029 1,096.5 38.17 3.49
Subtotal 36,814.7 $ 6.36 $ 19.52 37,220.7 $ 6.38 $ 19.79
PhysicianSurgery - I/P and O/P 376.5 $ 170.90 $ 5.36 1.0071 1.0000 1.0000 1.0000 1.0000 1.0038 1.0029 380.6 $ 171.34 $ 5.43Surgery - I/P and O/P - Anesthesia 241.2 115.72 2.33 1.0071 1.0000 1.0000 1.0000 1.0000 1.0038 1.0029 243.8 116.25 2.36 Maternity - Non-Delivery 2.4 33.52 0.01 1.0071 1.0000 1.0000 1.0000 1.0000 1.0038 1.0029 2.4 50.84 0.01 Hospital Visits 727.2 126.52 7.67 1.0071 1.0000 1.0000 1.0000 1.0000 1.0038 1.0029 735.2 126.93 7.78 Office Visits 4,077.3 64.29 21.84 1.0071 1.0000 1.0000 1.0055 1.0000 1.0038 1.0029 4,144.5 64.46 22.26 ER Visits 816.2 73.37 4.99 1.0071 1.0000 1.0000 0.9658 1.0141 1.0038 1.0029 796.9 74.61 4.96 Immunizations 655.6 12.73 0.70 1.0071 1.0000 1.0000 1.0000 1.0000 1.0038 1.0029 662.7 12.85 0.71 Radiology 917.6 25.32 1.94 1.0071 1.0000 1.0000 1.0000 1.0000 1.0038 1.0029 927.6 25.44 1.97 Pathology 2,200.8 18.07 3.31 1.0071 1.0000 1.0000 1.0000 1.0000 1.0038 1.0029 2,224.9 18.10 3.36 Mental Health/Substance Abuse 623.9 83.70 4.35 1.0071 1.0000 1.0000 1.0000 1.0000 1.0038 1.0029 630.7 83.91 4.41 Other Professional 21,606.7 23.61 42.51 1.0071 1.0000 1.0000 1.0000 1.0000 1.0038 1.0029 21,842.8 23.68 43.10
Subtotal 32,245.4 $ 35.36 $ 95.01 32,592.2 $ 35.47 $ 96.34
Total Claims/Benefit Cost 87,381.6 $ 57.25 $ 416.91 88,134.8 $ 56.36 $ 413.96
Category of Service
Milliman, Inc.Page 10 of 15

6/22/2016
Appendix 6
South Carolina Department of Health and Human ServicesSFY 2017 Medicaid Managed Care Capitation Rate Development
MCO Base Experience Data Adjustments - SFY 2015Rate Cell: SSI - Adults (SP3) SFY 2015 Member Months: 595,525
SFY 2015 Unadjusted Data 2015 Adjustments SFY 2015 Adjusted Data
Utilization Cost per Completion Program Program Mgd Care Mgd Care Other Base Other Base Utilization Cost perPer 1,000 Service PMPM Adj Util Adj Util Adj Cost Adj Util Adj Cost Adj Util Adj Cost Per 1,000 Service PMPM
Inpatient HospitalI/P Medical/Surgical/Non-Delivery Maternity 1,725.1 $ 1,973.22 $ 283.66 1.0110 1.0000 1.0000 0.9739 1.0041 1.0065 1.0019 1,709.6 $ 1,985.04 $ 282.80I/P Well Newborn 0.1 2,164.58 0.02 1.0110 1.0000 1.0000 0.9739 1.0041 1.0079 1.0029 0.1 1,999.00 0.02 Mental Health/Substance Abuse 276.7 665.06 15.34 1.0110 1.0000 1.0000 0.9739 1.0041 1.0079 1.0029 274.6 669.88 15.33 Other Inpatient 58.4 1,548.18 7.54 1.0110 1.0000 1.0000 0.9739 1.0041 1.0079 1.0029 58.0 1,559.22 7.54
Subtotal 2,060.4 $ 1,785.44 $ 306.56 2,042.3 $ 1,796.11 $ 305.68
Outpatient HospitalSurgery 315.1 $ 1,550.67 $ 40.72 1.0089 1.0000 1.0000 1.0000 1.0000 1.0023 1.0029 318.7 $ 1,555.09 $ 41.30Non-Surg - Emergency Room 1,557.6 399.76 51.89 1.0089 1.0000 1.0000 0.9675 1.0151 1.0025 1.0029 1,524.2 406.98 51.69 Non-Surg - Other 624.8 140.37 7.31 1.0089 1.0000 1.0000 1.0000 1.0000 1.0027 1.0029 632.0 140.81 7.42 Observation Room 57.9 500.29 2.41 1.0089 1.0000 1.0000 1.0000 1.0000 1.0027 1.0029 58.5 501.35 2.45 Treatment/Therapy/Testing 1,466.4 449.51 54.93 1.0089 1.0000 1.0000 1.0000 1.0000 1.0026 1.0029 1,483.3 450.81 55.72 Other Outpatient 36.0 438.68 1.32 1.0089 1.0000 1.0000 1.0000 1.0000 1.0027 1.0029 36.4 441.17 1.34
Subtotal 4,057.8 $ 468.96 $ 158.58 4,053.1 $ 473.45 $ 159.91
PharmacyPrescription Drugs 33,686.9 88.01 247.07 1.0000 1.0000 1.0000 1.0000 0.9838 1.0006 0.9761 33,707.2 84.52 237.40
Subtotal 33,686.9 $ 88.01 $ 247.07 33,707.2 $ 84.52 $ 237.40
AncillariesAmbulance 1,136.9 $ 88.06 $ 8.34 1.0072 1.0000 1.0000 1.0000 1.0000 1.0043 1.0029 1,150.0 $ 88.28 $ 8.46Prosthetic/DME 22,236.1 8.30 15.39 1.0072 1.0000 1.0000 1.0000 1.0000 1.0044 1.0029 22,494.7 8.33 15.61 Other Ancillaries 1,020.9 80.42 6.84 1.0072 1.0000 1.0000 1.0000 1.0000 1.0044 1.0029 1,032.7 80.64 6.94
Subtotal 24,393.8 $ 15.04 $ 30.57 24,677.5 $ 15.08 $ 31.01
PhysicianSurgery - I/P and O/P 1,342.6 $ 168.21 $ 18.82 1.0071 1.0000 1.0000 1.0000 1.0000 1.0044 1.0029 1,358.1 $ 168.70 $ 19.09Surgery - I/P and O/P - Anesthesia 456.1 113.55 4.32 1.0071 1.0000 1.0000 1.0000 1.0000 1.0044 1.0029 461.4 113.98 4.38 Maternity - Non-Delivery 13.5 38.93 0.04 1.0071 1.0000 1.0000 1.0000 1.0000 1.0044 1.0029 13.7 35.60 0.04 Hospital Visits 2,884.4 71.81 17.26 1.0071 1.0000 1.0000 1.0000 1.0000 1.0044 1.0029 2,917.7 72.01 17.51 Office Visits 5,898.3 59.71 29.35 1.0071 1.0000 1.0000 1.0082 1.0000 1.0044 1.0029 6,015.2 59.89 30.02 ER Visits 1,975.8 88.19 14.52 1.0071 1.0000 1.0000 0.9675 1.0151 1.0043 1.0029 1,933.4 89.78 14.47 Immunizations 312.6 14.76 0.38 1.0071 1.0000 1.0000 1.0000 1.0000 1.0044 1.0029 316.2 14.63 0.39 Radiology 3,879.3 38.28 12.37 1.0071 1.0000 1.0000 1.0000 1.0000 1.0044 1.0029 3,924.0 38.38 12.55 Pathology 10,846.1 13.48 12.19 1.0071 1.0000 1.0000 1.0000 1.0000 1.0043 1.0028 10,970.1 13.52 12.36 Mental Health/Substance Abuse 637.9 60.55 3.22 1.0071 1.0000 1.0000 1.0000 1.0000 1.0040 1.0021 645.0 60.70 3.26 Other Professional 48,980.6 10.21 41.67 1.0071 1.0000 1.0000 1.0000 1.0000 1.0044 1.0029 49,545.4 10.24 42.27
Subtotal 77,227.2 $ 23.95 $ 154.14 78,100.1 $ 24.02 $ 156.34
Total Claims/Benefit Cost 141,426.1 $ 76.10 $ 896.92 142,580.2 $ 74.94 $ 890.36
Category of Service
Milliman, Inc.Page 11 of 15

6/22/2016
Appendix 6
South Carolina Department of Health and Human ServicesSFY 2017 Medicaid Managed Care Capitation Rate Development
MCO Base Experience Data Adjustments - SFY 2015Rate Cell: OCWI (WG2) SFY 2015 Member Months: 195,119
SFY 2015 Unadjusted Data 2015 Adjustments SFY 2015 Adjusted Data
Utilization Cost per Completion Program Program Mgd Care Mgd Care Other Base Other Base Utilization Cost perPer 1,000 Service PMPM Adj Util Adj Util Adj Cost Adj Util Adj Cost Adj Util Adj Cost Per 1,000 Service PMPM
Inpatient HospitalI/P Medical/Surgical/Non-Delivery Maternity 254.0 $ 1,500.77 $ 31.77 1.0060 1.0000 1.0000 0.9879 1.0001 1.1160 0.9911 281.7 $ 1,487.74 $ 34.93I/P Well Newborn 1.0 757.76 0.06 1.0060 1.0000 1.0000 0.9879 1.0001 1.1660 1.0029 1.1 733.89 0.07 Mental Health/Substance Abuse 18.4 863.07 1.32 1.0060 1.0000 1.0000 0.9879 1.0001 0.9398 1.0071 17.2 867.60 1.24 Other Inpatient 32.3 2,427.37 6.54 1.0060 1.0000 1.0000 0.9879 1.0001 1.0751 1.0694 34.6 2,594.63 7.47
Subtotal 305.7 $ 1,558.00 $ 39.69 334.6 $ 1,567.68 $ 43.71
Outpatient HospitalSurgery 752.5 $ 477.38 $ 29.94 1.0044 1.0000 1.0000 1.0000 1.0000 1.0547 0.9736 797.2 $ 464.83 $ 30.88Non-Surg - Emergency Room 1,049.1 334.18 29.21 1.0044 1.0000 1.0000 0.9588 1.0160 1.0246 1.0122 1,035.1 343.61 29.64 Non-Surg - Other 929.3 136.80 10.59 1.0044 1.0000 1.0000 1.0000 1.0000 1.1304 1.0050 1,055.1 137.43 12.08 Observation Room 313.2 239.26 6.24 1.0044 1.0000 1.0000 1.0000 1.0000 1.1440 1.0004 359.8 239.20 7.17 Treatment/Therapy/Testing 1,569.1 109.80 14.36 1.0044 1.0000 1.0000 1.0000 1.0000 1.1217 0.9914 1,767.8 108.88 16.04 Other Outpatient 23.9 157.08 0.31 1.0044 1.0000 1.0000 1.0000 1.0000 1.1121 0.9048 26.7 141.05 0.31
Subtotal 4,637.0 $ 234.59 $ 90.65 5,041.7 $ 228.80 $ 96.13
PharmacyPrescription Drugs 11,250.0 29.49 27.65 1.0000 1.0000 1.0000 1.0000 0.9503 1.0576 0.9735 11,898.0 27.28 27.05
Subtotal 11,250.0 $ 29.49 $ 27.65 11,898.0 $ 27.28 $ 27.05
AncillariesAmbulance 369.9 $ 91.15 $ 2.81 1.0096 1.0000 1.0000 1.0000 1.0000 1.0949 1.0068 408.9 $ 91.77 $ 3.13Prosthetic/DME 678.8 17.92 1.01 1.0096 1.0000 1.0000 1.0000 1.0000 1.1060 0.9867 758.0 17.62 1.11 Other Ancillaries 956.5 169.27 13.49 1.0096 1.0000 1.0000 1.0000 1.0000 1.1240 1.0080 1,085.4 170.60 15.43
Subtotal 2,005.2 $ 103.59 $ 17.31 2,252.3 $ 104.80 $ 19.67
PhysicianSurgery - I/P and O/P 514.8 $ 129.79 $ 5.57 1.0060 1.0000 1.0000 1.0000 1.0000 1.0829 0.9895 560.8 $ 128.48 $ 6.00Surgery - I/P and O/P - Anesthesia 203.6 97.73 1.66 1.0060 1.0000 1.0000 1.0000 1.0000 1.0950 0.9940 224.3 97.24 1.82 Maternity - Non-Delivery 1,153.5 30.71 2.95 1.0060 1.0000 1.0000 1.0000 1.0000 1.1533 0.9942 1,338.3 30.51 3.40 Hospital Visits 776.4 64.91 4.20 1.0060 1.0000 1.0000 1.0000 1.0000 1.1292 1.0003 882.0 64.94 4.77 Office Visits 1,954.0 57.08 9.30 1.0060 1.0000 1.0000 1.0210 1.0000 1.0256 1.0041 2,058.4 57.35 9.84 ER Visits 1,368.5 76.47 8.72 1.0060 1.0000 1.0000 0.9588 1.0160 1.0516 1.0039 1,388.1 77.99 9.02 Immunizations 395.9 16.73 0.55 1.0060 1.0000 1.0000 1.0000 1.0000 1.1317 1.0116 450.7 16.87 0.63 Radiology 1,139.9 48.37 4.59 1.0060 1.0000 1.0000 1.0000 1.0000 1.0573 1.0293 1,212.4 49.74 5.03 Pathology 15,894.9 11.34 15.02 1.0060 1.0000 1.0000 1.0000 1.0000 1.1211 0.9948 17,926.6 11.28 16.85 Mental Health/Substance Abuse 1,025.9 72.72 6.22 1.0060 1.0000 1.0000 1.0000 1.0000 1.0593 1.0220 1,093.3 74.36 6.77 Other Professional 17,739.9 2.46 3.63 1.0060 1.0000 1.0000 1.0000 1.0000 0.9437 1.1237 16,841.6 2.76 3.87
Subtotal 42,167.2 $ 17.76 $ 62.41 43,976.5 $ 18.56 $ 68.01
Total Claims/Benefit Cost 60,365.1 $ 47.25 $ 237.71 63,503.0 $ 48.11 $ 254.58
Category of Service
Milliman, Inc.Page 12 of 15

6/22/2016
Appendix 6
South Carolina Department of Health and Human ServicesSFY 2017 Medicaid Managed Care Capitation Rate Development
MCO Base Experience Data Adjustments - SFY 2015Rate Cell: DUAL SFY 2015 Member Months: 572,430
SFY 2015 Unadjusted Data 2015 Adjustments SFY 2015 Adjusted Data
Utilization Cost per Completion Program Program Mgd Care Mgd Care Other Base Other Base Utilization Cost perPer 1,000 Service PMPM Adj Util Adj Util Adj Cost Adj Util Adj Cost Adj Util Adj Cost Per 1,000 Service PMPM
Inpatient HospitalI/P Medical/Surgical/Non-Delivery Maternity 765.7 $ 253.18 $ 16.16 1.0262 1.0000 1.0000 1.0000 1.0000 1.0000 1.0000 785.8 $ 253.25 $ 16.58I/P Well Newborn - - - 1.0262 1.0000 1.0000 1.0000 1.0000 1.0000 1.0000 - - - Mental Health/Substance Abuse 53.2 189.21 0.84 1.0262 1.0000 1.0000 1.0000 1.0000 1.0000 1.0000 54.6 189.46 0.86 Inpatient Maternity Delivery 5.3 318.71 0.14 1.0262 1.0000 1.0000 1.0000 1.0000 1.0000 1.0000 5.4 316.76 0.14 Other Inpatient 170.1 79.76 1.13 1.0262 1.0000 1.0000 1.0000 1.0000 1.0000 1.0000 174.6 79.71 1.16
Subtotal 994.4 $ 220.47 $ 18.27 1,020.4 $ 220.49 $ 18.75
Outpatient HospitalSurgery 145.1 $ 153.99 $ 1.86 1.0219 1.0000 1.0000 1.0000 1.0000 1.0000 1.0000 148.2 $ 153.86 $ 1.90Non-Surg - Emergency Room 951.4 58.84 4.66 1.0219 1.0000 1.0000 1.0000 1.0000 1.0000 1.0000 972.2 58.78 4.76 Non-Surg - Other 426.5 27.27 0.97 1.0219 1.0000 1.0000 1.0000 1.0000 1.0000 1.0000 435.9 27.29 0.99 Observation Room 29.7 49.30 0.12 1.0219 1.0000 1.0000 1.0000 1.0000 1.0000 1.0000 30.4 48.44 0.12 Treatment/Therapy/Testing 475.6 70.92 2.81 1.0219 1.0000 1.0000 1.0000 1.0000 1.0000 1.0000 486.0 70.90 2.87 Outpatient Maternity Delivery 0.1 24.58 - 1.0219 1.0000 1.0000 1.0000 1.0000 1.0000 1.0000 0.1 - - Other Outpatient 12.3 214.39 0.22 1.0219 1.0000 1.0000 1.0000 1.0000 1.0000 1.0000 12.6 214.17 0.22
Subtotal 2,040.7 $ 62.57 $ 10.64 2,085.4 $ 62.57 $ 10.87
PharmacyPrescription Drugs 508.5 30.90 1.31 1.0047 1.0000 1.0000 1.0000 1.0000 1.0000 1.0000 510.9 30.92 1.32
Subtotal 508.5 $ 30.90 $ 1.31 510.9 $ 30.92 $ 1.32
AncillariesAmbulance 35.2 $ 55.17 $ 0.16 1.0347 1.0000 1.0000 1.0000 1.0000 1.0000 1.0000 36.5 $ 54.48 $ 0.17Prosthetic/DME 12,624.7 2.46 2.59 1.0347 1.0000 1.0000 1.0000 1.0000 1.0000 1.0000 13,062.8 2.46 2.68 Other Ancillaries 1,079.7 24.79 2.23 1.0347 1.0000 1.0000 1.0000 1.0000 1.0000 1.0000 1,117.1 24.79 2.31
Subtotal 13,739.6 $ 4.35 $ 4.98 14,216.4 $ 4.35 $ 5.15
PhysicianSurgery - I/P and O/P 473.9 $ 25.38 $ 1.00 1.0165 1.0000 1.0000 1.0000 1.0000 1.0000 1.0000 481.7 $ 25.32 $ 1.02Surgery - I/P and O/P - Anesthesia 167.4 16.22 0.23 1.0165 1.0000 1.0000 1.0000 1.0000 1.0000 1.0000 170.2 16.49 0.23 Maternity - Non-Delivery 2.3 3.67 - 1.0165 1.0000 1.0000 1.0000 1.0000 1.0000 1.0000 2.3 - - Hospital Visits 746.3 19.68 1.22 1.0165 1.0000 1.0000 1.0000 1.0000 1.0000 1.0000 758.6 19.62 1.24 Office Visits 2,229.5 25.49 4.74 1.0165 1.0000 1.0000 1.0000 1.0000 1.0000 1.0000 2,266.3 25.51 4.82 ER Visits 314.3 30.38 0.80 1.0165 1.0000 1.0000 1.0000 1.0000 1.0000 1.0000 319.4 30.55 0.81 Immunizations 27.5 7.80 0.02 1.0165 1.0000 1.0000 1.0000 1.0000 1.0000 1.0000 28.0 8.72 0.02 Radiology 813.4 19.13 1.30 1.0165 1.0000 1.0000 1.0000 1.0000 1.0000 1.0000 826.8 19.18 1.32 Pathology 1,275.1 3.50 0.37 1.0165 1.0000 1.0000 1.0000 1.0000 1.0000 1.0000 1,296.1 3.48 0.38 Mental Health/Substance Abuse 77.4 48.82 0.31 1.0165 1.0000 1.0000 1.0000 1.0000 1.0000 1.0000 78.7 48.06 0.32 Maternity – Delivery 1.3 270.66 0.03 1.0165 1.0000 1.0000 1.0000 1.0000 1.0000 1.0000 1.4 268.33 0.03 Maternity – Delivery - Anesthesia 1.6 44.08 0.01 1.0165 1.0000 1.0000 1.0000 1.0000 1.0000 1.0000 1.6 75.32 0.01 Maternity - Delivery - Office Visits 10.3 18.89 0.02 1.0165 1.0000 1.0000 1.0000 1.0000 1.0000 1.0000 10.4 23.36 0.02 Maternity - Delivery - Radiology 7.5 15.18 0.01 1.0165 1.0000 1.0000 1.0000 1.0000 1.0000 1.0000 7.6 15.95 0.01 Other Professional 38,279.6 1.68 5.36 1.0165 1.0000 1.0000 1.0000 1.0000 1.0000 1.0000 38,911.2 1.68 5.45
Subtotal 44,427.5 $ 4.16 $ 15.42 45,160.5 $ 4.16 $ 15.67
Total Claims/Benefit Cost 61,710.7 $ 9.84 $ 50.62 62,993.5 $ 9.86 $ 51.77
Category of Service
Milliman, Inc.Page 13 of 15

6/22/2016
Appendix 6
South Carolina Department of Health and Human ServicesSFY 2017 Medicaid Managed Care Capitation Rate Development
MCO Base Experience Data Adjustments - SFY 2015Rate Cell: Foster Care Children (FG3) SFY 2015 Member Months: 43,992
SFY 2015 Unadjusted Data 2015 Adjustments SFY 2015 Adjusted Data
Utilization Cost per Completion Program Program Mgd Care Mgd Care Other Base Other Base Utilization Cost perPer 1,000 Service PMPM Adj Util Adj Util Adj Cost Adj Util Adj Cost Adj Util Adj Cost Per 1,000 Service PMPM
Inpatient HospitalI/P Medical/Surgical/Non-Delivery Maternity 296.0 $ 1,504.17 $ 37.10 1.0256 1.0000 1.0000 0.9851 1.0034 1.0075 1.0029 301.3 $ 1,513.73 $ 38.00I/P Well Newborn 48.0 439.14 1.76 1.0256 1.0000 1.0000 0.9851 1.0034 1.0075 1.0029 48.9 442.70 1.80 Mental Health/Substance Abuse 311.2 594.66 15.42 1.0256 1.0000 1.0000 0.9851 1.0034 1.0075 1.0029 316.8 598.28 15.79 Other Inpatient 18.8 2,033.30 3.19 1.0256 1.0000 1.0000 0.9851 1.0034 1.0075 1.0029 19.2 2,046.67 3.27
Subtotal 674.0 $ 1,023.20 $ 57.47 686.1 $ 1,029.61 $ 58.87
Outpatient HospitalSurgery 90.6 $ 1,310.06 $ 9.89 1.0048 1.0000 1.0000 1.0000 1.0000 1.0013 1.0029 91.1 $ 1,314.28 $ 9.98Non-Surg - Emergency Room 539.0 311.76 14.00 1.0048 1.0000 1.0000 0.9718 1.0096 1.0023 1.0029 527.5 315.59 13.87 Non-Surg - Other 630.7 113.22 5.95 1.0048 1.0000 1.0000 1.0000 1.0000 1.0023 1.0029 635.1 113.54 6.01 Observation Room 13.4 559.97 0.62 1.0048 1.0000 1.0000 1.0000 1.0000 1.0023 1.0029 13.5 558.25 0.63 Treatment/Therapy/Testing 531.9 142.40 6.31 1.0048 1.0000 1.0000 1.0000 1.0000 1.0023 1.0029 535.7 142.77 6.37 Other Outpatient 13.4 173.04 0.19 1.0048 1.0000 1.0000 1.0000 1.0000 1.0023 1.0029 13.5 171.08 0.19
Subtotal 1,818.9 $ 243.84 $ 36.96 1,816.4 $ 244.79 $ 37.05
PharmacyPrescription Drugs 13,470.8 68.56 76.97 1.0001 1.0000 1.0000 1.0000 0.9994 1.0002 0.9761 13,474.9 66.89 75.11
Subtotal 13,470.8 $ 68.56 $ 76.97 13,474.9 $ 66.89 $ 75.11
AncillariesAmbulance 220.7 $ 93.98 $ 1.73 1.0058 1.0000 1.0000 1.0000 1.0000 1.0040 1.0029 222.8 $ 94.35 $ 1.75Prosthetic/DME 9,129.3 4.07 3.10 1.0058 1.0000 1.0000 1.0000 1.0000 1.0040 1.0029 9,219.0 4.09 3.14 Other Ancillaries 634.5 39.95 2.11 1.0058 1.0000 1.0000 1.0000 1.0000 1.0040 1.0029 640.7 40.02 2.14
Subtotal 9,984.5 $ 8.34 $ 6.94 10,082.5 $ 8.37 $ 7.03
PhysicianSurgery - I/P and O/P 333.9 $ 150.79 $ 4.20 1.0051 1.0000 1.0000 1.0000 1.0000 1.0040 1.0029 336.9 $ 151.39 $ 4.25Surgery - I/P and O/P - Anesthesia 156.3 104.46 1.36 1.0051 1.0000 1.0000 1.0000 1.0000 1.0040 1.0029 157.7 104.72 1.38 Maternity - Non-Delivery 4.9 24.68 0.01 1.0051 1.0000 1.0000 1.0000 1.0000 1.0040 1.0029 5.0 24.51 0.01 Hospital Visits 1,054.6 107.77 9.47 1.0051 1.0000 1.0000 1.0000 1.0000 1.0040 1.0029 1,064.2 108.07 9.58 Office Visits 4,420.1 64.27 23.67 1.0051 1.0000 1.0000 1.0033 1.0000 1.0040 1.0029 4,475.1 64.45 24.03 ER Visits 613.7 72.99 3.73 1.0051 1.0000 1.0000 0.9718 1.0096 1.0040 1.0029 601.9 73.84 3.70 Immunizations 1,715.8 12.33 1.76 1.0051 1.0000 1.0000 1.0000 1.0000 1.0040 1.0029 1,731.4 12.35 1.78 Radiology 700.2 22.43 1.31 1.0051 1.0000 1.0000 1.0000 1.0000 1.0040 1.0029 706.6 22.52 1.33 Pathology 2,761.9 15.02 3.46 1.0051 1.0000 1.0000 1.0000 1.0000 1.0040 1.0029 2,787.1 15.08 3.50 Mental Health/Substance Abuse 4,499.5 89.62 33.60 1.0051 1.0000 1.0000 1.0000 1.0000 1.0040 1.0029 4,540.5 89.87 34.00 Other Professional 19,813.7 19.18 31.67 1.0051 1.0000 1.0000 1.0000 1.0000 1.0040 1.0029 19,994.4 19.24 32.05
Subtotal 36,074.5 $ 38.00 $ 114.24 36,400.7 $ 38.12 $ 115.62
Total Claims/Benefit Cost 62,022.7 $ 56.61 $ 292.58 62,460.6 $ 56.42 $ 293.68
Category of Service
Milliman, Inc.Page 14 of 15

6/22/2016
Appendix 6
South Carolina Department of Health and Human ServicesSFY 2017 Medicaid Managed Care Capitation Rate Development
MCO Base Experience Data Adjustments - SFY 2015Rate Cell: KICK (MG2/NG2) SFY 2015 Deliveries: 27,037
SFY 2015 Unadjusted Data 2015 Adjustments SFY 2015 Adjusted Data
Utilization Cost per Cost per Completion Program Program Mgd Care Mgd Care Other Base Other Base Utilization Cost per Cost perPer 1,000 Service Delivery Adj Util Adj Util Adj Cost Adj Util Adj Cost Adj Util Adj Cost Per 1,000 Service Delivery
Inpatient HospitalInpatient Maternity Delivery 2,490.2 1,631.30 4,062.23 1.0031 1.0000 1.0000 1.0000 0.9900 1.0071 1.0029 2,515.6 1,619.67 4,074.50
Subtotal 2,490.2 $ 1,631.30 $ 4,062.23 2,515.6 $ 1,619.67 $ 4,074.50
Outpatient HospitalOutpatient Hospital - Maternity 10.1 281.53 2.83 1.0050 1.0000 1.0000 1.0000 1.0000 8.8597 1.0029 89.6 282.12 25.27
Subtotal 10.1 $ 281.53 $ 2.83 89.6 $ 282.12 $ 25.27
PhysicianMaternity – Delivery 965.7 $ 1,044.74 $ 1,008.88 1.0081 1.0000 1.0000 1.0000 1.0009 1.0037 1.0029 977.1 $ 1,048.71 $ 1,024.70Maternity – Delivery - Anesthesia 1,310.6 287.33 376.58 1.0081 1.0000 1.0000 1.0000 1.0000 1.0037 1.0029 1,326.2 288.16 382.14 Maternity - Office Visits 9,404.0 52.90 497.47 1.0081 1.0000 1.0000 1.0000 1.0000 1.0037 1.0029 9,515.3 53.05 504.81 Maternity - Radiology 3,721.8 75.03 279.23 1.0081 1.0000 1.0000 1.0000 1.0000 1.0037 1.0029 3,765.8 75.24 283.35 Maternity - Non-Delivery 4.5 84.38 0.38 1.0081 1.0000 1.0000 1.0000 1.0000 1.0038 1.0029 4.6 84.46 0.39
Subtotal 15,406.7 $ 140.36 $ 2,162.54 15,588.9 $ 140.83 $ 2,195.39
Total Claims/Benefit Cost 17,907.0 $ 347.77 $ 6,227.60 18,194.1 $ 346.00 $ 6,295.16
Category of Service
Milliman, Inc.Page 15 of 15

Milliman Client Report
State Fiscal Year 2017 Rate Certification
SCM01-64
June 22, 2016
APPENDIX 7: SFY 2017 CAPITATION RATE DEVELOPMENT

6/22/2016
Appendix 7
South Carolina Department of Health and Human ServicesSFY 2017 Medicaid Managed Care Capitation Rate Development
July 2016 to June 2017 Capitation Rates
Rate Cell: TANF - 0 - 2 Months, Male & Female (AH3) November 2015 Membership: 6,655
SFY 2015 Adjusted Data Prospective Adjustments SFY 2017
Utilization Cost per Utilization Unit Cost Program Program Reimbursement RBHS Utilization Cost perPer 1,000 Service PMPM Trend Trend Adj Util Adj Cost Adjustment Add On Per 1,000 Service PMPM
Inpatient HospitalI/P Medical/Surgical/Non-Delivery 8,048.1 $ 1,515.77 $ 1,016.59 1.0000 1.0000 1.0000 1.0000 0.9354 $ 0.00 8,048.1 $ 1,417.85 $ 950.92I/P Well Newborn 7,351.5 555.56 340.35 1.0000 1.0000 1.0000 1.0000 1.0081 0.00 7,351.5 560.06 343.11 Mental Health/Substance Abuse 10.7 442.74 0.39 1.0000 1.0000 1.0000 1.0000 1.0038 0.00 10.7 444.43 0.39 Other Inpatient 217.0 1,186.92 21.46 1.0000 1.0000 1.0000 1.0000 0.9696 - 217.0 1,150.84 20.81
Subtotal 15,627.3 $ 1,058.76 $ 1,378.80 $ 0.00 15,627.3 $ 1,009.95 $ 1,315.23
Outpatient HospitalSurgery 55.6 $ 1,019.89 $ 4.73 1.0404 1.0000 1.0000 1.0000 0.9872 $ 0.00 57.9 $ 1,006.83 $ 4.86Non-Surg - Emergency Room 804.8 278.39 18.67 1.0404 1.0000 1.0000 1.0000 0.9947 - 837.3 276.92 19.32 Non-Surg - Other 1,515.8 105.64 13.34 1.0404 1.0000 1.0000 1.0000 1.0015 - 1,577.0 105.80 13.90 Observation Room 45.5 570.76 2.16 1.0404 1.0000 1.0000 1.0000 0.9946 - 47.3 567.68 2.24 Treatment/Therapy/Testing 896.1 65.63 4.90 1.0404 1.0000 1.0000 1.0000 0.9927 0.00 932.3 65.15 5.06Other Outpatient 58.9 90.88 0.45 1.0404 1.0000 1.0000 1.0000 1.0000 - 61.2 90.88 0.46
Subtotal 3,376.7 $ 157.27 $ 44.26 $ 0.00 3,513.1 $ 156.61 $ 45.85
PharmacyPrescription Drugs 3,118.5 23.14 6.01 1.0000 1.1025 1.0000 1.0000 1.0000 - 3,118.5 25.51 6.63
Subtotal 3,118.5 $ 23.14 $ 6.01 $ 0.00 3,118.5 $ 25.51 $ 6.63
AncillariesAmbulance 195.8 236.02 3.85 1.0404 1.0000 1.0000 1.0000 0.9998 0.00 203.7 235.98 4.01Prosthetic/DME 1,525.0 25.27 3.21 1.0404 1.0000 0.9998 1.0001 1.1676 0.00 1,586.3 29.51 3.90Other Ancillaries 876.3 83.00 6.06 1.0404 1.0000 0.9845 1.0548 0.9944 - 897.6 87.05 6.51
Subtotal 2,597.2 $ 60.64 $ 13.12 $ 0.00 2,687.7 $ 64.38 $ 14.42
PhysicianSurgery - I/P and O/P 643.1 $ 169.84 $ 9.10 1.0404 1.0000 0.9785 1.0156 1.0438 $ 0.00 654.7 $ 180.05 $ 9.82Surgery - I/P and O/P - Anesthesia 121.1 157.55 1.59 1.0404 1.0000 1.0000 1.0000 1.1091 0.00 126.0 174.74 1.84 Maternity - Non-Delivery 0.0 0.00 - 1.0404 1.0000 1.0126 1.0000 0.9749 0.00 0.0 0.00 - Hospital Visits 12,432.2 171.78 177.96 1.0404 1.0000 1.0000 1.0000 1.0530 0.00 12,934.5 180.88 194.97 Office Visits 7,231.9 61.76 37.22 1.0404 1.0000 1.0002 1.1110 1.2329 0.03 7,529.8 84.59 53.08 ER Visits 980.2 69.27 5.66 1.0404 1.0000 1.0000 1.0000 1.0410 0.00 1,019.8 72.11 6.13 Immunizations 7,508.8 12.17 7.62 1.0404 1.0000 0.8858 1.0564 1.1173 0.00 6,920.0 14.37 8.29 Radiology 2,256.6 13.13 2.47 1.0404 1.0000 1.0000 1.0000 0.9777 0.00 2,347.7 12.84 2.51 Pathology 1,658.2 9.50 1.31 1.0404 1.0000 0.9752 1.0005 1.0445 0.00 1,682.5 9.92 1.39 Mental Health/Substance Abuse 0.0 0.00 - 1.0404 1.0000 1.0126 1.0000 1.0100 0.57 0.0 0.00 0.57 Other Professional 16,525.0 51.47 70.87 1.0404 1.0000 0.9986 1.0750 1.1877 - 17,168.5 65.71 94.01
Subtotal 49,357.1 $ 76.29 $ 313.81 $ 0.60 50,383.5 $ 88.74 $ 372.61
Total Claims/Benefit Cost 74,076.7 $ 284.46 $ 1,756.00 $ 0.60 75,330.0 $ 279.53 $ 1,754.74Supplemental Teaching Payment 170.27 Administrative Cost Allowance 152.58 Capitation Rate $ 2,077.59
Category of Service
Milliman, Inc.Page 1 of 15

6/22/2016
Appendix 7
South Carolina Department of Health and Human ServicesSFY 2017 Medicaid Managed Care Capitation Rate Development
July 2016 to June 2017 Capitation Rates
Rate Cell: TANF - 3 - 12 Months, Male & Female (AI3) November 2015 Membership: 28,998
SFY 2015 Adjusted Data Prospective Adjustments SFY 2017
Utilization Cost per Utilization Unit Cost Program Program Reimbursement RBHS Utilization Cost perPer 1,000 Service PMPM Trend Trend Adj Util Adj Cost Adjustment Add On Per 1,000 Service PMPM
Inpatient HospitalI/P Medical/Surgical/Non-Delivery 182.4 $ 1,859.65 $ 28.27 1.0000 1.0000 1.0000 1.0000 1.0079 $ 0.00 182.4 $ 1,874.34 $ 28.49I/P Well Newborn 0.8 303.34 0.02 1.0000 1.0000 1.0000 1.0000 0.9889 0.00 0.8 299.97 0.02 Mental Health/Substance Abuse 0.0 0.00 - 1.0000 1.0000 1.0000 1.0000 1.0000 0.00 0.0 0.00 - Other Inpatient 6.3 2,029.36 1.06 1.0000 1.0000 1.0000 1.0000 0.9699 - 6.3 1,968.27 1.03
Subtotal 189.5 $ 1,858.64 $ 29.35 $ 0.00 189.5 $ 1,870.74 $ 29.54
Outpatient HospitalSurgery 82.5 $ 1,597.30 $ 10.98 1.0404 1.0000 1.0000 1.0000 0.9888 $ 0.00 85.8 $ 1,579.41 $ 11.29Non-Surg - Emergency Room 1,025.1 298.27 25.48 1.0404 1.0000 1.0000 1.0000 0.9953 - 1,066.5 296.87 26.38 Non-Surg - Other 777.1 120.22 7.79 1.0404 1.0000 1.0000 1.0000 0.9937 - 808.5 119.46 8.05 Observation Room 23.4 610.67 1.19 1.0404 1.0000 1.0000 1.0000 0.9939 - 24.4 606.94 1.23 Treatment/Therapy/Testing 322.8 127.24 3.42 1.0404 1.0000 1.0000 1.0000 0.9909 0.00 335.9 126.08 3.53Other Outpatient 3.2 151.02 0.04 1.0404 1.0000 1.0000 1.0000 1.0000 - 3.3 151.02 0.04
Subtotal 2,234.1 $ 262.63 $ 48.90 $ 0.00 2,324.3 $ 260.86 $ 50.53
PharmacyPrescription Drugs 5,885.1 34.46 16.90 1.0000 1.1025 1.0000 1.0000 1.0000 - 5,885.1 37.99 18.63
Subtotal 5,885.1 $ 34.46 $ 16.90 $ 0.00 5,885.1 $ 37.99 $ 18.63
AncillariesAmbulance 91.8 117.81 0.90 1.0404 1.0000 1.0000 1.0000 1.0010 0.00 95.5 117.93 0.94Prosthetic/DME 1,883.6 18.77 2.95 1.0404 1.0000 0.9997 1.0002 1.1524 0.00 1,959.1 21.64 3.53Other Ancillaries 395.2 58.41 1.92 1.0404 1.0000 0.9720 1.0698 1.0134 - 399.7 63.33 2.11
Subtotal 2,370.7 $ 29.21 $ 5.77 $ 0.00 2,454.3 $ 32.17 $ 6.58
PhysicianSurgery - I/P and O/P 297.3 $ 171.15 $ 4.24 1.0404 1.0000 0.9923 1.0061 1.0903 $ 0.00 306.9 $ 187.74 $ 4.80Surgery - I/P and O/P - Anesthesia 146.7 100.96 1.23 1.0404 1.0000 1.0000 1.0000 1.2822 0.00 152.7 129.45 1.65 Maternity - Non-Delivery 0.0 0.00 - 1.0404 1.0000 1.0126 1.0000 0.9749 0.00 0.0 0.00 - Hospital Visits 524.8 188.81 8.26 1.0404 1.0000 1.0000 1.0000 1.0315 0.00 546.0 194.76 8.86 Office Visits 4,729.4 61.93 24.41 1.0404 1.0000 1.0008 1.1253 1.2033 0.19 4,951.6 83.86 34.60 ER Visits 1,105.1 64.54 5.94 1.0404 1.0000 1.0000 1.0000 1.0299 0.00 1,149.7 66.46 6.37 Immunizations 7,687.2 12.51 8.01 1.0404 1.0000 0.8921 1.0470 1.1074 0.00 7,134.8 14.50 8.62 Radiology 640.2 15.17 0.81 1.0404 1.0000 1.0000 1.0000 0.9857 0.00 666.0 14.96 0.83 Pathology 2,081.6 12.25 2.12 1.0404 1.0000 0.9487 1.0187 1.0686 0.00 2,054.6 13.33 2.28 Mental Health/Substance Abuse 0.6 195.44 0.01 1.0404 1.0000 1.0000 1.0000 0.9622 0.87 56.2 188.05 0.88 Other Professional 6,236.0 48.72 25.32 1.0404 1.0000 0.9915 1.1047 1.2171 0.05 6,441.9 65.50 35.16
Subtotal 23,448.9 $ 41.12 $ 80.36 $ 1.11 23,460.5 $ 53.23 $ 104.06
Total Claims/Benefit Cost 34,128.3 $ 63.74 $ 181.27 $ 1.11 34,313.7 $ 73.21 $ 209.34Supplemental Teaching Payment 27.18 Administrative Cost Allowance 28.55 Capitation Rate $ 265.07
Category of Service
Milliman, Inc.Page 2 of 15

6/22/2016
Appendix 7
South Carolina Department of Health and Human ServicesSFY 2017 Medicaid Managed Care Capitation Rate Development
July 2016 to June 2017 Capitation Rates
Rate Cell: TANF - Age 1 - 6, Male & Female (AB3) November 2015 Membership: 166,776
SFY 2015 Adjusted Data Prospective Adjustments SFY 2017
Utilization Cost per Utilization Unit Cost Program Program Reimbursement RBHS Utilization Cost perPer 1,000 Service PMPM Trend Trend Adj Util Adj Cost Adjustment Add On Per 1,000 Service PMPM
Inpatient HospitalI/P Medical/Surgical/Non-Delivery 46.4 $ 1,827.95 $ 7.07 1.0000 1.0000 1.0000 1.0000 1.0221 $ 0.00 46.4 $ 1,868.35 $ 7.22I/P Well Newborn 0.0 0.00 - 1.0000 1.0000 1.0000 1.0000 1.0000 0.00 0.0 0.00 - Mental Health/Substance Abuse 0.4 1,134.57 0.04 1.0000 1.0000 1.0000 1.0000 0.8249 0.00 0.4 935.91 0.03 Other Inpatient 1.4 2,005.46 0.24 1.0000 1.0000 1.0000 1.0000 0.9723 - 1.4 1,949.91 0.23
Subtotal 48.3 $ 1,826.90 $ 7.35 $ 0.00 48.3 $ 1,862.30 $ 7.49
Outpatient HospitalSurgery 68.6 $ 1,335.44 $ 7.63 1.0404 1.0000 1.0000 1.0000 0.9949 $ 0.00 71.3 $ 1,328.63 $ 7.90Non-Surg - Emergency Room 582.9 306.70 14.90 1.0404 1.0000 1.0000 1.0000 0.9958 - 606.5 305.42 15.44 Non-Surg - Other 291.4 113.59 2.76 1.0404 1.0000 1.0000 1.0000 0.9897 - 303.2 112.42 2.84 Observation Room 7.5 728.86 0.46 1.0404 1.0000 1.0000 1.0000 0.9911 - 7.8 722.37 0.47 Treatment/Therapy/Testing 208.6 154.48 2.69 1.0404 1.0000 1.0000 1.0000 0.9897 0.00 217.1 152.89 2.77Other Outpatient 5.1 270.93 0.11 1.0404 1.0000 1.0000 1.0000 1.0000 - 5.3 270.93 0.12
Subtotal 1,164.1 $ 294.26 $ 28.54 $ 0.00 1,211.1 $ 292.59 $ 29.53
PharmacyPrescription Drugs 5,131.8 40.29 17.23 1.0000 1.1025 1.0000 1.0000 1.0000 - 5,131.8 44.42 18.99
Subtotal 5,131.8 $ 40.29 $ 17.23 $ 0.00 5,131.8 $ 44.42 $ 18.99
AncillariesAmbulance 49.6 103.13 0.43 1.0404 1.0000 1.0000 1.0000 0.9994 0.00 51.6 103.07 0.44Prosthetic/DME 796.9 13.31 0.88 1.0404 1.0000 0.9991 1.0004 1.1200 0.00 828.4 14.91 1.03Other Ancillaries 331.4 47.81 1.32 1.0404 1.0000 0.9888 1.0552 1.1270 0.03 347.3 56.86 1.65
Subtotal 1,178.0 $ 26.80 $ 2.63 $ 0.03 1,227.3 $ 30.49 $ 3.12
PhysicianSurgery - I/P and O/P 219.4 $ 138.08 $ 2.52 1.0404 1.0000 0.9920 1.0054 1.0575 $ 0.00 226.5 $ 146.80 $ 2.77Surgery - I/P and O/P - Anesthesia 123.3 92.01 0.95 1.0404 1.0000 1.0000 1.0000 1.1489 0.00 128.3 105.71 1.13 Maternity - Non-Delivery 0.0 0.00 - 1.0404 1.0000 1.0000 1.0000 0.9749 0.00 0.0 0.00 - Hospital Visits 67.9 111.95 0.63 1.0404 1.0000 1.0000 1.0000 1.0547 0.00 70.7 118.07 0.70 Office Visits 2,972.1 61.30 15.18 1.0404 1.0000 1.0007 1.1293 1.2030 0.18 3,120.3 83.28 21.65 ER Visits 626.1 62.68 3.27 1.0404 1.0000 1.0000 1.0000 1.0295 0.00 651.4 64.53 3.50 Immunizations 1,298.2 12.58 1.36 1.0404 1.0000 0.8885 1.0428 1.1478 0.00 1,200.1 15.06 1.51 Radiology 349.8 16.40 0.48 1.0404 1.0000 1.0000 1.0000 0.9906 0.00 363.9 16.24 0.49 Pathology 1,803.1 11.41 1.71 1.0404 1.0000 0.9472 1.0174 1.0422 0.00 1,776.9 12.10 1.79 Mental Health/Substance Abuse 102.3 102.43 0.87 1.0404 1.0000 0.9994 1.0214 1.0318 5.42 708.8 107.95 6.38 Other Professional 5,843.8 27.52 13.40 1.0404 1.0000 0.9933 1.0486 1.1593 0.11 6,078.6 33.46 16.95
Subtotal 13,406.1 $ 36.15 $ 40.39 $ 5.71 14,325.5 $ 47.64 $ 56.87
Total Claims/Benefit Cost 20,928.2 $ 55.12 $ 96.14 $ 5.74 21,943.9 $ 63.44 $ 116.00Supplemental Teaching Payment 6.28 Administrative Cost Allowance 15.82 Capitation Rate $ 138.10
Category of Service
Milliman, Inc.Page 3 of 15

6/22/2016
Appendix 7
South Carolina Department of Health and Human ServicesSFY 2017 Medicaid Managed Care Capitation Rate Development
July 2016 to June 2017 Capitation Rates
Rate Cell: TANF - Age 7 - 13, Male & Female (AC3) November 2015 Membership: 187,516
SFY 2015 Adjusted Data Prospective Adjustments SFY 2017
Utilization Cost per Utilization Unit Cost Program Program Reimbursement RBHS Utilization Cost perPer 1,000 Service PMPM Trend Trend Adj Util Adj Cost Adjustment Add On Per 1,000 Service PMPM
Inpatient HospitalI/P Medical/Surgical/Non-Delivery 31.1 $ 2,180.30 $ 5.66 1.0000 1.0000 1.0000 1.0000 1.0295 $ 0.00 31.1 $ 2,244.61 $ 5.82I/P Well Newborn 0.0 0.00 - 1.0000 1.0000 1.0000 1.0000 1.0000 0.00 0.0 0.00 - Mental Health/Substance Abuse 13.6 774.86 0.88 1.0000 1.0000 1.0000 1.0000 0.9047 0.00 13.6 701.02 0.80 Other Inpatient 0.9 1,656.42 0.12 1.0000 1.0000 1.0000 1.0000 0.9148 - 0.9 1,515.29 0.11
Subtotal 45.7 $ 1,750.71 $ 6.66 $ 0.00 45.7 $ 1,769.77 $ 6.73
Outpatient HospitalSurgery 40.5 $ 1,337.52 $ 4.51 1.0404 1.0000 1.0000 1.0000 0.9939 $ 0.00 42.1 $ 1,329.36 $ 4.66Non-Surg - Emergency Room 347.2 311.49 9.01 1.0404 1.0000 1.0000 1.0000 0.9965 - 361.2 310.40 9.34 Non-Surg - Other 189.2 113.77 1.79 1.0404 1.0000 1.0000 1.0000 0.9855 - 196.9 112.12 1.84 Observation Room 5.1 587.53 0.25 1.0404 1.0000 1.0000 1.0000 0.9937 - 5.3 583.83 0.26 Treatment/Therapy/Testing 174.0 179.53 2.60 1.0404 1.0000 1.0000 1.0000 0.9914 0.00 181.0 177.99 2.68Other Outpatient 2.1 302.80 0.05 1.0404 1.0000 1.0000 1.0000 1.0000 - 2.1 302.80 0.05
Subtotal 758.0 $ 288.46 $ 18.22 $ 0.00 788.6 $ 286.73 $ 18.84
PharmacyPrescription Drugs 5,979.2 69.57 34.67 1.0000 1.1144 1.0000 1.0000 1.0000 - 5,979.2 77.53 38.63
Subtotal 5,979.2 $ 69.57 $ 34.67 $ 0.00 5,979.2 $ 77.53 $ 38.63
AncillariesAmbulance 34.7 104.19 0.30 1.0404 1.0000 1.0000 1.0000 0.9991 0.00 36.1 104.10 0.31Prosthetic/DME 1,244.6 8.52 0.88 1.0404 1.0000 0.9997 0.9999 1.1210 0.00 1,294.4 9.55 1.03Other Ancillaries 747.5 31.38 1.95 1.0404 1.0000 0.9984 1.0329 1.1858 0.23 848.2 38.44 2.72
Subtotal 2,026.7 $ 18.59 $ 3.14 $ 0.23 2,178.8 $ 22.37 $ 4.06
PhysicianSurgery - I/P and O/P 167.9 $ 133.64 $ 1.87 1.0404 1.0000 0.9901 1.0062 1.0362 $ 0.00 173.0 $ 139.34 $ 2.01Surgery - I/P and O/P - Anesthesia 52.9 99.03 0.44 1.0404 1.0000 1.0000 1.0000 1.0980 0.00 55.0 108.74 0.50 Maternity - Non-Delivery 0.0 0.00 - 1.0404 1.0000 1.0126 1.0000 0.9749 0.00 0.0 0.00 - Hospital Visits 59.7 87.78 0.44 1.0404 1.0000 1.0000 1.0000 1.0811 0.00 62.1 94.89 0.49 Office Visits 2,352.6 60.27 11.82 1.0404 1.0000 1.0005 1.1389 1.1941 0.68 2,548.4 81.96 17.41 ER Visits 372.9 64.24 2.00 1.0404 1.0000 1.0000 1.0000 1.0326 0.00 388.0 66.34 2.15 Immunizations 566.9 12.76 0.60 1.0404 1.0000 0.8882 1.0300 1.1933 0.00 523.8 15.68 0.68 Radiology 409.2 20.11 0.69 1.0404 1.0000 1.0000 1.0000 0.9929 0.00 425.7 19.97 0.71 Pathology 1,549.1 10.38 1.34 1.0404 1.0000 0.9497 1.0156 1.0488 0.00 1,530.6 11.06 1.41 Mental Health/Substance Abuse 292.6 98.44 2.40 1.0404 1.0000 0.9987 1.0306 1.0177 18.15 2,413.6 103.24 20.77 Other Professional 4,245.3 20.68 7.31 1.0404 1.0000 0.9940 1.0511 1.1365 0.14 4,458.3 24.70 9.18
Subtotal 10,069.0 $ 34.44 $ 28.90 $ 18.97 12,578.5 $ 52.75 $ 55.30
Total Claims/Benefit Cost 18,878.6 $ 58.22 $ 91.59 $ 19.20 21,570.8 $ 68.74 $ 123.56Supplemental Teaching Payment 4.80 Administrative Cost Allowance 16.85 Capitation Rate $ 145.21
Category of Service
Milliman, Inc.Page 4 of 15

6/22/2016
Appendix 7
South Carolina Department of Health and Human ServicesSFY 2017 Medicaid Managed Care Capitation Rate Development
July 2016 to June 2017 Capitation Rates
Rate Cell: TANF - Age 14 - 18, Male (AD1) November 2015 Membership: 51,740
SFY 2015 Adjusted Data Prospective Adjustments SFY 2017
Utilization Cost per Utilization Unit Cost Program Program Reimbursement RBHS Utilization Cost perPer 1,000 Service PMPM Trend Trend Adj Util Adj Cost Adjustment Add On Per 1,000 Service PMPM
Inpatient HospitalI/P Medical/Surgical/Non-Delivery 56.9 $ 2,569.81 $ 12.18 1.0000 1.0000 1.0000 1.0000 1.0301 $ 0.00 56.9 $ 2,647.16 $ 12.54I/P Well Newborn 0.0 0.00 - 1.0000 1.0000 1.0000 1.0000 1.0000 0.00 0.0 0.00 - Mental Health/Substance Abuse 29.9 644.04 1.60 1.0000 1.0000 1.0000 1.0000 0.9588 0.00 29.9 617.51 1.54 Other Inpatient 2.1 3,081.55 0.53 1.0000 1.0000 1.0000 1.0000 0.9289 - 2.1 2,862.45 0.49
Subtotal 88.8 $ 1,933.92 $ 14.31 $ 0.00 88.8 $ 1,969.47 $ 14.57
Outpatient HospitalSurgery 61.6 $ 1,372.45 $ 7.04 1.0404 1.0000 1.0000 1.0000 0.9931 $ 0.00 64.1 $ 1,362.98 $ 7.28Non-Surg - Emergency Room 394.5 327.51 10.77 1.0404 1.0000 1.0000 1.0000 0.9969 - 410.5 326.49 11.17 Non-Surg - Other 130.9 118.87 1.30 1.0404 1.0000 1.0000 1.0000 0.9837 - 136.2 116.93 1.33 Observation Room 2.7 692.77 0.16 1.0404 1.0000 1.0000 1.0000 0.9926 - 2.8 687.65 0.16 Treatment/Therapy/Testing 205.8 241.88 4.15 1.0404 1.0000 1.0000 1.0000 0.9912 0.00 214.2 239.75 4.28Other Outpatient 5.0 248.82 0.10 1.0404 1.0000 1.0000 1.0000 1.0000 - 5.2 248.82 0.11
Subtotal 800.6 $ 352.49 $ 23.52 $ 0.00 832.9 $ 350.38 $ 24.32
PharmacyPrescription Drugs 5,392.2 73.24 32.91 1.0000 1.1354 1.0000 1.0000 1.0000 - 5,392.2 83.16 37.37
Subtotal 5,392.2 $ 73.24 $ 32.91 $ 0.00 5,392.2 $ 83.16 $ 37.37
AncillariesAmbulance 78.8 103.01 0.68 1.0404 1.0000 1.0000 1.0000 0.9995 0.00 81.9 102.96 0.70Prosthetic/DME 1,361.3 10.54 1.20 1.0404 1.0000 0.9997 0.9998 1.1028 0.00 1,415.8 11.63 1.37Other Ancillaries 649.9 31.69 1.72 1.0404 1.0000 0.9978 1.0275 1.1845 0.26 755.6 38.56 2.43
Subtotal 2,089.9 $ 20.60 $ 3.59 $ 0.26 2,253.4 $ 23.98 $ 4.50
PhysicianSurgery - I/P and O/P 238.9 $ 147.23 $ 2.93 1.0404 1.0000 0.9964 1.0021 1.0684 $ 0.00 247.6 $ 157.63 $ 3.25Surgery - I/P and O/P - Anesthesia 66.2 114.93 0.63 1.0404 1.0000 1.0000 1.0000 1.1654 0.00 68.9 133.94 0.77 Maternity - Non-Delivery 0.0 0.00 - 1.0404 1.0000 1.0126 1.0000 0.9749 0.00 0.0 0.00 - Hospital Visits 106.5 85.50 0.76 1.0404 1.0000 1.0000 1.0003 1.0596 0.00 110.8 90.63 0.84 Office Visits 1,904.2 60.50 9.60 1.0404 1.0000 1.0003 1.1135 1.1697 0.73 2,092.9 78.80 13.74 ER Visits 433.8 70.25 2.54 1.0404 1.0000 1.0000 1.0000 1.0291 0.00 451.3 72.30 2.72 Immunizations 334.6 13.05 0.36 1.0404 1.0000 0.8757 1.0308 1.2152 0.00 304.8 16.34 0.42 Radiology 656.2 24.71 1.35 1.0404 1.0000 1.0000 1.0000 0.9941 0.00 682.7 24.56 1.40 Pathology 1,492.2 11.95 1.49 1.0404 1.0000 0.9608 1.0191 1.0709 0.00 1,491.6 13.04 1.62 Mental Health/Substance Abuse 704.5 65.15 3.82 1.0404 1.0000 0.9999 1.0128 0.9727 14.09 3,367.0 64.19 18.01 Other Professional 3,631.2 21.91 6.63 1.0404 1.0000 0.9951 1.0428 1.1657 0.09 3,799.9 26.64 8.44
Subtotal 9,568.1 $ 37.78 $ 30.12 $ 14.91 12,617.5 $ 48.69 $ 51.20
Total Claims/Benefit Cost 17,939.6 $ 69.86 $ 104.44 $ 15.17 21,184.8 $ 74.75 $ 131.96Supplemental Teaching Payment 5.26 Administrative Cost Allowance 18.00 Capitation Rate $ 155.22
Category of Service
Milliman, Inc.Page 5 of 15

6/22/2016
Appendix 7
South Carolina Department of Health and Human ServicesSFY 2017 Medicaid Managed Care Capitation Rate Development
July 2016 to June 2017 Capitation Rates
Rate Cell: TANF - Age 14 - 18, Female (AD2) November 2015 Membership: 53,550
SFY 2015 Adjusted Data Prospective Adjustments SFY 2017
Utilization Cost per Utilization Unit Cost Program Program Reimbursement RBHS Utilization Cost perPer 1,000 Service PMPM Trend Trend Adj Util Adj Cost Adjustment Add On Per 1,000 Service PMPM
Inpatient HospitalI/P Medical/Surgical/Non-Delivery 54.7 $ 2,133.92 $ 9.72 1.0000 1.0000 1.0000 1.0000 1.0311 $ 0.00 54.7 $ 2,200.28 $ 10.03I/P Well Newborn 0.0 0.00 - 1.0000 1.0000 1.0000 1.0000 1.0000 0.00 0.0 0.00 - Mental Health/Substance Abuse 43.9 698.18 2.55 1.0000 1.0000 1.0000 1.0000 0.9636 0.00 43.9 672.76 2.46 Other Inpatient 4.1 1,287.35 0.44 1.0000 1.0000 1.0000 1.0000 1.0020 - 4.1 1,289.93 0.44
Subtotal 102.6 $ 1,486.59 $ 12.72 $ 0.00 102.6 $ 1,511.18 $ 12.93
Outpatient HospitalSurgery 76.1 $ 1,167.33 $ 7.40 1.0404 1.0000 1.0000 1.0000 0.9949 $ 0.00 79.2 $ 1,161.37 $ 7.66Non-Surg - Emergency Room 643.3 325.35 17.44 1.0404 1.0000 1.0000 1.0000 0.9972 - 669.3 324.44 18.10 Non-Surg - Other 224.1 131.61 2.46 1.0404 1.0000 1.0000 1.0000 0.9881 - 233.1 130.05 2.53 Observation Room 16.2 369.71 0.50 1.0404 1.0000 1.0000 1.0000 0.9934 - 16.8 367.27 0.51 Treatment/Therapy/Testing 382.6 184.10 5.87 1.0404 1.0000 1.0000 1.0000 0.9938 0.00 398.0 182.95 6.07Other Outpatient 7.7 324.33 0.21 1.0404 1.0000 1.0000 1.0000 1.0000 - 8.0 324.33 0.22
Subtotal 1,349.9 $ 301.16 $ 33.88 $ 0.00 1,404.4 $ 299.77 $ 35.08
PharmacyPrescription Drugs 7,779.1 44.96 29.15 1.0000 1.1354 1.0000 1.0000 1.0000 - 7,779.1 51.05 33.09
Subtotal 7,779.1 $ 44.96 $ 29.15 $ 0.00 7,779.1 $ 51.05 $ 33.09
AncillariesAmbulance 118.2 90.78 0.89 1.0404 1.0000 1.0000 1.0000 0.9982 0.00 123.0 90.61 0.93Prosthetic/DME 1,834.0 8.16 1.25 1.0404 1.0000 0.9998 0.9999 1.1188 0.00 1,907.8 9.13 1.45Other Ancillaries 1,096.0 43.15 3.94 1.0404 1.0000 0.9978 1.0158 1.0880 0.25 1,200.7 47.69 4.77
Subtotal 3,048.3 $ 23.95 $ 6.08 $ 0.25 3,231.4 $ 26.56 $ 7.15
PhysicianSurgery - I/P and O/P 228.5 $ 139.67 $ 2.66 1.0404 1.0000 0.9878 1.0057 1.0602 $ 0.00 234.9 $ 148.92 $ 2.91Surgery - I/P and O/P - Anesthesia 70.2 106.61 0.62 1.0404 1.0000 1.0000 1.0000 1.3730 0.00 73.0 146.38 0.89 Maternity - Non-Delivery 31.5 35.65 0.09 1.0404 1.0000 1.0000 1.0000 0.9730 0.00 32.7 34.69 0.09 Hospital Visits 142.3 72.70 0.86 1.0404 1.0000 1.0000 1.0000 1.1098 0.00 148.1 80.69 1.00 Office Visits 2,807.2 60.16 14.07 1.0404 1.0000 1.0005 1.1386 1.1679 0.78 3,039.1 79.99 20.26 ER Visits 684.9 73.99 4.22 1.0404 1.0000 1.0000 1.0000 1.0325 0.00 712.6 76.39 4.54 Immunizations 354.6 13.01 0.38 1.0404 1.0000 0.8721 1.0306 1.2066 0.00 321.7 16.18 0.43 Radiology 700.8 30.43 1.78 1.0404 1.0000 1.0000 1.0000 0.9905 0.00 729.1 30.14 1.83 Pathology 3,842.3 12.14 3.89 1.0404 1.0000 0.9511 1.0293 1.1366 0.00 3,802.0 14.20 4.50 Mental Health/Substance Abuse 451.9 71.19 2.68 1.0404 1.0000 0.9995 1.0295 1.0237 14.92 2,856.2 75.03 17.86 Other Professional 24,198.1 3.49 7.04 1.0404 1.0000 0.9986 1.0390 1.1290 0.05 25,286.9 4.10 8.64
Subtotal 33,512.2 $ 13.72 $ 38.31 $ 15.75 37,236.2 $ 20.29 $ 62.95
Total Claims/Benefit Cost 45,792.1 $ 31.48 $ 120.13 $ 16.00 49,753.8 $ 36.47 $ 151.20Supplemental Teaching Payment 7.80 Administrative Cost Allowance 20.62 Capitation Rate $ 179.62
Category of Service
Milliman, Inc.Page 6 of 15

6/22/2016
Appendix 7
South Carolina Department of Health and Human ServicesSFY 2017 Medicaid Managed Care Capitation Rate Development
July 2016 to June 2017 Capitation Rates
Rate Cell: TANF - Age 19 - 44, Male (AE1) November 2015 Membership: 21,165
SFY 2015 Adjusted Data Prospective Adjustments SFY 2017
Utilization Cost per Utilization Unit Cost Program Program Reimbursement RBHS Utilization Cost perPer 1,000 Service PMPM Trend Trend Adj Util Adj Cost Adjustment Add On Per 1,000 Service PMPM
Inpatient HospitalI/P Medical/Surgical/Non-Delivery 187.7 $ 2,724.43 $ 42.62 1.0000 1.0000 1.0000 1.0000 1.0127 $ 0.00 187.7 $ 2,759.03 $ 43.16I/P Well Newborn 0.0 0.00 - 1.0000 1.0000 1.0000 1.0000 1.0000 0.00 0.0 0.00 - Mental Health/Substance Abuse 63.6 688.92 3.65 1.0000 1.0000 1.0000 1.0000 1.0056 0.00 63.6 692.77 3.67 Other Inpatient 5.2 1,039.38 0.45 1.0000 1.0000 1.0000 1.0000 0.8980 - 5.2 933.37 0.40
Subtotal 256.5 $ 2,185.75 $ 46.72 $ 0.00 256.5 $ 2,209.88 $ 47.24
Outpatient HospitalSurgery 119.3 $ 1,499.48 $ 14.91 1.0404 1.0000 1.0000 1.0000 0.9955 $ 0.00 124.1 $ 1,492.73 $ 15.44Non-Surg - Emergency Room 875.9 334.03 24.38 1.0404 1.0000 1.0000 1.0000 0.9986 - 911.3 333.57 25.33 Non-Surg - Other 102.7 123.89 1.06 1.0404 1.0000 1.0000 1.0000 0.9859 - 106.9 122.14 1.09 Observation Room 4.8 1,039.48 0.41 1.0404 1.0000 1.0000 1.0000 0.9856 - 4.9 1,024.51 0.42 Treatment/Therapy/Testing 327.3 370.59 10.11 1.0404 1.0000 1.0000 1.0000 0.9925 0.00 340.5 367.81 10.44Other Outpatient 10.3 352.40 0.30 1.0404 1.0000 1.0000 1.0000 1.0000 - 10.7 352.40 0.32
Subtotal 1,440.3 $ 426.34 $ 51.17 $ 0.00 1,498.5 $ 424.69 $ 53.03
PharmacyPrescription Drugs 8,187.9 54.34 37.07 1.0000 1.1328 1.0000 1.0000 1.0000 - 8,187.9 61.55 42.00
Subtotal 8,187.9 $ 54.34 $ 37.07 $ 0.00 8,187.9 $ 61.55 $ 42.00
AncillariesAmbulance 204.6 102.55 1.75 1.0404 1.0000 0.9996 1.0004 0.9987 0.00 212.8 102.46 1.82Prosthetic/DME 2,324.6 11.72 2.27 1.0404 1.0000 1.0000 1.0000 1.1075 0.00 2,418.5 12.98 2.62Other Ancillaries 271.2 53.35 1.21 1.0404 1.0000 0.9998 1.0203 1.1666 0.19 318.0 63.50 1.68
Subtotal 2,800.4 $ 22.39 $ 5.22 $ 0.19 2,949.3 $ 24.88 $ 6.12
PhysicianSurgery - I/P and O/P 438.0 $ 168.05 $ 6.13 1.0404 1.0000 0.9978 1.0016 1.0641 $ 0.00 454.7 $ 179.11 $ 6.79Surgery - I/P and O/P - Anesthesia 153.6 108.52 1.39 1.0404 1.0000 1.0000 1.0000 1.1864 0.00 159.9 128.75 1.72 Maternity - Non-Delivery 0.0 0.00 - 1.0404 1.0000 1.0126 1.0000 0.9749 0.00 0.0 0.00 - Hospital Visits 330.4 75.30 2.07 1.0404 1.0000 1.0000 1.0000 1.1090 0.00 343.8 83.51 2.39 Office Visits 2,274.8 61.39 11.64 1.0404 1.0000 1.0005 1.0959 1.1422 0.47 2,441.3 76.84 15.63 ER Visits 982.7 78.12 6.40 1.0404 1.0000 1.0000 1.0000 1.0231 0.00 1,022.4 79.92 6.81 Immunizations 81.1 14.46 0.10 1.0404 1.0000 0.9481 1.0287 0.9891 0.00 80.0 14.71 0.10 Radiology 1,265.0 31.00 3.27 1.0404 1.0000 1.0000 1.0000 0.9939 0.00 1,316.1 30.81 3.38 Pathology 3,327.1 14.68 4.07 1.0404 1.0000 0.9816 1.0122 1.0702 0.00 3,397.8 15.90 4.50 Mental Health/Substance Abuse 518.2 54.05 2.33 1.0404 1.0000 0.9996 1.0217 1.0110 3.00 1,183.7 55.83 5.51 Other Professional 4,589.3 12.40 4.74 1.0404 1.0000 0.9967 1.0071 1.0223 0.01 4,768.4 12.77 5.07
Subtotal 13,960.2 $ 36.23 $ 42.14 $ 3.48 15,168.0 $ 41.06 $ 51.90
Total Claims/Benefit Cost 26,645.3 $ 82.12 $ 182.33 $ 3.67 28,060.2 $ 85.65 $ 200.28Supplemental Teaching Payment 8.06 Administrative Cost Allowance 22.25 Capitation Rate $ 230.59
Category of Service
Milliman, Inc.Page 7 of 15

6/22/2016
Appendix 7
South Carolina Department of Health and Human ServicesSFY 2017 Medicaid Managed Care Capitation Rate Development
July 2016 to June 2017 Capitation Rates
Rate Cell: TANF - Age 19 - 44, Female (AE2) November 2015 Membership: 91,840
SFY 2015 Adjusted Data Prospective Adjustments SFY 2017
Utilization Cost per Utilization Unit Cost Program Program Reimbursement RBHS Utilization Cost perPer 1,000 Service PMPM Trend Trend Adj Util Adj Cost Adjustment Add On Per 1,000 Service PMPM
Inpatient HospitalI/P Medical/Surgical/Non-Delivery 254.6 $ 2,099.45 $ 44.55 1.0000 1.0000 1.0000 1.0000 1.0206 $ 0.00 254.6 $ 2,142.70 $ 45.46I/P Well Newborn 0.0 0.00 - 1.0000 1.0000 1.0000 1.0000 1.0000 0.00 0.0 0.00 - Mental Health/Substance Abuse 53.6 760.71 3.40 1.0000 1.0000 1.0000 1.0000 0.9956 0.00 53.6 757.37 3.38 Other Inpatient 11.0 1,986.96 1.81 1.0000 1.0000 1.0000 1.0000 0.9943 - 11.0 1,975.64 1.80
Subtotal 319.2 $ 1,870.66 $ 49.76 $ 0.00 319.2 $ 1,904.36 $ 50.65
Outpatient HospitalSurgery 246.9 $ 1,267.23 $ 26.08 1.0404 1.0000 1.0000 1.0000 0.9949 $ 0.00 256.9 $ 1,260.77 $ 26.99Non-Surg - Emergency Room 1,481.7 337.86 41.72 1.0404 1.0000 1.0000 1.0000 0.9975 - 1,541.5 337.02 43.29 Non-Surg - Other 358.9 135.76 4.06 1.0404 1.0000 1.0000 1.0000 0.9921 - 373.4 134.69 4.19 Observation Room 45.5 321.40 1.22 1.0404 1.0000 1.0000 1.0000 0.9923 - 47.4 318.92 1.26 Treatment/Therapy/Testing 871.5 235.27 17.09 1.0404 1.0000 1.0000 1.0000 0.9909 0.00 906.7 233.13 17.62Other Outpatient 23.5 330.62 0.65 1.0404 1.0000 1.0000 1.0000 0.9962 - 24.5 329.36 0.67
Subtotal 3,028.0 $ 359.87 $ 90.81 $ 0.00 3,150.4 $ 358.14 $ 94.02
PharmacyPrescription Drugs 14,520.5 45.98 55.64 1.0000 1.1328 1.0000 1.0000 1.0000 - 14,520.5 52.09 63.03
Subtotal 14,520.5 $ 45.98 $ 55.64 $ 0.00 14,520.5 $ 52.09 $ 63.03
AncillariesAmbulance 312.4 88.60 2.31 1.0404 1.0000 1.0000 1.0000 0.9998 0.00 325.0 88.58 2.40Prosthetic/DME 1,806.2 12.81 1.93 1.0404 1.0000 0.9997 1.0001 1.1079 0.00 1,878.7 14.19 2.22Other Ancillaries 475.2 112.13 4.44 1.0404 1.0000 0.9936 1.0198 0.9988 0.24 516.4 114.22 4.92
Subtotal 2,593.8 $ 40.13 $ 8.67 $ 0.24 2,720.1 $ 42.07 $ 9.54
PhysicianSurgery - I/P and O/P 669.3 $ 166.27 $ 9.27 1.0404 1.0000 0.9960 1.0022 1.0565 $ 0.00 693.6 $ 176.06 $ 10.18Surgery - I/P and O/P - Anesthesia 264.6 107.02 2.36 1.0404 1.0000 0.9999 1.0003 1.1974 0.00 275.2 128.18 2.94 Maternity - Non-Delivery 119.8 42.27 0.42 1.0404 1.0000 1.0000 1.0000 0.9755 0.00 124.7 41.23 0.43 Hospital Visits 426.0 72.86 2.59 1.0404 1.0000 1.0000 1.0001 1.1238 0.00 443.2 81.89 3.02 Office Visits 4,291.1 60.24 21.54 1.0404 1.0000 1.0003 1.1294 1.1489 0.74 4,579.4 78.16 29.83 ER Visits 1,636.1 80.42 10.96 1.0404 1.0000 1.0000 1.0000 1.0278 0.00 1,702.2 82.65 11.72 Immunizations 158.4 13.93 0.18 1.0404 1.0000 0.9447 1.0343 0.9843 0.00 155.7 14.18 0.18 Radiology 1,902.3 36.59 5.80 1.0404 1.0000 1.0000 1.0000 0.9879 0.00 1,979.2 36.15 5.96 Pathology 9,604.3 14.10 11.29 1.0404 1.0000 0.9740 1.0188 1.1264 0.00 9,732.5 16.18 13.12 Mental Health/Substance Abuse 1,006.3 65.18 5.47 1.0404 1.0000 0.9996 1.0206 1.0072 6.22 2,160.6 67.00 12.06 Other Professional 27,513.6 3.45 7.90 1.0404 1.0000 0.9985 1.0140 1.0341 - 28,582.2 3.61 8.61
Subtotal 47,591.9 $ 19.61 $ 77.79 $ 6.96 50,428.6 $ 23.33 $ 98.06
Total Claims/Benefit Cost 68,053.5 $ 49.84 $ 282.67 $ 7.20 71,138.7 $ 53.19 $ 315.30Supplemental Teaching Payment 16.59 Administrative Cost Allowance 35.04 Capitation Rate $ 366.93
Category of Service
Milliman, Inc.Page 8 of 15

6/22/2016
Appendix 7
South Carolina Department of Health and Human ServicesSFY 2017 Medicaid Managed Care Capitation Rate Development
July 2016 to June 2017 Capitation Rates
Rate Cell: TANF - Age 45+, Male & Female (AF3) November 2015 Membership: 13,630
SFY 2015 Adjusted Data Prospective Adjustments SFY 2017
Utilization Cost per Utilization Unit Cost Program Program Reimbursement RBHS Utilization Cost perPer 1,000 Service PMPM Trend Trend Adj Util Adj Cost Adjustment Add On Per 1,000 Service PMPM
Inpatient HospitalI/P Medical/Surgical/Non-Delivery 578.3 $ 2,364.05 $ 113.93 1.0000 1.0000 1.0000 1.0000 1.0192 $ 0.00 578.3 $ 2,409.44 $ 116.12I/P Well Newborn 0.0 0.00 - 1.0000 1.0000 1.0000 1.0000 1.0000 0.00 0.0 0.00 - Mental Health/Substance Abuse 53.4 675.89 3.01 1.0000 1.0000 1.0000 1.0000 1.0101 0.00 53.4 682.72 3.04 Other Inpatient 27.3 1,754.03 3.98 1.0000 1.0000 1.0000 1.0000 0.8295 - 27.3 1,454.97 3.31
Subtotal 659.0 $ 2,201.91 $ 120.93 $ 0.00 659.0 $ 2,229.93 $ 122.47
Outpatient HospitalSurgery 268.8 $ 1,692.39 $ 37.91 1.0404 1.0000 1.0000 1.0000 0.9944 $ 0.00 279.7 $ 1,682.91 $ 39.22Non-Surg - Emergency Room 900.5 393.70 29.54 1.0404 1.0000 1.0000 1.0000 0.9977 - 936.9 392.79 30.67 Non-Surg - Other 363.1 136.70 4.14 1.0404 1.0000 1.0000 1.0000 0.9873 - 377.8 134.96 4.25 Observation Room 27.4 606.08 1.38 1.0404 1.0000 1.0000 1.0000 0.9963 - 28.5 603.84 1.43 Treatment/Therapy/Testing 1,361.0 345.59 39.20 1.0404 1.0000 1.0000 1.0000 0.9910 0.00 1,416.0 342.48 40.41Other Outpatient 29.8 451.86 1.12 1.0404 1.0000 1.0000 1.0000 1.0000 - 31.0 451.86 1.17
Subtotal 2,950.7 $ 460.75 $ 113.29 $ 0.00 3,069.9 $ 457.94 $ 117.15
PharmacyPrescription Drugs 26,953.0 51.05 114.66 1.0000 1.1328 1.0000 1.0000 1.0000 - 26,953.0 57.83 129.89
Subtotal 26,953.0 $ 51.05 $ 114.66 $ 0.00 26,953.0 $ 57.83 $ 129.89
AncillariesAmbulance 293.1 97.98 2.39 1.0404 1.0000 1.0000 1.0000 0.9991 0.00 305.0 97.90 2.49Prosthetic/DME 6,275.9 11.08 5.79 1.0404 1.0000 0.9999 1.0001 1.1220 0.00 6,528.8 12.43 6.76Other Ancillaries 494.6 85.66 3.53 1.0404 1.0000 1.0012 1.0376 1.0265 0.37 563.9 91.23 4.29
Subtotal 7,063.7 $ 19.91 $ 11.72 $ 0.37 7,397.7 $ 21.96 $ 13.54
PhysicianSurgery - I/P and O/P 1,321.4 $ 173.77 $ 19.14 1.0404 1.0000 0.9974 1.0021 1.0850 $ 0.00 1,371.2 $ 188.93 $ 21.59Surgery - I/P and O/P - Anesthesia 453.6 109.94 4.16 1.0404 1.0000 1.0000 1.0000 1.2445 0.00 472.0 136.82 5.38 Maternity - Non-Delivery 1.9 68.76 0.01 1.0404 1.0000 1.0000 1.0000 0.9118 0.00 2.0 62.70 0.01 Hospital Visits 846.5 74.87 5.28 1.0404 1.0000 1.0000 1.0002 1.1143 0.00 880.7 83.45 6.12 Office Visits 5,995.5 61.46 30.71 1.0404 1.0000 1.0005 1.1360 1.1306 1.18 6,420.2 78.94 42.23 ER Visits 1,086.4 87.29 7.90 1.0404 1.0000 1.0000 1.0000 1.0342 0.00 1,130.3 90.27 8.50 Immunizations 281.8 13.83 0.32 1.0404 1.0000 0.9257 1.0518 1.0105 0.00 271.4 14.70 0.33 Radiology 3,118.1 38.24 9.94 1.0404 1.0000 1.0000 1.0000 0.9960 0.00 3,244.1 38.08 10.30 Pathology 9,872.4 13.72 11.29 1.0404 1.0000 0.9671 1.0231 1.0863 0.00 9,933.3 15.25 12.62 Mental Health/Substance Abuse 566.1 63.78 3.01 1.0404 1.0000 0.9996 1.0497 1.0221 7.25 1,860.0 68.43 10.61 Other Professional 23,832.0 9.92 19.71 1.0404 1.0000 0.9955 1.0086 0.9912 0.01 24,695.4 9.92 20.42
Subtotal 47,375.8 $ 28.23 $ 111.46 $ 8.44 50,280.6 $ 32.96 $ 138.12
Total Claims/Benefit Cost 85,002.2 $ 66.64 $ 472.06 $ 8.81 88,360.2 $ 70.78 $ 521.17Supplemental Teaching Payment 19.98 Administrative Cost Allowance 57.90 Capitation Rate $ 599.05
Category of Service
Milliman, Inc.Page 9 of 15
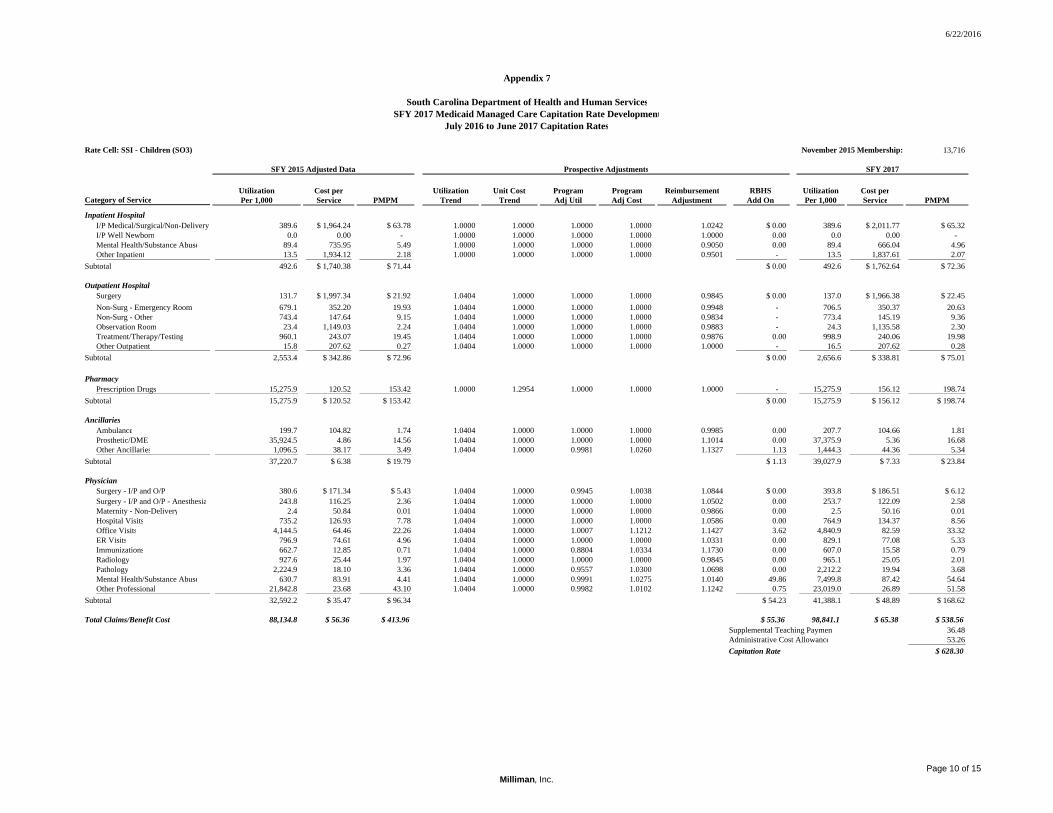
6/22/2016
Appendix 7
South Carolina Department of Health and Human ServicesSFY 2017 Medicaid Managed Care Capitation Rate Development
July 2016 to June 2017 Capitation Rates
Rate Cell: SSI - Children (SO3) November 2015 Membership: 13,716
SFY 2015 Adjusted Data Prospective Adjustments SFY 2017
Utilization Cost per Utilization Unit Cost Program Program Reimbursement RBHS Utilization Cost perPer 1,000 Service PMPM Trend Trend Adj Util Adj Cost Adjustment Add On Per 1,000 Service PMPM
Inpatient HospitalI/P Medical/Surgical/Non-Delivery 389.6 $ 1,964.24 $ 63.78 1.0000 1.0000 1.0000 1.0000 1.0242 $ 0.00 389.6 $ 2,011.77 $ 65.32I/P Well Newborn 0.0 0.00 - 1.0000 1.0000 1.0000 1.0000 1.0000 0.00 0.0 0.00 - Mental Health/Substance Abuse 89.4 735.95 5.49 1.0000 1.0000 1.0000 1.0000 0.9050 0.00 89.4 666.04 4.96 Other Inpatient 13.5 1,934.12 2.18 1.0000 1.0000 1.0000 1.0000 0.9501 - 13.5 1,837.61 2.07
Subtotal 492.6 $ 1,740.38 $ 71.44 $ 0.00 492.6 $ 1,762.64 $ 72.36
Outpatient HospitalSurgery 131.7 $ 1,997.34 $ 21.92 1.0404 1.0000 1.0000 1.0000 0.9845 $ 0.00 137.0 $ 1,966.38 $ 22.45Non-Surg - Emergency Room 679.1 352.20 19.93 1.0404 1.0000 1.0000 1.0000 0.9948 - 706.5 350.37 20.63 Non-Surg - Other 743.4 147.64 9.15 1.0404 1.0000 1.0000 1.0000 0.9834 - 773.4 145.19 9.36 Observation Room 23.4 1,149.03 2.24 1.0404 1.0000 1.0000 1.0000 0.9883 - 24.3 1,135.58 2.30 Treatment/Therapy/Testing 960.1 243.07 19.45 1.0404 1.0000 1.0000 1.0000 0.9876 0.00 998.9 240.06 19.98Other Outpatient 15.8 207.62 0.27 1.0404 1.0000 1.0000 1.0000 1.0000 - 16.5 207.62 0.28
Subtotal 2,553.4 $ 342.86 $ 72.96 $ 0.00 2,656.6 $ 338.81 $ 75.01
PharmacyPrescription Drugs 15,275.9 120.52 153.42 1.0000 1.2954 1.0000 1.0000 1.0000 - 15,275.9 156.12 198.74
Subtotal 15,275.9 $ 120.52 $ 153.42 $ 0.00 15,275.9 $ 156.12 $ 198.74
AncillariesAmbulance 199.7 104.82 1.74 1.0404 1.0000 1.0000 1.0000 0.9985 0.00 207.7 104.66 1.81Prosthetic/DME 35,924.5 4.86 14.56 1.0404 1.0000 1.0000 1.0000 1.1014 0.00 37,375.9 5.36 16.68Other Ancillaries 1,096.5 38.17 3.49 1.0404 1.0000 0.9981 1.0260 1.1327 1.13 1,444.3 44.36 5.34
Subtotal 37,220.7 $ 6.38 $ 19.79 $ 1.13 39,027.9 $ 7.33 $ 23.84
PhysicianSurgery - I/P and O/P 380.6 $ 171.34 $ 5.43 1.0404 1.0000 0.9945 1.0038 1.0844 $ 0.00 393.8 $ 186.51 $ 6.12Surgery - I/P and O/P - Anesthesia 243.8 116.25 2.36 1.0404 1.0000 1.0000 1.0000 1.0502 0.00 253.7 122.09 2.58 Maternity - Non-Delivery 2.4 50.84 0.01 1.0404 1.0000 1.0000 1.0000 0.9866 0.00 2.5 50.16 0.01 Hospital Visits 735.2 126.93 7.78 1.0404 1.0000 1.0000 1.0000 1.0586 0.00 764.9 134.37 8.56 Office Visits 4,144.5 64.46 22.26 1.0404 1.0000 1.0007 1.1212 1.1427 3.62 4,840.9 82.59 33.32 ER Visits 796.9 74.61 4.96 1.0404 1.0000 1.0000 1.0000 1.0331 0.00 829.1 77.08 5.33 Immunizations 662.7 12.85 0.71 1.0404 1.0000 0.8804 1.0334 1.1730 0.00 607.0 15.58 0.79 Radiology 927.6 25.44 1.97 1.0404 1.0000 1.0000 1.0000 0.9845 0.00 965.1 25.05 2.01 Pathology 2,224.9 18.10 3.36 1.0404 1.0000 0.9557 1.0300 1.0698 0.00 2,212.2 19.94 3.68 Mental Health/Substance Abuse 630.7 83.91 4.41 1.0404 1.0000 0.9991 1.0275 1.0140 49.86 7,499.8 87.42 54.64 Other Professional 21,842.8 23.68 43.10 1.0404 1.0000 0.9982 1.0102 1.1242 0.75 23,019.0 26.89 51.58
Subtotal 32,592.2 $ 35.47 $ 96.34 $ 54.23 41,388.1 $ 48.89 $ 168.62
Total Claims/Benefit Cost 88,134.8 $ 56.36 $ 413.96 $ 55.36 98,841.1 $ 65.38 $ 538.56Supplemental Teaching Payment 36.48 Administrative Cost Allowance 53.26 Capitation Rate $ 628.30
Category of Service
Milliman, Inc.Page 10 of 15

6/22/2016
Appendix 7
South Carolina Department of Health and Human ServicesSFY 2017 Medicaid Managed Care Capitation Rate Development
July 2016 to June 2017 Capitation Rates
Rate Cell: SSI - Adults (SP3) November 2015 Membership: 49,520
SFY 2015 Adjusted Data Prospective Adjustments SFY 2017
Utilization Cost per Utilization Unit Cost Program Program Reimbursement RBHS Utilization Cost perPer 1,000 Service PMPM Trend Trend Adj Util Adj Cost Adjustment Add On Per 1,000 Service PMPM
Inpatient HospitalI/P Medical/Surgical/Non-Delivery 1,709.6 $ 1,985.04 $ 282.80 1.0000 1.0000 1.0000 1.0000 0.9833 $ 0.00 1,709.6 $ 1,951.89 $ 278.08I/P Well Newborn 0.1 1,999.00 0.02 1.0000 1.0000 1.0000 1.0000 0.9900 0.00 0.1 1,979.01 0.02 Mental Health/Substance Abuse 274.6 669.88 15.33 1.0000 1.0000 1.0000 1.0000 0.9837 0.00 274.6 658.96 15.08 Other Inpatient 58.0 1,559.22 7.54 1.0000 1.0000 1.0000 1.0000 0.9584 - 58.0 1,494.36 7.22
Subtotal 2,042.3 $ 1,796.11 $ 305.68 $ 0.00 2,042.3 $ 1,765.05 $ 300.40
Outpatient HospitalSurgery 318.7 $ 1,555.09 $ 41.30 1.0404 1.0000 1.0000 1.0000 0.9941 $ 0.00 331.5 $ 1,545.92 $ 42.71Non-Surg - Emergency Room 1,524.2 406.98 51.69 1.0404 1.0000 1.0000 1.0000 0.9972 - 1,585.8 405.84 53.63 Non-Surg - Other 632.0 140.81 7.42 1.0404 1.0000 1.0000 1.0000 0.9874 - 657.6 139.03 7.62 Observation Room 58.5 501.35 2.45 1.0404 1.0000 1.0000 1.0000 0.9954 - 60.9 499.04 2.53 Treatment/Therapy/Testing 1,483.3 450.81 55.72 1.0404 1.0000 1.0000 1.0000 0.9915 0.00 1,543.2 446.98 57.48Other Outpatient 36.4 441.17 1.34 1.0404 1.0000 1.0000 1.0000 0.9981 - 37.9 440.33 1.39
Subtotal 4,053.1 $ 473.45 $ 159.91 $ 0.00 4,216.9 $ 470.58 $ 165.37
PharmacyPrescription Drugs 33,707.2 84.52 237.40 1.0000 1.2351 1.0000 1.0000 1.0000 - 33,707.2 104.39 293.21
Subtotal 33,707.2 $ 84.52 $ 237.40 $ 0.00 33,707.2 $ 104.39 $ 293.21
AncillariesAmbulance 1,150.0 88.28 8.46 1.0404 1.0000 1.0000 1.0000 0.9990 0.00 1,196.5 88.20 8.79Prosthetic/DME 22,494.7 8.33 15.61 1.0404 1.0000 1.0000 1.0000 1.0947 0.00 23,403.5 9.12 17.78Other Ancillaries 1,032.7 80.64 6.94 1.0404 1.0000 1.0000 1.0184 1.0626 3.49 1,554.4 87.26 11.30
Subtotal 24,677.5 $ 15.08 $ 31.01 $ 3.49 26,154.4 $ 17.38 $ 37.88
PhysicianSurgery - I/P and O/P 1,358.1 $ 168.70 $ 19.09 1.0404 1.0000 0.9965 1.0028 1.0635 $ 0.00 1,408.0 $ 179.92 $ 21.11Surgery - I/P and O/P - Anesthesia 461.4 113.98 4.38 1.0404 1.0000 1.0000 1.0000 1.2516 0.00 480.0 142.66 5.71 Maternity - Non-Delivery 13.7 35.60 0.04 1.0404 1.0000 1.0000 1.0000 0.9730 0.00 14.2 34.64 0.04 Hospital Visits 2,917.7 72.01 17.51 1.0404 1.0000 1.0000 1.0001 1.1082 0.00 3,035.6 79.81 20.19 Office Visits 6,015.2 59.89 30.02 1.0404 1.0000 1.0005 1.1625 1.1096 4.86 7,016.4 77.25 45.17 ER Visits 1,933.4 89.78 14.47 1.0404 1.0000 1.0000 1.0000 1.0306 0.00 2,011.5 92.53 15.51 Immunizations 316.2 14.63 0.39 1.0404 1.0000 0.9142 1.0615 1.0079 0.00 300.7 15.65 0.39 Radiology 3,924.0 38.38 12.55 1.0404 1.0000 1.0000 1.0000 0.9893 0.00 4,082.5 37.97 12.92 Pathology 10,970.1 13.52 12.36 1.0404 1.0000 0.9643 1.0252 1.0847 0.00 11,005.8 15.04 13.79 Mental Health/Substance Abuse 645.0 60.70 3.26 1.0404 1.0000 0.9997 1.0465 1.0055 23.34 5,055.6 63.88 26.91 Other Professional 49,545.4 10.24 42.27 1.0404 1.0000 0.9983 1.0030 0.9935 0.62 52,188.7 10.20 44.37
Subtotal 78,100.1 $ 24.02 $ 156.34 $ 28.82 86,599.1 $ 28.56 $ 206.11
Total Claims/Benefit Cost 142,580.2 $ 74.94 $ 890.36 $ 32.31 152,719.8 $ 78.81 $ 1,002.97Supplemental Teaching Payment 37.15 Administrative Cost Allowance 87.21 Capitation Rate $ 1,127.33
Category of Service
Milliman, Inc.Page 11 of 15

6/22/2016
Appendix 7
South Carolina Department of Health and Human ServicesSFY 2017 Medicaid Managed Care Capitation Rate Development
July 2016 to June 2017 Capitation Rates
Rate Cell: OCWI (WG2) November 2015 Membership: 11,344
SFY 2015 Adjusted Data Prospective Adjustments SFY 2017
Utilization Cost per Utilization Unit Cost Program Program Reimbursement RBHS Utilization Cost perPer 1,000 Service PMPM Trend Trend Adj Util Adj Cost Adjustment Add On Per 1,000 Service PMPM
Inpatient HospitalI/P Medical/Surgical/Non-Delivery 281.7 $ 1,487.74 $ 34.93 1.0000 1.0000 1.0000 1.0000 0.9870 $ 0.00 281.7 $ 1,468.40 $ 34.47I/P Well Newborn 1.1 733.89 0.07 1.0000 1.0000 1.0000 1.0000 0.9941 0.00 1.1 729.56 0.07 Mental Health/Substance Abuse 17.2 867.60 1.24 1.0000 1.0000 1.0000 1.0000 0.9595 0.00 17.2 832.46 1.19 Other Inpatient 34.6 2,594.63 7.47 1.0000 1.0000 1.0000 1.0000 0.9523 - 34.6 2,470.86 7.12
Subtotal 334.6 $ 1,567.68 $ 43.71 $ 0.00 334.6 $ 1,536.80 $ 42.85
Outpatient HospitalSurgery 797.2 $ 464.83 $ 30.88 1.0404 1.0000 1.0000 1.0000 0.9962 $ 0.00 829.4 $ 463.06 $ 32.00Non-Surg - Emergency Room 1,035.1 343.61 29.64 1.0404 1.0000 1.0000 1.0000 0.9998 - 1,077.0 343.54 30.83 Non-Surg - Other 1,055.1 137.43 12.08 1.0404 1.0000 1.0000 1.0000 1.0006 - 1,097.7 137.52 12.58 Observation Room 359.8 239.20 7.17 1.0404 1.0000 1.0000 1.0000 0.9946 - 374.4 237.91 7.42 Treatment/Therapy/Testing 1,767.8 108.88 16.04 1.0404 1.0000 1.0000 1.0000 0.9877 0.00 1,839.2 107.54 16.48Other Outpatient 26.7 141.05 0.31 1.0404 1.0000 1.0000 1.0000 1.0000 - 27.7 141.05 0.33
Subtotal 5,041.7 $ 228.80 $ 96.13 $ 0.00 5,245.3 $ 227.96 $ 99.65
PharmacyPrescription Drugs 11,898.0 27.28 27.05 1.0000 1.1328 1.0000 1.0000 1.0000 - 11,898.0 30.91 30.65
Subtotal 11,898.0 $ 27.28 $ 27.05 $ 0.00 11,898.0 $ 30.91 $ 30.65
AncillariesAmbulance 408.9 91.77 3.13 1.0404 1.0000 1.0000 1.0000 0.9990 0.00 425.4 91.68 3.25Prosthetic/DME 758.0 17.62 1.11 1.0404 1.0000 0.9988 1.0008 1.1035 0.00 787.7 19.46 1.28Other Ancillaries 1,085.4 170.60 15.43 1.0404 1.0000 0.9777 1.0284 0.9877 0.07 1,108.9 173.29 16.01
Subtotal 2,252.3 $ 104.80 $ 19.67 $ 0.07 2,322.0 $ 106.15 $ 20.54
PhysicianSurgery - I/P and O/P 560.8 $ 128.48 $ 6.00 1.0404 1.0000 0.9949 1.0018 1.0181 $ 0.00 580.5 $ 131.04 $ 6.34Surgery - I/P and O/P - Anesthesia 224.3 97.24 1.82 1.0404 1.0000 1.0000 1.0000 1.1023 0.00 233.4 107.19 2.08 Maternity - Non-Delivery 1,338.3 30.51 3.40 1.0404 1.0000 1.0000 1.0000 0.9747 0.00 1,392.4 29.74 3.45 Hospital Visits 882.0 64.94 4.77 1.0404 1.0000 1.0000 1.0000 1.1092 0.00 917.6 72.03 5.51 Office Visits 2,058.4 57.35 9.84 1.0404 1.0000 1.0001 1.1166 1.1845 0.21 2,175.0 75.85 13.75 ER Visits 1,388.1 77.99 9.02 1.0404 1.0000 1.0000 1.0000 1.0665 0.00 1,444.2 83.17 10.01 Immunizations 450.7 16.87 0.63 1.0404 1.0000 0.9666 1.0250 0.9606 0.00 453.3 16.61 0.63 Radiology 1,212.4 49.74 5.03 1.0404 1.0000 1.0001 1.0000 0.9745 0.00 1,261.5 48.47 5.10 Pathology 17,926.6 11.28 16.85 1.0404 1.0000 0.9746 1.0216 1.1168 0.00 18,177.1 12.87 19.50 Mental Health/Substance Abuse 1,093.3 74.36 6.77 1.0404 1.0000 0.9989 1.0041 1.0051 2.80 1,583.9 75.04 9.91 Other Professional 16,841.6 2.76 3.87 1.0404 1.0000 0.9992 1.0245 1.0340 - 17,508.0 2.92 4.26
Subtotal 43,976.5 $ 18.56 $ 68.01 $ 3.01 45,726.8 $ 21.13 $ 80.53
Total Claims/Benefit Cost 63,503.0 $ 48.11 $ 254.58 $ 3.08 65,526.8 $ 50.22 $ 274.21Supplemental Teaching Payment 57.63 Administrative Cost Allowance 30.47 Capitation Rate $ 362.31
Category of Service
Milliman, Inc.Page 12 of 15
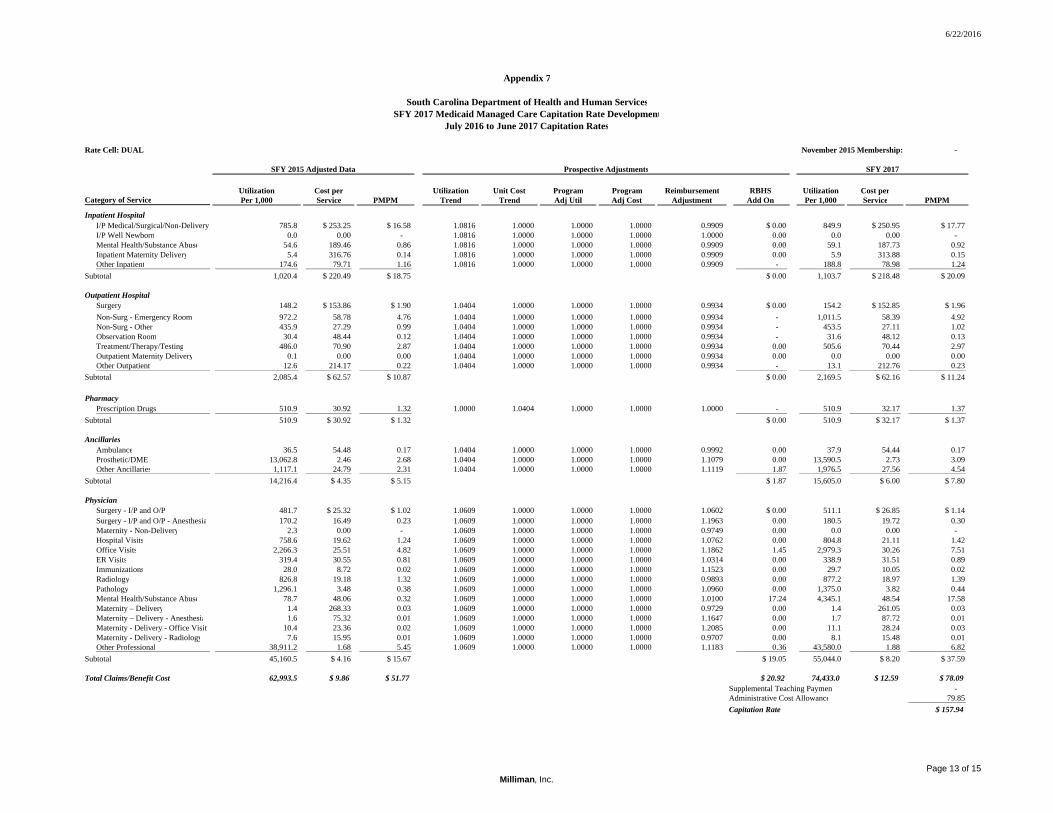
6/22/2016
Appendix 7
South Carolina Department of Health and Human ServicesSFY 2017 Medicaid Managed Care Capitation Rate Development
July 2016 to June 2017 Capitation Rates
Rate Cell: DUAL November 2015 Membership: -
SFY 2015 Adjusted Data Prospective Adjustments SFY 2017
Utilization Cost per Utilization Unit Cost Program Program Reimbursement RBHS Utilization Cost perPer 1,000 Service PMPM Trend Trend Adj Util Adj Cost Adjustment Add On Per 1,000 Service PMPM
Inpatient HospitalI/P Medical/Surgical/Non-Delivery 785.8 $ 253.25 $ 16.58 1.0816 1.0000 1.0000 1.0000 0.9909 $ 0.00 849.9 $ 250.95 $ 17.77I/P Well Newborn 0.0 0.00 - 1.0816 1.0000 1.0000 1.0000 1.0000 0.00 0.0 0.00 - Mental Health/Substance Abuse 54.6 189.46 0.86 1.0816 1.0000 1.0000 1.0000 0.9909 0.00 59.1 187.73 0.92 Inpatient Maternity Delivery 5.4 316.76 0.14 1.0816 1.0000 1.0000 1.0000 0.9909 0.00 5.9 313.88 0.15 Other Inpatient 174.6 79.71 1.16 1.0816 1.0000 1.0000 1.0000 0.9909 - 188.8 78.98 1.24
Subtotal 1,020.4 $ 220.49 $ 18.75 $ 0.00 1,103.7 $ 218.48 $ 20.09
Outpatient HospitalSurgery 148.2 $ 153.86 $ 1.90 1.0404 1.0000 1.0000 1.0000 0.9934 $ 0.00 154.2 $ 152.85 $ 1.96Non-Surg - Emergency Room 972.2 58.78 4.76 1.0404 1.0000 1.0000 1.0000 0.9934 - 1,011.5 58.39 4.92 Non-Surg - Other 435.9 27.29 0.99 1.0404 1.0000 1.0000 1.0000 0.9934 - 453.5 27.11 1.02 Observation Room 30.4 48.44 0.12 1.0404 1.0000 1.0000 1.0000 0.9934 - 31.6 48.12 0.13 Treatment/Therapy/Testing 486.0 70.90 2.87 1.0404 1.0000 1.0000 1.0000 0.9934 0.00 505.6 70.44 2.97Outpatient Maternity Delivery 0.1 0.00 0.00 1.0404 1.0000 1.0000 1.0000 0.9934 0.00 0.0 0.00 0.00Other Outpatient 12.6 214.17 0.22 1.0404 1.0000 1.0000 1.0000 0.9934 - 13.1 212.76 0.23
Subtotal 2,085.4 $ 62.57 $ 10.87 $ 0.00 2,169.5 $ 62.16 $ 11.24
PharmacyPrescription Drugs 510.9 30.92 1.32 1.0000 1.0404 1.0000 1.0000 1.0000 - 510.9 32.17 1.37
Subtotal 510.9 $ 30.92 $ 1.32 $ 0.00 510.9 $ 32.17 $ 1.37
AncillariesAmbulance 36.5 54.48 0.17 1.0404 1.0000 1.0000 1.0000 0.9992 0.00 37.9 54.44 0.17Prosthetic/DME 13,062.8 2.46 2.68 1.0404 1.0000 1.0000 1.0000 1.1079 0.00 13,590.5 2.73 3.09Other Ancillaries 1,117.1 24.79 2.31 1.0404 1.0000 1.0000 1.0000 1.1119 1.87 1,976.5 27.56 4.54
Subtotal 14,216.4 $ 4.35 $ 5.15 $ 1.87 15,605.0 $ 6.00 $ 7.80
PhysicianSurgery - I/P and O/P 481.7 $ 25.32 $ 1.02 1.0609 1.0000 1.0000 1.0000 1.0602 $ 0.00 511.1 $ 26.85 $ 1.14Surgery - I/P and O/P - Anesthesia 170.2 16.49 0.23 1.0609 1.0000 1.0000 1.0000 1.1963 0.00 180.5 19.72 0.30 Maternity - Non-Delivery 2.3 0.00 - 1.0609 1.0000 1.0000 1.0000 0.9749 0.00 0.0 0.00 - Hospital Visits 758.6 19.62 1.24 1.0609 1.0000 1.0000 1.0000 1.0762 0.00 804.8 21.11 1.42 Office Visits 2,266.3 25.51 4.82 1.0609 1.0000 1.0000 1.0000 1.1862 1.45 2,979.3 30.26 7.51 ER Visits 319.4 30.55 0.81 1.0609 1.0000 1.0000 1.0000 1.0314 0.00 338.9 31.51 0.89 Immunizations 28.0 8.72 0.02 1.0609 1.0000 1.0000 1.0000 1.1523 0.00 29.7 10.05 0.02 Radiology 826.8 19.18 1.32 1.0609 1.0000 1.0000 1.0000 0.9893 0.00 877.2 18.97 1.39 Pathology 1,296.1 3.48 0.38 1.0609 1.0000 1.0000 1.0000 1.0960 0.00 1,375.0 3.82 0.44 Mental Health/Substance Abuse 78.7 48.06 0.32 1.0609 1.0000 1.0000 1.0000 1.0100 17.24 4,345.1 48.54 17.58 Maternity – Delivery 1.4 268.33 0.03 1.0609 1.0000 1.0000 1.0000 0.9729 0.00 1.4 261.05 0.03 Maternity – Delivery - Anesthesia 1.6 75.32 0.01 1.0609 1.0000 1.0000 1.0000 1.1647 0.00 1.7 87.72 0.01 Maternity - Delivery - Office Visits 10.4 23.36 0.02 1.0609 1.0000 1.0000 1.0000 1.2085 0.00 11.1 28.24 0.03 Maternity - Delivery - Radiology 7.6 15.95 0.01 1.0609 1.0000 1.0000 1.0000 0.9707 0.00 8.1 15.48 0.01 Other Professional 38,911.2 1.68 5.45 1.0609 1.0000 1.0000 1.0000 1.1183 0.36 43,580.0 1.88 6.82
Subtotal 45,160.5 $ 4.16 $ 15.67 $ 19.05 55,044.0 $ 8.20 $ 37.59
Total Claims/Benefit Cost 62,993.5 $ 9.86 $ 51.77 $ 20.92 74,433.0 $ 12.59 $ 78.09Supplemental Teaching Payment - Administrative Cost Allowance 79.85 Capitation Rate $ 157.94
Category of Service
Milliman, Inc.Page 13 of 15

6/22/2016
Appendix 7
South Carolina Department of Health and Human ServicesSFY 2017 Medicaid Managed Care Capitation Rate Development
July 2016 to June 2017 Capitation Rates
Rate Cell: Foster Care Children (FG3) November 2015 Membership: 3,957
SFY 2015 Adjusted Data Prospective Adjustments SFY 2017
Utilization Cost per Utilization Unit Cost Program Program Reimbursement RBHS Utilization Cost perPer 1,000 Service PMPM Trend Trend Adj Util Adj Cost Adjustment Add On Per 1,000 Service PMPM
Inpatient HospitalI/P Medical/Surgical/Non-Delivery 301.3 $ 1,513.73 $ 38.00 1.0000 1.0000 1.0000 1.0000 1.0015 $ 0.00 301.3 $ 1,516.00 $ 38.06I/P Well Newborn 48.9 442.70 1.80 1.0000 1.0000 1.0000 1.0000 0.9506 0.00 48.9 420.83 1.71 Mental Health/Substance Abuse 316.8 598.28 15.79 1.0000 1.0000 1.0000 1.0000 0.8873 0.00 316.8 530.85 14.01 Other Inpatient 19.2 2,046.67 3.27 1.0000 1.0000 1.0000 1.0000 0.9537 - 19.2 1,951.91 3.12
Subtotal 686.1 $ 1,029.61 $ 58.87 $ 0.00 686.1 $ 995.27 $ 56.90
Outpatient HospitalSurgery 91.1 $ 1,314.28 $ 9.98 1.0404 1.0000 1.0000 1.0000 0.9943 $ 0.00 94.8 $ 1,306.79 $ 10.32Non-Surg - Emergency Room 527.5 315.59 13.87 1.0404 1.0000 1.0000 1.0000 0.9955 - 548.8 314.17 14.37 Non-Surg - Other 635.1 113.54 6.01 1.0404 1.0000 1.0000 1.0000 0.9859 - 660.8 111.94 6.16 Observation Room 13.5 558.25 0.63 1.0404 1.0000 1.0000 1.0000 1.0011 - 14.0 558.86 0.65 Treatment/Therapy/Testing 535.7 142.77 6.37 1.0404 1.0000 1.0000 1.0000 0.9955 0.00 557.3 142.12 6.60Other Outpatient 13.5 171.08 0.19 1.0404 1.0000 1.0000 1.0000 1.0000 - 14.0 171.08 0.20
Subtotal 1,816.4 $ 244.79 $ 37.05 $ 0.00 1,889.8 $ 243.26 $ 38.31
PharmacyPrescription Drugs 13,474.9 66.89 75.11 1.0000 1.1354 1.0000 1.0000 1.0000 - 13,474.9 75.94 85.28
Subtotal 13,474.9 $ 66.89 $ 75.11 $ 0.00 13,474.9 $ 75.94 $ 85.28
AncillariesAmbulance 222.8 94.35 1.75 1.0404 1.0000 1.0000 1.0000 1.0000 0.00 231.8 94.35 1.82Prosthetic/DME 9,219.0 4.09 3.14 1.0404 1.0000 0.9999 0.9998 1.1440 0.00 9,590.5 4.67 3.74Other Ancillaries 640.7 40.02 2.14 1.0404 1.0000 0.9983 0.9940 1.2388 1.71 1,081.8 49.28 4.44
Subtotal 10,082.5 $ 8.37 $ 7.03 $ 1.71 10,904.1 $ 11.01 $ 10.00
PhysicianSurgery - I/P and O/P 336.9 $ 151.39 $ 4.25 1.0404 1.0000 0.9869 1.0088 1.0672 $ 0.00 345.9 $ 162.99 $ 4.70Surgery - I/P and O/P - Anesthesia 157.7 104.72 1.38 1.0404 1.0000 1.0000 1.0000 1.1140 0.00 164.1 116.65 1.60 Maternity - Non-Delivery 5.0 24.51 0.01 1.0404 1.0000 1.0000 1.0000 0.9692 0.00 5.2 23.76 0.01 Hospital Visits 1,064.2 108.07 9.58 1.0404 1.0000 1.0000 1.0000 1.0669 0.00 1,107.2 115.30 10.64 Office Visits 4,475.1 64.45 24.03 1.0404 1.0000 1.0003 1.1458 1.1899 5.45 5,401.6 87.87 39.55 ER Visits 601.9 73.84 3.70 1.0404 1.0000 1.0000 1.0000 1.0296 0.00 626.2 76.03 3.97 Immunizations 1,731.4 12.35 1.78 1.0404 1.0000 0.8790 1.0413 1.1507 0.00 1,583.4 14.79 1.95 Radiology 706.6 22.52 1.33 1.0404 1.0000 1.0000 1.0000 0.9821 0.00 735.2 22.11 1.35 Pathology 2,787.1 15.08 3.50 1.0404 1.0000 0.9234 1.0583 1.0678 0.00 2,677.5 17.04 3.80 Mental Health/Substance Abuse 4,540.5 89.87 34.00 1.0404 1.0000 0.9983 1.0241 1.0255 424.28 58,659.2 94.38 461.37 Other Professional 19,994.4 19.24 32.05 1.0404 1.0000 0.9973 1.0304 1.1907 0.69 21,096.8 23.60 41.49
Subtotal 36,400.7 $ 38.12 $ 115.62 $ 430.42 92,402.3 $ 74.08 $ 570.43
Total Claims/Benefit Cost 62,460.6 $ 56.42 $ 293.68 $ 432.13 119,357.2 $ 76.50 $ 760.93Supplemental Teaching Payment 44.62 Administrative Cost Allowance 75.25 Capitation Rate $ 880.80
Category of Service
Milliman, Inc.Page 14 of 15
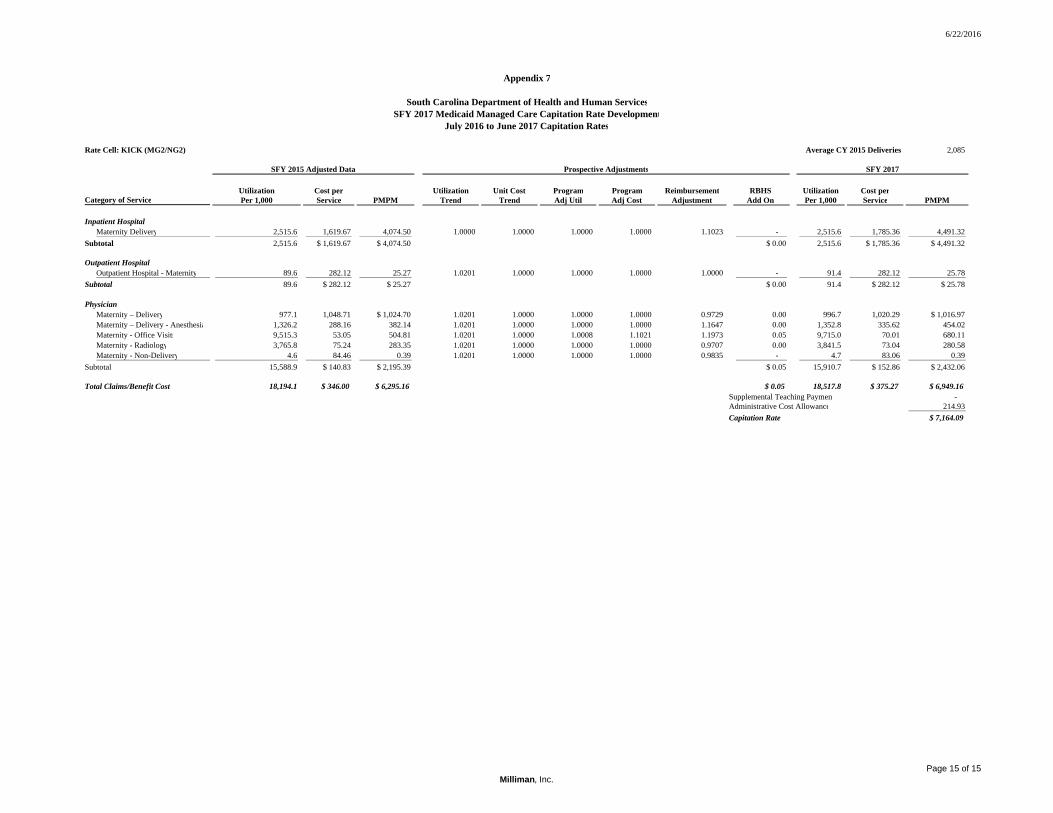
6/22/2016
Appendix 7
South Carolina Department of Health and Human ServicesSFY 2017 Medicaid Managed Care Capitation Rate Development
July 2016 to June 2017 Capitation Rates
Rate Cell: KICK (MG2/NG2) Average CY 2015 Deliveries 2,085
SFY 2015 Adjusted Data Prospective Adjustments SFY 2017
Utilization Cost per Utilization Unit Cost Program Program Reimbursement RBHS Utilization Cost perPer 1,000 Service PMPM Trend Trend Adj Util Adj Cost Adjustment Add On Per 1,000 Service PMPM
Inpatient HospitalMaternity Delivery 2,515.6 1,619.67 4,074.50 1.0000 1.0000 1.0000 1.0000 1.1023 - 2,515.6 1,785.36 4,491.32
Subtotal 2,515.6 $ 1,619.67 $ 4,074.50 $ 0.00 2,515.6 $ 1,785.36 $ 4,491.32
Outpatient HospitalOutpatient Hospital - Maternity 89.6 282.12 25.27 1.0201 1.0000 1.0000 1.0000 1.0000 - 91.4 282.12 25.78
Subtotal 89.6 $ 282.12 $ 25.27 $ 0.00 91.4 $ 282.12 $ 25.78
PhysicianMaternity – Delivery 977.1 1,048.71 $ 1,024.70 1.0201 1.0000 1.0000 1.0000 0.9729 0.00 996.7 1,020.29 $ 1,016.97Maternity – Delivery - Anesthesia 1,326.2 288.16 382.14 1.0201 1.0000 1.0000 1.0000 1.1647 0.00 1,352.8 335.62 454.02 Maternity - Office Visits 9,515.3 53.05 504.81 1.0201 1.0000 1.0008 1.1021 1.1973 0.05 9,715.0 70.01 680.11 Maternity - Radiology 3,765.8 75.24 283.35 1.0201 1.0000 1.0000 1.0000 0.9707 0.00 3,841.5 73.04 280.58 Maternity - Non-Delivery 4.6 84.46 0.39 1.0201 1.0000 1.0000 1.0000 0.9835 - 4.7 83.06 0.39
Subtotal 15,588.9 $ 140.83 $ 2,195.39 $ 0.05 15,910.7 $ 152.86 $ 2,432.06
Total Claims/Benefit Cost 18,194.1 $ 346.00 $ 6,295.16 $ 0.05 18,517.8 $ 375.27 $ 6,949.16Supplemental Teaching Payment - Administrative Cost Allowance 214.93 Capitation Rate $ 7,164.09
Category of Service
Milliman, Inc.Page 15 of 15
Milliman Client Report
State Fiscal Year 2017 Rate Certification
SCM01-64
June 22, 2016
APPENDIX 8: MANAGED CARE EFFICIENCY ADJUSTMENTS
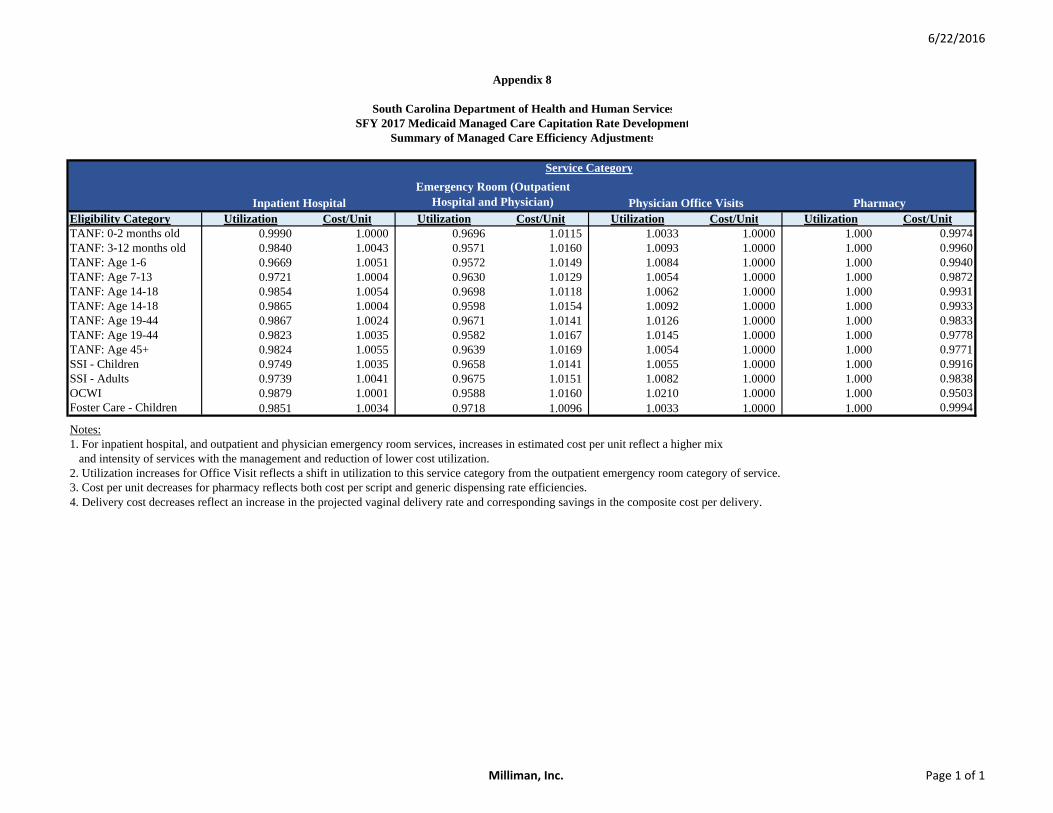
6/22/2016
Appendix 8
South Carolina Department of Health and Human ServicesSFY 2017 Medicaid Managed Care Capitation Rate Development
Summary of Managed Care Efficiency Adjustments
Service Category
Inpatient HospitalEmergency Room (Outpatient
Hospital and Physician) Physician Office Visits PharmacyEligibility Category Utilization Cost/Unit Utilization Cost/Unit Utilization Cost/Unit Utilization Cost/UnitTANF: 0-2 months old 0.9990 1.0000 0.9696 1.0115 1.0033 1.0000 1.000 0.9974TANF: 3-12 months old 0.9840 1.0043 0.9571 1.0160 1.0093 1.0000 1.000 0.9960TANF: Age 1-6 0.9669 1.0051 0.9572 1.0149 1.0084 1.0000 1.000 0.9940TANF: Age 7-13 0.9721 1.0004 0.9630 1.0129 1.0054 1.0000 1.000 0.9872TANF: Age 14-18 0.9854 1.0054 0.9698 1.0118 1.0062 1.0000 1.000 0.9931TANF: Age 14-18 0.9865 1.0004 0.9598 1.0154 1.0092 1.0000 1.000 0.9933TANF: Age 19-44 0.9867 1.0024 0.9671 1.0141 1.0126 1.0000 1.000 0.9833TANF: Age 19-44 0.9823 1.0035 0.9582 1.0167 1.0145 1.0000 1.000 0.9778TANF: Age 45+ 0.9824 1.0055 0.9639 1.0169 1.0054 1.0000 1.000 0.9771SSI - Children 0.9749 1.0035 0.9658 1.0141 1.0055 1.0000 1.000 0.9916SSI - Adults 0.9739 1.0041 0.9675 1.0151 1.0082 1.0000 1.000 0.9838OCWI 0.9879 1.0001 0.9588 1.0160 1.0210 1.0000 1.000 0.9503Foster Care - Children 0.9851 1.0034 0.9718 1.0096 1.0033 1.0000 1.000 0.9994
Notes:1. For inpatient hospital, and outpatient and physician emergency room services, increases in estimated cost per unit reflect a higher mix
and intensity of services with the management and reduction of lower cost utilization. 2. Utilization increases for Office Visit reflects a shift in utilization to this service category from the outpatient emergency room category of service.3. Cost per unit decreases for pharmacy reflects both cost per script and generic dispensing rate efficiencies. 4. Delivery cost decreases reflect an increase in the projected vaginal delivery rate and corresponding savings in the composite cost per delivery.
Milliman, Inc. Page 1 of 1

Milliman Client Report
State Fiscal Year 2017 Rate Certification
SCM01-64
June 22, 2016
APPENDIX 9: SUPPLEMENTAL TEACHING PAYMENT DEVELOPMENT – UNADJUSTED STP

6/22/2016
Appendix 9
South Carolina Department of Health and Human ServicesSFY 2017 Medicaid Managed Care Capitation Rate DevelopmentSupplemental Teaching Payment Development - Unadjusted STP
FFY 2014 MCO Data SFY 2017 Unadjusted STPEstimated Trended Unadjusted
Teaching Total Paid SFY 2017 SupplementalMember Physicians TPL Estimated To Provider FFY 2014 ACR Trend Adj ACR Teaching PaymentsMonths Claims Paid Adjustment Copay (B) * (C) + (D) ACR (to SFY 2017) (F) * (G) (H) - (E)
Rate Cell (A) (B) (C) (D) (E) (F) (G) (H) (I)
TANF - 0 - 2 Months, Male & Female (AH3) 86,433 $ 11,264,848 1.0165 $ 0 $11,451,051 $ 23,940,617 1.0604 $ 25,387,648 $ 13,936,597TANF - 3 - 12 Months, Male & Female (AI3) 316,123 5,826,912 1.0165 0 5,923,229 13,250,223 1.0604 14,051,100 8,127,871TANF - Age 1 - 6, Male & Female (AB3) 2,108,677 8,718,837 1.0165 0 8,862,955 20,032,822 1.0604 21,243,656 12,380,701TANF - Age 7 - 13, Male & Female (AC3) 2,094,785 6,560,460 1.0165 0 6,668,902 15,164,437 1.0604 16,081,014 9,412,112TANF - Age 14 - 18, Male (AD1) 569,291 1,888,592 1.0165 0 1,919,809 4,451,896 1.0604 4,720,979 2,801,170TANF - Age 14 - 18, Female (AD2) 587,875 2,513,651 1.0165 0 2,555,201 5,775,936 1.0604 6,125,048 3,569,847TANF - Age 19 - 44, Male (AE1) 187,268 710,384 1.0165 9,425 731,551 1,999,223 1.0604 2,120,061 1,388,510TANF - Age 19 - 44, Female (AE2) 742,956 5,024,003 1.0165 72,679 5,179,727 13,710,923 1.0604 14,539,646 9,359,920TANF - Age 45+, Male & Female (AF3) 115,580 $ 1,025,890 1.0165 $ 16,952 $ 1,059,800 $ 3,010,111 1.0604 $ 3,192,050 $ 2,132,250
SSI - Children (SO3) 188,337 $ 4,267,470 1.0165 $ 0 $ 4,338,010 $ 10,197,614 1.0604 $ 10,813,984 $ 6,475,974SSI - Adults (SP3) 554,609 $ 9,567,423 1.0165 $ 110,042 $ 9,835,610 $ 27,436,285 1.0604 $ 29,094,603 $ 19,258,993
OCWI (WG2) 246,319 $ 2,328,419 1.0165 $ 0 $ 2,366,907 $ 5,553,717 1.0604 $ 5,889,398 $ 3,522,491
DUAL N/A $ 0 1.0000 $ 0 $ 0 $ 0 N/A $ 0 $ 0
Foster Care Children (FG3) 38,104 $ 672,366 1.0165 $ 0 $ 683,480 $ 2,149,185 1.0604 $ 2,279,087 $ 1,595,607
KICK (NG2) N/A $ 12,225,939 1.0165 $ 0 $ 12,428,029 $ 23,722,073 1.0604 $ 25,155,894 $ 12,727,865
TOTAL 7,836,357 $ 72,595,193 $ 74,004,261 $ 170,395,061 $ 180,694,168 $ 106,689,907
Milliman, Inc. Page 1 of 1
Milliman Client Report
State Fiscal Year 2017 Rate Certification
SCM01-64
June 22, 2016
APPENDIX 10 : SUPPLEMENTAL TEACHING PAYMENT DEVELOPMENT – FINAL STP PMPM

6/22/2016
Appendix 10
South Carolina Department of Health and Human ServicesSFY 2017 Medicaid Managed Care Capitation Rate DevelopmentSupplemental Teaching Payment Development - Final STP PMPM
Adjustment Factors SFY 2017 STP PMPM DevelopmentFFY 2014 Unadjusted Emergency Room Supplemental Supplemental SupplementalMember Supplemental OCWI Managed Care Redetermination Inmate Utilization Trend Teaching Payments KICK Teaching Payments Teaching Payments
Rate Cell Months Teaching Payments Adjustment Adjustment Adjustment Adjustment (to SFY 2017) Pre-KICK Allocation Allocation Total PMPM
TANF - 0 - 2 Months, Male & Female (AH3) 86,433 $ 13,936,597 1.0000 1.0000 1.0000 1.0000 1.0560 $ 14,717,182 $ 0 $ 14,717,182 $ 170.27TANF - 3 - 12 Months, Male & Female (AI3) 316,123 8,127,871 1.0000 1.0011 1.0000 1.0000 1.0560 8,592,234 0 8,592,234 27.18TANF - Age 1 - 6, Male & Female (AB3) 2,108,677 12,380,701 1.0000 1.0012 1.0118 1.0000 1.0560 13,244,133 0 13,244,133 6.28TANF - Age 7 - 13, Male & Female (AC3) 2,094,785 9,412,112 1.0000 1.0007 1.0118 1.0000 1.0560 10,063,381 0 10,063,381 4.80TANF - Age 14 - 18, Male (AD1) 569,291 2,801,170 1.0000 1.0005 1.0118 1.0003 1.0560 2,995,251 0 2,995,251 5.26TANF - Age 14 - 18, Female (AD2) 587,875 3,569,847 1.0000 1.0006 1.0118 1.0000 1.0560 3,816,417 768,952 4,585,370 7.80TANF - Age 19 - 44, Male (AE1) 187,268 1,388,510 1.0000 1.0006 1.0256 1.0033 1.0560 1,509,542 0 1,509,542 8.06TANF - Age 19 - 44, Female (AE2) 742,956 9,359,920 1.0000 1.0001 1.0256 1.0003 1.0560 10,140,622 2,187,498 12,328,120 16.59TANF - Age 45+, Male & Female (AF3) 115,580 $ 2,132,250 1.0000 0.9999 1.0256 1.0004 1.0560 $ 2,309,859 $ 0 $ 2,309,859 $ 19.98
SSI - Children (SO3) 188,337 $ 6,475,974 1.0000 1.0002 1.0000 1.0000 1.0560 $ 6,839,894 $ 30,058 $ 6,869,952 $ 36.48SSI - Adults (SP3) 554,609 $ 19,258,993 1.0000 0.9996 1.0000 1.0006 1.0560 $ 20,339,908 $ 261,335 $ 20,601,242 $ 37.15
OCWI (WG2) 246,319 $ 3,522,491 1.1784 0.9988 1.0000 1.0001 1.0560 $ 4,378,737 $ 9,817,463 $ 14,196,200 $ 57.63
DUAL N/A $ 0 1.0000 1.0000 1.0000 1.0000 1.0847 $ 0 $ 0 $ 0 $ 0.00
Foster Care Children (FG3) 38,104 $ 1,595,607 1.0000 1.0001 1.0000 1.0002 1.0560 $ 1,685,482 $ 14,741 $ 1,700,223 $ 44.62
KICK (NG2) N/A $ 12,727,865 1.0000 1.0000 1.0000 0.9999 1.0277 $ 13,080,047 $ 0 $ 0
TOTAL 7,836,357 $ 106,689,907 $ 113,712,689 $ 13,080,047 $ 113,712,689 $ 14.51
Adjustments composited for all professional services by SFY 2015 base data
Milliman, Inc. Page 1 of 1