Embed Size (px)
Citation preview
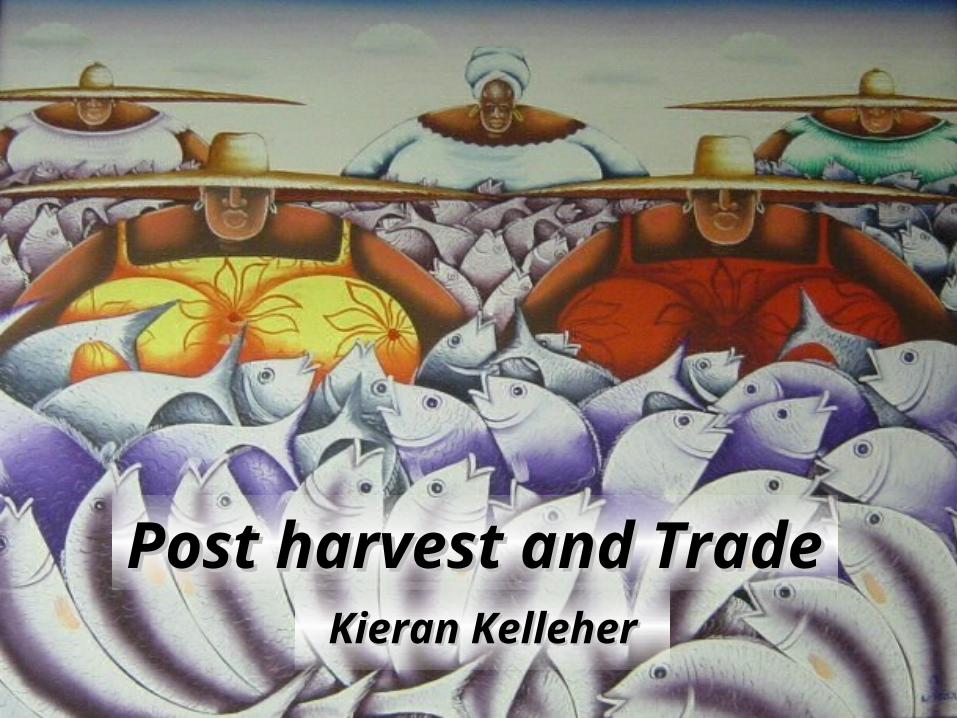
Post harvest and TradePost harvest and TradeKieran KelleherKieran Kelleher
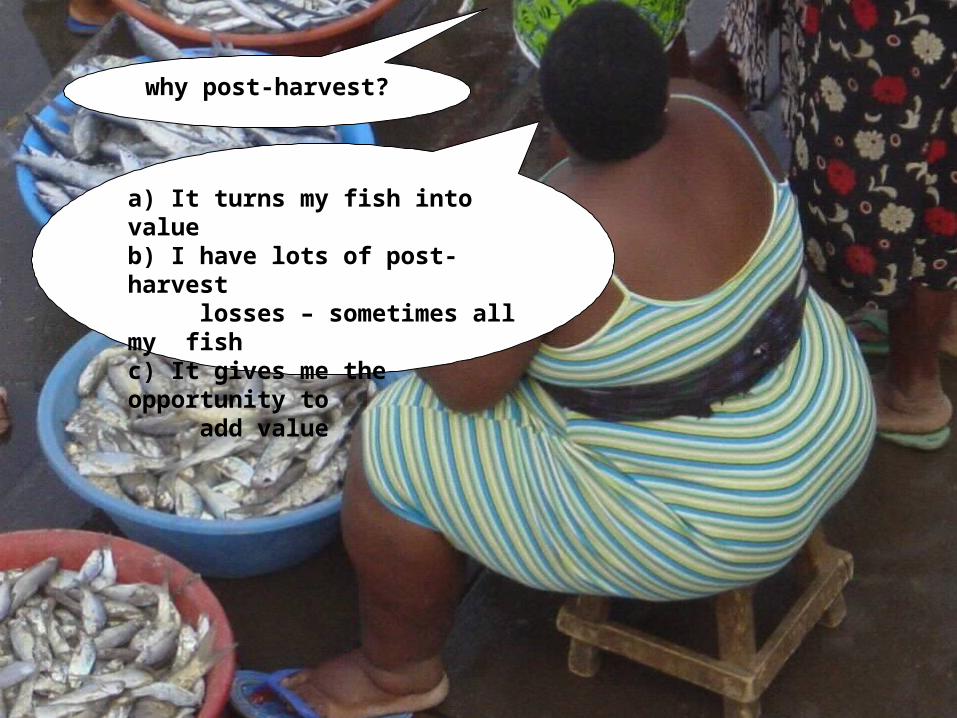
Why post harvest?
• it turns fish into value
• post-harvest losses are high – up to 100%
• it adds value
why post-harvest?
a) It turns my fish into valueb) I have lots of post-harvest losses – sometimes all my fishc) It gives me the opportunity to add value
• some price and market trends
• China – the market juggernaut
• trade disputes – the breaks on the truck
• subsidies - greasing the wheels - interactive exercise
contents
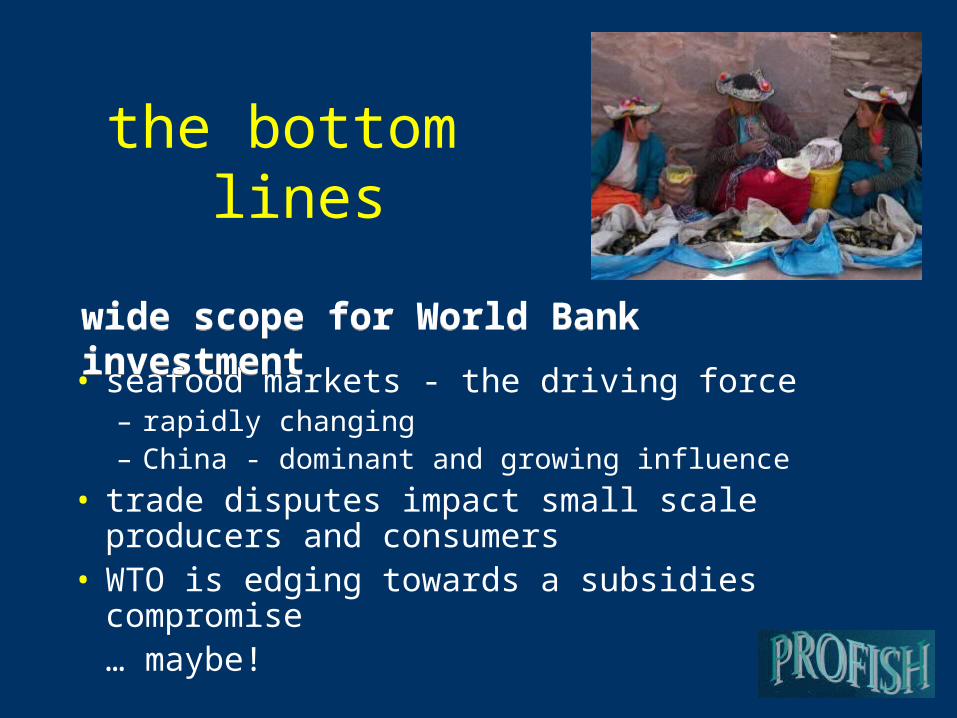
the bottom lines
• seafood markets - the driving force – rapidly changing – China - dominant and growing influence
• trade disputes impact small scale producers and consumers
• WTO is edging towards a subsidies compromise … maybe!
wide scope for World Bank investmentwide scope for World Bank investment
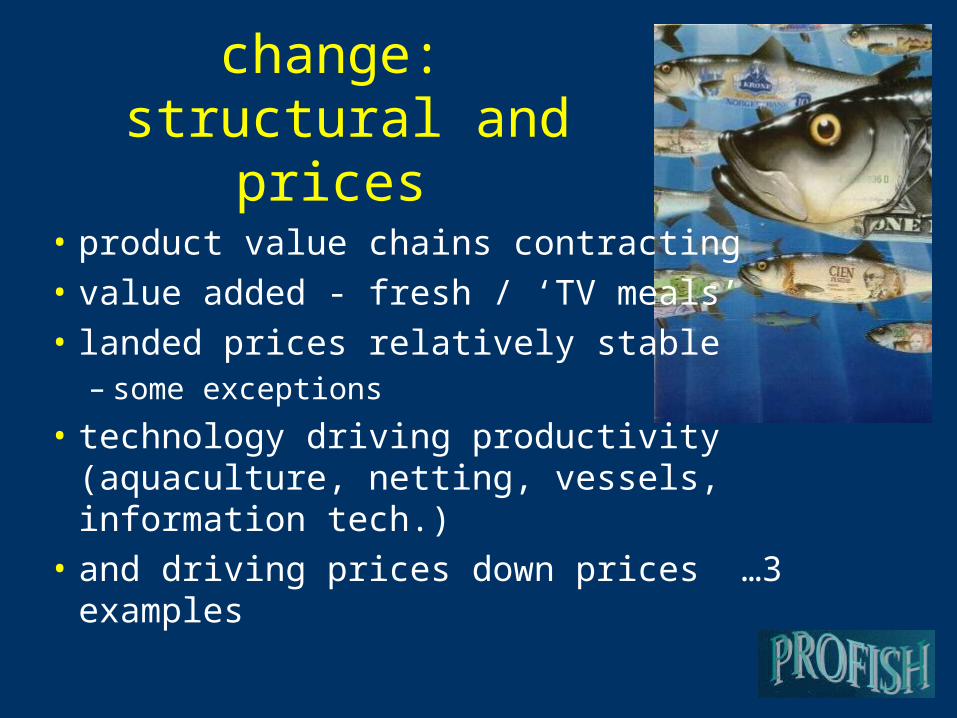
change: structural and prices
• product value chains contracting
• value added - fresh / ‘TV meals’
• landed prices relatively stable – some exceptions
• technology driving productivity (aquaculture, netting, vessels, information tech.)
• and driving prices down prices …3 examples
… … change in aquaculturechange in aquaculture
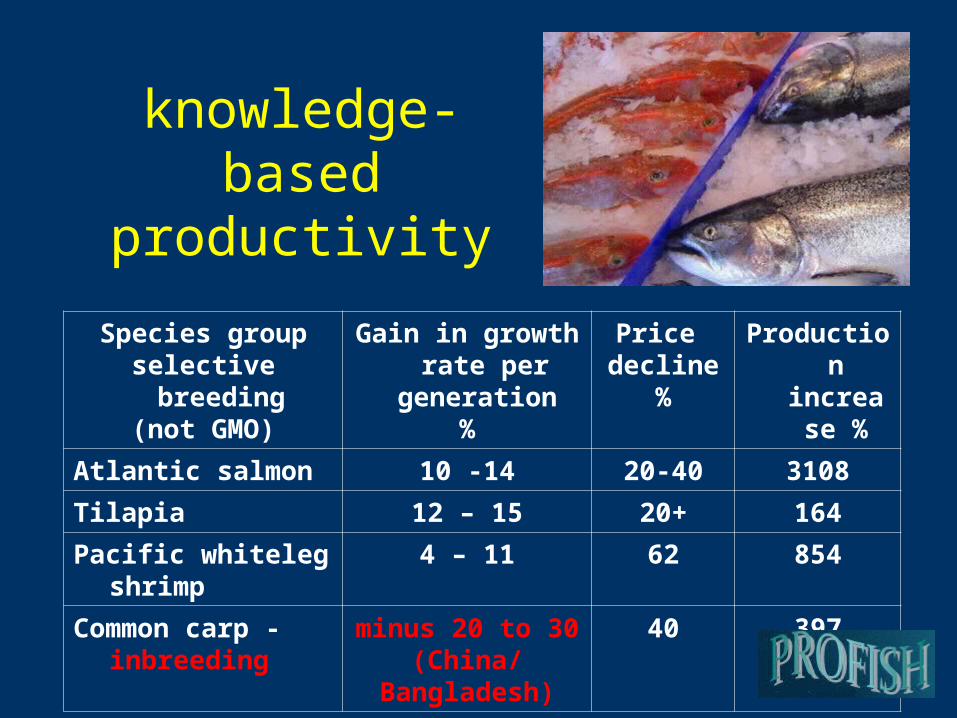
knowledge-basedproductivity
Species groupselective breeding
(not GMO)
Gain in growth rate per generation
%
Price decline
%
Production increase
%
Atlantic salmon 10 -14 20-40 3108
Tilapia 12 – 15 20+ 164
Pacific whiteleg shrimp
4 – 11 62 854
Common carp - inbreeding
minus 20 to 30(China/
Bangladesh)
40 397
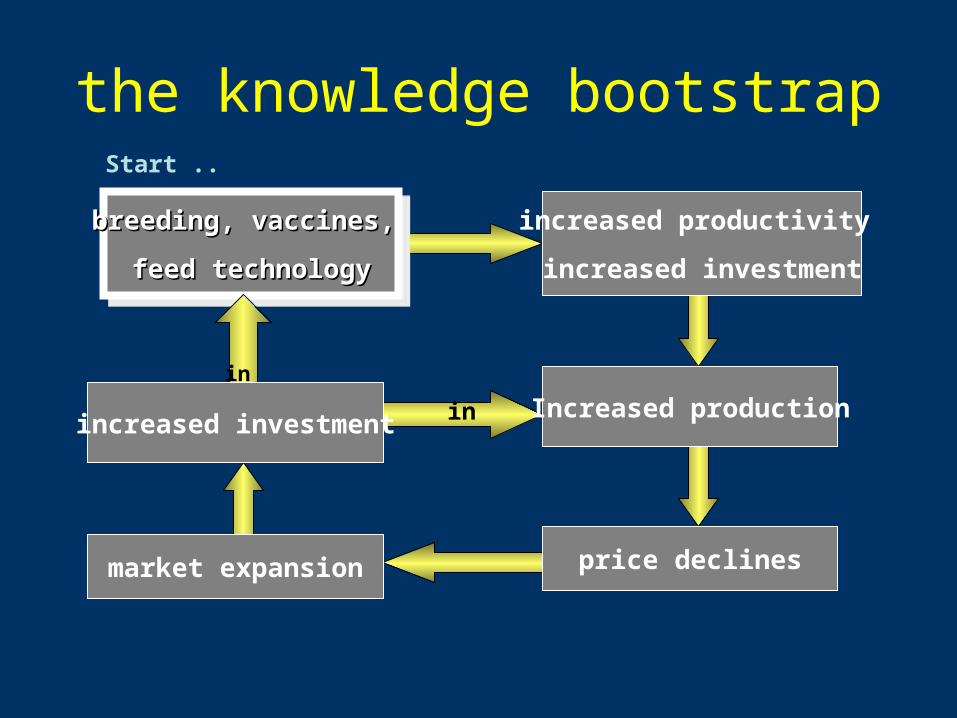
the knowledge bootstrap
breeding, vaccines, breeding, vaccines,
feed technologyfeed technology
breeding, vaccines, breeding, vaccines,
feed technologyfeed technology
increased productivity
increased investment
market expansion
Increased production
price declines
increased investment
Start ..
in
in
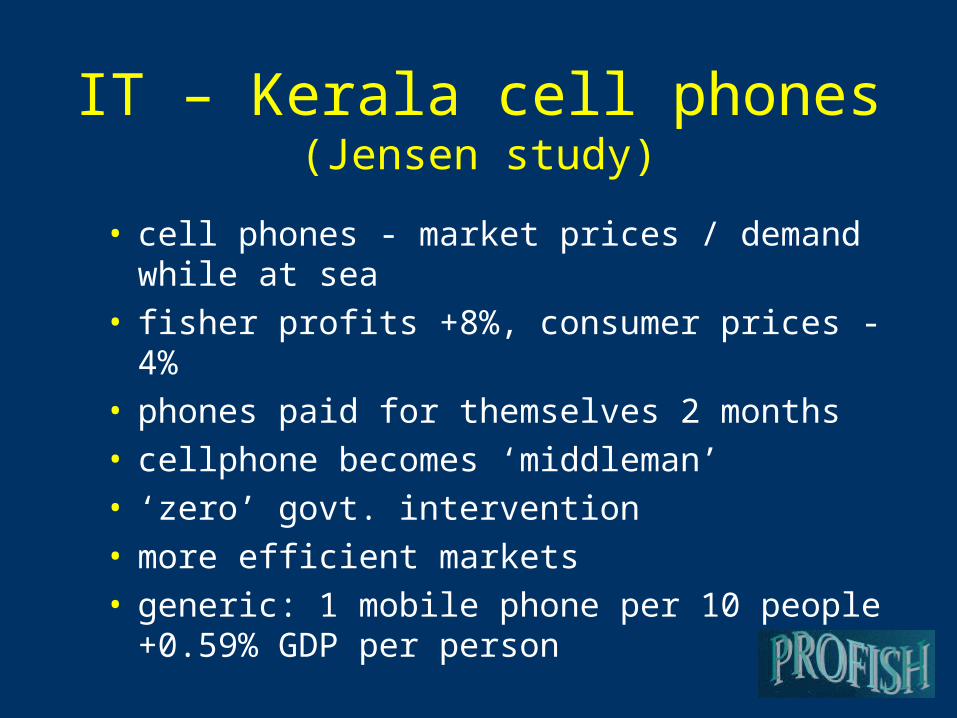
IT – Kerala cell phones(Jensen study)
• cell phones - market prices / demand while at sea• fisher profits +8%, consumer prices -4% • phones paid for themselves 2 months• cellphone becomes ‘middleman’• ‘zero’ govt. intervention• more efficient markets • generic: 1 mobile phone per 10 people +0.59%
GDP per person
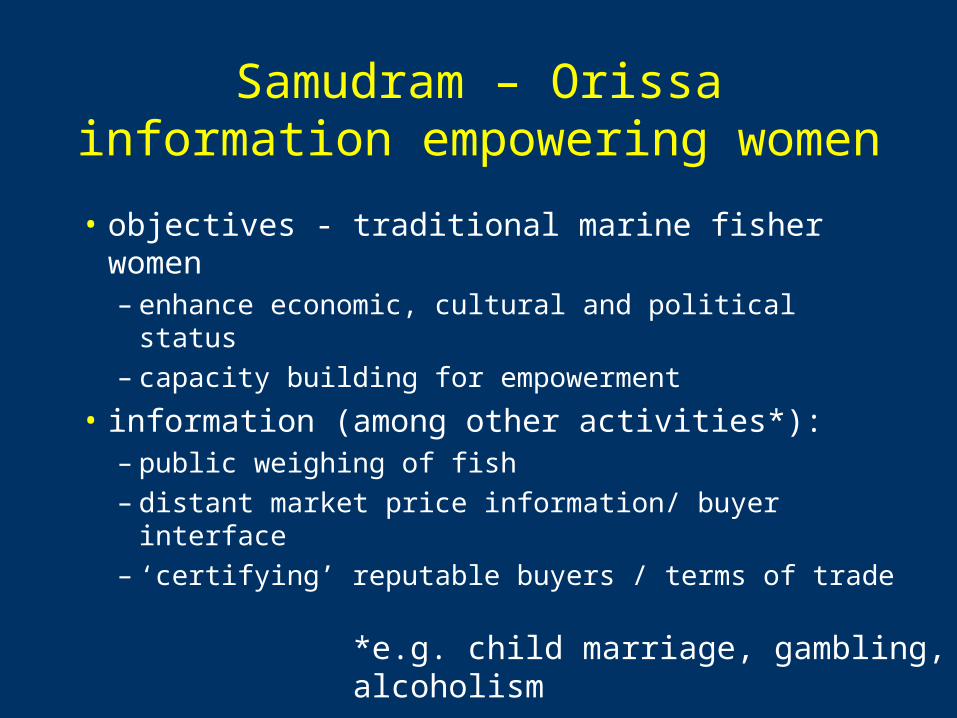
Samudram – Orissainformation empowering women
• objectives - traditional marine fisher women– enhance economic, cultural and political status– capacity building for empowerment
• information (among other activities*):– public weighing of fish– distant market price information/ buyer interface– ‘certifying’ reputable buyers / terms of trade
*e.g. child marriage, gambling, alcoholism
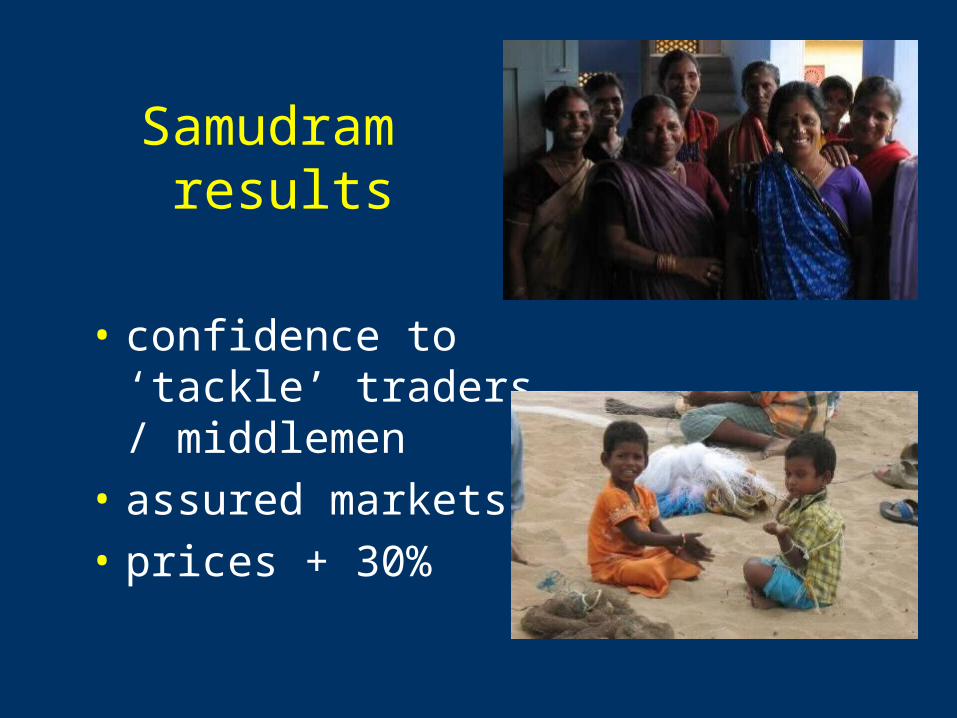
Samudram results
• confidence to ‘tackle’ traders / middlemen
• assured markets
• prices + 30%
Enter the
Dragon
Ooo! fish for dinner
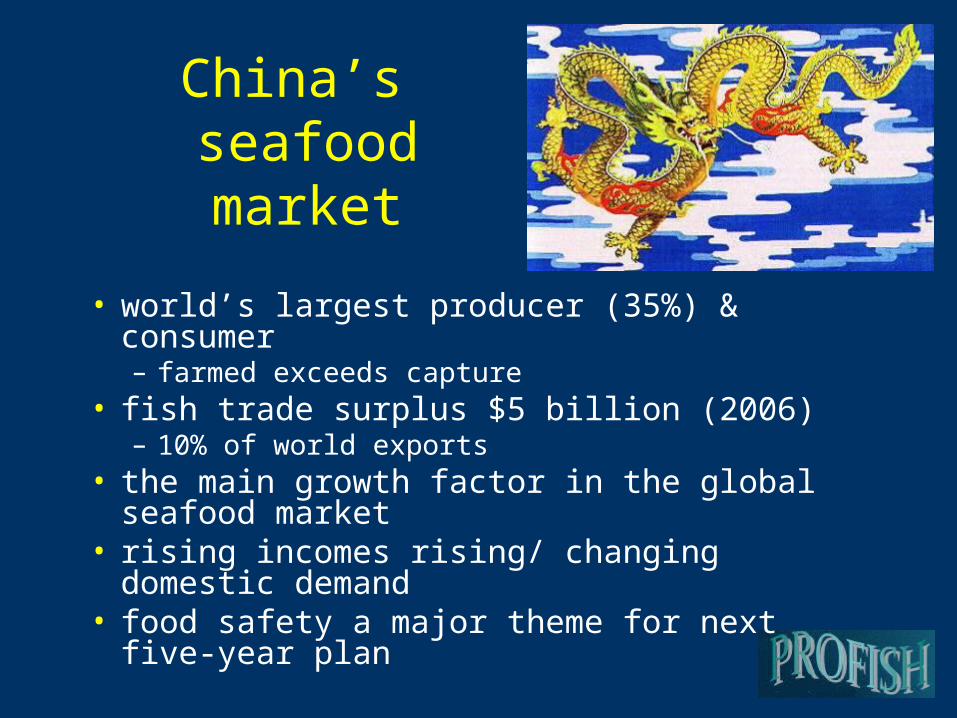
China’s seafood market
• world’s largest producer (35%) & consumer – farmed exceeds capture
• fish trade surplus $5 billion (2006)– 10% of world exports
• the main growth factor in the global seafood market
• rising incomes rising/ changing domestic demand
• food safety a major theme for next five-year plan
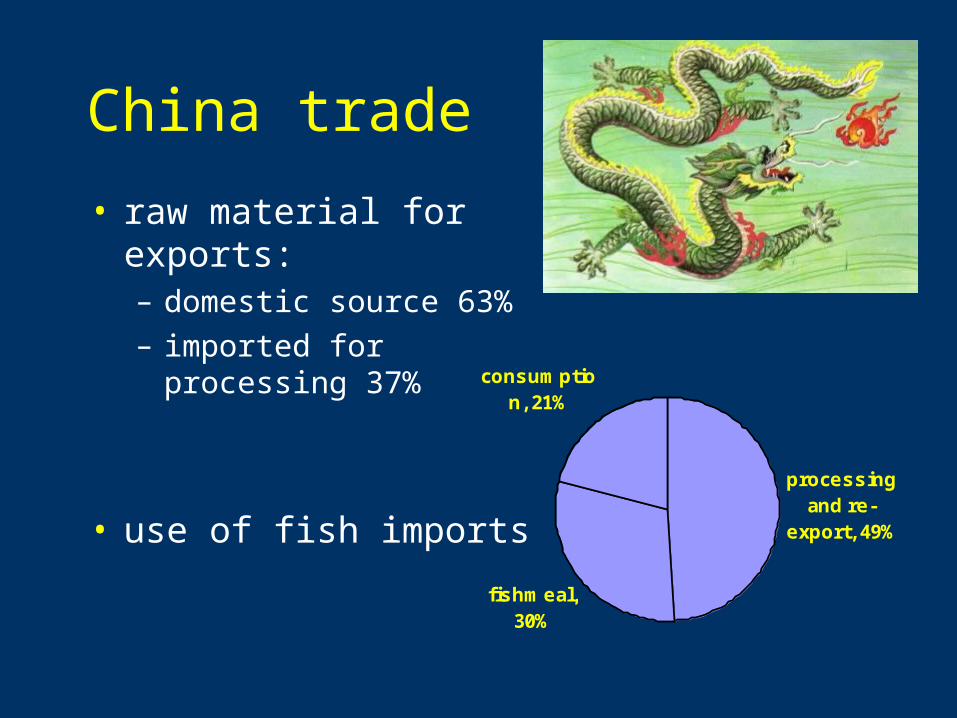
China trade
• raw material for exports:– domestic source 63%
– imported for processing 37%
• use of fish importsprocessing
and re-export, 49%
fishmeal, 30%
domestic consumptio
n, 21%
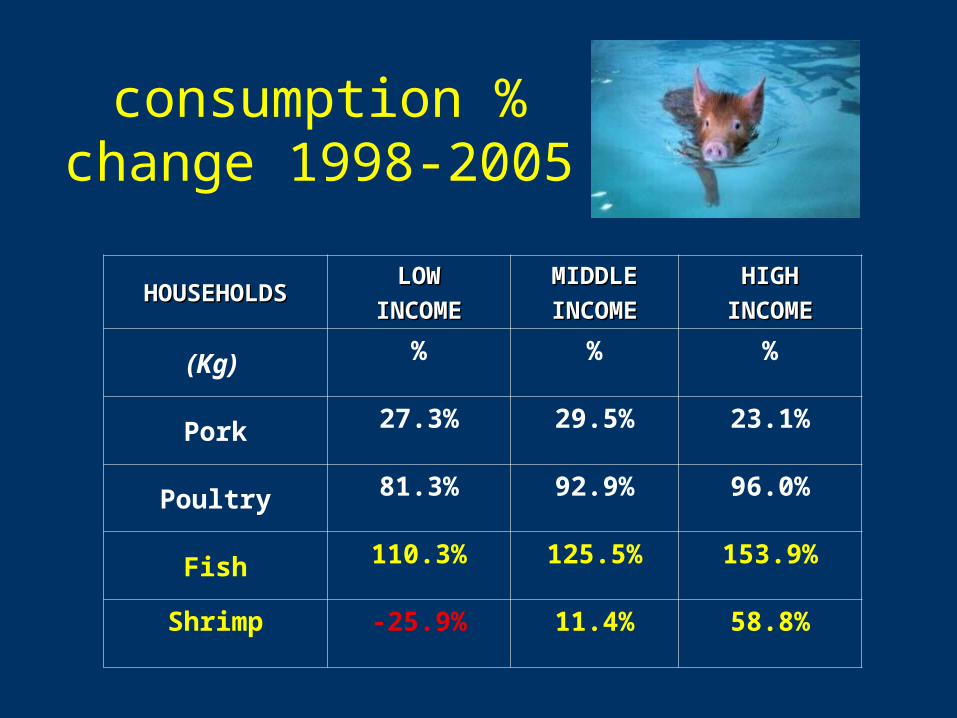
consumption % change 1998-2005
HOUSEHOLDSHOUSEHOLDSLOWLOW
INCOMEINCOME
MIDDLEMIDDLE
INCOMEINCOME
HIGHHIGH
INCOMEINCOME
(Kg) % % %
Pork 27.3% 29.5% 23.1%
Poultry 81.3% 92.9% 96.0%
Fish 110.3% 125.5% 153.9%
Shrimp -25.9% 11.4% 58.8%
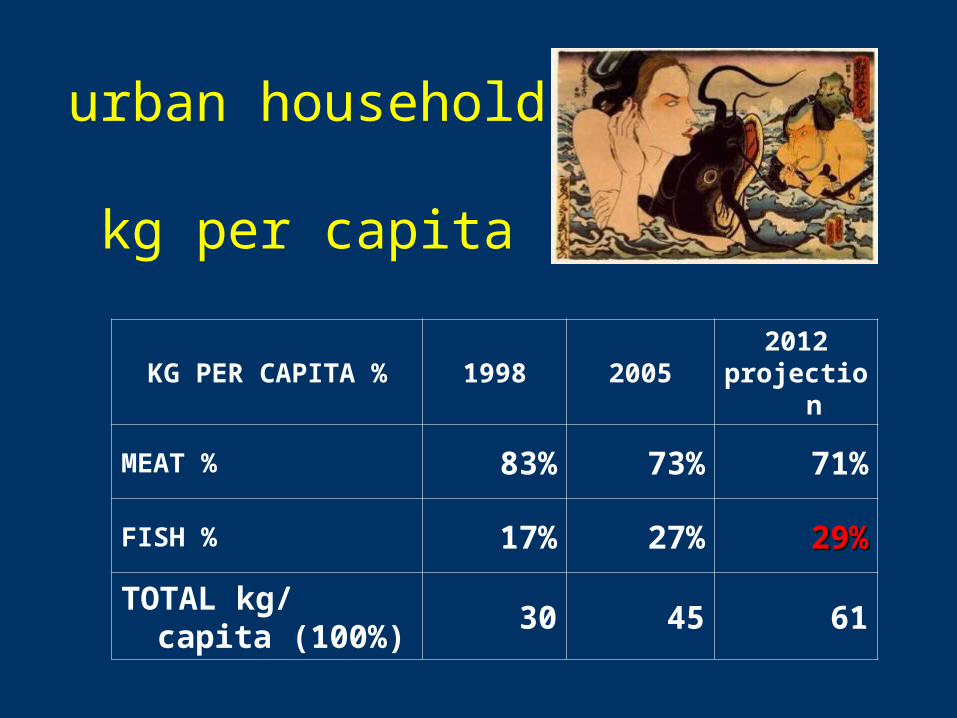
urban households kg per capita
KG PER CAPITA % 1998 20052012
projection
MEAT % 83% 73% 71%
FISH % 17% 27% 29%29%
TOTAL kg/ capita (100%)
30 45 61
trends/ concerns
• eating out• from wet market to supermarkets• increasing brand awareness• growing food safety issues (not just fish)
– number one concern for Chinese consumers!
– ‘made in China’ concern worldwide >200 rejections
– government launched a number of policies and measures
• …build environmentally aware consumers ?
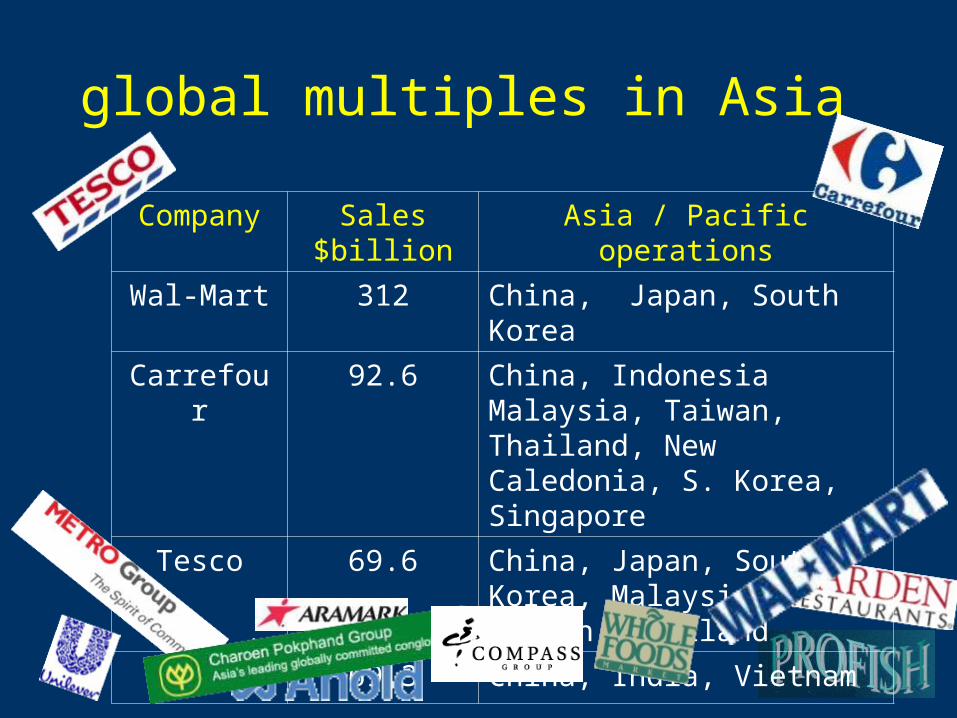
global multiples in Asia
Company Sales $billion Asia / Pacific operations
Wal-Mart 312 China, Japan, South Korea
Carrefour 92.6 China, Indonesia Malaysia, Taiwan, Thailand, New Caledonia, S. Korea, Singapore
Tesco 69.6 China, Japan, South Korea, Malaysia, Taiwan, Thailand
Metro 69.3 China, India, Vietnam
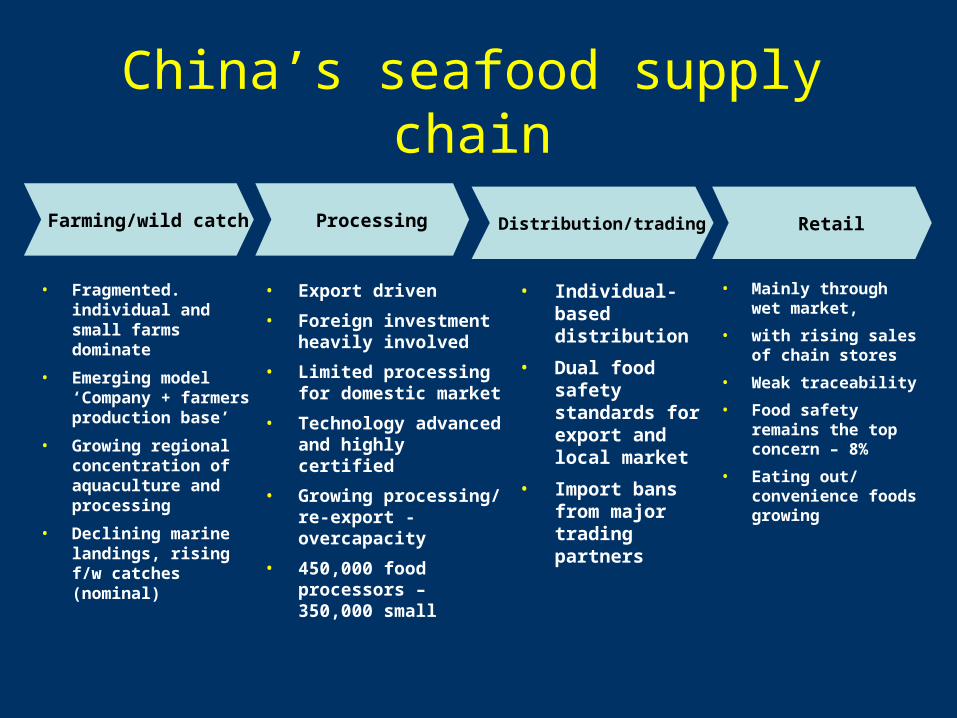
China’s seafood supply chain
Farming/wild catch
• Fragmented. individual and small farms dominate
• Emerging model ‘Company + farmers production base’
• Growing regional concentration of aquaculture and processing
• Declining marine landings, rising f/w catches (nominal)
Processing
• Export driven
• Foreign investment heavily involved
• Limited processing for domestic market
• Technology advanced and highly certified
• Growing processing/ re-export - overcapacity
• 450,000 food processors – 350,000 small
Distribution/trading Retail
• Mainly through wet market,
• with rising sales of chain stores
• Weak traceability
• Food safety remains the top concern – 8%
• Eating out/ convenience foods growing
• Individual-based distribution
• Dual food safety standards for export and local market
• Import bans from major trading partners
Fish Trade Wars
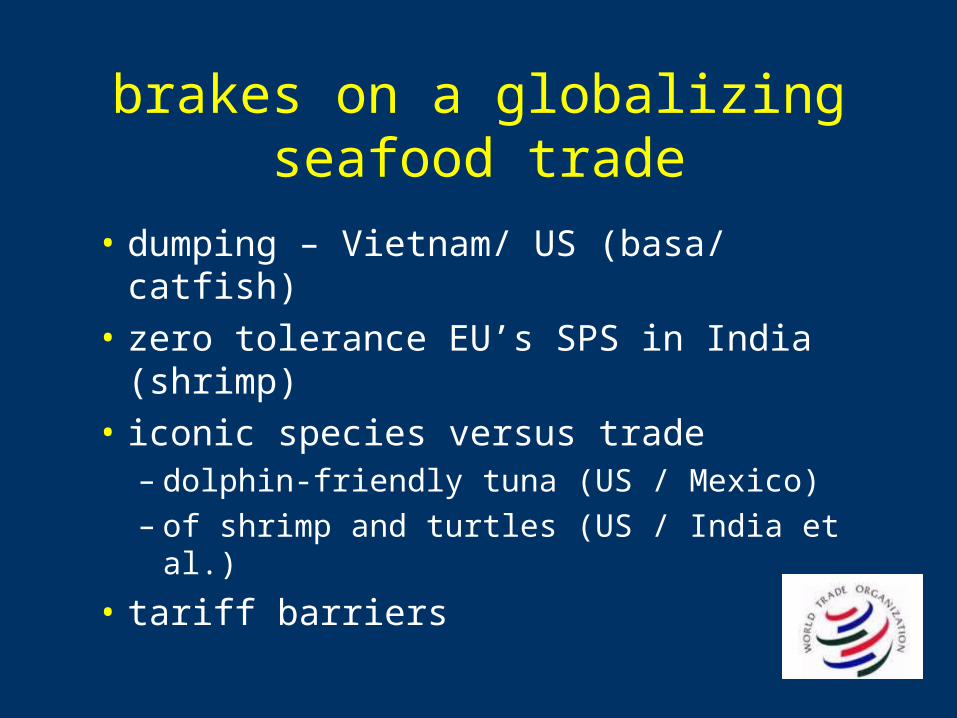
brakes on a globalizing seafood trade
• dumping – Vietnam/ US (basa/ catfish)
• zero tolerance EU’s SPS in India (shrimp)
• iconic species versus trade– dolphin-friendly tuna (US / Mexico)– of shrimp and turtles (US / India et al.)
• tariff barriers
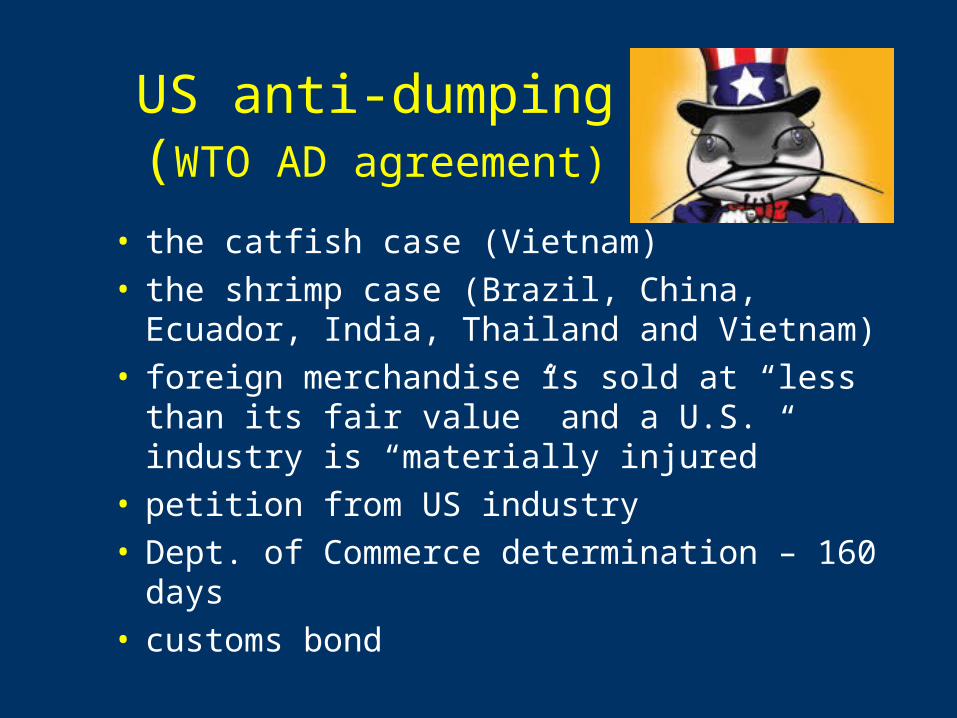
US anti-dumping(WTO AD agreement)
• the catfish case (Vietnam)• the shrimp case (Brazil, China, Ecuador, India,
Thailand and Vietnam)• foreign merchandise is sold at “less than its fair
value” and a U.S. industry is “materially injured”• petition from US industry• Dept. of Commerce determination – 160 days• customs bond
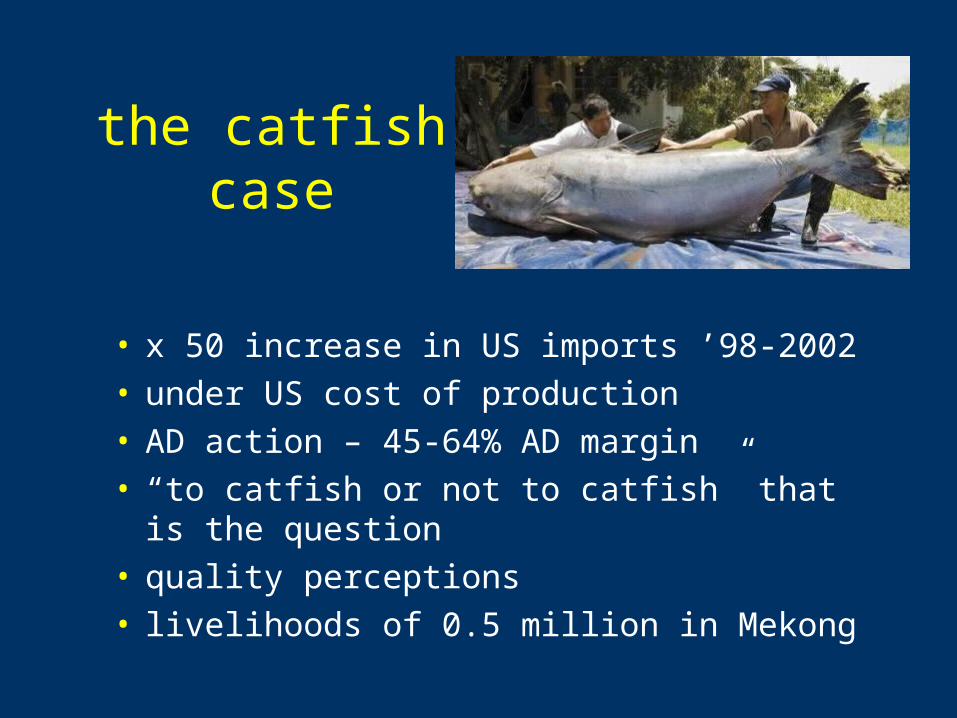
the catfishcase
• x 50 increase in US imports ’98-2002• under US cost of production• AD action – 45-64% AD margin• “to catfish or not to catfish” that is the question• quality perceptions• livelihoods of 0.5 million in Mekong
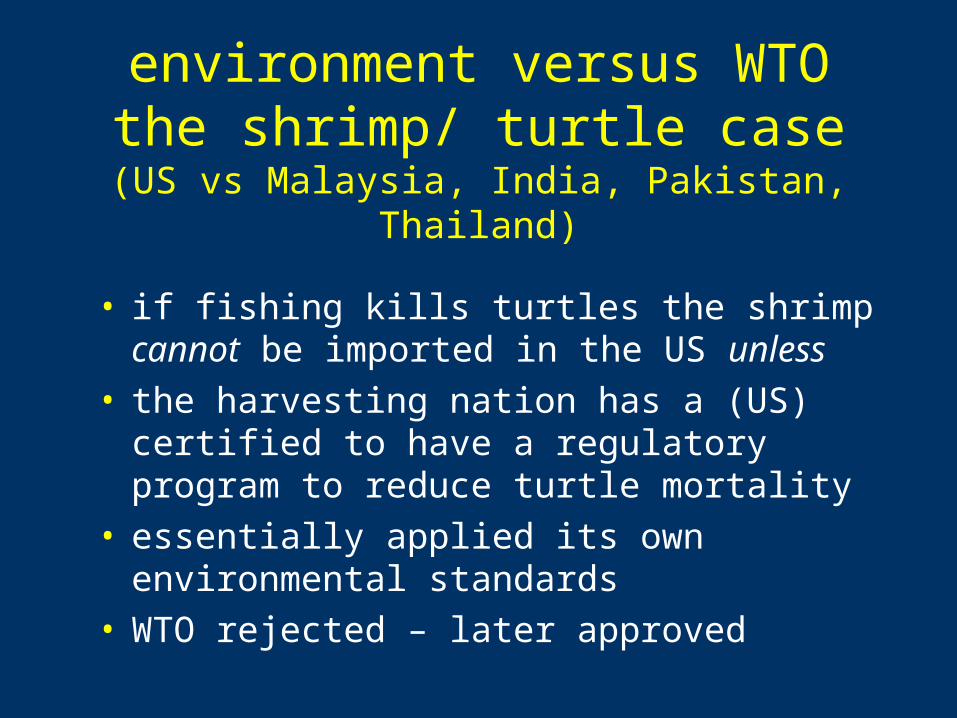
environment versus WTOthe shrimp/ turtle case
(US vs Malaysia, India, Pakistan, Thailand)
• if fishing kills turtles the shrimp cannot be imported in the US unless
• the harvesting nation has a (US) certified to have a regulatory program to reduce turtle mortality
• essentially applied its own environmental standards
• WTO rejected – later approved
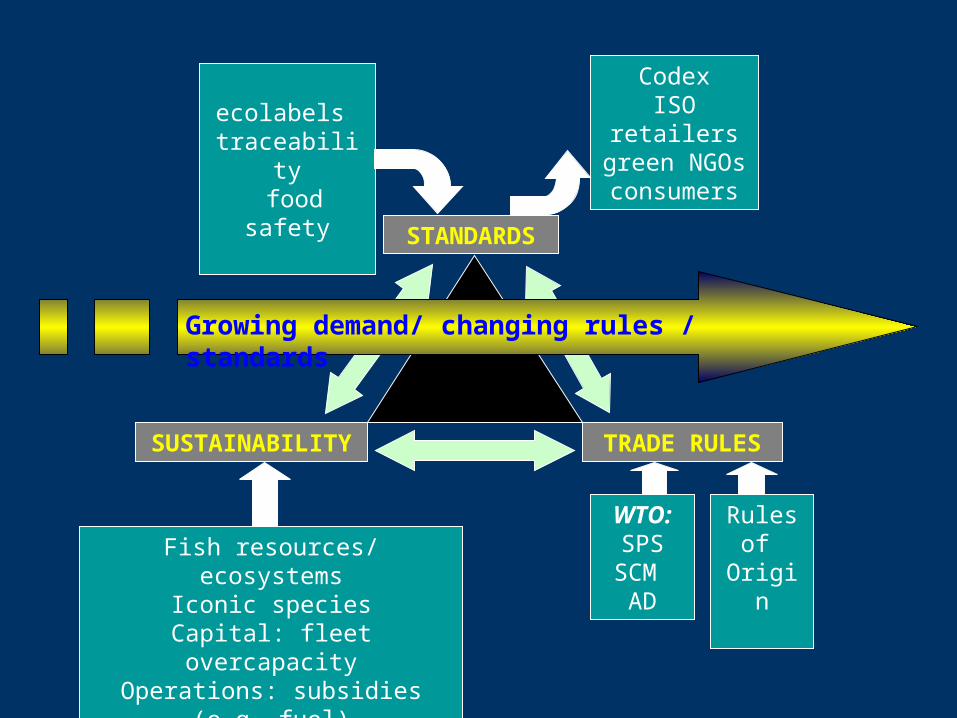
SUSTAINABILITY
Fish resources/ ecosystemsIconic species
Capital: fleet overcapacityOperations: subsidies (e.g. fuel)
STANDARDS
TRADE RULES
ecolabels traceability food safety
WTO:SPSSCM
AD
Rules of
Origin
CodexISO
retailersgreen NGOsconsumers
Growing demand/ changing rules / standards
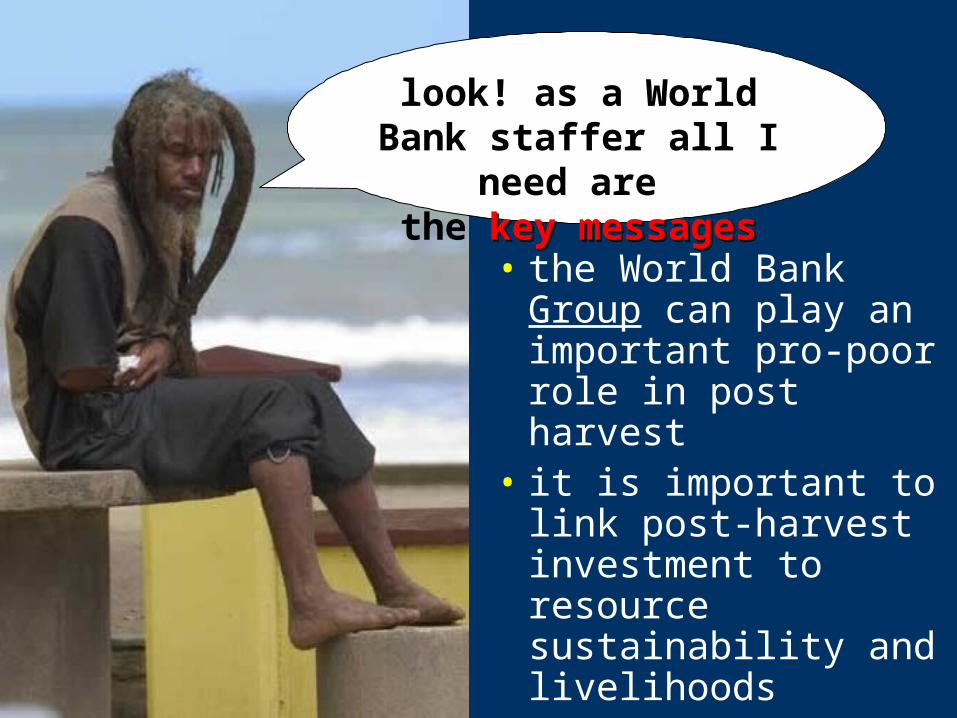
look! as a World Bank staffer all I need are
the key messageskey messages
• the World Bank Group can play an important pro-poor role in post harvest
• it is important to link post-harvest investment to resource sustainability and livelihoods
Are you seriously
suggesting putting people before fish ?
Is it PROFISH, or pro-poor ?
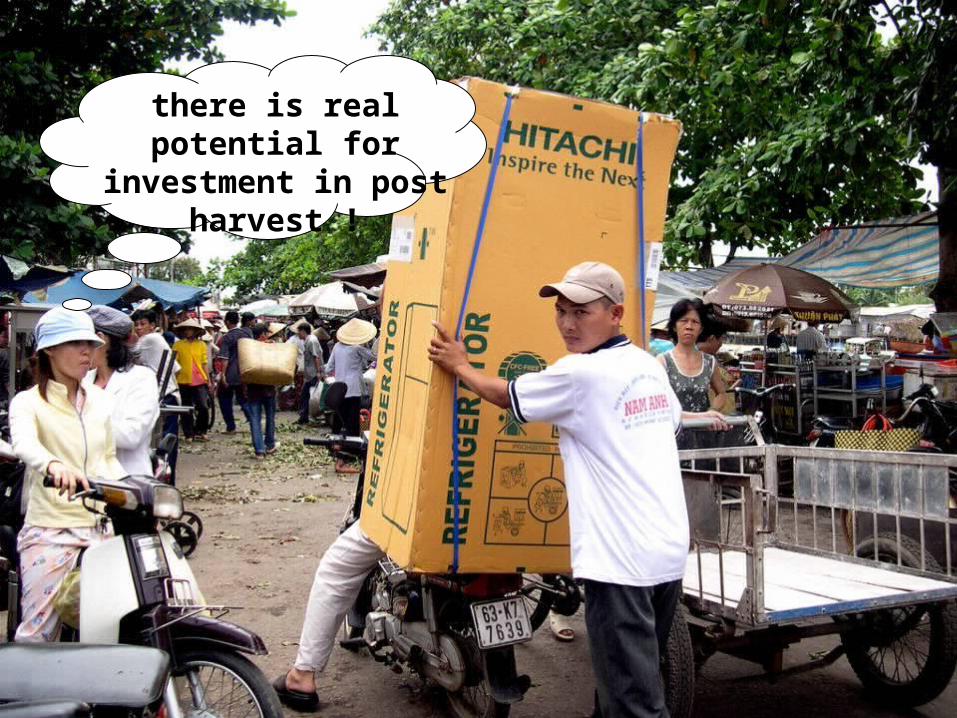
there is real potential for
investment in post harvest !
investments• governance
• public-private partnerships
• capacity building for fair and equitable trade
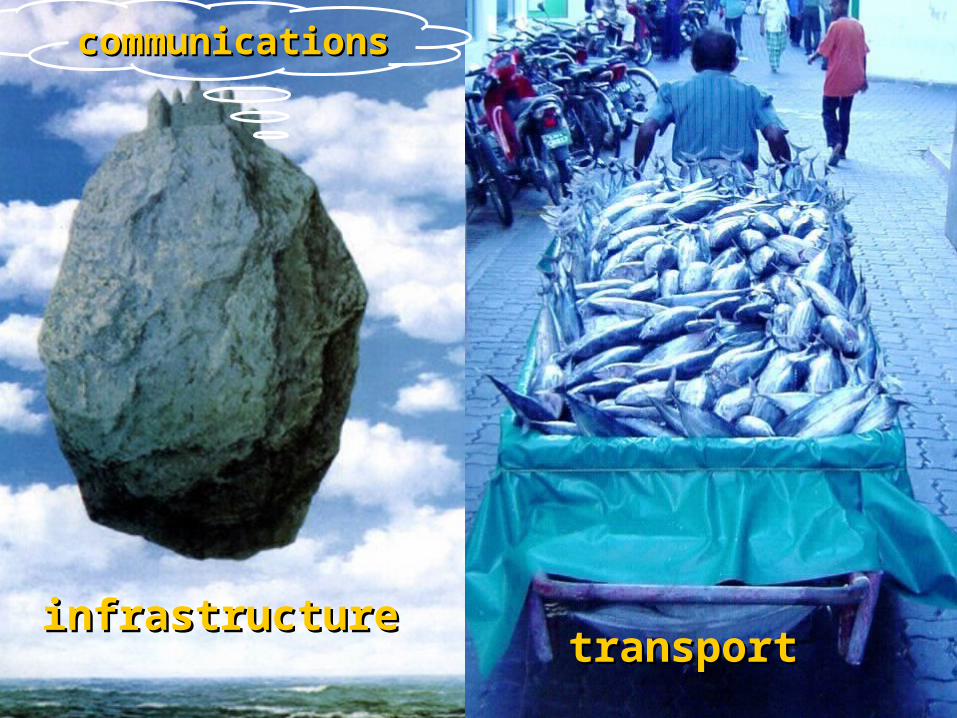
infrastructureinfrastructuretransporttransport
communicationscommunications
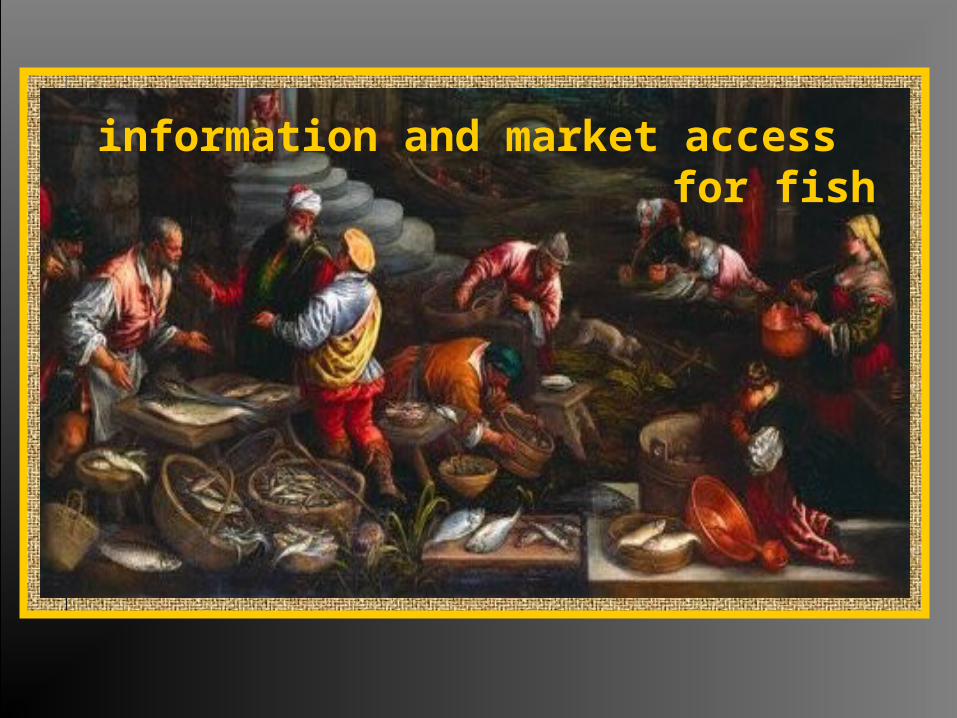
information and market access for fish
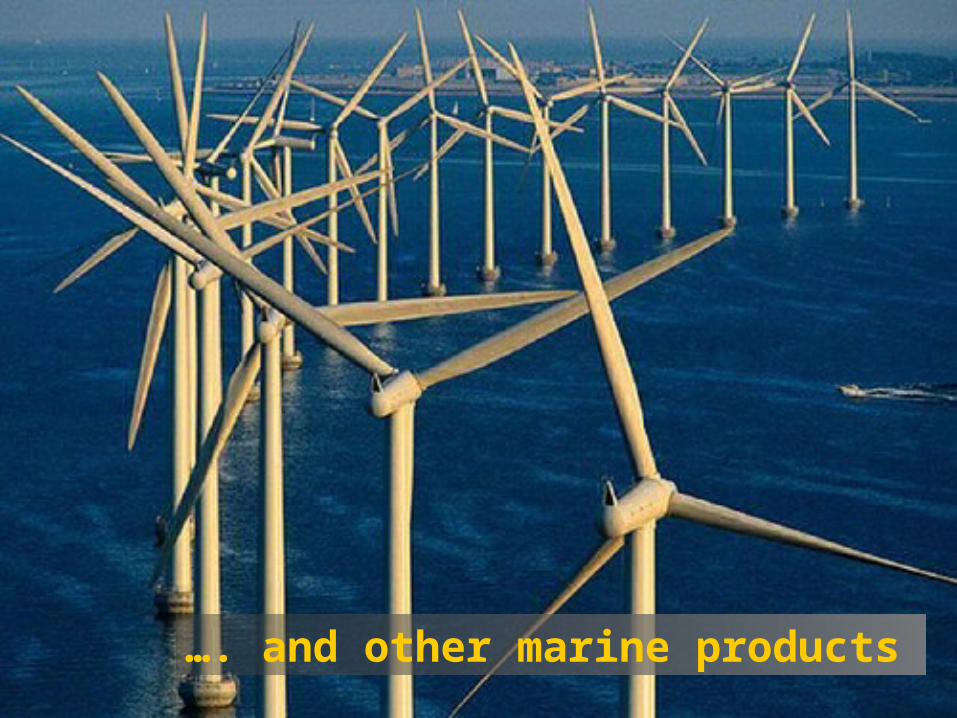
…. and other marine products
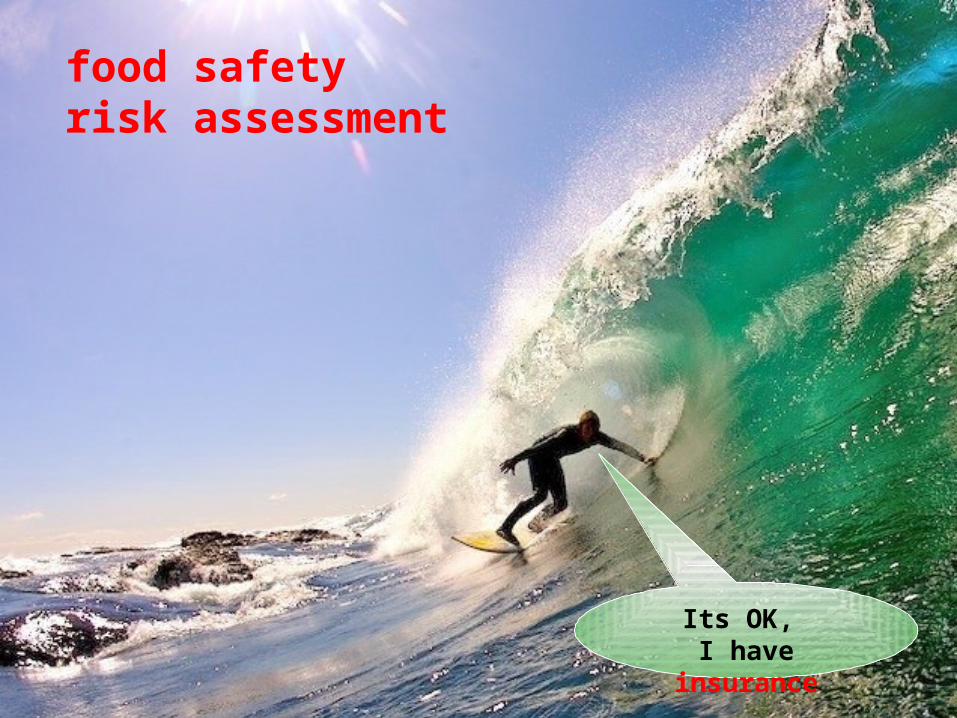
food safetyrisk assessment
Its OK, I have
insurance
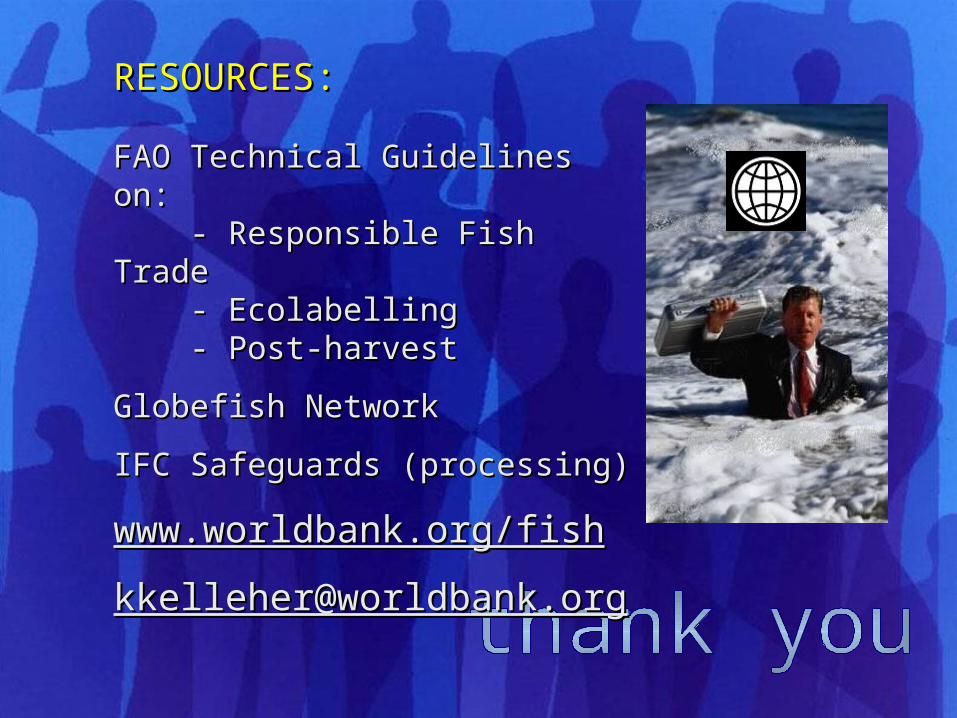
RESOURCES:RESOURCES:
FAO Technical Guidelines on:FAO Technical Guidelines on: - Responsible Fish Trade- Responsible Fish Trade - Ecolabelling- Ecolabelling - Post-harvest- Post-harvest
Globefish NetworkGlobefish Network
IFC Safeguards (processing)IFC Safeguards (processing)
www.worldbank.org/fishwww.worldbank.org/fish
[email protected]@worldbank.org