Embed Size (px)
Citation preview
California Integrated Waste Management Board
May 2008
California Environmental Protection Agency
Postconsumer Agricultural Plastic Report
Produced Under Contract by: Sean Hurley, California Polytechnic State University
Contractor’s Report
To The Board

Disclaimer: This report to the Board was produced under contract by Sean Hurley with The
California Polytechnic State University. The statements and conclusions contained in this report
are those of the contractor and not necessarily those of the California Integrated Waste
Management Board, its employees, or the State of California and should not be cited or quoted as
official Board policy or direction.
The State makes no warranty, expressed or implied, and assumes no liability for the information
contained in the succeeding text. Any mention of commercial products or processes shall not be
construed as an endorsement of such products or processes.
S T A T E O F C A L I F O R N I A
Arnold Schwarzenegger
Governor
Linda S. Adams
Secretary, California Environmental Protection Agency
INTEGRATED WASTE MANAGEMENT BOARD
Margo Reid Brown
Board Chair
Cheryl Peace
Board Member
Wesley Chesbro
Board Member
Gary Petersen
Board Member
Rosalie Mulé
Board Member
Mark Leary
Executive Director
For additional copies of this publication, contact:
Integrated Waste Management Board Public Affairs Office, Publications Clearinghouse (MS–6)
1001 I Street P.O. Box 4025
Sacramento, CA 95812-4025 www.ciwmb.ca.gov/Publications/
1-800-CA-WASTE (California only) or (916) 341-6306
Publication #IWMB-2008-019
Copies of this document originally provided by CIWMB were printed on recycled paper containing 100 percent postconsumer fiber.
Copyright © 2008 by the California Integrated Waste Management Board. All rights reserved. This publication, or parts thereof, may not be reproduced in any form without permission.
Prepared as part of contract number IWM 05050 for $85,000
The California Integrated Waste Management Board (CIWMB) does not discriminate on the basis of disability in access to its programs. CIWMB publications are available in accessible formats upon request
by calling the Public Affairs Office at (916) 341-6300. Persons with hearing impairments can reach the CIWMB through the California Relay Service, 1-800-735-2929.

Contractor’s Report to the Board i
Table of Contents Table of Contents ........................................................................................................................................... i
Acknowledgments ........................................................................................................................................ iii
Executive Summary ...................................................................................................................................... 5
Plasticulture in California ....................................................................................................................... 5
The Survey ............................................................................................................................................. 5
Major Findings ....................................................................................................................................... 6
Future Research ...................................................................................................................................... 9
Introduction ................................................................................................................................................. 11
LITERATURE REVIEW ..................................................................................................................... 12
Data Collection ........................................................................................................................................... 17
Focus Groups ........................................................................................................................................ 17
Design and Implementation of the Producer Survey ............................................................................ 21
Survey Results ............................................................................................................................................ 24
General results ...................................................................................................................................... 24
Results for the Berry Industry Other Than Strawberries ...................................................................... 29
Results for the Strawberry Industry ...................................................................................................... 32
Results for the Grape Industry .............................................................................................................. 38
Results for the Melon Industry ............................................................................................................. 42
Results for the Orchard Industry .......................................................................................................... 46
Results for the Pepper Industry ............................................................................................................ 49
Results for the Tomato Industry ........................................................................................................... 53
Results for the Vegetable Industry ....................................................................................................... 56
Results for the Dairy Industry .............................................................................................................. 60
Results for the Hay Industry ................................................................................................................. 64
Results for the Greenhouse Industry .................................................................................................... 68
Results for the Nursery Industry ........................................................................................................... 74
Estimated Annual Disposal of Agricultural Plastics for California ............................................................ 80
A First Estimate of Agricultural Plastic Disposal: All Farms are Equal .............................................. 80
A Second Estimate of Agricultural Plastic Disposal: Accounting for Farm Size ................................ 80
A Third Estimate of Agricultural Plastic Disposal: Accounting for Non-Uniformity in Plastic Usage
by Industry ............................................................................................................................................ 81
Recycling Strategy ...................................................................................................................................... 84
Focus on the Large Producers .............................................................................................................. 85
Incentives and Difficulties Which Need Addressing ........................................................................... 85

Contractor’s Report to the Board ii
Future Research .................................................................................................................................... 86
Summary ..................................................................................................................................................... 87
Appendix A ................................................................................................................................................. 90
Producer’s Survey Instrument ..................................................................................................................... 90
Appendix B ................................................................................................................................................. 95
Summary of County Information ................................................................................................................ 95
Bibliography ............................................................................................................................................... 98

Contractor’s Report to the Board iii
Acknowledgments Partial funding for this project has been made available by the Governor’s Buy California
Initiative, the California Department of Food and Agriculture (―CDFA‖) and the U.S. Department
of Agriculture (―USDA‖). The content of this publication does not necessarily reflect the views or
policies of CDFA or USDA, nor does any mention of trade names, commercial products, and
organizations imply endorsement of them by CDFA or USDA.
I would like to thank the many people at the California Integrated Waste Management Board who
provided project management support for this project and technical editing to this final draft,
including Michael Leaon, Neal Johnson, Kathy Marsh, and Amber Robinson-Burmester.

Contractor’s Report to the Board 4

Contractor’s Report to the Board 5
Executive Summary
Plasticulture in California
The use of plastic in agriculture dates as far back as 1948 and, since then, has spread throughout
the agricultural industry. Plastic and its use has become important to the industry and named
plasticulture by scientists who have examined its usage. Some of the many uses of plastic in
agriculture include: 1) plastic film mulches, 2) drip irrigation tape, 3) row covers, 4) low tunnels,
5) high tunnels, 6) silage bags, 7) hay bale wraps, and 8) plastic trays and pots used in transplant
and bedding plant production.
California is one of the most diverse agricultural states in the nation with more than 400
commodities grown within the state. This state produced $32 billion in direct farm sales in 2005,
which makes it the largest agricultural-producing state in the country and one of the largest in the
world. With so much diversity in agricultural production, it is not surprising that a segment of
California producers engage in the practice of plasticulture to enhance their crop production.
Many of the top 20 agricultural commodities in the state have a proportion of their producers
engaged in plasticulture.
While it is understood that plasticulture is practiced in California, it is unclear how much plastic
is used by each agricultural industry in the state, as well as how it is used. There is also a lack of
knowledge on the disposal and recycling practices used by the producers. This report presents a
detailed examination of plastic usage in California agriculture and develops a recycling strategy
for agricultural plastic in the state.
There were four primary tasks assigned to this project:
Conduct an extensive review of the literature on recycling agricultural plastics.
Conduct a focus group with agricultural producers regarding their use and recycling of
agricultural plastic.
Develop and conduct a survey to examine California producers’ usage and recycling of
agricultural plastic.
Use the results from the survey and focus group to develop a strategy for recycling
agricultural plastic.
The Survey
Information analyzed in this report was from a survey developed from focus groups of producers
and administered to California agricultural producers. This survey was categorized into five
different sections. The first section of the survey collected information regarding the producers
operation, i.e., general demographic information. Sections Two through Four gathered specific
information by type of plastic regarding producers’ usage and disposal of agricultural plastic. The
final section explored general information regarding producers’ disposal and recycling of
agricultural plastic.
The producers in the survey were represented by the following industry groups: berries other than
strawberries, strawberries, peppers, melons, tomatoes, nursery, greenhouse and horticulture,
dairy, hay, grapes, and orchards which included stone fruit and tree nuts. Information was also

Contractor’s Report to the Board 6
collected regarding plastic usage by producer who produce other types of vegetables other than
the ones listed. These groups are believed to use the bulk of the agricultural plastic in California.
Surveys were sent out to 3,000 producers in the state. Out of all the surveys sent out, 2,206
producers sent back the survey by mail, completed the survey by phone, or verbally declined over
the phone to participate in the survey. There were 895 producers who responded to at least a
portion of the survey with 389 respondents indicating that they use agricultural plastic. Hence, 43
percent of the producers that filled out a portion of the survey indicated they used some form of
agricultural plastic. Examining this usage rate by industry showed that the orchard industry had
the lowest participation rate at 22 percent and the strawberry industry had the highest usage rate
of 94 percent. The other usage rates for the other industries in the study are in Table ES 1.
Table ES 1: Percentage of Survey Respondents Using Agricultural Plastic by Industry
Industry
Number of Survey
Respondents
Number Indicating Plastic
Usage Percentage Using
Agricultural Plastic
Berries other than strawberries 36 16 44.44%
Strawberries 64 60 93.75%
Grapes 140 33 23.57%
Melon 38 24 63.16%
Orchard 281 63 22.42%
Pepper 52 38 73.08%
Tomatoes 102 37 36.27%
Vegetables 128 67 52.34%
Dairy 65 39 60.00%
Hay 168 67 39.88%
Greenhouse 94 71 75.53%
Nursery 154 107 69.48%
Major Findings
One finding in this study is that there currently is a group of producers who indicated that they are
recycling some of their agricultural plastic. This group represents 35.94 percent of the plastic
users in the survey. This suggests that there is a group of producers who have found value in
recycling their agricultural plastic and are currently undertaking the practice. Table ES 2 shows
the participation rate of recycling by industry. Examining this table shows that the melon industry
had the lowest recycling rate at 13 percent, while the nursery industry had the highest recycling
rate at 46 percent. These results suggest that there is a current demand for recycling services.
Contractor’s Report to the Board 7
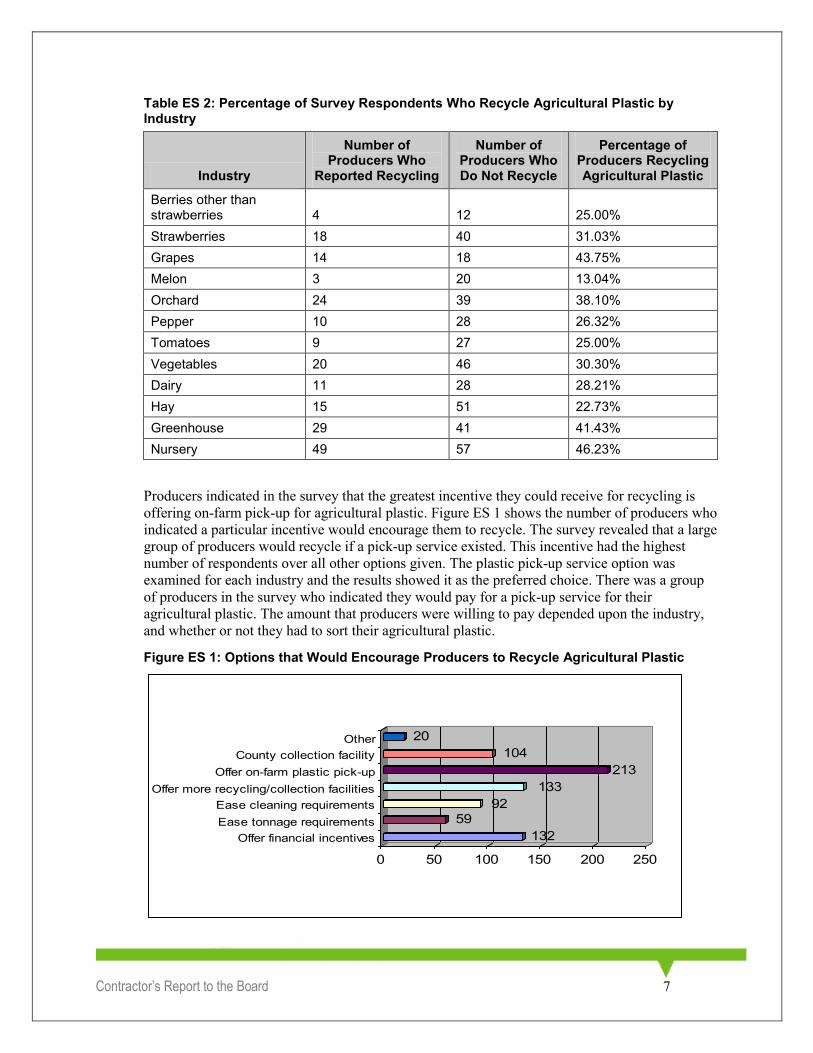
Table ES 2: Percentage of Survey Respondents Who Recycle Agricultural Plastic by Industry
Industry
Number of Producers Who
Reported Recycling
Number of Producers Who Do Not Recycle
Percentage of Producers Recycling Agricultural Plastic
Berries other than strawberries 4 12 25.00%
Strawberries 18 40 31.03%
Grapes 14 18 43.75%
Melon 3 20 13.04%
Orchard 24 39 38.10%
Pepper 10 28 26.32%
Tomatoes 9 27 25.00%
Vegetables 20 46 30.30%
Dairy 11 28 28.21%
Hay 15 51 22.73%
Greenhouse 29 41 41.43%
Nursery 49 57 46.23%
Producers indicated in the survey that the greatest incentive they could receive for recycling is
offering on-farm pick-up for agricultural plastic. Figure ES 1 shows the number of producers who
indicated a particular incentive would encourage them to recycle. The survey revealed that a large
group of producers would recycle if a pick-up service existed. This incentive had the highest
number of respondents over all other options given. The plastic pick-up service option was
examined for each industry and the results showed it as the preferred choice. There was a group
of producers in the survey who indicated they would pay for a pick-up service for their
agricultural plastic. The amount that producers were willing to pay depended upon the industry,
and whether or not they had to sort their agricultural plastic.
Figure ES 1: Options that Would Encourage Producers to Recycle Agricultural Plastic
132
59
92
133
213
104
20
0 50 100 150 200 250
Offer financial incentives
Ease tonnage requirements
Ease cleaning requirements
Offer more recycling/collection facilities
Offer on-farm plastic pick-up
County collection facility
Other

Contractor’s Report to the Board 8
Figure ES 2 displays the producers’ expected and experienced difficulties with recycling
agricultural plastic. The producers in this study indicated that the greatest difficulty they perceive
or have encountered with recycling their agricultural plastic is that the recycling facilities are too
far from their operations. This suggests that one way to increase the recycling rate is to have
recycling facilities closer to the point of operation. Another top identified difficulty was that there
are too many restrictions on recycling agricultural plastic. These restrictions could include the
type, color, amount, cleanliness, etc. It is expected that if some of these restrictions were lifted,
the recycling participation rate would increase.
Figure ES 2: Expected and Experienced Difficulties with Recycling Agricultural Plastic
71
100
104
74
70
30
0 20 40 60 80 100 120
Not having enough product
Too many restrictions
Recycling facilities too far
Transportation too costly
Too costly (other than transportation)
Other
When examining many of the results in this study, it was found that the average results were
substantially higher than the median results. This indicates that there are a few producers at the
upper end of the distribution of each answer that strongly pull the average away from the median.
This suggests that agricultural plastic usage is concentrated on larger farms utilizing relatively
large amounts of plastic. This also indicates that a successful recycling strategy would target their
efforts on getting these large producers on-board with recycling if they wanted to capture the
easiest source of plastic first.
Using the survey information, three estimates were developed for how much agricultural plastic is
disposed of on a yearly basis. The first estimate relied on the assumption that the average usage
per farm in the survey was equivalent to the average usage of the farms in California. Using this
formula the estimate of the annual agricultural plastic disposal for the state is 198,289.8 tons.
This assumption was not practical because it weighs each farm equally in production and size
which is not the case in the state due to its diversity in the types of crops.
Using a more realistic assumption that approximately 25 percent of the producers in the state
produce over 96 percent of the agricultural product, agricultural plastic disposal for the state was
estimated at 48,768.8 tons per year. A third and more refined estimate was made that took into
account that plastic disposal was dependent upon the different industries that used agricultural
plastic. The total and industry estimates of agricultural plastic disposal are presented in Table ES
3. This industry information provided a new estimate of plastic disposal at 55,506.7 tons per year.
This is considered the most accurate estimate given the information collected in the survey. This
estimate would increase to 107,794.3 tons per year if there was 100 percent participation in

Contractor’s Report to the Board 9
plastic usage by producers in each industry. This is a better estimate of the total upper limit on the
amount of agricultural plastic disposal given current production methods.
Table ES 3: Estimated Tonnage of Agricultural Plastic Disposed of on a Yearly Basis by Industry
Industry
Tons of Agricultural Plastic Disposed of Annually
Estimate Based on Average Producer
Estimate Based on Median Producer
Other Vegetables 12,194.29 4,101.06
Greenhouse and Nursery 11,799.81 927.21
Strawberries with Fumigation Plastic 10,484.31 9,555.00
Dairy 7,902.53 1,185.21
Orchard 4,544.79 51.55
Tomatoes 4,196.70 2,653.45
Hay 2,187.14 765.44
Peppers 1,536.94 1,433.32
Grapes 340.04 273.29
Melons 193.29 5.65
Berries other than Strawberries 126.84 63.88
Total 55,506.70 21,015.05
Future Research
Since the other vegetable industry, as defined in this study, had the highest amount of disposal
further studies should be conducted to examine the usage and disposal of agricultural plastic by
each commodity in this industry. The plausible reason the other vegetable industry had such a
large disposal rate was possibly due to the large amount of acreage the industry occupies.
A closer look at what conditions need to exist to induce producers to utilize an on-farm pick-up
service for their agricultural plastic requires additional research. The results from the survey
suggest that this is the preferred incentive that would induce producers to recycle their
agricultural plastic. The issue with this result is that the producers indicated interest in this service
without knowing the details. The cost and convenience of the service will most likely dictate the
true number of producers who would choose a pick-up service for their agricultural plastic.
One aspect that this study did not explore was how satisfied producers who currently recycle
were with their current ability to recycle. Problems may arise for an agency to try to encourage
recycling of agricultural plastic if the current producers are not happy with their ability to recycle.
Understanding why this current group of producers is recycling their agricultural plastic would
allow for a more complete development of a recycling strategy for the state.
The producers indicated the greatest difficulty with recycling agricultural plastic is that the
current recycling facilities are too far from their operation. This suggests that further analysis is
needed to understand how far producers would travel to recycle their agricultural plastic. This
study examined how far producers would travel if recycling was free. Other studies should focus
on how far producers would travel if they paid to recycle their agricultural plastic or if they were
compensated for bringing their plastic to the recycling facilities.

Contractor’s Report to the Board 10
While this study identified that producers perceive that there are too many restrictions with
recycling, it did not examine which restrictions caused producers difficulties. A study identifying
the specific restrictions that are causing producers difficulties and determining whether to reduce
these restrictions should be examined to better understand how to encourage producers to recycle.

Contractor’s Report to the Board 11
Introduction The use of plastic in agriculture dates as far back as 1948 when Emery Myers Emmert used
polyethylene as a cover for greenhouses instead of glass (Jensen, 2000; Splittstoesser and Brown,
1991). Since this time, the use of plastics in agriculture has spread throughout the agricultural
industry and has been renamed ―plasticulture.‖ Splittstoesser and Brown (1991, p. 241) define
plasticulture as the ―science and technology of the use of plastics in agriculture,‖ while Orzolek
(2003) has more generally defined plasticulture as the use of plastic in agriculture. Some of the
many uses of plastic in agriculture include the following: 1) plastic film mulches, 2) drip
irrigation tape, 3) row covers, 4) low tunnels, 5) high tunnels, 6) silage bags, 7) hay bale wraps,
and 8) plastic trays and pots used in transplant and bedding plant production (Orzolek, 2003).
Agricultural plastics are used in this report to signify all types of plastics used by producers.
Plastic has many advantages and disadvantages in agriculture. Plastics are used as a low-cost
method to extend the season of some crops (Roos and Jones, no date). It is also used to conserve
water, control weeds, and maintain high quality fruit when used as mulch (Kasperbauer, 2000).
One disadvantage of using agricultural plastic, especially as a season extender, relates to the
disposal issues that come with the use of plastic (Roos and Jones, no date). Most agricultural
plastic used on farms is non-biodegradable and is either taken to a landfill or sent to a recycler.
Some agricultural plastics are recyclable under a certain set of conditions set by a recycler, while
others are not for various reasons that are explained below. Even though biodegradable plastic
exists, much of the plastic used in agriculture is currently non-biodegradable because of the
infancy of the technology.
California is one of the most diverse agricultural economies in the nation with more than 400
commodities produced in the state (California Department of Food and Agriculture, 2007). This
state produced $32 billion in direct farm sales in 2005 which makes it the largest agricultural
producing state in the country and one of the largest in the world. With so much diversity in
agricultural production, it is not surprising that a segment of California producers engage in the
practice of plasticulture to enhance their crop production. Table 1 shows the top 20 agricultural
commodities along with the total cash farm receipts for each industry. Many of these
commodities have a portion of their producers engaged in plasticulture.
Table 1: Top 20 Agricultural Commodities in 2005
Commodity (billions) Commodity (billions) Commodity (billions)
Milk and Cream $5.220 Chickens $0.715 Walnuts $0.540
Grapes $3.170 Cotton $0.634 Broccoli $0.514
Nursery $2.430 Oranges $0.604 Carrots $0.455
Almonds $2.340 Pistachios $0.577 Rice $0.408
Cattle and Calves $1.740 Strawberries $1.110 Peaches $0.280
Lettuce $1.690 Floriculture $0.984 Lemons $0.278
Hay $1.150 Tomatoes $0.942
Source: California Department of Food and Agriculture, 2006
While it is commonly known that plasticulture is practiced in California, it is unclear how much
plastic is used by each agricultural industry in the state, as well as, how agricultural producers are
using it. There is also a lack of knowledge on the disposal practices used by these producers. This

Contractor’s Report to the Board 12
report presents a detailed examination of plastic usage in California agriculture and provides
suggestions for a recycling strategy for agricultural plastic in the state.
There were four primary tasks that were required for this project. The first task was an extensive
review of the literature on recycling agricultural plastics. The second task was to conduct a focus
group with agricultural producers regarding their use and recycling of agricultural plastic. The
third task was to develop and conduct a survey to examine California producers’ usage and
recycling of agricultural plastic. The final task was to use the results from the survey and focus
group to develop a strategy for recycling agricultural plastic.
The rest of this report is categorized into seven other sections. The first section presents the
review of literature regarding agricultural plastic with an emphasis on recycling. The next section
discusses the method used for running the focus group and conducting the survey on agricultural
plastic usage and recycling. A discussion of the information found in the focus groups makes up
the third section. The fourth section highlights the major results of the survey. The fifth section
presents an estimate of how much agricultural plastic is disposed of on a yearly basis in
California. The sixth section provides recommendations on a recycling strategy for the state given
the results from the focus group and the survey. The final section is devoted to summary,
conclusions, and future research ideas.
LITERATURE REVIEW
Estimation of Plastic Usage
The use of plastic in agriculture has increased over the last couple of decades. Hemphill (1993)
cites an estimate given by Ennis (1987) that the United States uses over 110 million pounds of
agricultural mulch used for vegetables, strawberries, other row crops, and orchards. Amidon
(1994) estimated that the United States used 521 million pounds of plastic in agriculture. The
majority of this plastic was used in the nursery industry in the form of containers. As recently as
2003, Levitan and Barros (2003) estimated that there were 1.678 billion pounds of plastic used in
the agricultural sector in 2002. This estimate was made by assuming that 3 percent of all plastic
sold in the United States was purchased directly or indirectly by the agricultural sector. This
represents a threefold increase over a ten-year span.
Amidon’s (1994) study went further than estimating the total amount of plastic used in
agriculture. He also estimated the amount of plastic used for three categories -- film, nursery
containers, and pesticide containers. Nursery containers made up over 66 percent of total plastic
consumption in agriculture. Within this category, injection-molded high density polyethylene
(HDPE) pots had the highest share. Agricultural film accounted for approximately 29 percent of
agricultural plastic with the largest allocation going to low density polyethylene (LDPE) mulch
film. High density polyethylene pesticide containers accounted for less than 5 percent of the
agricultural plastic used.
Disposal and Recycling of Agricultural Plastic
Da Costa et al. (1996a) conducted a survey of recycling coordinators and individuals responsible
for managing agricultural plastics in each county of New York State. The objectives of their study
were: 1) identify the options available to producers for managing agricultural plastic, 2) identify
existing barriers to best management practices of agricultural plastic film, and 3) to correlate
counties with similar characteristics and develop plans that would meet each group of counties
needs. They found at the time that there were no collection programs for low density polyethylene
agricultural plastics in the state and inferred that most agricultural plastic was entering the waste

Contractor’s Report to the Board 13
stream. The authors were able to identify many barriers to managing agricultural plastics
including: contamination of the plastics, lack of convenient options for recycling, high
transportation costs, and lack of an adequate set of handling procedures. Da Costa et al. (1996b)
find from their secondary research that the main barriers to recycling agricultural plastics come
from collection issues, transportation of the material, contamination of the plastic, and lack of end
markets.
With an increasing quantity of agricultural plastic used on the farm, disposal of this type of
plastic is becoming a greater consideration that needs addressing. Clarke (1995) identifies five
choices farmers have for handling the agricultural plastic acquired during normal operations.
They can 1) reuse it for other purposes, 2) recycle it, 3) dispose of it by burying it, 4) send it to a
landfill, or 5) use it as a fuel (e.g., burn it).* Each method has its own unique requirements and
potential restrictions. For example, Clarke and Fletcher (2002) report that many landfills either
have high tonnage charges or will not accept agricultural plastics outright.
Garthe and Kowal (1994) provide a look at the process and its related terminology for recycling
agricultural plastics. They categorize the process of recycling into four stages. The first stage of
the process is the collection stage. Collections of the recyclable materials are accomplished by
curbside pick-up, buyback locations, or drop-off locations. The authors state that an obstacle to
collection is the high cost of transportation due to the bulky nature of the product. The second
stage of the recycling process is the handling and storage stage. Within this stage, the agricultural
plastic is evaluated for suitability for recycling and then sorted. The main reason cited for
rejecting the plastic for recycling is due to contamination. The third stage in the recycling process
is the reclamation stage. In this stage the recyclable plastic is conditioned for re-use. The final
stage in the recycling process is the production and sale of a usable product made from the
recycled plastic. This product is a clean form of the original product, which is either re-used as an
agricultural plastic, or is a completely different product.
Garthe and McCoy (no date) provide a classification of the different types of plastics used for
different agricultural practices. They categorized the plastic based on its composition. Low
density polyethylene (LDPE) is used to make mulch film, greenhouse film, silage bags and
wraps, and trickle irrigation tubing. Linear low density polyethylene (LLDPE) is used for row
covers and silage bag and wraps. Polypropylene is used to make row covers, nursery pots, and
nursery trays and flats. Pesticide containers and nursery pots are made from high density
polypropylene (HDPE). Nursery pots, trays, and flats are made of polystyrene.
Plastics have a high energy value in comparison to many other municipal solid waste items.
According to Garthe and Kowal (1993), polyethylene has an energy value of 19,900 BTU,
polypropylene has an energy value of approximately 18,500 to 19,500 BTU, and polystyrene has
an energy value of 17,800 BTU. These energy values are close to that of fuel oil with an energy
value of 20,900 BTU. One concern with turning agricultural plastic waste into a fuel source is the
contamination of the material by pesticides. Another concern with incinerating agricultural
plastics as a fuel source is that agricultural plastics, which are compressed to make transportation
more cost effective, can burn too hot and damage the incinerator.
Clarke and Fletcher (2002) report on a pilot project for recycling agricultural plastic carried out in
Ontario since 1992. They found that agricultural producers are willing to participate in a
* Garthe and Kowal (no date) report that 60 percent of farmers who participated in a survey conducted by
the Penn State Cooperative Extension burned their used agricultural plastic.

Contractor’s Report to the Board 14
recycling program as long as a ―practical‖ collection system exists. The producers in this pilot
study were willing to develop simple methods for collecting and storing their used agricultural
plastics to maintain cleanliness of the plastic. They report that producers were willing to drive up
to an hour away to dispose of their used agricultural plastic to a recycling center. One major
concern that producers had with transporting agricultural plastic any great distance was the
liability that comes with transportation.
Hussain and Hamid (2003) explain some of the difficulties of recycling agricultural plastics. They
believe that the main obstacle for recycling agricultural plastic comes from the high cost of
collecting, transporting, and cleaning plastic. They further explain that agricultural plastics are
contaminated by as much as 50 percent of their initial weight. These contaminants may include
pesticides, vegetation, dirt, etc. All of these contaminants have a detrimental effect on the ability
to recycle agricultural plastics.
Garthe and McCoy (no date) would agree with Hussain and Hamid (2003) that contamination of
agricultural plastics is a main issue to recycling. Garthe and McCoy (no date) also believe that
buyers of recyclable plastics are concerned with an inconsistent product that arrives in small
quantities. The main obstacle that is faced with agricultural plastics is that there is often not a
viable way to compress the bulky plastic to a more transportable form. It is suggested by the
authors that this is alleviated with a cooperative-owned baler, hiring custom operators, or creating
rebate programs to influence both buyers and sellers. One of the more time-consuming and
tedious components to recycling is the preparation of the material. The material needs cleaning
and drying.
A best practices guide for managing agricultural plastic film was put out by The Environmental
and Plastic Council (EPIC, no date). The EPIC guide provides three reasons why producers
should recycle their agricultural plastic. First, they explain that there is legislation against on-farm
plastic disposal through burying or burning. They further explain that if a producer decides to
burn the agricultural plastic, the fumes are toxic to the producer and the local environment. The
second reason given by this guide is the reluctance of local landfills to take bulky material. The
final reason given is that recycling agricultural plastics converts the material into a new useful
product.
DSM Environmental Services, Inc. (1999) developed a document explaining best management
practices for handling agricultural film waste. This document was derived from an examination of
two pilot projects on recycling and composting agricultural plastics in Vermont. This report
emphasizes the need for the producer to properly handle the used agricultural plastic and to keep
it as clean and dry as possible for either disposal or recycling purposes. Guidance is provided in
this report on handling round bale wraps, bunker covers, and silage bags. At the time of the study,
markets for recycled agricultural plastic were limited and firms were not willing to pay for the
materials.
Economic and Feasibility Studies for Recycling Agricultural Plastic
It is estimated that 3,500 tons of polypropylene baler twine was sold in Alberta, Canada, to
agricultural producers in 1999 (Randall Conrad and Assoc. Ltd., 2000). Given this large quantity
of non-biodegradable agricultural plastic, Alberta was interested in whether it was possible to
recycle this twine for other uses. A study conducted by Randall Conrad and Assoc. Ltd. (2000)
was commissioned to study the market feasibility of recycling this twine. They identified two
emerging markets for the baler twine. These included using the recycled twine as an ingredient
for a rubber composite shingle or using the twine as a reinforcement agent for concrete and

Contractor’s Report to the Board 15
asphalt. They also examined using the baler twine as a fuel source. The overall conclusion from
the study was that it was currently infeasible to recycle polypropylene baler twine. The authors of
the study recommended that the government agency responsible for overseeing the recycling
strategy for the province should continue to monitor the shingle and asphalt industries as they
progress in utilizing recycled agricultural plastics in their products.
Kwak, Yoo, and Kim (2004) conducted a study to estimate the societal benefits for recycling
waste agricultural film in South Korea. They discuss the need for a recycling program in South
Korea due to the diminishing land available for landfills. In 2001, they utilized a professional
polling firm to send out over 650 surveys to residents in Seoul, South Korea between the ages of
20 to 65. The response rate was over 95 percent. Using contingent valuation methods, specifically
dichotomous choice questions, they were able to estimate that the mean willingness-to-pay per
Korean household for this recycling program was $3.60 per year. They equated this value to a
societal benefit of approximately $11 million per year.
Jaeger (2006) conducted a feasibility analysis of a business using recycled agricultural plastic
along with juniper plants to create a fuel cube to sell as a fuel source. He states that the source of
the plastic could come from the strawberry and nursery industry where approximately 16 to 18
million pounds of plastic per year are generated from these industries.†
Jaeger (2006) finds that there are a set of conditions that will allow this fuel cube to compete
against wood as a fuel source. There are two important assumptions that Jaeger makes when
estimating the feasibility of the fuel cube operation. First, he assumes that the agricultural plastic
necessary to operate the plant is sourced within an 80 mile roundtrip. The second major
assumption is that acquisition of the agricultural plastic is free and the transportation costs are
$12 per ton. Given that these two assumptions hold, Jaeger estimates that a million BTU’s worth
of plastic cube fuel source would cost $2.60. This compares unfavorably to wood which has an
estimated cost of $2.05 per million BTU. The company may be able to defray the building costs
with a subsidy, and then the cost of production for the plastic fuel cubes could decrease to $1.80
per million BTU’s. These two results are heavily dependent upon obtaining the agricultural
plastic for free. Jaeger cites anecdotal evidence that suggests producers could obtain $0.06 per
pound for ―dirty‖ agricultural plastic and up to $0.28 per pound for relatively clean used
agricultural plastic.
Levitan, Cox, and Clarvoe (2005) released a report on the feasibility of recycling agricultural
plastics in the Central Leatherstocking-Upper Catskill region in the state of New York. The
authors investigated this issue by conducting many ―open-ended‖ interviews with agricultural
producers, recyclers, and re-processors. The emphasis of their study was on the recycling
operation. They estimate that approximately 200,000 pounds of low density polyethylene is used
by dairy farms within their study region on a yearly basis. They also estimate that there is another
40,000 pounds of plastic films generated in the area by nurseries and non-agricultural industries.
Given this quantity of plastic produced in the area, they find that recycling agricultural plastic in
the area is technically feasible. The authors found that from an economic perspective ―the
economic balance sheet for recycling of dairy plastics is very tight (p. 61).‖ They estimated
$1,800 in revenue generated per truckload of recyclable agricultural plastic.‡ After an $800 baling
† Jaeger (2006) does not explain the geographical location that this plastic is being sourced from or where
he obtained this estimate.
‡ Levitan, Cox, and Clarvoe (2005) estimate that a truckload of plastic is approximately 40,000 pounds.

Contractor’s Report to the Board 16
cost, the recycler is estimated to have $1,000 per truckload to pay for administrative and handling
expenses. The authors conclude that a ―viable recycling program‖ would require public support
during the infancy of the program. They also justified public support through the public benefits
that come with the recycling program.
Technology and Agricultural Plastic
Parish, Bracy, and McCoy (2000) have tested an in-field incinerator of plastic mulch in 1999.
This incinerator takes plastic mulch directly off the field, incinerates it, and then drops the
residual on to the field. They found that the technology burned much of the mulch, but left some
globules. Based on this finding, they concluded that the in-field incinerator equipment did not
perform adequately. Furthermore, they found that the labor needed to operate the machinery was
excessive.
Garthe (2002) took a different approach. Instead of incinerating the plastic in the field, he
proposed developing plastic fuel nuggets to power a boiler. In his research, he tested fuel nuggets
developed from agricultural plastics from California, Pennsylvania, and Florida. He found that
the fuel nuggets could be used in conjunction with coal boilers. Another advantage is that fuel
nuggets can be safely stored and shipped. The nuggets were developed with the idea of using only
agricultural plastics, but Garthe (2002) believes it is feasible to use plastics from other industries.
One of his major findings was that the composition of the fuel nuggets varies due to the
differences in agricultural plastics from across the country and the foreign matter that is included
in the plastic.
Since recyclers do not want bulky, loose, and dirty plastic, proper handling of agricultural plastic
is necessary for recycling. Goldy (no date) tested several methods of modifying agricultural round
balers to handle agricultural plastic. He found that since plastic is heavier than hay, the belts on
the baler would often break and that a baler using chains is more efficient. In addition, he found
that the plastic would often get caught on the tines and removing the outside set of tines helped.
However, some growers removed the complete pickup head which then makes it necessary to
physically feed the baler with material. This is both labor-intensive and dangerous. Again, it is
noted that the product is clean and free of any foreign matter.
University of California Extension Cost Studies
An examination was conducted of the University of California (UC) Extension cost studies to
obtain clues as to which agricultural industries used agricultural plastic and film. The Extension
agency keeps data on 174 enterprise budgets that encompass 92 different commodities. Table 2
presents the results of the analysis of these studies. Of the 92 different commodities, 29 have the
potential for using agricultural plastic in some form or another. The orchard industry used plastic
in the form of drip irrigation and micro sprinklers, while the berry industry and specialty
vegetable industry used drip irrigation and mulch. Depending on the commodity, the enterprise
budget developed has the amount of plastic used and disposed. This is usually the case for plastic
that is used on a yearly basis. There is no guidance given to how much plastic is used for the
industries that utilize plastic for more than one year.

Contractor’s Report to the Board 17
Table 2: Commodities Identified in UC Extension Enterprise Budgets that Utilize Agricultural Plastic
Commodity Use of Agricultural Plastic Commodity Use of Agricultural Plastic
Alfalfa Baling Twine Grapes Drip Irrigation
Almonds Micro Sprinklers Lemongrass Greenhouse Plastic
Apricots Micro Sprinklers Lemons Drip Irrigation
Chinese Long Beans
Greenhouse Plastic Olives Drip Irrigation and Micro Sprinklers
Green Beans Drip Tape Onions Drip Irrigation
Blueberries Drip Irrigation Oranges Drip Irrigation
Boysenberries Drip Irrigation Pears Drip Irrigation
Cantaloupe Plastic for Beds Peppers Drip Tape and Plastic Mulch
Cherries Micro Sprinklers Raspberries Drip Irrigation
Mandarins Micro Sprinkler Squash Drip Tape and Plastic Mulch
Minneolas Drip Irrigation Strawberries Drip Tape and Plastic Mulch
Pummelos Drip Irrigation Sweet Potatoes Plastic for Tunnel Houses
Cucurbits Greenhouse Plastic Tomatoes Clear and Black Plastic
Eggplants Plastic Mulch and Drip Irrigation
Watermelons Drip Tape and Plastic Mulch
Figs Drip Irrigation
Source: http://coststudies.ucdavis.edu/
Data Collection Developing a strategy for the recycling of agricultural plastic and film requires a vast amount of
information on production practices employed by California agricultural producers. While the
cost studies from UC Davis provide a look at which producers are using agricultural plastics,
most of the cost studies are built around a representative farm and do not necessarily differentiate
production practices used by producers. These cost studies do not examine the producer’s desire
or willingness to recycle plastic.
A two-prong approach was used to collect information in order to provide guidance for a
recycling strategy. The first was the creation of two focus groups. These focus groups consisted
of interested producers to discuss their disposal and recycling practices for agricultural plastics.
The second was a producer survey on the use and disposal of agricultural plastic. The next section
of this report covers the creation of the focus groups.
Focus Groups
One method used to gather information on producers’ use and disposal of agricultural plastic was
the implementation of multiple focus groups. There were two primary purposes of these focus
groups. The first purpose was exploratory in nature. One of the main points of the focus group
was to develop a dialogue with producers on their disposal practices of agricultural plastic. The
participants in the focus group were given a rough draft of the survey in order to establish
dialogue. This was helpful in creating the terminology in the survey that producers use when
Contractor’s Report to the Board 18
dealing with agricultural plastic. These groups were also helpful in developing a strategy for
querying producers.
The second purpose of the focus group was to receive feedback on the preliminary design of the
producer survey. Initially, the survey was built utilizing a survey that was conducted by Cornell
University’s Environmental Risk Analysis Program. This survey covered issues regarding the
disposal and recycling of bunker silo covers, bale wraps, silage bags, mulch film, and pesticide
containers. While this survey was a valuable template, it was not designed to investigate usage on
crops which was one of the mandates of this project. Hence, the survey for this project provided
substantial modifications to the base survey. Given these modifications, it was necessary to get
feedback from industry representatives regarding how best to present the questions asked.
There are tradeoffs between collecting information from focus groups and surveys. The value of
the dialogue that comes from a focus group over using a survey is that it allows for follow-up to
answers that are requested by inquiry. The disadvantage is that only a few opinions are
represented with a small group of producers, unlike a rigid survey that can query the information
and opinions of many different producers.
When this project was initially developed, it was thought that one focus group with a diversified
representation of agricultural producers could be brought together. During the process of
developing the focus group, two major issues arose. The first issue was a general lack of interest
from producers regarding the topic of disposal of agricultural plastic. The most interested parties
were strawberry and other berry producers. Hindsight shows that most producers do not view the
topic of recycling agricultural plastic as a pressing issue. Except for the berry and nursery
producers who are disposing of agricultural plastic on a yearly basis, most producers who are
using plastic dispose of it much less frequently. The second issue that made it difficult to conduct
a single focus group was the geographical dispersion of the producers. The most efficient way to
handle this issue and get the producers to meet in a single location was to split the focus groups
up by industry.
Two focus groups were conducted for this project. The first was conducted with berry producers
in Watsonville, and was represented by strawberry, blackberry, and raspberry producers. The
main reason to conduct a focus group with berry producers is because they are in an industry that
is disposing of agricultural plastic on a yearly basis. The second focus group was with
representatives from the dairy industry which was conducted in Merced. While it was unclear
prior to this study that dairy producers were large users of plastic, they do represent one of the
few livestock industries that is potentially using agricultural plastic, especially for their lagoons.
There was an attempt made to create a third focus group with greenhouse and nursery producers,
however, this did not come to fruition. This group was selected because the literature indicated
that these industries were heavy users of agricultural plastic. It is unclear why there was a lack of
interest from this industry, but it is conjectured that much of the plastic that is used by this
industry is disposed of by the end consumers of their product. Hence, when a nursery sells
tomatoes in plastic containers to a customer, that container is taken by the consumer and disposed
by the consumer. This suggests that while greenhouse and nursery producers are big users of
plastic, they may not directly dispose of that plastic.
Summary of Findings from Berry Producer Focus Group
The first focus group completed was with the berry industry (raspberries, strawberries,
blackberries, etc.). This group was very informative and provided some valuable lessons

Contractor’s Report to the Board 19
regarding the questions that should be asked of producers. Insight into the berry industries’ view
of recycling agricultural plastic was also gained, which was not anticipated before the discussion.
The consensus of the group is that the berry industry would conditionally desire to recycle
agricultural products. One producer stated that his operation is willing to spend a little more than
the dump disposal fees to recycle the agricultural plastic because the owner believed in recycling.
Although, he also indicated that there are limits due to competitive pressures within the industry.
It is unclear whether this participant represents the norm or whether he was an outlier.
The berry producers foresee two major issues with recycling agricultural plastics. The first issue
is that the plastic supply for recyclers is not uniform throughout the year. They explained that
there is approximately a three- to four-week window when all the agricultural plastic (except for
fumigation plastic) used by the strawberry industry in a particular region will come off the field.
Because many producers lease the land, they have stringent requirements when they must have
the fields prepared for the next crop (e.g., all the plastic must be off the ground). This suggests
that the recycler must handle all the agricultural plastic in a short period of time for the
strawberry industry.
One producer indicated that his experience with recycling was that many producers in the area
tried to recycle when it was available, but these producers had to wait in long lines. Furthermore,
some producers were turned away because the recycler could not handle all the plastic brought in
to the collection facility. This provided a disincentive to many producers who wanted to recycle
but could not afford the time loss trying to recycle their plastics.
The second issue mentioned by producers was the requirements for the handling of the
agricultural plastic. Experience has shown one producer that the recycler he dealt with was only
willing to take certain types and colors of plastic. This required the producer to have to sort out
the different agricultural plastics into the recyclable type and the non-recyclable type. Factoring
in the cost of labor for sorting quickly drives up the cost of recycling, which makes it a less
desired option.
The berry producers in this focus group suggested that they are interested in a recycling plan if
they could take all of their agricultural plastic and film to a drop-off site where they can leave it
there for the recycler to pick-up. The producer then would not need to make two trips to dispose
of their plastic. This suggests that it might be acceptable for a recycler to pick-up the recyclable
plastic and film from the producers operation. The drawback that the producer would have to
separate out the recyclable plastic from the non-recyclable plastic still exists. The producers
believed that this is a time-consuming task.
A per-acre estimate was developed by one of the berry producers on their usage and disposal cost
of agricultural plastic. He estimated that plastic disposal costs his operation approximately $16
per acre on his strawberry field. Bolda et al. (2004) with the UC Cooperative Extension found
that a representative producer spends $18 per acre on landfill fees. The cost of disposal, not
including transportation costs, represents less than 1 percent of the operation costs which runs
approximately $27,000 per acre. The cost of labor to sort the agricultural plastic would dissuade
the producer from recycling, even if the recycler was willing to accept the plastic free of charge.
Given the current wages in the industry, the producer is willing to allocate no more than two
hours per acre for sorting plastic.
The berry industry primarily uses plastic as part of the crop fumigation process. One of the
producers in the survey pointed out in the focus group that many producers in his area used a
vendor to fumigate the crops. This finding is important because it means that in our survey we

Contractor’s Report to the Board 20
will need to ask the producers if they do their own fumigation. If they do not, then the survey
would underestimate the plastic usage for the berry industry. One of the producers explained how
to calculate the amount of plastic used for fumigation for those producers who do not do their
own fumigation.
The berry focus group discussed that some companies are implementing a recycling program that
gives credit to purchase more of the product if that product is recycled. The recycling program
used by this participant was the Toro® Recycling program for drip tape. Information on this
program can be found at: http://www.toroag.com/HTML/WinWin_Brochure.pdf. Currently, the
producers from the focus group are not completely happy with the system because of the
restrictions.
One of the main reasons for running the focus group was to pre-test a survey that was developed
for agricultural producers using plastic. One of the most important and useful critiques from this
group was that the survey was asking questions which were too specific. One question, which
was meant to elicit each type of plastic (e.g., black plastic, green plastic, clear plastic, etc.) used
for each crop, was deemed by the producers as too specific. The producers at the focus group
mentioned that the level of detail would dissuade producers from participating in the survey. This
finding presents a dilemma for developing the survey. Having discovered that the recycling
companies are selective on the types of plastic they are willing to recycle, it is useful to know the
types of plastic used. Unfortunately, it does not appear that the growers are interested in giving
that level of detail. Hence, the survey will only have the potential for estimating the amount of
agricultural plastic as a whole. It appears that the best way to ask for the amount of plastic is by
usage, e.g., mulch, drip tape, etc.
Another item that was brought up in the focus group was that some producers in the berry
industry are moving over to tunnel houses for some of their berry operations. This discovery
indicates that our survey would obtain how much plastic is currently used, but the information
may become outdated quickly depending on the rate of technology adoption and how many
producers are moving to this new production method. This suggests that a question should be
asked regarding the producer’s future plans on usage of plastic, which would provide information
on whether the producer is considering expanding plastic usage.
A third issue that was explored by the focus group was that some of the questions were confusing
to them or they did not know the answer. One question asked how many plastic containers the
producer uses, including pesticide containers. The only plastic containers the berry industry uses
in production are from pesticide containers. The producers mentioned that they do not keep track
of how many containers they used and would be guessing.
One of the recommendations provided by the berry focus group was to send different surveys for
the different groups that were targeted to minimize confusion. This was a valid critique but it
would require greater resources than were allotted for this project. The main reason this is
impractical is because many producers have diversified operations. To address this issue, the
survey was segmented into sections related to each producer group.
Summary of Findings from Dairy Producer Focus Group
The next focus group that was conducted was the dairy industry. The literature review showed
that the dairy industry on the East Coast was a big user of plastic related to the baling of their
feed. After a brief examination of the California dairy industry, it was learned that California
dairymen do not generate much plastic related to feed. Follow-up research to the literature review
has identified two uses of agricultural plastic by the California dairyman that was not identified in

Contractor’s Report to the Board 21
the literature. These producers used agricultural plastic for two reasons—to cover their lagoons
and to cover their manure piles. While this plastic is not easily recyclable, there is value on
understanding how much is used in California.
Pulling the dairy group together was difficult. One of the main reasons was due to a lack of
interest. There were two reasons why this group apparently was not interested in participating in a
study on disposal of agricultural plastic. Both reasons were confirmed when the focus group was
conducted with a couple of dairy producers. First, the dairy industry does not see itself as a large
agricultural plastic user. Unlike the berry industry, the plastic used in the dairy industry is for
long-term purposes and has a long life. The dairy producers then do not have to deal with disposal
on a yearly basis like the berry industry. While the plastic that producers cover their manure piles
with was disposed of more frequently than the lagoon plastic, it is not a considerable amount.
The second reason is because disposing of plastic is quite low on their list of priorities. Many of
the producers contacted wondered why they were considered for this issue. Disposal of plastic is
considered a non-issue for this group of producers. It is conjectured that in the future when these
dairies dispose of the plastic covering their lagoons, they will become concerned. It is likely that
much of the plastic used in the dairy industry will not be recyclable, but no evidence was found to
support this thought.
Like the berry industry focus group, the preliminary survey was shown to the dairy producers to
obtain their feedback. After reviewing the survey, the producers said the recycling of agricultural
plastics was not at the top of their list of concerns and they were unfamiliar with the topic. It is
unclear whether this result is indicative of the industry or the people that were participating in the
focus group. They explained that the main reason for the lack of concern with recycling is that the
plastic is used as a long-term product and is not removed on a regular basis. Of greater concern
were U.S. Environmental Protection Agency regulations that are immediately affecting their
operations.
The dairymen also indicated the survey did not pertain entirely to their industry and that made it
difficult to answer all the questions. This is an important finding because if the producers
perceive the questions as difficult to answer, they are less likely to fill out the survey. The
questions pertaining to recycling were not answerable by the focus group participants because
they were unfamiliar with it. Also, since they have not experienced a large amount of plastic
disposal on a regular basis, they were not familiar with costs involved. Since they are more
concerned with other regulations and have plastics that are used for long periods of time, they did
not express much concern for recycling agricultural plastics. The lesson learned from this is that
the survey needs to incorporate a ―Not Applicable‖ option for those producers who are not
familiar with recycling issues.
The dairy focus group has brought up some very important issues. Since plastic usage is still very
much in its infancy as a technology utilized by producers in some industries, many industries may
be unfamiliar with the disposal issues that accompany plastic usage. This is true in the dairy
industry. This suggests the survey needs to be developed in such a way that the producers are
willing to share enough information to calculate their plastic usage, as well as designing the
questions so that the producers are not dissuaded from answering the survey. The dairy focus
group pointed out that the initial survey needed more work.
Design and Implementation of the Producer Survey
The second prong of the study focused on a producer survey to elicit information from producers
on their usage, disposal, and recycling practices for agricultural plastic. There were three

Contractor’s Report to the Board 22
underlying goals for this survey. The first goal was to collect information on the amount and type
of plastic used for a select group of industries that were believed to use agricultural plastics. This
information is instrumental in estimating how much agricultural plastic is used in California. The
second goal was to gather information that would provide a picture of how agricultural producers
are currently disposing their agricultural plastic. The third goal was to explore producers’
knowledge and desire to recycle agricultural plastic. The information gathered for this goal was
used to develop a strategy for recycling agricultural plastic in the state.
The California branch of the National Agricultural Statistics Services (NASS) of the United
States Department of Agriculture was used to assist with the design and the implementation of the
survey. This branch operates out of the California Department of Food and Agriculture (CDFA).
There are five reasons why CDFA was selected to conduct this survey. Initially, when the project
was proposed, NASS was listed as the agency to conduct the survey. Discussions with NASS
indicated it would have difficulty meeting the deadline for the project and recommended using
their California branch. The second reason was access to a database of all producers in the state
and their knowledge of sampling techniques. The third major reason is that it allowed the project
researchers to provide strict anonymity, as required by the university to protect the participants in
the study. CDFA’s Statistics Service also has the ability and expertise to draw the stratified
sample that was needed for this project, and California producers are familiar with receiving
information from this agency, a factor which should help the response rate.
The final survey instrument is located in Appendix A. Preliminary drafts of this survey were
based on a survey conducted by Cornell University’s Environmental Risk Analysis Program
administered in July and August 2002. The Cornell survey is located in Levitan and Barros
(2003). This survey was changed substantially to meet the requirements of the project by using
information from the focus groups and the advice of CDFA’s statistical branch.
The survey was sent out to 3,000 producers in California. From the literature review, many
producers were identified as users of agricultural plastic. The industries included vegetables,
strawberries, other row crops, and orchards (Ennis, 1987). Another industry that was identified as
a user of agricultural plastic was the hay industry, which uses baling twine (Clarke and Fletcher,
2002). The survey was sent out to the following industry groups: berries other than strawberries
(80), strawberries (150), peppers (150), melons (150), tomatoes (300), nursery (300), greenhouse
and horticulture (300), dairy (220), hay (250), grapes (250), and orchard which included stone
fruit and tree nuts (300). The numbers in parentheses represent the sample size drawn for each
commodity of interest and were chosen by the agency that performed the sampling. Since
strawberries are unique in production practices to other berry producers, a unique sample was
drawn for strawberry producers. Hence, for this report, the berry industry is separate from the
strawberry industry.
Producers in each of the nine sampled commodities were drawn randomly. Since producers can
grow multiple crops, the number represented in parenthesis denotes the producers’ primary crop.
It should be noted that a producer selected in the sampling process to represent strawberries also
may produce other berries and could provide information for both sampling categories.
The survey was sent out in the mail early March 2007. Producers were asked in the survey to
return it by March 30, 2007. If a producer did not return the survey by this deadline, a follow-up
phone call was made in an attempt to gather the information over the phone. Once all the surveys
were collected from producers who wanted to participate in the study, CDFA’s statistical branch
entered all the data into a SAS data file and returned it to the project’s researcher.
Contractor’s Report to the Board 23
The survey was categorized into five sections. Section one asked for general demographic
information regarding producers’ operations. Sections two, three, and four were used to collect
information on producers’ usage and disposal of agricultural plastic by different
industries/commodities. Each asked producers to provide the amount of each plastic disposed per
year in terms of pounds as well as the frequency that they disposed each type of plastic. These
three sections also gave producers the opportunity to list any plastic usage that was not covered in
the section. Finally, section five asked more in-depth questions regarding producers’ disposal and
willingness to recycle their agricultural plastics.
Section one included information regarding the county they produced the target crops in, and
quantity (e.g., number of cows for dairies, square feet for greenhouses, acres for most crops, etc.)
which is used for the basis of estimation. The producers were also asked whether they used
agricultural plastic or were planning on using agricultural plastic in the next five years. If the
producers indicated that they did not use and were not planning to use agricultural plastic, they
were informed to stop with the survey and send it back. If the producers indicated that they used
agricultural plastic, they were asked to go to sections two, three, or four of the survey.
Section two was designed to elicit usage and disposal practices for producers in the dairy and hay
industry. Producers were asked to report their usage of: 1) lagoon covers, 2) manure/compost
covers, 3) haystack covers, 4) silage bags, and 5) plastic twine. Depending on what purpose the
agricultural plastic was utilized, producers were asked to report their usage in terms of either
square feet or linear feet. They were also asked to provide the thickness of the plastic they used.
Section three was designed for nursery and greenhouse producers. These producers were asked
questions regarding their usage of many different sizes of containers that range from one gallon
up to 15 gallons. They were also asked to elaborate on the amount of six pack containers and
trays that are handled. Producers were asked to provide their usage of greenhouse plastic and
hoop/tunnel house coverings in terms of square feet and thickness of the plastic.
Section four covered the most producers. This section targeted berry, vegetable, orchard, and
grape industries. This section asked producers to provide their usage of mulch film, drip tape,
micro-sprinklers, and hoop/tunnel house covering. Depending on the usage of the plastic,
producers were asked to provide either square footage or linear feet as the unit of measurement
for the plastic. In addition, they were also asked to provide the thickness of the plastic. The final
question in this section asked producers whether they fumigated their crops and, if so, whether
they did it on their own or contracted out the service.
When interpreting the results from sections two through four, it should be understood that a major
limitation of this survey was that it relied on producers’ record keeping. While some producers
might keep good records, others may not. Another issue that arises is that even if the producers
keep diligent records in general, there is no guarantee that these producers keep detailed usage
and disposal information on their plastic usage. Hence, the responses from these three sections
could represent the producer’s estimate or guess. Given this possibility, it is expected that there
will be a wide range of producers’ responses.
Section five of the survey was meant to be answered by any producer who reported that they used
agricultural plastic. This section was divided into two major areas. The first set of questions
inquired about the producers’ usage and disposal practices of agricultural plastic. Producers were
also asked about their annual expense on agricultural plastic, how the plastic was disposed, when
the plastic was disposed, and the annual cost to dispose the plastic.

Contractor’s Report to the Board 24
The second set of questions in this section was related strictly to recycling of the agricultural
plastic. The first question in this area asked producers to identify how far they are willing to
travel to recycle their agricultural plastic for free. The next question asked how much they are
willing to pay per ton if a service would pick up unsorted or sorted agricultural plastic from their
facility. Two questions asked whether the producers knew of any recycling facilities in their
county and whether they know any recycling facility that would take their plastic. One question
asked about actual or expected difficulties of recycling agricultural plastic. The final question
asked what would encourage the producer to recycle their agricultural plastic. Producers had the
option of selecting multiple responses for each question for each of these last two questions.
Survey Results
General results
There were 3,000 surveys sent to producers regarding their usage, disposal, and recycling
practices regarding agricultural plastic. A follow-up phone call was generated to gather the survey
information if the producers did not return the survey by mail. Out of all the surveys sent, 2,206
producers returned the survey by mail, completed the survey by phone, or declined over the
phone to participate in the survey. Eight hundred and ninety-five producers responded to at least a
portion of the survey, with 389 respondents indicating that they used agricultural plastic. Hence,
43 percent of the producers that filled out a portion of the survey indicated they used some form
of agricultural plastic.
Table B1 in Appendix B lists by county the participants who were contacted for this study. It
presents how many producers were contacted, how many indicated they used agricultural plastic,
and how many producers did not use agricultural plastic. Out of California’s 58 counties, five
counties were represented from either the mailed survey or phone follow-up. These counties
were: Alpine, Amador, Inyo, Mariposa, and San Francisco. Each of these counties represents a
very small amount of agriculture production in the state. Forty-six counties in the survey had at
least one producer indicating that they used agricultural plastic. Close examination of this table
shows that the counties which had the highest amount of producers using agricultural plastic
were: Monterey, San Diego, Santa Barbara, Fresno, and San Joaquin. The first three counties
contain large numbers of berry and nursery producers and were expected to have the largest
amount of producers indicating they used plastic. Santa Barbara is the only county which is not in
the top ten agricultural production regions.
When drawing the target sample, an attempt was made to exclude producers with less than
$100,000 in average gross income. The project researcher determined that the big agricultural
plastic users and the bulk of plastic usage are associated with larger farms. This is due to the fact
that the majority of California agricultural production comes from large farms. Figure 1 shows
the distribution of average yearly gross income earned by producers in the survey, while Figure 2
presents the distribution of average gross income for the producers who indicated they used
agricultural plastic. The target group for the study was producers who earned an average gross
income over $100,000, though there still was a small group of producers in the survey that
reported earning less than $100,000. Considering that approximately 75 percent of the
agricultural producers in the state report less than $100,000 in yearly gross income, the sampling
process removed most of the producers that were not targeted for the survey.

Contractor’s Report to the Board 25
Figure 1: Average Gross Income of All the Producers in the Survey
Under $100,000
17%
$100,000 -
$249,999
13%
$250,000 -
$499,999
12%
$500,000 -
$1,000,000
18%
Over
$1,000,000
40%
Figure 2: Average Gross Income of the Producers Who Used Agricultural Plastic
Under $100,000
12%
$100,000 -
$249,999
11%
$250,000 -
$499,999
12%
$500,000 -
$1,000,000
18%
Over
$1,000,000
47%
Comparing the distribution of producers based on gross income distribution with 2002 USDA
Agricultural Census data shows that the respondents in the survey are biased towards large
producers with over $500,000 in average gross income. It is reasoned that this bias is occurring
because crops that use agricultural plastic, e.g., strawberries, nursery, etc., generally are high
value crops, which suggests a predisposition in gross income towards the upper-end of the
distribution. Examining the producers who reported utilizing agricultural plastic with the total
producers in the survey who answered the questions demonstrates that plastic users were slightly
skewed towards the high side in relationship to gross income. This supports the notion that larger
producers are more likely to use agricultural plastic than the small producers.
Producers who used agricultural plastic indicated they spent $14.3 million per year to purchase
agricultural plastic. This group specified that they disposed of approximately 5.57 million pounds
of plastic per year. This calculation includes one producer who indicated that he disposed of 3
million pounds of plastic per year. This number is clearly an outlier. When factoring out this
result, the group which made up 215 of the producers indicated they disposed of 2.57 million
pounds of plastic per year.

Contractor’s Report to the Board 26
Table 3 provides the distribution of this disposal by income level. The highest average and
highest total disposal was reported by producers who made over $1 million. Ninety producers in
this income bracket reported that they disposed of 2.31 million pounds of agricultural plastic
which equates to 25,614 pounds per producer. This highest income bracket represents nearly 90
percent of the total disposal reported. The second highest average and total was reported by a
producer who earned between $500,000 and $1 million in gross income. The lowest total and
average was reported by the lowest income bracket. This group represented only 0.36 percent of
the total disposal reported. The largest farms by income on average disposed 80 times the amount
of plastic than the lower income bracket farms.
Table 3: Pounds of Agricultural Plastic Disposed of Annually By Income Level for Producers in the Survey
Income Total Average Total Reporting
Under $100,000 9,280 320 29
$100,000 - $249,999 95,884 3,306 29
$250,000 - $499,999 50,630 1,808 28
$500,000 - $1,000,000 109,962 2,820 39
Over $1,000,000 2,305,224 25,614 90
Total 2,570,980 215
Figure 3 shows the primary season producers disposed their agricultural plastic. Autumn had the
highest percentage with one-third of the producers indicating this was the primary season for
disposing agricultural plastic. The other three seasons garnered approximately the same
percentage of producers. These results indicate a slight bias for producers to dispose their
agricultural plastic in the autumn months; otherwise, the bulk of plastic is disposed throughout
the year. Caution should be taken when interpreting this result, because agricultural plastic is
disposed throughout the year. However, the volume of plastic is not equally distributed
throughout the seasons. Some industries do heavily utilize and dispose of the agricultural plastic
in one particular season.
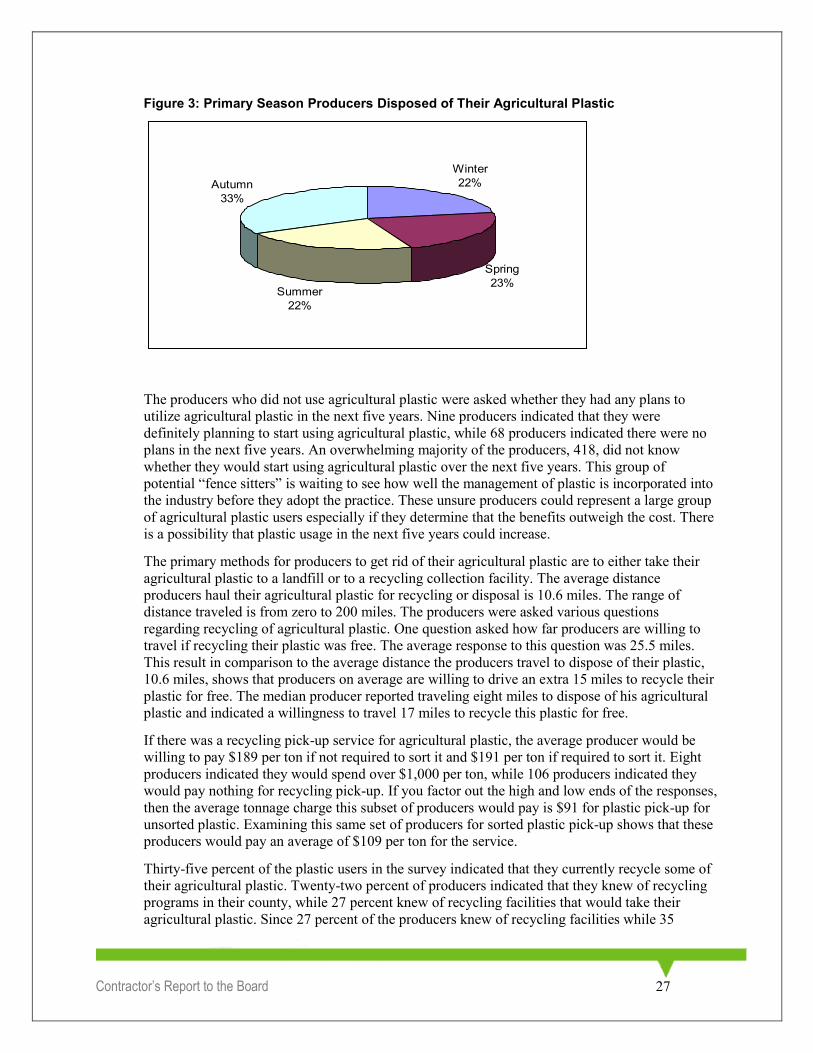
Contractor’s Report to the Board 27
Figure 3: Primary Season Producers Disposed of Their Agricultural Plastic
The producers who did not use agricultural plastic were asked whether they had any plans to
utilize agricultural plastic in the next five years. Nine producers indicated that they were
definitely planning to start using agricultural plastic, while 68 producers indicated there were no
plans in the next five years. An overwhelming majority of the producers, 418, did not know
whether they would start using agricultural plastic over the next five years. This group of
potential ―fence sitters‖ is waiting to see how well the management of plastic is incorporated into
the industry before they adopt the practice. These unsure producers could represent a large group
of agricultural plastic users especially if they determine that the benefits outweigh the cost. There
is a possibility that plastic usage in the next five years could increase.
The primary methods for producers to get rid of their agricultural plastic are to either take their
agricultural plastic to a landfill or to a recycling collection facility. The average distance
producers haul their agricultural plastic for recycling or disposal is 10.6 miles. The range of
distance traveled is from zero to 200 miles. The producers were asked various questions
regarding recycling of agricultural plastic. One question asked how far producers are willing to
travel if recycling their plastic was free. The average response to this question was 25.5 miles.
This result in comparison to the average distance the producers travel to dispose of their plastic,
10.6 miles, shows that producers on average are willing to drive an extra 15 miles to recycle their
plastic for free. The median producer reported traveling eight miles to dispose of his agricultural
plastic and indicated a willingness to travel 17 miles to recycle this plastic for free.
If there was a recycling pick-up service for agricultural plastic, the average producer would be
willing to pay $189 per ton if not required to sort it and $191 per ton if required to sort it. Eight
producers indicated they would spend over $1,000 per ton, while 106 producers indicated they
would pay nothing for recycling pick-up. If you factor out the high and low ends of the responses,
then the average tonnage charge this subset of producers would pay is $91 for plastic pick-up for
unsorted plastic. Examining this same set of producers for sorted plastic pick-up shows that these
producers would pay an average of $109 per ton for the service.
Thirty-five percent of the plastic users in the survey indicated that they currently recycle some of
their agricultural plastic. Twenty-two percent of producers indicated that they knew of recycling
programs in their county, while 27 percent knew of recycling facilities that would take their
agricultural plastic. Since 27 percent of the producers knew of recycling facilities while 35
Winter
22%
Spring
23%Summer
22%
Autumn
33%

Contractor’s Report to the Board 28
71
100
104
74
70
30
0 20 40 60 80 100 120
Not having enough product
Too many restrictions
Recycling facilities too far
Transportation too costly
Too costly (other than transportation)
Other
percent indicated that they recycle some of their agricultural plastic, it seems that some producers
reuse some of their plastic for other uses rather than taking it to a recycling facility.
Producers were asked to indicate all the difficulties they have experienced or anticipated with
recycling their agricultural plastic. Figure 4 provides the results to this question. The biggest
difficulty reported by producers is that recycling facilities are too far away from their operations.
This was closely followed by too many restrictions placed on what they can recycle. The response
―transportation was too costly‖ was listed as the third biggest difficulty with 74 producers
identifying it. Close to this result were responses of not having enough product and recycling is
too costly in general.
Figure 4: Identified Difficulties with Recycling Agricultural Plastic
A question on the survey asked what would encourage the producers to recycle their agricultural
plastic. Producers had the ability to choose multiple options on this question. Figure 5 shows that
the greatest incentive that encourages producers to recycle is offering on-farm pick-up. This
option garnered 213 producers, which is approximately 60 percent higher than the second closest
option. The next choice to a pick-up service was providing additional collection facilities. This
option had approximately the same amount of producers as the option that offered financial
incentives. It appears that reducing tonnage requirements is less of an incentive than any other
that was presented in the survey.

Contractor’s Report to the Board 29
Figure 5: Options that Would Encourage Producers to Recycle Agricultural Plastic
132
59
92
133
213
104
20
0 50 100 150 200 250
Offer financial incentives
Ease tonnage requirements
Ease cleaning requirements
Offer more recycling/collection facilities
Offer on-farm plastic pick-up
County collection facility
Other
Results for the Berry Industry Other Than Strawberries
There were 80 surveys sent out to berry producers other than strawberry producers. This group
included raspberry, blueberry, blackberry, etc. Out of this group, 22 producers returned
information regarding their usage of plastic. Another 14 producers chosen for other crops
indicated that they also produce berries other than strawberries. These other producers included
two from the strawberry industry and the nursery industry, one from the pepper, greenhouse and
melon industries, three from the tomato industry, and four from the orchard industry. This
suggests that the sample represented a total of 36 berry producers. Sixteen of these producers
indicated that they used agricultural plastic while the rest identified themselves as non-plastic
users. This equates to a 44 percent participation rate for berry producers other than strawberries
using agricultural plastic. This group represented 1,631 acres of berries other than strawberries.
Seven producers had less than ten acres, while three producers had over 100 acres of berries.
As seen in Table 4, the berry producers represent nine different counties in California. Monterey
and Santa Cruz counties had three producers each, while the remaining counties were each
represented by one berry producer. Figure 6 presents the distribution of income of these
producers. The majority of producers had a gross income over $500,000 per year. Thirteen of
these producers indicated that they spent a combined $147,732 on agricultural plastic in the year,
which equates to $940 per acre. The median amount spent on agricultural plastic was $300 per
acre.
Table 4: County and Number of Representatives Who Used Agricultural Plastic for the Berry Industry Other than Strawberries
County # County # County # County #
Fresno 1 Merced 1 San Joaquin 1 Shasta 1
Los Angeles 1 Monterey 3 Santa Clara 1 Tulare 1
Madera 1 San Bernardino 1 Santa Cruz 3 Ventura 1

Contractor’s Report to the Board 30
Figure 6: Average Gross Income Distribution of Berry Producers Other than Strawberries Using Agricultural Plastic
Although 16 berry producers indicated that they used agricultural plastic, few producers shared
their usage of agricultural plastic in the survey. The only agricultural plastic that received more
than one response was the use of drip tape. Four producers reported a range of usage of drip tape
that spanned 119 linear feet per acre to 30,000 linear feet per acre. They consistently indicated
that the drip tape they used for production was six mils thick. One producer reported that he
disposed of his drip tape every two years, while two other producers indicated they disposed of
their plastic every 12 months. The three other plastics used by the berry producers were mulch
film, micro sprinklers, and hoop/tunnel house coverings. Due to the sketchiness of the data
reported for these plastics, they are not presented in detail. Fifteen producers reported the primary
season they disposed of their agricultural plastic.
The berry producers in this study provided much more information on their disposal habits of
agricultural plastic. As seen in Figure 7, 60 percent of these producers indicated that the winter
season was the primary time they disposed of the plastic. Twenty percent of producers indicated
that they disposed of their agricultural plastic in the summer months, while another 13 percent
indicated autumn as the primary month for disposal. The rest of the producers indicated spring
was the primary month for disposing their agricultural plastic. The primary method of discarding
agricultural plastic for berry producers is to take it to a landfill. Eleven producers indicated that
they used this option. Another four producers noted that they take their agricultural plastic to a
recycling collection facility.
$500,000 -
$1,000,000
31%
Over
$1,000,000
31%
Under
$100,000
13%
$100,000 -
$249,999
19%
$250,000 -
$499,999
6%

Contractor’s Report to the Board 31
Figure 7: Primary Season Other Berry Producers Disposed of Their Agricultural Plastic
Winter
60%Spring
7%
Summer
20%
Autumn
13%
While berry producers were not forthcoming on the agricultural plastic they disposed of on a
commodity basis, they did answer the question on the disposal of their agricultural plastic. The
median reported disposal of agricultural plastic was 290 pounds per year, whereas the average
was 4,996 pounds per year. Examining this on a per-acre basis shows the median at 68 pounds
per year and the average at 116 pounds per year. Berry producers traveled an average of nine
miles to dispose their agricultural plastic. The furthest any producer traveled was 30 miles. The
average amount a year in tipping fees was $397 per year, while the hauling cost average was $660
per ton.
Four berry producers out of the 16 indicated that they currently recycle their agricultural plastic.
Three berry producers knew of recycling facilities in their county that would take agricultural
plastic, but only two producers knew of recyclers that would take the plastic that they used. When
berry producers are given the choice of recycling, they indicated that they were willing to travel
up to an average 41 miles to recycle their plastic for free. Berry producers are willing to pay $38
per ton whether or not they had to sort the plastic. Since the amounts are identical, it is assumed
that berry producers are indifferent to sorting their plastic for a company that is willing to pick up
the plastic. This result may stem from the fact that these producers did not use different types of
plastic on their operations; therefore they did not value sorting their plastic over not sorting it.
Figure 8 provides information regarding the perceived or actual difficulties with recycling
agricultural plastic for the berry producers. It shows seven berry producers believed that recycling
facilities were too far away from their operations and that five producers reported that
transportation was too costly to recycle. Three producers mentioned that it was too costly beyond
the transportation cost, while two producers thought that not having enough product may pose a
problem. Only one producer stated that there were too many restrictions which made it difficult to
recycle.

Contractor’s Report to the Board 32
Figure 8: Identified Difficulties by Other Berry Producers for Recycling Agricultural Plastic
Information on the incentives that encourages berry producers to recycle their agricultural plastic
is presented in Figure 9. This figure shows that berry producers prefer on-farm pick-up above any
other incentive for recycling. Seven producers indicated that a pick-up service would encourage
them to recycle. Five producers responded that they would recycle if financial incentives were
offered, while five other producers indicated that offering more recycling/collection facilities
would induce them to recycle. The least important incentive was easing the cleaning requirements
with only one producer selecting this choice. Easing the tonnage requirement only garnered two
people, while having a collection facility received three responses. Producers were allowed to
select more than one response for this question.
Figure 9: Incentives for Encouraging Recycling of Agricultural Plastics for Other Berry Producers
5
2
1
5
7
3
0 1 2 3 4 5 6 7
Offer financial incentives
Ease tonnage requirements
Ease cleaning requirements
Offer more recycling/collection facilities
Offer on-farm plastic pick-up
County collection facility
Results for the Strawberry Industry
Since strawberry users were identified to be heavy users of agricultural plastic and have unique
production practices using agricultural plastic, this group was separated from other berry
producers. There were 150 surveys mailed to producers in the strawberry industry. Out of this
group, 43 producers submitted information for the survey. Another 21 producers from other
commodities selected for the survey indicated that they also produce strawberries. This group was
comprised of three each of berry and nursery producers, eight pepper producers, a single melon
producer and a single greenhouse producer, and five tomato producers. This brings the total of
strawberry producers to 64, which represent 7,522 acres of strawberries. Out of this group of
producers, 60 strawberry producers identified themselves as plastic users. This suggests that
approximately 94 percent of producers in the strawberry industry are using some form of
2
1
7
5
3
0 1 2 3 4 5 6 7
Not having enough product
Too many restrictions
Recycling facilities too far
Transportation too costly
Too costly (other than
transportation)

Contractor’s Report to the Board 33
agricultural plastic. These producers reported spending $2.25 million on purchasing agricultural
plastic. This equates to a median amount of $583 per acre and an average price of $706 spent per
acre on agricultural plastic. Three other producers indicated that they did not use plastic, while
one did not respond whether or not they used plastic. Two out of the three non-plastic users
accounted for only one acre of strawberry land, while the third non-plastic user accounted for 215
acres. Figure 10 shows the income distribution of strawberry producers using agricultural plastic.
Sixty-two percent of these plastic users reported an average gross income stream from production
over $1,000,000.
Figure 10: Average Gross Income Distribution of Strawberry Producers Using Agricultural Plastic
Table 5 below shows the number of producers who used agricultural plastic categorized by
counties. Santa Barbara and Monterey had the highest number of producers using plastic on their
strawberry fields. Each of these counties had 12 producers return the survey. Ventura and Santa
Cruz counties had the next highest amounts of producers who indicated they used plastic at ten
and nine respectively. These four counties represent approximately 72 percent of the strawberry
producers from the sample that uses agricultural plastic. This group accounts for 5,579 acres out
of 7,552 reported by the entire sample of strawberry producers. The recycling industry, which is
interested in recycling agricultural plastic from strawberry producers, should focus on these four
counties due to the high number of strawberry producers.
Table 5: County and Number of Representatives Who Used Agricultural Plastic for the Strawberry Industry
County # County # County # County #
Fresno 1 Orange 4 Santa Barbara 12 Ventura 10
Los Angeles 2 San Benito 1 Santa Clara 4 Yolo 1
Madera 1 San Bernardino 1 Santa Cruz 9
Monterey 12 San Diego 1 Santa Luis Obispo 1
The strawberry producers in this study consistently identified two types of plastic that they used
in their production. Twenty-six producers in the study provided information on their usage of
plastic mulch estimated in square feet, while 27 producers supplied information on their usage of
Over
$1,000,000
62%
Under
$100,000
8%
$100,000 -
$249,999
5%
$250,000 -
$499,999
8%
$500,000 -
$1,000,000
17%
Contractor’s Report to the Board 34
drip tape approximated in linear feet. Two producers indicated that they were using micro-
sprinklers. One producer reported using some other type of plastic for their strawberry production
but they did not identify what type or its use. Given the low usage of micro-sprinklers and other
types of plastic, discussion is limited to mulch plastic and drip tape.
There was a wide range reported by the strawberry producers on how much agricultural plastic
mulch is used on an acre basis. The lowest per-acre usage of this plastic was four square feet per
acre; whereas, the highest usage reported was 90,000 square feet per acre. The second lowest
producer indicated that they used 1,000 square feet of plastic per acre. The thickness of the plastic
used by producers ranged from one to six mils. Fifty percent of producers indicated that they used
two mils thick plastic, while another 43 percent responded that they used one mil thick plastic.
While studying the thickness levels of agricultural mulch plastic used for strawberries, it was
found that there are thickness levels that are between one and two mils. It is believed that some
producers in the survey rounded the thickness either up or down.
The average plastic mulch usage for the sample was calculated at 35,145 square feet per acre,
while the median was 42,667 square feet per acre. Careful examination of the data shows that the
amount of plastic used per acre is positively correlated to the amount of acres that is used by
strawberry growers. Given this information, a weighted average using acres was taken to give
large producers a greater impact on the average. Examining this weighted average shows that
producers who responded to this survey used approximately 43,500 square feet of agricultural
plastic per acre. This result is much closer to the median than the average implying that smaller
producers are using less plastic per acre than larger producers. An acre of land is 43,560 square
feet, suggesting that the typical producer is not covering every inch of ground with plastic. This
may be due to buffer strips that are required to meet certain regulations for producing. Focusing
on the top four counties reveals that Ventura County uses the most plastic mulch with an average
of 48,134 square feet per acre. All three other counties used much less plastic per acre. This
suggests from a quantity standpoint, the recycling industry interested in plastic mulch from
strawberry fields should first focus its attention on Ventura County.
The strawberry producers were asked to indicate how often they discarded their plastic mulch.
Sixty-eight percent of the producers indicated that they disposed of their plastic mulch yearly.
Another 12 percent responded that they disposed of this product every six months, while 10
percent reported that they disposed of their plastic mulch on a monthly basis. Other responses for
this question included every two months, nine months, 11 months, 14 months, and 24 months.
These producers were asked to indicate how much plastic mulch they discarded in a year. The
responses to this question ranged from 7.69 pounds per acre up to 704 pounds per acre. The
average poundage eliminated annually was 312 pounds while the median was 325 pounds. Taking
a weighted average based on acreage gives a disposal weight of 311 pounds per acre. The UC
Davis Cost Studies for strawberries typically used a weight of 350 pounds per acre. The
information found in this producer survey is lower than what these cost studies report. Hence, it is
suggested that an estimation of plastic mulch disposal for the state based on the cost study is
viewed with caution. Results from the survey show a large fluctuation on how much plastic is
used and it appears that these results are specific to the county.
Other than plastic mulch, the other type of plastic that is highly used by berry producers is plastic
drip tape. The responses for the amount of drip tape used per acre ranged from 5.22 linear feet per
acre up to 75,144 linear feet. It is unclear why the low end is so low. It is possible that the
producer indicating this usage was testing the possibility of utilizing drip tape. Or, the producer
made a calculation error when making the estimate on usage. There were two other producers

Contractor’s Report to the Board 35
who reported drip tape usage less than 3,000 linear feet per acre. One reported 18 linear feet per
acre, while the other producer indicated a usage of 240 linear feet per acre. The producer who
indicated 18 linear feet was also the producer from above that estimated their plastic mulch usage
at four square feet per acre.
The median strawberry producer reported using 16,000 linear feet of drip tape per acre. An
average usage of drip tape was reported at 17,937 square feet. Taking a weighted average using
acres, the estimated usage of drip tape per acre is 22,871 linear feet. The thickness of the drip tape
used ranged from one mil thick up to eight mils thick. The primary thickness of the drip tape used
ranged from four mils to six mils thick. Forty-seven percent of the producers indicated that they
used four mils thick plastic, 26 percent used five mils thick drip tape, and 12 percent used six mils
thick. Six percent of the producers indicated that they used eight mils thick drip tape, while
another 6 percent used one mil thick drip tape. The rest of the producers reported that they used
drip tape that was seven mils thick. When asked how much drip tape the producers discarded
each year, the median reported weight was 104 pounds per acre. The average reported weight per
acre was 189 pounds, while the weighted average based on acreage was calculated at125 pounds
per acre.
Producers were queried on how often they discarded their drip tape. Sixty-nine percent of
producers indicated that they disposed their drip tape on an annual basis, while 12 percent
discarded their drip tape on a monthly basis. Five percent of the strawberry producers reported
that they disposed their drip tape every two months, while another 5 percent indicated disposal
occurred every 24 months. Other responses for this question were every nine, 11, 14, and 36
months.
Figure 11 provides a look at the primary months that strawberry producers eliminated their largest
volume of agricultural plastic. At 41 percent, the summer season garnered the highest percentage
of producers indicating that they disposed the largest volume of plastic during this season. At the
other end of the spectrum, none of the producers indicated that they disposed of their agricultural
plastic in the spring. Thirty-nine percent of strawberry producers primarily discarded the
agricultural plastic in the autumn months, while only 20 percent reported that this occurs in the
winter months.
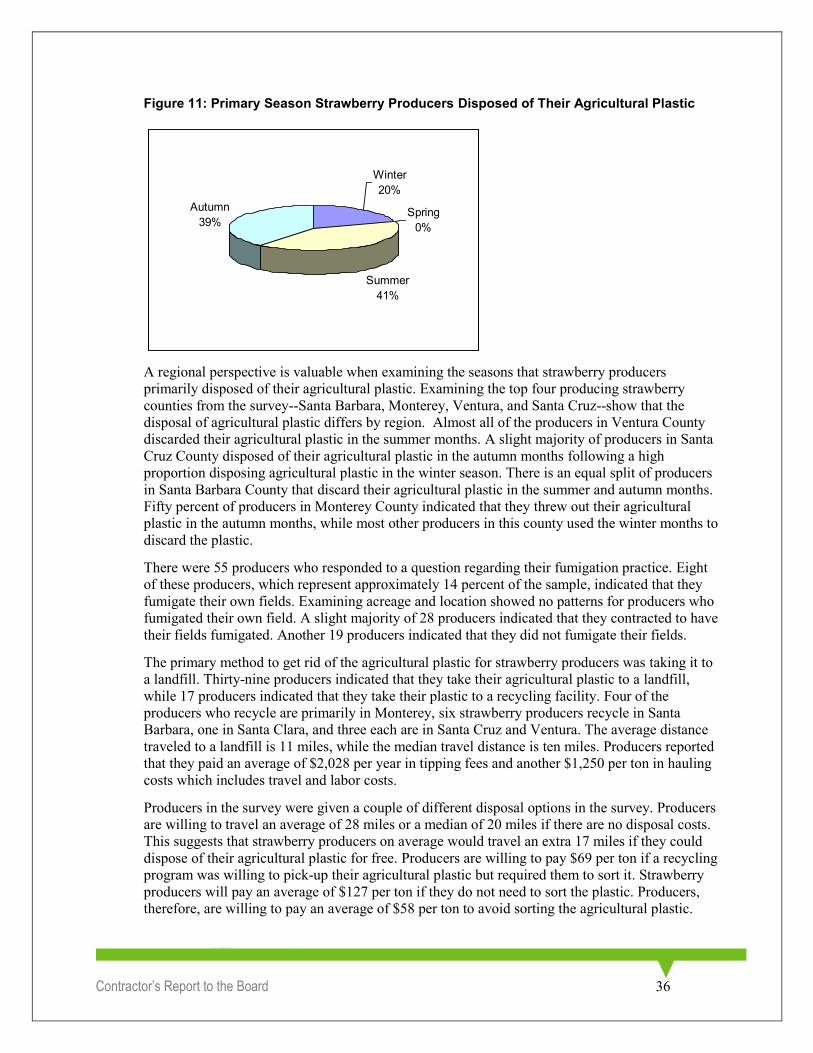
Contractor’s Report to the Board 36
Winter
20%
Summer
41%
Autumn
39%Spring
0%
Figure 11: Primary Season Strawberry Producers Disposed of Their Agricultural Plastic
A regional perspective is valuable when examining the seasons that strawberry producers
primarily disposed of their agricultural plastic. Examining the top four producing strawberry
counties from the survey--Santa Barbara, Monterey, Ventura, and Santa Cruz--show that the
disposal of agricultural plastic differs by region. Almost all of the producers in Ventura County
discarded their agricultural plastic in the summer months. A slight majority of producers in Santa
Cruz County disposed of their agricultural plastic in the autumn months following a high
proportion disposing agricultural plastic in the winter season. There is an equal split of producers
in Santa Barbara County that discard their agricultural plastic in the summer and autumn months.
Fifty percent of producers in Monterey County indicated that they threw out their agricultural
plastic in the autumn months, while most other producers in this county used the winter months to
discard the plastic.
There were 55 producers who responded to a question regarding their fumigation practice. Eight
of these producers, which represent approximately 14 percent of the sample, indicated that they
fumigate their own fields. Examining acreage and location showed no patterns for producers who
fumigated their own field. A slight majority of 28 producers indicated that they contracted to have
their fields fumigated. Another 19 producers indicated that they did not fumigate their fields.
The primary method to get rid of the agricultural plastic for strawberry producers was taking it to
a landfill. Thirty-nine producers indicated that they take their agricultural plastic to a landfill,
while 17 producers indicated that they take their plastic to a recycling facility. Four of the
producers who recycle are primarily in Monterey, six strawberry producers recycle in Santa
Barbara, one in Santa Clara, and three each are in Santa Cruz and Ventura. The average distance
traveled to a landfill is 11 miles, while the median travel distance is ten miles. Producers reported
that they paid an average of $2,028 per year in tipping fees and another $1,250 per ton in hauling
costs which includes travel and labor costs.
Producers in the survey were given a couple of different disposal options in the survey. Producers
are willing to travel an average of 28 miles or a median of 20 miles if there are no disposal costs.
This suggests that strawberry producers on average would travel an extra 17 miles if they could
dispose of their agricultural plastic for free. Producers are willing to pay $69 per ton if a recycling
program was willing to pick-up their agricultural plastic but required them to sort it. Strawberry
producers will pay an average of $127 per ton if they do not need to sort the plastic. Producers,
therefore, are willing to pay an average of $58 per ton to avoid sorting the agricultural plastic.

Contractor’s Report to the Board 37
Approximately 31 percent of strawberry producers indicated that there was a recycling program
for agricultural plastic in their county, while another 31 percent indicated there was no such
facility. The rest of the producers did not know whether or not a recycling facility existed. There
was no particular county in the top four strawberry counties that had a majority of the producers
indicating that a recycling program existed in their county. Only 20 percent of the producers
indicated that they knew of a recycling facility that would take their plastic. This means that
although 30.5 percent of the producers know that there is a recycling program for agricultural
plastic, some of these programs may not accept agricultural plastic from strawberry fields.
Interestingly, 31 percent of producers indicated that they recycle agricultural plastic.
Producers were asked to identify what difficulties they expect or have experienced with recycling
agricultural plastic. These producers were able to mark as many possibilities that applied to them.
Figure 12 shows the results of this question. The top two difficulties seen by strawberry producers
are that there are too many restrictions on recycling and the recycling facilities are too far away
from their operation. Twenty-three strawberry producers indicated that a difficulty with recycling
was that there were too many restrictions. This was followed closely by 20 producers that
reported that the recycling facilities were too far from their operation. Only a small amount of
producers thought that not having enough product was a restriction.
Figure 12: Identified Difficulties by Strawberry Producers for Recycling Agricultural Plastic
While the previous figure showed the difficulties foreseen with recycling agricultural plastic,
Figure 13 shows what incentives would induce strawberry producers to participate in recycling
their agricultural plastic. The biggest incentive these producers identified was to offer on-farm
plastic pick-up. This option has twice as many producers as the next closest options of county
collection facilities and offering more recycling facilities. This suggests that strawberry producers
are looking for the convenience of on-farm pick-up. The key to this solution is the cost of the on-
farm pick-up. Prices producers were willing to pay for a pick-up service for sorted and unsorted
plastic were given above. The option that received the fewest producers was easing of the tonnage
requirements. This was an issue that was mentioned by a producer in the strawberry focus group,
but it does not seem to be a big issue for producers in the survey. This may be due to the lack of
experience with recycling the agricultural plastic.
6
23
20
12
12
0 5 10 15 20 25
Not having enough product
Too many restrictions
Recycling facilities too far
Transportation too costly
Too costly (other than
transportation)

Contractor’s Report to the Board 38
Figure 13: Incentives for Encouraging Recycling of Agricultural Plastics for Strawberry Producers
19
8
19
20
38
17
0 10 20 30 40
Offer financial incentives
Ease tonnage requirements
Ease cleaning requirements
Offer more recycling/collection facilities
Offer on-farm plastic pick-up
County collection facility
Results for the Grape Industry
There were 250 surveys sent directly to grape producers; 93 of the producers submitted
information for the survey. Another 47 producers from other commodities indicated they grew
grapes. Every industry that was directly sampled except for the dairy industry had a group of
producers that indicated they grew grapes. There were four from the berry industry, one from the
strawberry industry, three from the pepper industry, three from the melon industry, seven from
the tomato industry, two from nursery, three from greenhouse, 12 from the hay industry, and 12
from the orchard industry. This brings the number to a total of 140 producers representing the
grape industry. This group accounted for 56,080 acres of grape production. A majority of
producers in this industry indicated they did not use agricultural plastic. Out of the 140 producers
representing the grape industry, 107 of them reported that they did not use agricultural plastic.
The other 33 producers indicated that they did use agricultural plastic. This means 24 percent of
grape producers who responded to the survey utilize agricultural plastic in their operation. The
plastic users in the grape industry controlled 24,760 acres. Table 6 displays the counties and
number of representatives that use agricultural plastic to produce grapes.

Contractor’s Report to the Board 39
Over
$1,000,000
58%$500,000 -
$1,000,000
18%
$250,000 -
$499,999
9%
$100,000 -
$249,999
6%
Under
$100,000
9%
Table 6: County and Number of Representatives Who Used Agricultural Plastic for the Grape Industry
County # County # County # County #
Contra Costa 1 Mendocino 1 San Joaquin 2 Sonoma 5
Fresno 4 Merced 1 San Luis Obispo 1 Tehama 1
Kern 3 Monterey 1 Santa Barbara 1 Tulare 2
Madera 1 Napa 5 Santa Clara 1 Yolo 3
The 33 grape producers in this study who used agricultural plastic reported spending $625,400
per year on plastic. This equates to an average amount of $0.12 per acre and a median of $0.05
per acre spent on agricultural plastic. While this may seem low, the drip lines that grape
producers use can last up to 25 years. The amount of money spent per year is on the maintenance
of this system. Figure 14 shows the income distribution of grape producers using agricultural
plastic. A majority of these producers, 58 percent, earned an average gross income that exceeded
$1,000,000. Another 18 percent reported earning between $500,000 and $1,000,000. The
percentage of producers who had an average gross income ofless than $500,000 was 24 percent.
Figure 14: Average Gross Income Distribution of Grape Producers Using Agricultural Plastic
Producers in the grape industry provided sparse usage data of agricultural plastic for mulch film,
drip tape, micro sprinklers, and other plastic. Much of the data that these producers gave was
incomplete and had a wide variation. The most complete information given was for drip tape,
which in terms of grape producers may also mean drip lines. Examining the data carefully gives
the impression that grape producers are replacing and disposing of very little agricultural plastic
per year. The range of drip tape used per year was between 0.1 linear feet to 3,955 linear feet per
acre. The lower end of this range represents producers who are making repairs to their existing
drip lines, while the upper end is likely made up of producers who are replacing their whole
irrigation system over an approximate three to five year span.
Most producers indicated that they discarded their plastic on a yearly basis. One producer
indicated that he disposed of his plastic every three years, while another producer indicated he
replaced it every five years. This disposal data indicates that most producers are discarding their
agricultural plastic on a yearly basis, while a few producers are saving it for longer periods of
time.

Contractor’s Report to the Board 40
Winter
17%
Spring
24%
Summer
28%
Autumn
31%
The primary method grape producers used to eliminate their agricultural plastic is to take it to a
landfill. The other method used by these producers was to take it to a recycling collection facility.
Figure 15 shows the primary season that these producers disposed of the largest volume of their
agricultural plastic. The autumn and summer seasons comprise almost 60 percent of the producers
who disposed of their agricultural plastic. Only 17 percent of producers indicated that they
discarded their agricultural plastic in the winter months.
Figure 15: Primary Season Grape Producers Disposed of Their Agricultural Plastic
Twenty grape producers out of the 33 who participated in the study indicated how much
agricultural plastic they discarded per year. This group indicated that they disposed of 31,904
pounds of plastic per year. These 20 producers controlled 13,800 acres, giving a disposal of
approximately 2.3 pounds per acre. Since this question related all the plastic for the farm, and not
just the plastic discarded for grapes, this result should represent a higher average than a producer
who does grapes only. One grape producer who reported his plastic disposal also produced
strawberries. Since strawberries are high-end users of plastic, this should pull the average up. The
average disposal of agricultural plastic drops to 1.4 pounds per acre once this producer is factored
out. The disposal that was reported is considered a marginal change. Since grape producers are
using a type of plastic for irrigation that has a long useful life, at some point these producers will
dispose of a large quantity of agricultural plastic at one time. It is beyond the scope of the survey
to obtain long-term agricultural disposal information.
Grape producers reported that they travel an average of 14 miles to discard their agricultural
plastic. It takes these producers an average of 1.75 trips to dispose of their yearly agricultural
plastic accumulation. These producers spend approximately $366 per year on tipping fees and an
estimated $99 per ton to haul their agricultural plastic to the landfill. Producers would travel an
average of 33 miles if they could recycle their agricultural plastic at no charge. This suggests that
these producers are willing to travel an extra 19 miles just to recycle their plastic for free.
Producers would pay on average $71 per ton if they were required to sort it and $111 per ton if
they did not have to sort the plastic with a pick-up service available for both options.
Fourteen grape producers indicated that they currently recycle their agricultural plastic, while
another 18 reported that they did not. This suggests that over 43 percent of the grape producers in
this study recycle at least a portion of their agricultural plastic. Thirteen producers knew of
recycling programs in their county for agricultural plastic, while 14 indicated that they knew of
recycling facilities that would take their plastic. Eight producers mentioned that there were no

Contractor’s Report to the Board 41
9
7
11
6
5
0 2 4 6 8 10 12
Not having enough product
Too many restrictions
Recycling facilities too far
Transportation too costly
Too costly (other than
transportation)
recycling programs in their county, while another eight indicated that they did not know of
recycling facilities that would take their plastic.
Figure 16 shows the results to the question on what difficulties producers have experienced or
expected to experience with recycling their agricultural plastic. Eleven grape producers indicated
that recycling facilities were too far away. In contrast, only five producers indicated that recycling
was too costly when factoring out transportation costs. As expected from the disposal and
production information, nine producers indicated that not having enough product made it difficult
to recycle. This result was expected considering producers reported generating less than 2.5
pounds of plastic per acre per year. The average-size producer in this study controlled 750 acres
of grapes, which suggests that they are generating less than a ton of agricultural plastic per year to
recycle.
Figure 16: Identified Difficulties by Grape Producers for Recycling Agricultural Plastic
Grape producers were asked to indicate which incentives would encourage them to recycle their
agricultural plastic. Figure 17 shows that on-farm plastic pick-up had the highest amount of
producers, over half of the agricultural plastic users, indicating that this incentive would
encourage them to recycle. Offering more recycling and collection facilities and having county
collection facilities were strong enticements to cause grape producers to recycle their agricultural
plastic. The incentives with the least results for grape producers were easing tonnage and cleaning
requirements. This outcome is expected, given that grape producers are not generating a large
quantity of plastic per acre annually.

Contractor’s Report to the Board 42
Figure 17: Incentives for Encouraging Recycling of Agricultural Plastics for Grape Producers
9
2
3
11
17
9
0 5 10 15 20
Offer financial incentives
Ease tonnage requirements
Ease cleaning requirements
Offer more recycling/collection facilities
Offer on-farm plastic pick-up
County collection facility
Results for the Melon Industry
Out of the 150 surveys sent to melon producers, 23 of these surveys were returned. Another 15
surveys were returned by producers from other industries that also produce melons. These
producers include one from the berry and dairy industries, six from the pepper industry, five from
the tomato industry, and two from the orchard industry. This group represents 38 melon
producers utilizing 4,921 acres in California. Twenty-four of these producers indicated they used
agricultural plastic, while another 14 stated that they did not use agricultural plastic. This equates
to a participation rate of 63 percent using agricultural plastic. The melon producers who used
plastic control 3,259 acres out of the 4,921 of all melon producers who participated in the survey.
Table 7 provides the number of representatives using agricultural plastic from each county. Four
of these melon producers are from Yolo County, while three are from Riverside and another three
are from Imperial. The rest of the counties in the table had either one or two representatives.
Table 7: County and Number of Representatives Who Used Agricultural Plastic for the Melon Industry
County # County # County # County #
Fresno 2 Riverside 3 San Joaquin 2 Yolo 4
Imperial 3 Sacramento 1 San Luis Obispo 2
Kern 1 San Benito 2 Sonoma 1
Madera 1 San Bernardino 1 Tehama 1
The distribution of income for the melon producers using agricultural plastic is represented in
Figure 18. This figure shows that 41 percent of the producers using agricultural plastic make over
$1 million in gross income. Another 21 percent identified that they earned between $500,000 and
$1,000,000. While the survey was targeted at producers who earned over $100,000, eight percent
of the plastic users reported that they were under this gross income.

Contractor’s Report to the Board 43
Figure 18: Average Gross Income Distribution of Melon Producers Using Agricultural Plastic
There are two primary forms of agricultural plastic that are used by melon producers—mulch film
and drip tape. Out of the 24 melon producers who identified themselves as plastic users, five
producers indicated that they used 4.1 million square feet of plastic on 453 acres. Five producers
provided the quantity of mulch used, and nine producers indicated the thickness of the plastic.
Five producers indicated that their mulch film was one mil thick, three producers indicated that
they used two mil plastic, while a single producer reported using nine mil thick plastic. Seven
producers reported their frequency of discarding the plastic. Four of these producers disposed of
their plastic twice a year, one producer removed his mulch plastic on a monthly basis, and two
producers disposed of their plastic on a yearly basis.
The other major form of plastic used by melon producers is drip tape. Seven producers reported
using 2.04 million linear feet of drip tape on 914 acres of melons. The average usage is 2,232
linear feet of drip tape per acre. The median usage is 4,350 linear feet per acre. This drip tape had
a range in thickness from two mils to eight mils with the median thickness at five mils. The
average usage of drip tape is highly skewed by one producer who reported using 562,500 linear
feet of drip tape on seven acres of land. This particular producer is either an outlier or intensively
farming a small parcel of melons. Factoring out the high user gives an average usage of 1,629
linear feet of drip tape per acre. Ten producers stated how frequently they discarded their drip
tape. Three of these producers indicated every six months, while another three reported every 12
months for disposal rates. Two producers throw out their drip tape every three years, while two
other producers discard their plastic on a monthly or quarterly basis.
Nineteen producers representing 2,948 acres indicated the amount they spent yearly on
agricultural plastic. As a group, these producers spent $490,450 per year on agricultural plastic.
This averages out to $166 spent annually per acre. Thirteen producers reported the total amount
of plastic they disposed of annually. The average weight was calculated at 2,088 pounds per acre,
while the median was at 140 pounds per acre. Examining the data discloses that one producer
reported disposing of 25,000 pounds per acre. The average amount disposed of calculates to 179
pounds per acre when factoring out this outlier. This result is much closer to the median. Twenty
melon producers indicated that they disposed of their plastic at a landfill, while only one producer
indicated that he recycled his agricultural plastic. The average distance traveled to dispose of their
Under $100,000
8%
$100,000 -
$249,999
13%
$250,000 -
$499,999
17%$500,000 -
$1,000,000
21%
Over
$1,000,000
41%

Contractor’s Report to the Board 44
plastic was 15 miles, while the median was ten miles. It is estimated that the producers spent an
average of $394 per ton on travel costs to haul their agricultural plastic to the landfill. These
producers made an average of 3.62 trips per year to remove their agricultural plastic and spent an
average of $1,932 per year on tipping fees.
Figure 19 shows the primary season that melon producers disposed of their plastic. This figure
highlights that the majority of producers discarded their plastic in the autumn months. The winter
and summer seasons garnered the same amount of producers choosing these seasons as their
primary months of removal, while spring was the least likely season for melon producers to
eliminate their plastic.
Figure 19: Primary Season Melon Producers Disposed of Their Agricultural Plastic
If melon producers had the opportunity to recycle their plastic for free, these producers would
travel an average of 41 miles to recycle their plastic. This suggests that melon producers are
willing to travel an extra 26 miles to recycle their plastic at no charge. These producers will pay
an average of $67 per ton if they are required to sort their plastic or $76 per ton if no sorting was
required. These amounts include that a collection service is provided. This suggests that
producers are willing to pay an additional $9 per ton for the convenience of not sorting the
agricultural plastic.
When the melon producers were asked to indicate their knowledge of recycling facilities for
plastic in their county, only one producer reported being aware of one. Eleven producers said that
there were none, while 12 producers did not know if there was one or not. These results are nearly
the same when the melon producers were asked if they knew of any recycling facility that would
take their agricultural plastic. While only one producer knew of a facility that takes agricultural
plastic, three producers revealed that they recycle their plastic. This indicates that some producers
in the melon industry are reusing some or all of their plastic products. The rest of the producers,
20 of them, indicated that they did not recycle their agricultural plastic.
Winter
17%
Spring
13%
Summer
17%
Autumn
53%

Contractor’s Report to the Board 45
3
7
12
1
1
0 2 4 6 8 10 12
Not having enough product
Too many restrictions
Recycling facilities too far
Transportation too costly
Too costly (other than transportation)
Figure 20: Identified Difficulties by Melon Producers for Recycling Agricultural Plastic
Examining Figure 20 shows that the greatest difficulty identified by melon producers for
recycling agricultural plastic is that recycling facilities are too far away from their facilities.
Twelve producers in the melon industry indicated that this was a difficulty with recycling their
agricultural plastic. The second largest difficulty perceived is that there are too many restrictions
placed on the agricultural plastic that is recyclable. The two difficulties that had the least amount
of producers identifying it as a difficulty were related to the cost of recycling. One producer was
concerned with transportation costs and one producer was worried with recycling costs other than
transportation.
Figure 21 provides a look at what the producers believe are the incentives that would encourage
them to recycle their agricultural plastic. Results shown in this figure indicate that a majority of
the producers prefer the on-farm pick-up service incentive. Fourteen out of the 24 producers
indicated that this was an enticement that encourages them to recycle. The next best inducement
indicated is providing additional recycling and collection facilities. This confirms the results that
the largest perceived difficulty of recycling for melon producers is that recycling facilities are too
far away. The incentive that was considered the least was easing the tonnage requirements. Since
few melon producers currently recycle, there is little experience in service denial due to a large
amount of plastic; therefore, this incentive may not seem important.

Contractor’s Report to the Board 46
Figure 21: Incentives for Encouraging Recycling of Agricultural Plastics for Melon Producers
8
3
7
10
14
8
0 2 4 6 8 10 12 14
Offer financial incentives
Ease tonnage requirements
Ease cleaning requirements
Offer more recycling/collection facilities
Offer on-farm plastic pick-up
County collection facility
Results for the Orchard Industry
There were 300 producers selected in the orchard industry to participate. Of this group, 118
actually took part in this study. Another 163 producers from other industries selected for this
study also indicated that they contributed to the orchard industry results. This group of other
producers was comprised of eight producers from the berry industry, three from the strawberry
industry, 11 from the pepper industry, 14 from the melon industry, 43 from the tomato industry,
17 from the nursery industry, ten from the greenhouse industry, 11 from the dairy industry, 18
from the hay industry, and 28 from the grape industry. These 281 producers farm 126,042 acres
of orchards. Out of this group, 63 producers indicated that they incorporate agricultural plastic on
their operations, while the rest of these producers responded that they did not use agricultural
plastic. This suggests that 22 percent of producers in this industry have adopted using agricultural
plastic in their operation. Table 8 provides a look at the number of producers who used
agricultural plastic in the orchard industry by county. Merced and San Joaquin counties represent
over a quarter of these producers, with Merced having ten respondents and San Joaquin having
seven respondents.
Table 8: County and Number of Representatives Who Used Agricultural Plastic for the o Industry
County # County # County # County #
Butte 2 Madera 4 San Joaquin 7 Tehama 1
Colusa 1 Merced 10 Santa Clara 2 Tulare 3
Contra Costa 1 Nevada 1 Solano 1 Ventura 1
Fresno 5 San Bernardino 1 Stanislaus 6 Yolo 5
Kern 4 San Diego 4 Sutter 1 Yuba 1
Kings 2
Figure 22 provides a look at the distribution of gross income from the producers who used
agricultural plastic in the orchard industry. Over 70 percent of these producers indicated they
earned an average yearly gross income of $500,000 or more. Fifty-two producers in the orchard
industry reported how much of their total gross income was devoted to purchasing agricultural

Contractor’s Report to the Board 47
$100,000 -
$249,999
8%
$250,000 -
$499,999
8%
$500,000 -
$1,000,000
25%
Over
$1,000,000
46%
Under
$100,000
13%
plastic on a yearly basis. This group represented 20,422 acres and reported spending as a group
nearly $2 million a year on agricultural plastic. This equates to an average expenditure of
approximately $96 per acre. The highest average spent per acre was $3,636, while the lowest was
under $1 per acre. The median spent per acre was nearly $18. One possible reason for such a wide
range spent on agricultural plastic per acre is that some producers are repairing irrigation lines,
while others are replacing them.
Figure 22: Average Gross Income Distribution of Orchard Producers Using Agricultural Plastic
There are two types of agricultural plastic that were primarily reported by the orchard industry:
drip tape and micro-sprinklers. Six producers reported usage of drip tape, while nine producers
indicated that they used micro-sprinklers. One producer in these two groups reported using both
drip tape and micro-sprinklers. The group of producers that utilizes drip tape used between 125 to
40,909 linear feet per acre. It appears that this upper end is either an outlier response or is a
producer who just put in a drip tape system. The second highest usage of drip tape per acre was
3,333 linear feet. The average drip tape used per acre is 920 linear feet per acre if the highest
value is factored out. These producers reported that they typically discarded their plastic on a
yearly basis. The orchard producers who used micro-sprinklers ranged from approximately three
to 1,333 linear feet per acre. The lower range probably represents the amount repaired on a yearly
basis rather than how much was used per acre. The average usage per acre of this group was 239
linear feet. The typical producer discarded this plastic on a yearly basis. Two producers indicated
that they disposed of this type of plastic every six months, while one producer indicated quarterly
disposal and one producer reported monthly disposal.
Figure 23 shows the primary season that producers in the orchard industry disposed of their
agricultural plastic. The autumn and spring seasons have approximately the same amount of
producers which indicate that they primarily discard the agricultural plastic during this time
period. Summer had the least amount of producers at 15 percent, while the winter season
garnered 21 percent. The producers generally chose to take the plastic to the landfill as a method
of disposal. There were 32 producers who indicated that they used a landfill in comparison to 18
producers who indicated that they recycle their agricultural plastic. None of the producers from
this industry indicated that they bury or burn their agricultural plastic.

Contractor’s Report to the Board 48
Winter
21%
Spring
31%Summer
15%
Autumn
33%
Figure 23: Primary Season Orchard Producers Disposed of Their Agricultural Plastic
Forty-one producers indicated how many pounds of agricultural plastic they discard from their
farm on a yearly basis. Forty of these producers indicated that they disposed of approximately
356,000 pounds of plastic a year. One producer was not factored into this calculation because he
reported disposing of 3,000,000 pounds of plastic in a year, which is clearly an outlier result.
Examining plastic disposal on an acreage basis shows that an average of 54.76 pounds of plastic
disposed of per acre, while the median is 4.72 pounds per acre. Producers took an average of 6.67
trips per year with the median at one trip per year to throw away the plastic. These producers
traveled an average of 12.04 miles to dispose of the plastic, while the median distance traveled
was ten miles. The producers estimated that they pay $389.34 per year in tipping fees and pay
approximately $95.74 per ton to haul the plastic.
When given the option, producers on average travel up to 22.28 miles to recycle their agricultural
plastic at no cost. Given that they currently travel approximately 12 miles to dispose of their
plastic, this result indicates that producers are willing to travel an extra ten miles to recycle their
agricultural plastic for free. If a pick-up service existed for their agricultural plastic, producers in
the orchard industry would pay $552.88 per ton if they were required to sort their plastic and
$396.31 per ton if they were not required to sort. These figures are high because three producers
reported values over $1,000 per ton. Factoring this group out, the average willingness-to-pay for a
pick-up service where the producers have to sort the plastic is $53.03 per ton, while their
willingness-to-pay is $58.86 per ton if they were not required to sort. The median in both of these
cases is $15 per ton, which suggests that there are a few producers who are willing to pay higher
than the average.
Thirty-eight percent of the agricultural producers in the orchard industry who used agricultural
plastic indicated that they recycle their plastic. This same percentage knew of recycling facilities
that took their agricultural plastic, while only 32 percent indicated that they knew of recycling
programs for their agricultural plastic in their county. There was an even split of producers
indicating that there was either no recycling program in their county or they did not know of one.
Thirty percent of producers reported that they did not know of any recycling facilities for their
plastic.
Figure 24 identifies the difficulties that producers have encountered or expect to encounter with
recycling their agricultural plastic. The two main difficulties expected by producers in the orchard
industry are that transportation is too costly and they do not have enough plastic to recycle. Each

Contractor’s Report to the Board 49
15
12
11
15
9
0 2 4 6 8 10 12 14 16
Not having enough product
Too many restrictions
Recycling facilities too far
Transportation too costly
Too costly (other than transportation)
of these difficulties garnered 15 producers. The next highest difficulty is too many restrictions
placed on recycling agricultural plastic. The least of the difficulties identified is recycling other
than transportation costs is too costly.
Figure 24: Identified Difficulties by Orchard Producers for Recycling Agricultural Plastic
When the producers in the orchard industry were asked to identify what incentives would
encourage them the most to recycle the plastic, they overwhelmingly chose having an on-farm
pick-up service. Figure 25 shows that 38 producers chose this incentive, while 21 producers
indicated that financial incentives would encourage them to recycle. The least preferred incentive
that producers identified was easing the tonnage requirements. This correlates with the previous
result that producers perceive that one of the biggest difficulties they have with recycling is
having enough material to recycle.
Figure 25: Incentives for Encouraging Recycling of Agricultural Plastics for Orchard Producers
21
10
12
23
38
14
0 5 10 15 20 25 30 35 40
Offer financial incentives
Ease tonnage requirements
Ease cleaning requirements
Offer more recycling/collection facilities
Offer on-farm plastic pick-up
County collection facility
Results for the Pepper Industry
The sample drawn for the survey representing the pepper industry had 150 producers, 35 of which
actually responded to the survey. There were 17 other producers representing various industries
that indicated that they also produced peppers. This group comprised of one berry producer, two
strawberry producers, seven melon producers, five tomato producers, one nursery producer and
one greenhouse producer. There are 52 pepper producers identified in this study. This group

Contractor’s Report to the Board 50
Over
$1,000,000
55%$500,000 -
$1,000,000
21%
$250,000 -
$499,999
16%
Under $100,000
8%
$100,000 -
$249,999
0%
represents 3,203 acres of pepper plants. Thirty-eight of these producers identified themselves as
plastic users, while the remainder indicated that they did not use agricultural plastic. This
suggests that over 73 percent of producers in the pepper industry are using agricultural plastic.
The pepper plastic users represent 2,465 acres of peppers and 17 counties as shown in Table 9.
San Benito County had the highest number of producers corresponding to it with five producers
indicating that they used agricultural plastic. Fresno, Santa Clara, and Yolo counties each had
four representatives from the survey who indicated they used agricultural plastic, while the rest of
the counties had three or less.
Table 9: County and Number of Representatives Who Used Agricultural Plastic for the Pepper Industry
County # County # County # County #
Fresno 4 Monterey 1 San Benito 5 Santa Barbara 3
Kern 1 Orange 2 San Bernardino 1 Santa Clara 4
Los Angeles 2 Riverside 2 San Diego 1 Ventura 2
Madera 1 Sacramento 1 San Luis Obispo 3 Yolo 4
Merced 1
Figure 26 presents the income distribution of the pepper producers who used agricultural plastic.
A majority of these producers, 55 percent, indicated that they earned an average gross income
above $1 million. Only 8 percent of the producers indicated they earned less than $100,000. Out
of the 38 pepper producers who indicated using agricultural plastic, 27 of them reported their
yearly plastic expenditure. These producers indicated that they spent nearly $1.4 million a year on
plastic which equates to $51,215 per producer. The average amount spent per acre was calculated
to be $2,102 per acre, while the median was $854 per acre.
Figure 26: Average Gross Income Distribution of Pepper Producers Using Agricultural Plastic
The two primary plastics that pepper
producers used were mulch film and
drip tape. Seven producers reported
using 17.8 million square feet of plastic. This equated to an average of 28,548 square feet used
per acre. The median reported acreage usage of mulch film was almost identical at 28,708 square
feet. Three quarters of the pepper producers reported using plastic that was one mil thick, while
the rest of the producers reported using plastic that was two mil thick. Seven producers reported
as a group that they disposed of 68,370 pounds of plastic mulch per year. Seven individual
producers indicated the amount of plastic mulch that they threw out per year. Fourteen producers

Contractor’s Report to the Board 51
Winter
29%
Spring
9%Summer
15%
Autumn
47%
indicated the frequency of disposal; nine producers of those stated they discarded the mulch film
on a yearly basis, while one producer indicated he disposed of his mulch plastic every two years.
Four other producers evenly split indicated they disposed of their mulch on either a monthly basis
or every six months.
Out of the 38 pepper producers who reported in the survey that they used agricultural plastic, 15
of these producers stated how much drip tape they used. There were two producers in this group
that reported heavy usage of drip tape per acre. One producer indicated that he used 130,000
linear feet of drip tape per acre, while another reported using 12.4 million linear feet per acre. The
average amount of drip tape used per acre was 16,501 linear feet, if these two producers are
excluded. The median reported drip tape usage was then 17,000 linear feet per acre. Seventeen
producers reported the thickness of the drip tape used, which ranged from four mils thick to ten
mils thick with six producers indicating that they used five mil drip tape and another six
indicating they used six mil tape. Three different producers reported using drip tape that was
eight, nine, or ten mil thick respectively, while two producers reported using four mil drip tape.
Twelve producers indicated that they discarded 24,387 pounds of drip tape per year. Twenty-four
producers reported their frequency of disposal. Fourteen producers said the frequency of disposal
was 12 or more months, with nine indicating they disposed of their plastic annually.
Figure 27: Primary Season Pepper Producers Disposed of Their Agricultural Plastic
Twenty-one producers indicated their yearly plastic disposal. This group reported disposing of
436,305 pounds of plastic per year from their farming operation. This equates to approximately
20,800 pounds per producer. Figure 27 provides the seasonal distribution which producers
primarily disposed of their agricultural plastic. Nearly 50 percent of these producers indicated that
they discarded their plastic in autumn. Another 29 percent of these producers reported winter as
their primary elimination period. Twenty-seven producers indicated that they disposed of their
plastic at a landfill, while only seven producers reported taking their agricultural plastic to a
recycling facility. Pepper producers take an average of 4.35 trips per year and travel an average
14.59 miles per trip to get rid of this plastic. The producers estimated that they paid on average
$2,087 per year in tipping fees and $343 per ton in transportation.
Pepper producers would travel on average up to 26.29 miles if they had the opportunity to recycle
their agricultural plastic at no charge. This suggests that producers would travel an extra 12 miles
to recycle their agricultural plastic for free. Given the opportunity to have their plastic picked up
for them as long as it is sorted, the producers on average indicated they would pay $112.40 per

Contractor’s Report to the Board 52
4
13
13
8
5
0 2 4 6 8 10 12 14
Not having enough product
Too many restrictions
Recycling facilities too far
Transportation too costly
Too costly (other than transportation)
ton. The median willingness-to-pay for this service was $50 per ton. The producers are willing to
pay an average of $119.55 per ton if they do not have to sort their plastic. The median estimate
for unsorted plastic pick-up service was $100 per ton. One producer was excluded from the
calculation because he stated he would pay $5,000 per ton for both sorted and unsorted pick-up
services.
Out of the 38 pepper producers in this study, ten of them indicated that they recycle some of their
agricultural plastic. Ten producers stated they knew of recycling facilities that can take
agricultural plastic, while six producers reported that there were recycling facilities in their
county for agricultural plastic. Most of the pepper producers did not know of any recycling
facilities in their county, or of any that would take their agricultural plastic.
Figure 28 provides a look at what difficulties pepper producers have experienced or anticipate
with recycling agricultural plastic. Producers identified that the biggest difficulty with recycling
is that the recycling facilities are too far from their operation or there are too many restrictions on
the type of plastic it will accept. The least perceived difficulty is not having enough material to
recycle; five producers indicated this as a difficulty. These producers do not seem to think that the
costs of recycling, factoring out transportation expenses, were too high. These producers are more
concerned with the cost of transportation.
Figure 28: Identified Difficulties by Pepper Producers for Recycling Agricultural Plastic
While there are many incentives that would encourage pepper producers to recycle, Figure 29
illustrates that twenty-seven producers mostly preferred on-farm plastic pick-up service. Sixteen
producers were encouraged to recycle with a financial reward. This incentive had 59 percent
fewer respondents than the pick-up service incentive. This was closely followed by offering
additional recycling facilities and less cleaning requirements. Both of these received support from
15 producers in the pepper industry. The least preferred inducement was the easing of tonnage
requirements.
Figure 29: Incentives for Encouraging Recycling of Agricultural Plastics for Pepper Producers

Contractor’s Report to the Board 53
16
5
15
15
27
12
0 5 10 15 20 25 30
Offer financial incentives
Ease tonnage requirements
Ease cleaning requirements
Offer more recycling/collection facilities
Offer on-farm plastic pick-up
County collection facility
Results for the Tomato Industry
Three hundred tomato producers were sent the survey on agricultural plastic usage. Sixty-four of
these producers returned information on their agricultural plastic usage, while another 38 from
other commodity producers also returned information regarding their usage of agricultural plastic
for producing tomatoes. This group of other commodities included two from the berry industry,
one from the strawberry industry, 14 from the pepper industry, 15 from the melon industry, three
from the nursery industry, two from the greenhouse industry, and one from the hay industry.
These 102 producers represented 41,836 acres of tomatoes. Out of the 102 tomato producers, 37
indicated that they used agricultural plastic, while the rest of the producers responded that they
did not use plastic on their operations. This equates to a participation rate of approximately 36
percent who used agricultural plastic. These 37 producers farm 10,150 acres of tomatoes and
represent 19 different counties. Table 10 presents the number of sampled producers by county
using agricultural plastic. Fresno and Yolo counties had the highest number of representatives
from the survey who indicated using agricultural plastic.
Table 10: County and Number of Representatives Who Used Agricultural Plastic for the Tomato Industry
County # County # County # County #
Fresno 8 Riverside 1 San Luis Obispo 2 Sonoma 1
Los Angeles 2 Sacramento 1 San Mateo 1 Sutter 1
Madera 1 San Benito 2 Santa Barbara 1 Ventura 1
Merced 3 San Bernardino 1 Santa Clara 3 Yolo 5
Monterey 1 San Joaquin 1 Solano 1
Figure 30 illustrates that over two-thirds of the agricultural plastic users in the tomato industry
earned an average yearly gross income over $500,000. The smallest percentage of tomato
producers in this industry range in income from $100,000 to $249,999, while the largest
percentage made over $1,000,000. There were 25 out of the 37 tomato producers which spent as a
group $394,316. This equates to an average of $15,772 per producer. Focusing on a per-acre basis
demonstrates that these producers spend an average of $798.63 per acre, while the median
producer spends $200 per acre.

Contractor’s Report to the Board 54
$100,000 -
$249,999
5%
$250,000 -
$499,999
16%
$500,000 -
$1,000,000
22%
Over
$1,000,000
46%
Under $100,000
11%
Figure 30: Average Gross Income Distribution of Tomato Producers Using Agricultural Plastic
The tomato producers in the survey provided vague information on their usage of agricultural
plastic. Three producers indicated that they used plastic mulch, but only one provided the actual
usage. One producer reported using a hoop/tunnel house covering. The best information provided
pertained to utilizing drip tape. Nine producers provided some information regarding their usage
of drip tape, while five producers provided the amount of drip tape that was applied. The average
amount of drip tape used per acre was 7,761 linear feet, while the median amount was 7,500
linear feet per acre. Four producers indicated that they utilized drip tape that is six mils thick,
while three producers reported using five mil drip tape. One producer reported using ten mil tape,
while another producer indicated using 13 mil drip tape. Ten producers identified how often they
disposed of their agricultural plastic. Half of these producers indicated that they disposed of their
plastic on a yearly basis. The other frequencies of disposal reported were every three, six, 24, 36
and 96 months.
Figure 31 shows the distribution of when tomato producers primarily disposed of their
agricultural plastic. The preferred season for 43 percent of producers was in the autumn months.
Another 36 percent of the producers indicated that they primarily discarded their plastic in the
winter months. Spring and summer had a much smaller number of producers removing their
agricultural plastic, 12 percent each in the spring and summer.

Contractor’s Report to the Board 55
Winter
36%
Spring
9%Summer
12%
Autumn
43%
Figure 31: Primary Season Tomato Producers Disposed of Their Agricultural Plastic
Out of the 37 producers who filled out the survey, 19 of them reported the total amount of plastic
they disposed of per year. These producers reported that they collectively discarded 138,803
pounds. This equates to an average of 7,305 pounds per producer. The primary method of
disposal of agricultural plastic for the tomato industry is to take it to a landfill. Twenty-five
producers indicated that they disposed of their agricultural plastic at a landfill, while only four
said that they used a recycling collection facility to get rid of their plastic. Producers typically
take 1.88 trips per year to dispose of this plastic, traveling an average of 12.55 miles or a median
of eight miles. These producers estimate that they spend an average of $572 per year on tipping
fees to dispose of their plastic and $140 per ton to haul agricultural plastic to a landfill.
Tomato producers would travel 26.94 miles to the recycling facility or a median distance of 17.5
miles if they were able to recycle their plastic at no charge. This suggests that producers would
travel on average an extra 14 miles to recycle the plastic for free. If a pick-up service existed for
the producers’ agricultural plastic, they would spend an average of $72.50 per ton if they were
required to sort their plastic, and $84.72 per ton if they did not have to sort it. This calculation
was made by excluding one producer who reported that he was willing to pay $5,000 per ton
whether he had to sort the plastic or not. The median producer reported that he would pay $37.50
per ton if required to sort the plastic and $45 per ton if no sorting was necessary.
Tomato producers were asked if they currently recycle any of their agricultural plastic. Nine
producers, who comprised 25 percent of the respondents to this question, reported recycling some
of their agricultural product. The same number of producers who reported that they recycle also
reported knowing of recycling facilities that would take their agricultural plastic, while only eight
producers knew of recycling facilities in their counties. Fifteen producers indicated that there was
no recycling facility in their county, while 14 producers indicated that they did not know of any
facility that would take their recycling.
Figure 32 illustrates that tomato producers perceived two difficulties with recycling agricultural
plastic. These producers indicated that recycling facilities are too far. The other obstacle
perceived by tomato producers is that there are too many restrictions placed on recycling
agricultural plastic. The least of the difficulties identified was that transportation of plastic is too
expensive. Eight producers believed that one of their problems with recycling was that they did
not have enough material to recycle.

Contractor’s Report to the Board 56
8
11
11
5
6
0 2 4 6 8 10 12
Not having enough product
Too many restrictions
Recycling facilities too far
Transportation too costly
Too costly (other than transportation)
Figure 32: Identified Difficulties by Tomato Producers for Recycling Agricultural Plastic
Figure 33 shows the incentives that tomato producers identified that would encourage them to
recycle their agricultural plastic. The biggest incentive that would get producers to recycle their
agricultural plastic is offering an on-farm pick-up service. A distant second incentive was offering
a financial incentive to producers for recycling their agricultural plastic. The smallest incentive is
lowering the limits on tonnage restrictions. The results were expected since a group of producers
believed one of the difficulties with recycling was that they did not have enough product
available to recycle.
Figure 33: Incentives for Encouraging Recycling of Agricultural Plastics for Tomato Producers
14
3
5
8
24
6
0 5 10 15 20 25
Offer financial incentives
Ease tonnage requirements
Ease cleaning requirements
Offer more recycling/collection facilities
Offer on-farm plastic pick-up
County collection facility
Results for the Vegetable Industry
Although there was no attempt made at deriving a sample specifically for vegetable growers who
were not in the pepper or the tomato industry, a section of the survey was set aside for producers
growing other vegetables than the ones primarily focused on in this survey. The commodity
producers that responded to the acreage question regarding this category represented 52,759 acres
of vegetables excluding pepper and tomato acreage. Figure 34 demonstrates the number of
respondents in each industry that indicated they grew vegetables other than peppers and tomatoes.
Sixty-seven of these producers indicated they were plastic users, while 61 producers responded

Contractor’s Report to the Board 57
that they did not use agricultural plastic. This equates to a 52 percent participation rate utilizing
agricultural plastic.
Figure 34: Number of Respondents in Each Industry Growing Vegetables
The vegetable producers who used agricultural plastic farmed 32,944 acres and represented 25
counties. The counties and the number of vegetable growers representing the county are
illustrated in Table 11. The largest representations of vegetable producers who used agricultural
plastic were from Monterey, Santa Barbara, and Fresno counties. Out of the 67 producers who
identified themselves as plastic users, 48 of these growers reported that they collectively spent
approximately $2.24 million on agricultural plastic yearly. This equates to an average of $46,594
per producer.
Table 11: County and Number of Representatives Who Used Agricultural Plastic for the Vegetable Industry
County # County # County # County #
Fresno 7 Nevada 1 San Diego 1 Sonoma 1
Imperial 1 Orange 2 San Joaquin 1 Stanislaus 1
Kern 1 Placer 1 San Luis Obispo 2 Ventura 3
Kings 2 Riverside 2 Santa Barbara 8 Yolo 5
Los Angeles 2 Sacramento 3 Santa Clara 5
Madera 2 San Benito 3 Santa Cruz 1
Monterey 9 San Bernardino 2 Shasta 1
Figure 35 shows the average gross income of the producers who indicated they grow vegetables
using agricultural plastic. This figure demonstrates that 50 percent of the producers earn a gross
income over $1,000,000 per year. The next largest group at 22 percent brings in between
$500,000 and $1,000,000. The smallest group receives a range between $100,000 and $249,999.
This group represented 3 percent of all the respondents in this income level.

Contractor’s Report to the Board 58
Over
$1,000,000
50%
$500,000 -
$1,000,000
22%
$250,000 -
$499,999
15%
Under $100,000
10%
$100,000 -
$249,999
3%
Winter
29%
Spring
11%Summer
11%
Autumn
49%
Figure 35: Average Gross Income Distribution of Vegetable Producers Using Agricultural Plastic
There were two primary types of agricultural plastics that the vegetable producers provided
information on, mulch film and drip tape. Ten producers provided either partial or full
information regarding their plastic mulch usage. Seven producers provided the actual amount of
plastic mulch they used on their vegetable crops. This group reported using 5.15 million square
feet of mulch on 3,385 acres, which equates to an average of 15,221 square feet per acre. Overall,
the average usage per acre was 10,317 square feet with a median of 8,000 square feet per acre.
The producers were almost evenly split on the numbers in terms of utilizing either one mil plastic
versus two mil plastic for their mulch needs. Most producers, approximately 73 percent, indicated
that they disposed of this plastic annually, while the rest indicated that they disposed of this
plastic monthly.
There were 29 vegetable producers that provided at least partial information on their usage of drip
tape. Out of this group, 19 producers reported that collectively they used 28.79 million linear feet
of drip tape on 4,790 acres, which equates to an average usage of 6,010 linear feet per acre and
1.5 million linear feet per producer. Focusing on the average amount of drip tape per acre, these
producers used 10,740 linear feet. The median producer used 2,000 linear feet per acre. There
was a wide range of thickness that vegetable producers used for their drip tape. The thinnest drip
tape was reported at two mils thick, and the thickest at ten mils. Most producers reported using
between four to six mils thick drip tape and reported discarding their drip tape annually.
Following the next most common response was disposal on a monthly basis. Other disposal
frequencies reported were three, six, 36, and 48 months.
Figure 36: Primary Season Vegetable Producers Disposed of Their Agricultural Plastic
Contractor’s Report to the Board 59
The two methods vegetable producers use to eliminate their agricultural plastic are either taking it
to a landfill or a recycling facility. Forty-five vegetable producers indicated that they currently
disposed of their plastic at a landfill, while 17 producers indicated that they take their plastic to a
recycling facility. As shown in Figure 36, the primary season that vegetable producers disposed
of the largest volume of their plastic is in the autumn months. Forty-nine percent of vegetable
producers indicated that this season was when the plastic was removed, while 29 percent
indicated winter. Both summer and spring garnered only 11 percent each. Thirty-five producers in
this study indicated that they collectively discarded 1.06 million pounds of plastic each year. This
equates to an average of 30,157 pounds per producer. The median producer reported a disposal
amount at 2,000 pounds of plastic per year.
The vegetable producers in this study reported traveling an average of 15.12 miles per trip to
discard their agricultural plastic, and traveled an average of 4.28 trips per year. The median
producer indicated traveling 8.5 miles per trip and taking one trip annually. On average, vegetable
producers spent $1,259 per year on tipping fees and $528 per ton on hauling costs to dispose of
their agricultural plastic. Given the opportunity to recycle their agricultural plastic at no charge,
producers would travel up to an average of 30.39 miles to the facility. The median producer
would travel 20 miles to recycle their plastic. If a pick-up service was available, they are willing
to pay an average of $66 per ton if they have to sort the plastic, and $79 per ton if no sorting was
necessary. The calculation of these values excluded one producer who indicated he would pay
$5,000 a ton under either scenario.
Out of the 67 vegetable producers who indicated they used agricultural plastic, only 20 reported
that they recycle some of their plastic. Eighteen producers indicated that they knew of facilities
that would recycle their agricultural plastic, while 14 producers indicated they knew of a
recycling program in their county. These results would indicate that two producers are in some
manner reusing their plastic. The highest percentage of producers indicated that they did not
know whether there were recycling programs in their county (48 percent) and whether there were
recycling programs for their agricultural plastic (45 percent).
Figure 37 presents the identified difficulties that vegetable producers perceive or have
encountered with recycling agricultural plastic. The biggest difficulty identified was that
recycling facilities are too far away from the producers operation. While 20 producers recognized
distance as an obstacle, the next difficulty that 16 producers identified was that there are too
many restrictions to recycling. The least identified problem was not having enough material to
recycle. Producers rated recycling costs as a bigger challenge than transportation costs. Coupling
this with the result of too many restrictions suggests that vegetable producers perceive that
recycling is a costly venture.

Contractor’s Report to the Board 60
11
16
20
12
14
0 5 10 15 20
Not having enough product
Too many restrictions
Recycling facilities too far
Transportation too costly
Too costly (other than transportation)
Figure 37: Identified Difficulties by Vegetable Producers for Recycling Agricultural Plastic
Examining Figure 38 illustrates the incentive that would encourage the largest amount of
producers to recycle their agricultural plastic is offering an on-farm plastic pick-up service. Forty-
one producers indicated a preference for this inducement. The one that garnered the second
highest amount of producers was to offer a financial incentive. This enticement was 30 percent
less than the top rated one. The incentive that was least interesting for this group was easing the
tonnage restrictions. Nine producers indicated that this would encourage them to recycle.
Figure 38: Incentives for Encouraging Recycling of Agricultural Plastics for Vegetable Producers
29
9
21
24
41
19
0 5 10 15 20 25 30 35 40 45
Offer financial incentives
Ease tonnage requirements
Ease cleaning requirements
Offer more recycling/collection facilities
Offer on-farm plastic pick-up
County collection facility
Results for the Dairy Industry
The sample size selected for the dairy industry was 220 producers. Out of this group, 55
producers returned information regarding their plastic usage. One producer in the nursery
industry, one in the fruit and nut industry, and eight producers in the hay industry also identified
themselves as dairy producers. The total number of dairies represented is 65, and accounted for
73,597 dairy cows. The average herd size was 1,132, while the median producer reported having
750 cows. The largest dairy was 4,150 and the smallest dairy was 62 cows. Out of the 65 dairies
that completed the survey, 39 of them indicated that they used agricultural plastic. This suggests
that 60 percent of the producers in the dairy industry use some form of agricultural plastic in their
operation. The average-size dairy for this group was 1,083, while the median-size dairy had 600

Contractor’s Report to the Board 61
Over
$1,000,000
51%
$100,000 -
$249,999
13%
Under $100,000
0%
$250,000 -
$499,999
13%
$500,000 -
$1,000,000
23%
cows. The maximum and minimum herd sizes are the same for plastic users and non-plastic users.
Table 12 shows how many dairy producers in the survey used agricultural plastic categorized by
county. Stanislaus County had the highest number of representatives at nine producers, while
Merced had the second highest representation with seven producers. These two counties
represented just over 41 percent of the dairy producers who reported plastic usage in the survey.
Table 12: County and Number of Representatives Who Used Agricultural Plastic for the Dairy Industry
County # County # County # County #
Fresno 4 Kings 3 San Joaquin 5 Tulare 4
Glenn 2 Merced 7 Sonoma 3
Humboldt 1 Sacramento 1 Stanislaus 9
Figure 39 displays the income distribution of the dairy producers who used agricultural plastic.
Over 50 percent of these producers reported an income over $1,000,000, while none of the
producers indicated having an income less than $100,000. Thirty-three dairy producers indicated
in the survey how much income was spent per year on agricultural plastic. This group collectively
spent $407,600 on plastic which equates to approximately $12,352 per producer annually. The
cost per cow ranged from $0.11 to $75. The average cow cost $11.91, while the median producer
indicated that he spent $6.25 per cow on agricultural plastic. Seventeen producers reported how
much agricultural plastic they disposed of each year. As a whole, this group reported disposing of
3,191,810 pounds of plastic per year. This result was highly skewed by one producer who
indicated that he disposed of 3,000,000 pounds of plastic annually. This producer reported that
this plastic was from silage bags. Factoring this person out as an outlier reconfigures the average
plastic discarded annually by a producer as 11,988 pounds per year. The median producer
reported disposing 4,000 pounds of plastic per year.
Figure 39: Average Gross Income Distribution of Dairy Producers Using Agricultural Plastic
According to the survey results, there are many types of plastic used on dairies in California. The
producers in the survey reported using: 1) manure/compost pile covers, 2) haystack covers, 3)
silage bags, and 4) plastic twine. Also, many producers in the survey consistently indicated that
they used plastic to cover their silage. None of the dairy producers indicated that they used plastic
to cover their lagoons.

Contractor’s Report to the Board 62
There were six dairy producers that reported how much plastic they used to cover their manure
piles. This group reported an average plastic usage of 21,090 square feet per producer. The
average square footage used for manure piles was 15.19 per cow. Two of these producers
indicated using plastic that was six mils thick, while the other producers did not report on the
thickness of the plastic they used. Four producers indicated the frequency of the disposal of this
type of plastic. Two producers specified that they disposed of this plastic yearly, one producer
reported quarterly, and another producer reported twice a month.
Out of the 13 dairy producers who indicated that they used plastic to cover their haystacks, 11
indicated the amount of plastic they used. These 11 producers also collectively reported using
297,950 square feet of plastic, which equates to 27,086 square feet of plastic per producer.
Examining this usage shows that 34.08 square feet of plastic is utilized per cow to cover the
haystack on the dairy. Out of the 11 producers who reported their plastic usage, six identified the
thickness of the plastic they used to cover their haystack. Six mils plastic garnered half of the
responses in this area, while two mils, ten mils, and 11 mils plastic were also reported. Nine
producers reported the frequency that they disposed of their plastic. The responses ranged from
every month to every three years. Annual disposal garnered one-third of the respondents, while
monthly had two-ninths of the responses. The rest of the responses (two, three, six, and 36) had
only one producer each.
Eleven producers reported using plastic silage bags on their operations. Six producers reported
the quantity used per square feet, while two producers reported the quantity used on a linear feet
basis. The total square footage of silage bags reported by the six producers was 215,155 square
feet, which equates to an average of 35,859 square feet per producer. One producer indicated that
they used 400 linear feet of silage bags, while another producer reported 30,000 linear feet. There
were two producers who provided the thickness of the silage bags they used. One producer
reported using a silage bag that was four mils thick; while the other producer indicated that they
used eight mils thick plastic. Seven producers reported the frequency in which they disposed of
their silage bags. Three producers indicated that they discarded these bags on a monthly basis,
two producers reported disposal twice a year, and two producers indicated yearly disposal.
While the survey asked dairy producers to indicate their silage bag usage, it did not explicitly ask
about any other plastic usage related to silage. These producers were given an opportunity in the
survey to offer information on other types of plastic they used. Twelve producers took this
opportunity to specify using silage covers. As a group, these producers reported using 608,813
square feet of silage covers, which equates to 50,734 square feet per producer. The most common
thickness reported for this cover was six mils; eight mils and ten mils. Five out of eight producers
indicated that they discarded this plastic on a monthly basis; six months, 12 months, and 18
months were also given as the frequency of disposal.
The dairy producers who used agricultural plastic indicated two primary methods of eliminating
their agricultural plastic. Seventeen producers indicated that they disposed of their plastic at a
landfill, while eight producers reported taking their plastic to a recycling collection facility. When
asked what was the primary season for discarding their agricultural plastic (results shown in
Figure 40), 38 percent of producers indicated they disposed of their largest volume of plastic
during the winter. Twenty-eight percent picked spring as the primary disposal season, while
another 24 percent chose autumn.

Contractor’s Report to the Board 63
Figure 40: Primary Season Dairy Producers Disposed of Their Agricultural Plastic
Dairy producers in this study reported that they travel an average of 6.83 miles per load to dispose
of their agricultural plastic and make an average of 13.7 trips per year. The median reported trip
length was 0.5 miles while the median number of trips was zero. The low median results for each
of these are due to a high number of zeroes reported for each. These producers indicated that they
spent an average of $391 annually in tipping fees and $18.70 per ton in hauling cost.
If dairy producers had the ability to recycle their agricultural plastic for free, producers in this
study indicated that they would travel 10.41 miles. This suggests that the average dairy producer
would travel no more than an additional four miles to recycle their agricultural plastic at no
charge. Given the option of having a pickup service for their agricultural plastic, dairy producers
indicated that they would pay an average of $134.16 per ton if they had to sort the plastic and
$126.56 per ton if they did not. This average was calculated by eliminating an outlier response
where one producer indicated they would pay $20,000 per ton if a pickup service existed for
sorted agricultural plastic and $10,000 per ton if the plastic did not need sorting. The median
producer indicated that they would pay nothing for a pick-up service whether the plastic required
sorting or not. Examining the data closely shows that one dairy producer in this study responded
that he would pay $1,200 per ton to get rid of his sorted plastic and nothing for unsorted plastic.
Factoring this producer out changes the average willingness to pay for a pickup service to $89.75
per ton for sorted plastic and $131.83 per ton for unsorted plastic.
Most dairy producers in the study who used agricultural plastic indicated that they did not recycle
their agricultural plastic. Twenty-eight percent responded that they recycled their plastic.
Nineteen percent of the producers indicated that they knew of a recycling program for their
plastic inside their county of operation, while 62 percent said that no recycling program was in
their county. When asked if they knew of any recycling facilities that would take their plastic, 38
percent of the producers indicated they did.
Figure 41 provides information on what dairy producers have experienced or perceived as
difficulties with recycling agricultural plastic. The greatest difficulty identified is that recycling
facilities are too far from the dairy producers operation. This result provides additional evidence
that dairy producers do not want to travel far from their operation to get rid of their agricultural
plastic. The next highest difficulties identified were that recycling and transportation are too
costly. It appears in a relative sense that the least perceived difficulties identified in the survey are
too many restrictions and that producers do not have enough product.
Winter
38%
Spring
28%
Summer
10%
Autumn
24%

Contractor’s Report to the Board 64
4
5
10
8
9
0 2 4 6 8 10
Not having enough product
Too many restrictions
Recycling facilities too far
Transportation too costly
Too costly (other than transportation)
Figure 41: Identified Difficulties by Dairy Producers for Recycling Agricultural Plastic
Examining Figure 42 shows that there are two primary incentives that would induce dairy
producers to recycle their agricultural plastic. The response that garnered the highest number at
25 was to offer an on-farm pick-up service. The next highest enticement, which was a distant
second with 18 respondents, was to offer financial assistance. Two incentives had nearly three
times less than the most preferred incentive. These were offering a county collection facility and
offer more recycling facilities. It appears the least important incentive for dairy producers is an
easing of the tonnage requirement.
Figure 42: Incentives for Encouraging Recycling of Agricultural Plastics for Dairy Producers
18
4
7
9
25
9
0 5 10 15 20 25
Offer financial incentives
Ease tonnage requirements
Ease cleaning requirements
Offer more recycling/collection facilities
Offer on-farm plastic pick-up
County collection facility
Results for the Hay Industry
There were 250 producers chosen from the hay industry to participate in this study. Seventy-eight
of these producers provided feedback on their usage of agricultural plastic. Another 90 producers
from the other sampled commodities also indicated that they grew hay. Figure 43 shows how
many producers in each industry sampled produced hay. This group of 168 producers represented
115,874 acres of hay and alfalfa. Sixty-seven of these producers indicated that they used
agricultural plastic in production, while the other 101 producers identified themselves as non-
plastic users. This suggests that nearly 40 percent of hay producers used some form of plastic on
their operation. These plastic users represent 41,137 acres of hay and alfalfa production. Out of
these 67 producers, 39 reported the amount of plastic they discarded. This group indicated that

Contractor’s Report to the Board 65
they disposed of a collective 152,471 pounds, which equates to approximately 3,910 pounds per
producer. The median amount of plastic disposed of per year was 666 pounds. The average yearly
disposal of plastic baling twine is 522 pounds with a median response of 400 pounds. This
equates to an average per acre disposal of 31.80 pounds and a median of 0.23 pounds per acre.
Figure 43: Number of Respondents in Each Industry Growing Hay
Producers in the survey who used agricultural plastic and represented the hay industry were
scattered across 27 counties. Table 13 provides the distribution of these producers across the
different counties they represented. The largest representation of producers was from Merced
County, which had eight hay producers who indicated that they used agricultural plastic. Nine
counties only had one representative, five counties had two representatives, eight counties had
three representatives, and four counties had four representatives.
Table 13: County and Number of Representatives Who Used Agricultural Plastic for the Hay Industry
County # County # County # County #
Alameda 1 Kings 4 Riverside 1 Solano 1
Contra Costa 1 Lassen 2 Sacramento 4 Sonoma 3
Fresno 3 Madera 1 San Joaquin 4 Stanislaus 4
Glenn 3 Merced 8 San Luis Obispo 3 Tehama 2
Humboldt 2 Modoc 1 Santa Clara 1 Tulare 3
Imperial 3 Placer 1 Shasta 2 Yolo 3
Kern 2 Plumas 1 Siskiyou 3
Figure 44 provides the average gross income distribution of the hay producers who used
agricultural plastic. Examining this figure shows that approximately two-thirds of the hay
producers who used agricultural plastic generated an income over $500,000. Another 7 percent
indicated that they made less than $100,000 per year. The average hay producer using agricultural

Contractor’s Report to the Board 66
plastic reported that he spent $13,784 per year on plastic. The median producer only spent $3,456
per year.
Figure 44: Average Gross Income Distribution of Hay Producers Using Agricultural Plastic
There are two types of plastic that hay and alfalfa producers normally used on their operation
according to the results of this study. These are plastic for covering the hay/alfalfa and plastic
twine used for baling. Fifteen producers gave information suggesting they used covering for their
hay and alfalfa, while 39 producers provided either partial or full information on their usage of
plastic baling twine.
There were nine producers out of the 15 that provided the amount of plastic they used for
covering their hay and alfalfa. The average amount used per farm was 43,544 square feet, which
equates to 152 square feet per acre. The median producer reported using 25,000 square feet of
plastic and the median per acre usage was 89 square feet per acre. There were four responses to
the query on the thickness of the plastic utilized for covering. Two producers indicated that they
used six mils plastic, while one producer reported using eight mils plastic and another reported
using two mils plastic. Six producers indicated the amount of plastic covering they disposed of
per year. The average amount per farm was 2,651 pounds and the median was 833 pounds. On a
per-acre basis, the average disposal was 20.65 pounds and the median disposal was 0.53 pounds.
There were 12 producers who indicated the frequency of disposal of this plastic. These responses
ranged from monthly to every 3.5 years. The most common response by these producers was
yearly. This response garnered five producers. Other responses given were every two, six, ten, 24,
and 36 months.
Plastic baling twine received a much higher response on usage than haystack coverings. Out of
the 39 producers who indicated that they used agricultural plastic, 20 of these producers provided
information on the amount of baling twine used. The average amount of plastic baling twine used
per farm was 563,076 linear feet. On a per-acre basis, the amount of twine used was 1,051 linear
feet. The median producer reported using an average of 55,500 linear feet per farm and 481 linear
feet per acre. A larger group, 28 producers, reported the amount of baling twine they disposed of
on a yearly basis. This group reported disposing of an average 4,570 pounds of plastic per farm
and 31 pounds per acre. The median producer indicated that he disposed 22.5 pounds of plastic
per farm and 0.23 pounds of plastic per acre. The frequency of disposal ranged from one month to
two years. Ten producers indicated they disposed of their baling twine on a monthly basis, three
Over
$1,000,000
45%
$500,000 -
$1,000,000
21%
$250,000 -
$499,999
15%
Under $100,000
7% $100,000 -
$249,999
12%

Contractor’s Report to the Board 67
producers reported disposing of this plastic every six months, nine producers indicated annual
disposal, and one producer reported disposal of plastic baling twine every two years.
Figure 45 provides the primary season that hay producers disposed of the largest volume of their
agricultural plastic. At 37 percent, autumn was the season that hay producers discarded the largest
volume of their plastic. This was followed by summer at 27 percent and spring at 22 percent. The
season with the least percentage of disposal was winter. Examining how these producers
eliminated their agricultural plastic reveals that 35 producers took their plastic to a landfill, while
15 producers took their plastic to a recycling collection facility. In addition, one producer
reported that he buried his plastic, while two others indicated that they burned it.
Figure 45: Primary Season Hay Producers Disposed of Their Agricultural Plastic
Hay producers on average traveled 9.38 miles to dispose of their agricultural plastic making an
average of 6.31 trips. One of the producers indicated that he makes 300 trips per year. Factoring
this potential outlier out gives an average of 1.42 trips per year. The median hay producer
reported traveling eight miles to dispose of his agricultural plastic and making zero trips per year.
Hay producers reported spending $277 on tipping fees per year to dispose of their plastic and
$177 per ton to haul that plastic to the landfill.
Hay producers in this study indicated that they would travel 22.7 miles if they could dispose of
their agricultural plastic at no charge. The median producer would travel 15 miles to recycle
agricultural plastic for free. Hay producers indicated that they would pay $54 per ton if a pick-up
service existed for their agricultural plastic and they had to sort the plastic, if they do not have to
sort the plastic, they are willing to pay $79 per ton for a pick-up service.
When asked whether they recycled their agricultural plastic, 15 producers indicated that they did
recycle some of their plastic. A vast majority of the producers, 51 of them, reported that they do
not recycle their agricultural plastic. Fifteen producers knew of a recycling program for
agricultural plastics in their county and 20 producers indicated that they knew of a recycling
facility that would take their agricultural plastic. There were 28 producers who indicated that
there was no recycling program in their county, while 23 were not sure.
Figure 46 provides the identified difficulties either experienced or perceived by hay producers for
recycling their agricultural plastic. The biggest difficulty identified is that the recycling facilities
are too far from the producers operation. This response garnered 21 producers which is nearly
double the next closest response. Interestingly, the four other difficulties that were reported by the
Winter
14%
Spring
22%
Summer
27%
Autumn
37%

Contractor’s Report to the Board 68
producers had approximately the same number of responses with a difference of no larger than
two responses. This suggests that hay producers perceive these difficulties as roughly equivalent
to each other.
Figure 46: Identified Difficulties by Hay Producers for Recycling Agricultural Plastic
Incentives that encourage hay producers to participate in recycling their agricultural plastic were
examined. The preferred incentive is offering producers a pick-up service for their agricultural
plastic. This response (see Figure 47) achieved nearly double the next highest incentive, offering
additional recycling facilities. Close to this second highest incentive, 19 producers identified that
offering financial incentives would encourage them to participate in a recycling program. The
least encouraging incentives of the ones presented are easing the tonnage restrictions and the
cleaning requirements.
Figure 47: Incentives for Encouraging Recycling of Agricultural Plastics for Hay Producers
19
8
9
21
40
11
0 5 10 15 20 25 30 35 40
Offer financial incentives
Ease tonnage requirements
Ease cleaning requirements
Offer more recycling/collection facilities
Offer on-farm plastic pick-up
County collection facility
Results for the Greenhouse Industry
A sample size of 300 producers was drawn for the greenhouse industry of which 58 producers
returned information. A berry producer, one tomato producer, one hay producer, two pepper
producers, three melon producers, and 28 nursery producers from the other samples reported they
10
12
21
12
11
0 5 10 15 20 25
Not having enough product
Too many restrictions
Recycling facilities too far
Transportation too costly
Too costly (other than transportation)

Contractor’s Report to the Board 69
also participated in the greenhouse industry; this brings the total response to 93. Producers were
asked to identify either how many acres they are producing on or the square footage of their
facilities. There were 38 producers who indicated their production on a per-acre basis. This group
represents 747 acres of greenhouses and horticultural crops. Another 56 producers reported their
production on a square foot basis. These producers reported the usage of 7,214,499 square feet of
greenhouses and horticultural crops. Out of the 94 producers who indicated they operated in the
greenhouse industry, 71 reported that they used agricultural plastic, while the remainder indicated
that they did not use agricultural plastic. This suggests that over 75 percent of the greenhouse
producers in the study utilized some form of agricultural plastic. Table 14 provides information
on what counties are represented by these agricultural plastic users. The largest representation
came from San Diego, Monterey, and Santa Barbara counties. San Diego had 12 representatives,
while Monterey and Santa Barbara each had eight.
Table 14: County and Number of Representatives Who Used Agricultural Plastic for the Greenhouse Industry
County # County # County # County #
Fresno 2 Napa 1 San Joaquin 2 Shasta 1
Kern 1 Orange 1 San Luis Obispo 3 Sonoma 5
Los Angeles 3 Riverside 3 San Mateo 5 Stanislaus 1
Madera 1 Sacramento 1 Santa Barbara 8 Tulare 1
Mendocino 1 San Bernardino 1 Santa Clara 4 Ventura 3
Monterey 8 San Diego 12 Santa Cruz 1 Yolo 2
Figure 48 provides the distribution of income for the producers in the greenhouse industry who
used agricultural plastic. Sixty percent of the producers indicated an average gross income greater
than a $500,000. While the survey attempted to obtain information from producers who earned
over $100,000, the sample of agricultural plastic users in the greenhouse industry contained a
group of producers who earned less than this amount. Out of the 71 producers who reported their
average gross income information, 59 of these producers provided information on how much
money they spent every year on agricultural plastic. This group as a whole reported spending
$2,999,366, which equates to approximately $50,837 per farm. At $8,000, the median producer
spent a much smaller amount than the average producer.
Figure 48: Average Gross Income Distribution of Greenhouse Producers Using Agricultural Plastic
Over $1,000,000
47%
$100,000 -
$249,999
17%
Under $100,000
10%
$250,000 -
$499,999
13%
$500,000 -
$1,000,000
13%

Contractor’s Report to the Board 70
The greenhouse industry used a wide range of agricultural plastic. The plastic that is used for
greenhouses is categorized into two general areas—a) containers and b) plastic used for hoop
houses, tunnel houses and greenhouses. Since producers reported their operations in terms of
acres or square feet, all results are presented on a per farm basis.
Table 15 provides the average and median usage of plastic containers by greenhouse producers.
Also presented in this table is the number of producers who reported a value for the
corresponding container. The container types that had the highest number of respondents were the
trays/flats, while the ten-gallon container had the fewest respondents. The average count on the
number of containers ranged from 2,407 for the ten-gallon containers to 142,275 for the one-
gallon containers. The median count ranged from a low of 1,000 up to a high of 35,000. The
median usage was at least half the quantity of the average, suggesting there are a few large
producers who used the bulk of the containers.
Table 15: Average and Median Usage of Plastic Containers by Greenhouse Producers
Use/Type of Plastic Average Median Number Reporting
6-Pack Containers 84,679 35,000 12
Trays/Flats 131,514 4,000 32
1 Gallon Containers 142,275 27,500 28
2 Gallon Containers 30,700 4,000 14
3 Gallon Containers 27,250 12,500 6
5 Gallon Containers 41,579 5,000 23
10 Gallon Containers 2,407 1,000 5
15 Gallon Containers 4,057 1,400 17
While the count of each type of plastic given in the previous table is useful information, the more
valuable information for this study is found in Table 16 below. This table presents the average
and median disposal of each type of plastic container on a per-pound basis. This table also
contains the number of producers who provided information on the removal of each of the
containers, as well as the number of zeros reported. The containers that had the highest average
disposal rates were trays/flats. Producers in the greenhouse industry reported that they discarded
these containers on average of 2,228 pounds per year. The second highest average occurred for
the three-gallon containers. This result is misleading because there were only two large producers
who indicated their disposal weight on this item. One producer indicated that he discarded 500
pounds of plastic, while the other producer indicated a disposal of ten pounds. The three-gallon
container also had the highest median value but is problematic for the above stated reasons. The
second highest median disposal occurred with the trays/flats. Similar to the previous table the
median reported value is smaller than the average. Excluding the three-gallon containers, the
median is no more than a third of the average, which suggests that there are a few large producers
who dominated the results.

Contractor’s Report to the Board 71
Table 16: Average and Median Disposal in Pounds of Plastic Containers by Greenhouse Producers
Use/Type of Plastic Average Median Number
Reporting Number
Reporting 0’s
6-Pack Containers 35.89 3.00 9 4
Trays/Flats 2,228.63 62.50 24 9
1 Gallon Containers 793.95 40.00 19 6
2 Gallon Containers 20.00 0.00 8 5
3 Gallon Containers 255.00 255.00 2 0
5 Gallon Containers 53.88 17.50 16 6
10 Gallon Containers 132.50 15.00 4 1
15 Gallon Containers 42.27 0.00 11 6
Beyond the plastic containers, the greenhouse industry reported two other types of plastic used
and discarded. There were 12 producers who reported using 9,249,777 square feet of plastic for
hoop houses and tunnel coverings. This equated to an average of 770,815 square feet per
producer. This value is highly skewed due to one producer reporting that he used 6,534,000
square feet of plastic for this purpose on his operation. The median producer reported using
42,500 square feet. Half the producers indicated they used six mils plastic for this purpose, while
two producers indicated that they used four mils plastic. The other thicknesses reported were two
and three mil plastic. The average disposal amount per year for this type of plastic was 5,390
pounds, while the median producer reported eliminating 200 pounds of plastic. Note that only
five producers reported the amount of plastic that they disposed.
The other type of plastic reported beyond the plastic containers was greenhouse plastic. Thirty-
nine producers indicated that they used 3,201,550 square feet of this plastic. This equates to
82,091 square feet of plastic per producer per year. The median plastic usage for this type was
30,000 pounds. Thirty-one producers reported that the thickness of this plastic was six mils; four
producers reported four mils plastic, and one producer used eight mils plastic. The average annual
amount of this plastic disposal is calculated at 11,480 pounds. The median producer indicated that
he disposed 300 pounds of plastic per year.
Table 17 provides information on how often greenhouse producers disposed of their agricultural
plastic. The table shows that many producers cluster around the monthly and yearly disposal time
periods. Another cluster of producers reported 0 months for the frequency of disposal. This
response may represent producers who sell their product in a plastic container to a customer and
do not view this as a discard. Another result to notice in the table is that the use of greenhouse
plastic and hoop/tunnel coverings were discarded on a yearly basis or longer.

Contractor’s Report to the Board 72
Table 17: Number of Greenhouse Producers Who Identified the Number of Months Disposal for Each Type of Plastic They Used
Type of Plastic
Frequency of Disposal in Months
0 1 3 6 10 12 24 36 48 54 60 72
6-Pack Containers 4 2 0 2 0 1 0 0 0 0 0 0
Trays/Flats 9 6 5 2 0 4 0 1 0 0 0 0
1-Gallon Containers 6 3 1 2 1 8 0 1 0 0 0 0
2-Gallon Containers 4 2 0 1 0 2 0 0 0 0 0 0
3-Gallon Containers 0 1 1 1 0 2 0 0 0 0 0 0
5-Gallon Containers 6 3 1 1 1 6 0 0 0 0 0 0
10-Gallon Containers 1 0 0 0 0 3 0 0 0 0 0 0
15-Gallon Containers 6 1 1 1 0 4 0 0 0 0 0 0
Hoop/Tunnel House Covering 0 0 0 1 0 5 2 3 1 0 0 0
Greenhouse Plastic 3 3 1 1 0 15 1 5 5 1 4 1
Figure 49 provides information on the season that greenhouse producers remove their largest
volume of agricultural plastic. The period that had the highest percentage of greenhouse
producers discarding their plastic was autumn. This season garnered 42 percent of the greenhouse
producers who used agricultural plastic. Summer was next, which had 25 percent of the producers
indicating this season as the primary removal time. Winter had the lowest percentage of
producers with 14 percent of the greenhouse producers preferring this term to eliminate the
highest volume of agricultural plastic. The typical method for getting rid of plastic for these
producers is taking the agricultural plastic to a landfill. While 46 producers indicated that they
used a landfill to dispose of their plastic, 17 producers reported that they eliminated their plastic
by taking it to a recycling facility. One person identified that he buried his plastic as a method of
disposal.
Figure 49: Primary Season Greenhouse Producers Disposed of Their Agricultural Plastic
There were 44 producers who indicated how many pounds of plastic they disposed of per year.
As a whole, this group reported discarding 298,870 pounds of plastic per year. This equated to an
average removal per farm of 6,793 pounds annually. The median producer reported that he
Winter
14%
Spring
19%
Summer
25%
Autumn
42%
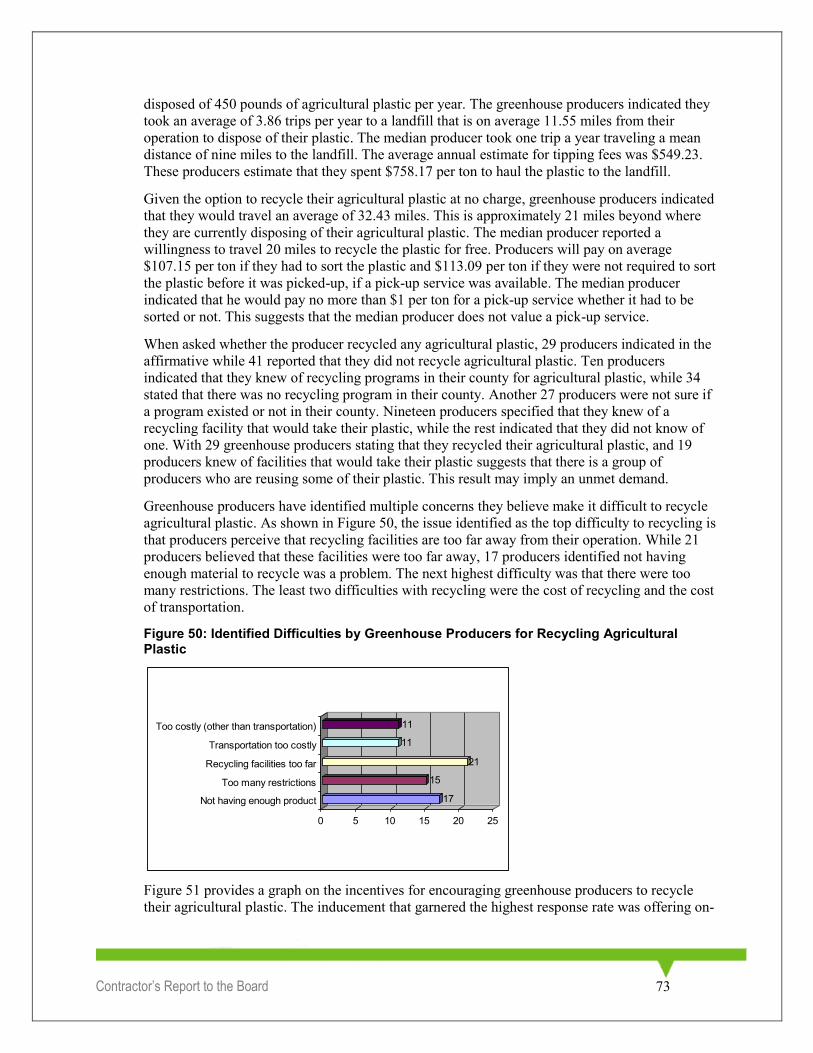
Contractor’s Report to the Board 73
disposed of 450 pounds of agricultural plastic per year. The greenhouse producers indicated they
took an average of 3.86 trips per year to a landfill that is on average 11.55 miles from their
operation to dispose of their plastic. The median producer took one trip a year traveling a mean
distance of nine miles to the landfill. The average annual estimate for tipping fees was $549.23.
These producers estimate that they spent $758.17 per ton to haul the plastic to the landfill.
Given the option to recycle their agricultural plastic at no charge, greenhouse producers indicated
that they would travel an average of 32.43 miles. This is approximately 21 miles beyond where
they are currently disposing of their agricultural plastic. The median producer reported a
willingness to travel 20 miles to recycle the plastic for free. Producers will pay on average
$107.15 per ton if they had to sort the plastic and $113.09 per ton if they were not required to sort
the plastic before it was picked-up, if a pick-up service was available. The median producer
indicated that he would pay no more than $1 per ton for a pick-up service whether it had to be
sorted or not. This suggests that the median producer does not value a pick-up service.
When asked whether the producer recycled any agricultural plastic, 29 producers indicated in the
affirmative while 41 reported that they did not recycle agricultural plastic. Ten producers
indicated that they knew of recycling programs in their county for agricultural plastic, while 34
stated that there was no recycling program in their county. Another 27 producers were not sure if
a program existed or not in their county. Nineteen producers specified that they knew of a
recycling facility that would take their plastic, while the rest indicated that they did not know of
one. With 29 greenhouse producers stating that they recycled their agricultural plastic, and 19
producers knew of facilities that would take their plastic suggests that there is a group of
producers who are reusing some of their plastic. This result may imply an unmet demand.
Greenhouse producers have identified multiple concerns they believe make it difficult to recycle
agricultural plastic. As shown in Figure 50, the issue identified as the top difficulty to recycling is
that producers perceive that recycling facilities are too far away from their operation. While 21
producers believed that these facilities were too far away, 17 producers identified not having
enough material to recycle was a problem. The next highest difficulty was that there were too
many restrictions. The least two difficulties with recycling were the cost of recycling and the cost
of transportation.
Figure 50: Identified Difficulties by Greenhouse Producers for Recycling Agricultural Plastic
Figure 51 provides a graph on the incentives for encouraging greenhouse producers to recycle
their agricultural plastic. The inducement that garnered the highest response rate was offering on-
17
15
21
11
11
0 5 10 15 20 25
Not having enough product
Too many restrictions
Recycling facilities too far
Transportation too costly
Too costly (other than transportation)

Contractor’s Report to the Board 74
farm pick-up services. Thirty-five producers indicated that this would encourage them to recycle.
Following the pick-up service response was proposing county collection facilities. While offering
county collection facilities had 26 responses, offering additional collection facilities was a close
third at 25 responses. The previous results showed that the lowest ranked incentive is easing the
tonnage requirements.
Figure 51: Incentives for Encouraging Recycling of Agricultural Plastics for Greenhouse Producers
20
14
17
25
35
26
0 5 10 15 20 25 30 35
Offer financial incentives
Ease tonnage requirements
Ease cleaning requirements
Offer more recycling/collection facilities
Offer on-farm plastic pick-up
County collection facility
Results for the Nursery Industry
Three hundred nursery producers were sent a survey on their usage of agricultural plastic. Out of
this group, 84 producers returned information regarding the survey. One pepper producer and one
melon producer each indicated that they also produced in the nursery industry. Two producers in
the grape industry and 66 producers in the greenhouse industry also indicated that they produced
in the nursery industry. This group, like the greenhouse producers, was asked to indicate either
how many acres they utilized or the square footage of their facilities. There were 113 producers
who indicated their production in terms of acres, while 41 producers reported their production in
terms of square footage. The group that reported on an acreage basis represent 12,340 acres. The
producers who reported by the square foot indicated they used 2,676,227 square feet.
Out of the 154 producers who indicated they were in the nursery industry, 107 producers reported
using agricultural plastic, while the remainder responded that they did not use agricultural plastic.
This represents a participation rate of over 69 percent of nursery producers using agricultural
plastic. Table 18 provides a distribution of nursery producers across the different counties in
California who used agricultural plastic. Twenty-eight counties stretching the entire length of the
state had producers who indicated plastic usage. Two counties, Los Angeles and San Diego, made
up nearly one-fourth of the representation of the nursery producers.

Contractor’s Report to the Board 75
Over
$1,000,000
38%
$500,000 -
$1,000,000
16%
$250,000 -
$499,999
12%
Under
$100,000
22%
$100,000 -
$249,999
12%
Table 18: County and Number of Representatives Who Used Agricultural Plastic for the Nursery Industry
County # County # County # County #
Butte 2 Monterey 7 San Bernardino 2 Shasta 3
Del Norte 1 Napa 1 San Diego 17 Siskiyou 2
Fresno 5 Orange 3 San Joaquin 4 Sonoma 6
Lake 1 Placer 1 San Mateo 2 Stanislaus 1
Los Angeles 10 Riverside 4 Santa Barbara 6 Sutter 1
Madera 2 Sacramento 4 Santa Clara 6 Tulare 2
Mendocino 3 San Benito 1 Santa Cruz 6 Ventura 4
The average gross income distribution of the agricultural plastic users in the nursery industry is
represented in Figure 52. Thirty-eight percent of these producers indicated that they have an
average gross income over $1,000,000. Another 16 percent reported an income between $500,000
and $1,000,000. While the sample was primarily intended for those producers who earned over
$100,000, 22 percent of the nursery producers who used agricultural plastic indicated that they
had an average gross income under $100,000. Examining the plastic purchasing of these
producers demonstrates that the average nursery spent approximately $65,816 per year and
discarded 2,874 pounds of agricultural plastic annually. The median nursery spent $6,000
annually and disposed of 200 pounds of plastic per year.
Figure 52: Average Gross Income Distribution of Nursery Producers Using Agricultural Plastic
Similar to the greenhouse industry, the nursery industry uses a variety of agricultural plastics.
Table 19 provides the primary types of plastic containers that the nursery industry used on a per-
count basis. This table also has the number of producers who reported using each type of plastic
in the survey. There were seven producers that reported using ten-gallon containers, which had
the lowest number of respondents. Fifty-seven producers reported using one-gallon containers,
which was the highest number of respondents. Trays and flats had the highest average yearly
usage at 295,007 containers. The median producer’s highest usage on a quantity basis was six-
pack containers. The least used item by both the average and median producer was the ten-gallon
containers. Comparing the median to the average shows that the median producer used a much
smaller quantity of each item than the average producer. Examining the ratio of average to

Contractor’s Report to the Board 76
median usage shows there is a 2.5:1 ratio for the three-gallon containers, while the trays/flats
have a ratio of 118:1. This suggests the nursery industry has a group that is pulling the average
above the median.
Table 19: Average and Median Usage of Plastic Containers by Nursery Producers
Use/Type of Plastic Average Median Number Reporting
6-Pack Containers 137,157 19,000 20
Trays/Flats 295,007 2,500 38
1-Gallon Containers 217,381 10,000 57
2-Gallon Containers 17,744 2,000 18
3-Gallon Containers 43,750 17,500 10
5-Gallon Containers 224,190 5,500 48
10-Gallon Containers 1,748 500 7
15-Gallon Containers 29,632 2,500 43
Table 20 shows how much agricultural plastic is disposed of by type. There was a range of five to
40 producers who provided specific information on each type of plastic. Trays and flats
represented the type of plastic that had the highest amount disposed of on a yearly basis.
Producers in the nursery industry reported that they removed approximately 549 pounds of this
type of plastic. The 15-gallon container had the lowest average weight of disposal at 19 pounds.
The median disposal weight had a much tighter distribution of values. These ranged from 1.5
pounds to 12.5 pounds with most of the median values reported at ten pounds. Approximately
one-third to one-half of the producers responding to this question indicated that they did not
dispose of any of these containers. This represents the group of producers who sold the container
as a package to the product and does not require disposal by the producer.
Table 20: Average and Median Disposal in Pounds of Plastic Containers by Nursery Producers
Use/Type of Plastic Average Median Number
Reporting Number
Reporting 0’s
6-Pack Containers 211.18 3.00 11 5
Trays/Flats 549.12 10.00 26 11
1 Gallon Containers 525.33 12.50 40 13
2 Gallon Containers 21.67 10.00 9 4
3 Gallon Containers 105.00 10.00 5 2
5 Gallon Containers 76.50 10.00 30 11
10 Gallon Containers 90.00 10.00 6 2
15 Gallon Containers 19.15 1.50 26 13
The other two types of plastic reported by the nursery producers, which are not represented in the
previous table, are hoop/tunnel house covering plastic and greenhouse plastic. There were 16
producers who reported how much hoop/tunnel house covering plastic they used. These
producers reported using an average of 50,950 square feet of this plastic, while the median

Contractor’s Report to the Board 77
producer reported 5,500 square feet of plastic. The typical thickness of this plastic as reported by
ten producers was six mils. Other thicknesses reported were one, two and four mils. Out of these
16 producers, 13 indicated the amount of plastic that they disposed. The average amount reported
was 9,481 pounds. This value was greatly influenced by two producers who reported removing
94,000 and 26,000 pounds of plastic from their operation. The median producer reported
eliminating 400 pounds of this plastic on an annual basis.
There were more nursery producers that reported using greenhouse plastic than the hoop/tunnel
house covering plastic. Thirty-four producers reported using an average of 79,109 square feet of
greenhouse plastic. The median producers stated that they used 12,500 square feet of this plastic.
There were 24 producers who indicated that the thickness of this plastic was six mils. Five
producers reported using four mils plastic, while two producers indicated two mils plastic. Other
values given for thickness were eight, ten, and 30 mils. Out of the 34 nursery producers who gave
information regarding the quantity of greenhouse plastic they used, 16 producers reported the
amount of greenhouse plastic they removed yearly. The average producer indicated disposing of
8,210 pounds of this plastic on an annual basis, while the median producer reported 200 pounds.
Table 21 below provides a look at the frequency that nursery producers disposed of each type of
agricultural plastic they used. These occurrences ranged from zero to 72 months. The two
frequencies that many producers gravitated towards were zero and 12 months. Hoop/tunnel house
coverings and greenhouse plastic had producers indicating 36 months or longer for disposal.
Every other type of plastic was removed more frequently.
Table 21: Number of Nursery Producers Who Identified the Number of Months Disposal for Each Type of Plastic They Use
Type of Plastic
Frequency of Disposal in Months
0 1 2 3 6 10 12 15 24 36 48 54 60 72
6-Pack Containers 5 3 1 1 3 0 2 0 0 0 0 0 0 0
Trays/Flats 11 5 1 2 3 0 8 0 1 0 0 0 0 0
1 Gallon Containers 13 5 1 1 4 1 19 0 1 0 0 0 0 0
2 Gallon Containers 3 2 1 1 3 0 3 0 1 0 0 0 0 0
3 Gallon Containers 2 1 0 0 1 0 3 0 1 0 0 0 0 0
5 Gallon Containers 11 5 0 2 2 1 12 1 1 0 0 0 0 0
10 Gallon Containers 2 0 0 1 1 0 3 0 0 0 0 0 0 0
15 Gallon Containers 13 3 0 2 2 0 10 1 1 0 0 0 0 0
Hoop/Tunnel House Covering 0 0 0 0 2 0 12 0 0 3 1 0 0 0
Greenhouse Plastic 2 3 0 1 2 0 9 0 2 3 4 2 4 1
While the previous table presented the rate of disposal for each type of plastic that nursery
producers used, Figure 53 shows the primary season nursery producers removed their largest
volume of plastic. Thirty-seven percent of these producers reported spring as the time they got rid
of the largest volume of agricultural plastic. Autumn and summer had 26 percent and 22 percent
of producers, respectively, indicating these seasons as the disposal period for their plastic. The
average producer reported disposing approximately 2,873 pounds of plastic yearly, while the
median producer reported disposing 200 pounds of plastic per year. This plastic was taken to a

Contractor’s Report to the Board 78
landfill by 51 producers; however, two producers reported taking their plastic to a recycling
facility.
Figure 53: Primary Season Nursery Producers Disposed of Their Agricultural Plastic
There were 90 nursery producers who provided information on the distance they traveled to a
landfill for their agricultural plastic, while 96 producers indicated the number of trips they made
annually to remove their agricultural plastic. Nursery producers reported that they traveled an
average of 9.16 miles to a landfill and made approximately 3.90 trips per year to discard the
plastic. The median producer traveled five miles to get rid of agricultural plastic making only one
trip per year. Eighty-four producers reported spending an average of $594 annually in tipping
fees, while the median producer spent $27.50 a year. Eighty-one producers indicated that the
hauling costs, which excluded tipping fees to get their agricultural plastic to a landfill, were $559
per ton. The median producer reported paying no hauling costs.
When producers were asked how far they would travel if they could recycle their agricultural
plastic at no charge, the average nursery producer reported 28.06 miles, while the median
producer indicated 15 miles. The average nursery producer would pay approximately $100 per
ton if the plastic was sorted and$160 per ton if the plastic did not require sorting, if a recycling
pick-up service came to take the plastic. The median producer reported a willingness to pay less
than $1 per ton whether or not he had to sort the plastic. This suggests that the median producer
does not seem to value a recycling pick-up service.
There were 49 producers indicating that they recycle their agricultural plastic. This represents 46
percent of the producers stating that they recycle some portion of their agricultural plastic.
Twenty-two producers knew about recycling facilities for agricultural plastic in their county,
while 27 producers knew of a recycling facility that would take their agricultural plastic. Fifty
nursery producers described that there was no recycling program for agricultural plastics in their
county. Another 35 producers did not know whether or not a recycling facility for agricultural
plastic existed in their county. Eighty producers did not know of a recycling facility that would
take their agricultural plastic.
Figure 54 provides information on nursery producers’ actual and perceived difficulties with
recycling their agricultural plastic. This figure demonstrates that the difficulties presented to
producers received approximately the same number of responses. The item that garnered the
highest number of responses at 32 was there are too many restrictions to recycling agricultural
plastic. The second highest indication was that recycling facilities were too far from the
Winter
15%
Spring
37%Summer
22%
Autumn
26%

Contractor’s Report to the Board 79
producer’s operation. This result garnered 27 respondents. The item receiving the lowest response
was that transportation was too costly to take the plastic to a recycling facility.
Figure 54: Identified Difficulties by Nursery Producers for Recycling Agricultural Plastic
The incentives that would
encourage nursery producers to recycle their agricultural plastic are presented in Figure 55 below.
The incentive that gathered the highest response rate was offering an on-farm pick-up service.
This result had 52 producers. The next best result was offering more collection facilities. While
44 producers reported they would like more collection facilities, 38 producers indicated that
having a county collection facility would promote recycling. The item that received the least
responses from producers was easing tonnage restrictions. Offering financial incentives ranked as
the fourth best way to persuade nursery producers to recycle.
Figure 55: Incentives for Encouraging Recycling of Agricultural Plastics for Nursery Producers
33
23
32
44
52
38
0 10 20 30 40 50 60
Offer financial incentives
Ease tonnage requirements
Ease cleaning requirements
Offer more recycling/collection facilities
Offer on-farm plastic pick-up
County collection facility
26
32
27
24
25
0 5 10 15 20 25 30 35
Not having enough product
Too many restrictions
Recycling facilities too far
Transportation too costly
Too costly (other than transportation)

Contractor’s Report to the Board 80
Estimated Annual Disposal of Agricultural Plastics for California
There are three primary approaches for estimating the amount of agricultural plastic that is
disposed of annually in California using the data set acquired for this study. The first estimate
takes the average per-farm disposal of agricultural plastic and multiplies it by the number of
farms in California. The second approach takes into account that farms are not uniform and that
the survey represents the farms that produce a majority of the agricultural product in the state.
The third approach takes into account that different industries use agricultural plastic with
different intensities. To make an estimate of the amount of agricultural plastic that is disposed of
yearly, an approximation is generated regarding the quantity that is discarded by each industry.
A First Estimate of Agricultural Plastic Disposal: All Farms are Equal
This estimate starts with the assumptions that: 1) all size farms in California use agricultural
plastic on average in a uniform fashion; 2) the information represented in the survey is indicative
of the average producer; and 3) the percentage of producers who reported using plastic represents
the agricultural population. Using these assumptions provides an unrealistic estimate of
agricultural plastic disposal in the state totaling 198,289 tons per year. Based on the survey, this is
the upper extreme of how much agricultural plastic is annually discarded in the state by
producers; it is also an unlikely depiction of the actual situation. The reason this is considered an
off-base estimate is that 96 percent of agricultural gross income is generated by less than 25
percent of the farms in California (2002 Agricultural Census).
This value was developed by multiplying the number of farms in California in 2005 (documented
by CDFA, (2006)) by the percentage of producers in the survey reported using agricultural
plastic. This amount was multiplied by the average disposal per farm as stated in the survey. The
estimate for the disposal is 8,705.6 tons per year if the median producer is used rather than the
average producer. This amount of disposal is also unlikely and highlights that California farm
production is partial to the large producer.
A Second Estimate of Agricultural Plastic Disposal: Accounting for Farm Size
A better estimate of how much agricultural plastic is disposed of in the state takes into account
that the survey represents the larger producers who generate over $100,000 in gross income
annually. According to the 2002 California Agricultural Census, this group represents
approximately 24.6 percent of the producers and generates approximately 96 percent of the farm
gross income. The producers that earn less than $100,000 in income represent a negligible
amount of agricultural plastic disposal. The estimated amount of agricultural plastic disposed is
48,768 tons per year.
This refinement improves the estimate, but the drawback assumes that producers dispose of a
uniform amount of plastic. This assumption suggests that a strawberry producer on average
disposes the same amount of agricultural plastic as an orchard producer. This is unlikely given
how each of these producers use agricultural plastic; one for mulching purposes and the other for
irrigation purposes. Results from this study emphasize that the assumption of uniform usage
across industry is not valid.

Contractor’s Report to the Board 81
A Third Estimate of Agricultural Plastic Disposal: Accounting for Non-Uniformity in Plastic Usage by Industry
The best estimate of agricultural plastic disposal takes into account that producers use and dispose
of this plastic at different rates. The base unit of production and distribution, e.g., acres, number
of cows, square feet, etc. was taken into consideration. Information was examined at the industry
level and a three-step process was undertaken. The first step developed an estimate of the average
usage for each industry. The next step multiplied the average usage by the total production units
for the industry of interest. The last step summed together all of the industries disposal amounts
to get a total amount for the state.
The first step in this process was developing an assessment of the amount of plastic that is
discarded by each producer in a particular industry. There were two sources of disposal
information. The first source came from sections two through four of the survey, where producers
were asked to provide the amount of each plastic type they disposed of on a yearly basis. The
plastic disposal was estimated with the sum of the responses for each type of plastic. This sum
represents the total amount of plastic disposed of for a particular industry. One major issue with
this data is that many producers did not provide adequate information, thereby providing a poor
representation.
The second source of disposal information came from section five in the survey where producers
were asked to indicate how much agricultural plastic their operations disposed of on a yearly
basis. This question had a much higher response rate than the previous questions regarding the
disposal of each particular type of plastic. At first glance, it seems natural to use this value as the
estimation for the farm. The problem with using this value is that some farms produce multiple
crops that use plastic. Hence, if this number was used for those producers who produce in
multiple industries, then the amount of plastic being disposed of would be an overstatement. To
handle this issue, the total plastic disposal by the multiple crop producers was dropped from this
estimation and was replaced with information received in sections two through four if it existed.
Once a value was developed from each of these sources of information, a comparison was made
between the values. A value for two potential sources was used as the estimate for that particular
producer. Producers with multiple enterprises would have only one value from both sources of
disposal information. Theoretically the producers who participated in multiple industries should
have information about the amount of plastic disposal from the first source of information equal
to the amount reported in the second source. This was not always so, in which case the amount
chosen was the larger of the two sources of information.
Each producer was assigned a value for the amount of agricultural plastic disposed, then the
amount was divided by the number of acres, cows, or square feet the operation reported. The unit
chosen depended on the industry of interest. This unit was multiplied by the total that CDFA
(2006) had reported for 2005 production levels in California. The nursery and greenhouse
industries’ producers had the option to report their size by square feet or acres. This information
was not found in CDFA’s statistics, so the 2002 Agricultural Census information was used
instead. It was necessary to account for the difference in the years the data was collected for
CDFA and the 2002 Agricultural Census. Participation rates in utilizing agricultural plastic was
calculated for each industry and used in the estimation. A calculation was then made regarding
how much plastic is disposed per year for each industry of interest.
The strawberry industry represented a unique challenge in obtaining an accurate figure on the
amount of agricultural plastic that is disposed since the industry uses fumigation plastic which is

Contractor’s Report to the Board 82
usually handled by an outside vendor. The estimation of how much fumigation plastic is used and
disposed relied on the assumption that the amount of this plastic disposal was equal to the amount
of mulch plastic that was discarded. An estimation was made from the percentage of total
agricultural plastic disposal to derive the amount of plastic mulch that was discarded. This
estimation was made using disposal information for the strawberry industry from section four. It
was estimated that 62.3 percent of the total agricultural plastic disposal is from mulch plastic.
This percentage was multiplied by the total disposal to obtain how much fumigation plastic was
discarded.
Another challenge was that the orchard and other vegetable industries did not have specific
commodity information for the agricultural plastic that was used. Table 22 details the trees and
crops that were produced for orchard and other vegetable industries. Some of the commodities
represented in the calculation of each industry may not utilize agricultural plastic. Recognizing
this, the estimate obtained for these industries’ disposal rate is high.
Table 22: Commodities Used to Estimate the Amount of Plastic Disposal for the Orchard and Other Vegetables Industries
Commodity Used For Orchards Commodity Used For Other Vegetables
Almonds Grapefruit Pears Artichokes Cauliflower Onions
Apples Kiwi Pecans Asparagus Celery Pumpkins
Apricots Lemons Pistachios Beans Corn Spinach
Avocados Nectarines Plums Broccoli Cucumbers Squash
Cherries Olives Plums-dried Cabbage Garlic Other vegetables
Dates Oranges Tangerines et al. Carrots Lettuce
Figs Peaches Walnuts
One of the key assumptions of this estimate is that the sample is indicative of the average
population. The estimates given in this section do not necessarily represent the total usage of
agricultural plastic in the state. The focus of this study was to examine the industries that were the
largest users of agricultural plastic with a focus on producers who earn an average gross income
above $100,000. This suggests that there are some farms that utilize a relatively small amount of
agricultural plastic on their operations. It is expected that these industries do not represent an
appreciable amount of plastic.
Table 23 provides the estimated amount of agricultural plastic disposed of per year by the
industries in this study. These values represent the best estimate given the data from the survey.
This table shows that as a group the agricultural industries represented in this study are estimated
to dispose approximately 55,507 tons of agricultural plastic annually. The estimate is based on the
average producer’s responses to the survey. Basing an estimate on the media producers results
provides an estimate of 21,015 tons annually. Both the average and the median estimate using
industry specific data increase the assessment of plastic disposal in comparison to the second
approach. The industry average is approximately 6,738 tons greater than the non-industry specific
information. The difference between the two median figures is over 12,300 tons, which
establishes the importance of accounting for industry differences when examining plastic
disposal.

Contractor’s Report to the Board 83
Table 23: Estimated Tonnage of Agricultural Plastic Disposed of on a Yearly Basis by Industry
Industry
Tons of Agricultural Plastic Disposed of Annually
Estimate Based on Average Producer
Estimate Based on Median Producer
Other Vegetables 12,194.29 4,101.06
Greenhouse and Nursery 11,799.81 927.21
Strawberries with Fumigation Plastic 10,484.31 9,555.00
Dairy 7,902.53 1,185.21
Orchards 4,544.79 51.55
Tomatoes 4,196.70 2,653.45
Hay 2,187.14 765.44
Peppers 1,536.94 1,433.32
Grapes 340.04 273.29
Melons 193.29 5.65
Berries other than Strawberries 126.84 63.88
Total 55,506.70 21,015.05
Focusing on the industries demonstrates that the other vegetable industry has the largest average
disposal, discarding 12,194 tons of plastic annually. This is an unexpected result and occurs due
to the wide dispersal of commodities used when estimating this industry’s value. The next highest
average disposal is from the greenhouse and nursery industry combined, discarding 11,800 tons
of plastic per year. This is closely followed by the strawberry industry, which is estimated to
remove 10,484 tons of plastic per year including fumigation plastic. The dairy industry, which is
ranked fourth in disposal of agricultural plastic, was estimated to eliminate approximately 2,500
tons less plastic than the strawberry industry. The rest of the industries combined make up 13,126
tons of plastic disposed per year, which is close to the total disposal estimate for the other
vegetable industry.
The estimates based on median producer results ranges from a low of 5.65 tons annually in the
melon industry to a high of 9,555 tons per year for the strawberry industry. The only two
industries where the average estimate is relatively close to the median estimate are the strawberry
industry and the pepper industry. These two industries averages and medians are within a 10
percent difference.
The previous table provided an estimate of the total plastic disposal by industries given the
current usage practices by producers in the survey. Since there was a group of producers that
indicated they did not use agricultural plastic, an attempt was made to examine the usage of
plastic if every producer in each of the industries followed the average or median producers.
Table 24 provides the estimation of the tons of plastic disposed per year by each industry if every
producer in the industry used and disposed their agricultural plastic. If every producer followed
the averages developed in the survey, then it is estimated that approximately 107,794 tons of
plastic would be removed from California operations per year by the agricultural industry in
California. This is nearly twice the amount of the current plastic estimate. The estimate based on

Contractor’s Report to the Board 84
the median producers’ disposals in each industry provides an annual total of 35,981 tons of
agricultural plastic.
Table 24: Estimated Tonnage of Agricultural Plastic Disposed of on a Yearly Basis by Industry Given a 100% Adoption of Agricultural Plastic Usage in the Industries
Industry
Tons of Agricultural Plastic Disposed of Annually
Estimate Based on Average Producer
Estimate Based on Median Producer
Greenhouse and Nursery 19,648.89 1,521.49
Other Vegetables 19,528.86 6,567.75
Tomatoes 17,297.85 10,936.90
Orchards 17,171.83 194.76
Dairy 13,766.72 2,064.71
Strawberries with Fumigation Plastic 10,817.97 9,859.08
Hay 6,160.69 2,156.09
Peppers 1,997.09 1,862.44
Grapes 829.51 666.67
Berries other than Strawberries 283.00 142.52
Melons 291.86 8.53
Total 107,794.28 35,980.95
The highest quantity of agricultural plastic is estimated to come from the greenhouse and nursery
industry. If all producers in this industry followed the average, then 19,649 tons of agricultural
plastic are disposed of every year. The other vegetable industry ranks second when 100 percent of
its producers adopt the average plastic disposal reported in the survey. This industry had 120 tons
less than the top ranked greenhouse and nursery industry. The third and fourth largest estimates of
agricultural plastic disposal under the 100 percent adoption assumption were the tomato industry
and the orchard industry. Both of these industries eliminated approximately 17,000 tons. This is
assuming that the producers in these industries performed similar plastic usage practices as the
average producers did in the survey. This result demonstrates how the adoption of a new
procedure can propel an industry into utilizing more plastic on a yearly basis.
Recycling Strategy This document provided an in-depth examination of the usage and disposal of agricultural plastic
by California agricultural producers. Information analyzed in this report was from a survey that
was developed by focus groups of producers and administered to California agricultural
producers.
The participation rate for recycling agricultural plastic by average gross income levels from the
survey respondents is presented in Table 25. This table displays the recycling participation rate
for all incomes at 35.94 percent. Focusing on income level from this table shows that the
participation rate for recycling ranged from a low of 30.43 percent to a high of 38.67 percent.

Contractor’s Report to the Board 85
Producers at the highest gross income bracket ranked as the highest users of recycling practices,
while producers at the lowest income level ranked the lowest.
Table 25: Participation Rate in Recycling Agricultural Plastic by Gross Income Level
Under $100,000
$100,000 to $249,999
$250,000 to $499,999
$500,000 to $1,000,000
Over $1,000,000 All incomes
30.43% 31.82% 36.96% 32.39% 38.67% 35.94%
There are two major implications derived from this table. The first is that a group of agricultural
producers were recycling some of their agricultural plastic at the time the survey was
administered. This is an encouraging finding demonstrating that some producers find a value
recycling their agricultural plastic. This table also suggests that there is room for growth in the
participation rate for recycling agricultural plastic.
Focus on the Large Producers
A major finding from this survey was that most industries were dominated by a group of large
producers who use a majority of the agricultural plastic. The results from the median producer
were significantly smaller than that of the average producer in most industries examined. If this
sample statistic holds true for the population, this would suggest that the key to developing a
successful recycling strategy relies heavily on the participation of the large producers in the state.
While this group has the highest participation rate for recycling, it also has room to develop.
Developing a plan for a particular industry and building upon its success toward other industries
is a way to expand the recycling of agricultural plastic. Given the results from the survey, it is
expected that the strawberry industry is the best candidate for developing a recycling program.
There are three key factors that make this industry preferable to other industries:
The strawberry industry has a large concentration of producers in a few counties.
This industry indicated that it has a recycling participation rate of 31 percent. This
suggests that there is room for growth in this industry to recycle.
The strawberry industry is a natural industry to develop a recycling program due to its
large usage of agricultural plastic.
Even though it was estimated to be the third largest user of agricultural plastic in the state, the
plastic usage by this industry is relatively concentrated in a small region of the state in
comparison to the other industries examined.
Incentives and Difficulties Which Need Addressing
It appears from the results of this study that creating a successful recycling strategy revolves
around the convenience to the producer. The producers in this study indicated that the greatest
difficulty that they perceive with recycling agricultural plastic is that the recycling facilities are
too far from their operation. Setting up more collection facilities across the state will overcome
this problem. This was followed closely by producers mentioning that there were too many
restrictions as a major difficulty to recycling. According to the strawberry focus group, these
restrictions include the amount of plastic accepted, the color of the plastic, and the level of
cleanliness of the plastic. Too many restrictions was also mentioned in the focus groups as an
issue and thus confirmed by the results from the survey. A concerted effort to encourage the
reduction of these challenges as part of its recycling strategy needs to be addressed.

Contractor’s Report to the Board 86
Producers indicated in the survey that the greatest incentive they could receive for recycling is
offering on-farm pick-up for agricultural plastic. This incentive had the highest number of
respondents over all other options given, including financial incentives. The preferred inducement
chosen by each industry surveyed had a group of producers that would pay for a pick-up service
for the plastic. The amounts that producers were willing to pay depended upon their industry
type. How much they were willing to pay also relied upon whether or not they had to sort their
agricultural plastic. This is evidence that producers are looking for convenience as a factor to
their recycling decision and that there is a willingness to pay for this convenience.
While many producers in this study identified a pick-up service as a preferred enticement to
encourage them to recycle, a recycling strategy needs to take into account the level of
convenience. Some producers, especially strawberry producers, do not necessarily have the
ability to store used plastic. A producer’s desire to recycle is dependent upon whether the used
agricultural plastic is taken away in a timely manner.
Different industries, as well as producers, find various incentives and difficulties important in
regards to recycling. A ―one size fits all‖ strategy for incentives statewide is not appropriate. This
is especially true in a state that produces a set of diverse agricultural commodities that use a
variety of agricultural plastic. Potentially multiple incentives are necessary to encourage various
producers to recycle their agricultural plastic.
Recognition Since a high proportion of agricultural plastic is in the hands of a relatively small group of
producers, a strategy for recycling should start with increasing the participation rate for this
particular set of producers. Focusing on the large producers will improve the recycling program’s
ability to collect the amount of plastic needed to maintain viability. One method that might
encourage these large producers to recycle is to provide acknowledgement from an agency like
CIWMB for their sustainability practices. The producers can use the acknowledgement to
demonstrate that they are stewards of California and its agricultural land.
Resources It is recommended that an easily accessible website be developed to list all the recyclers and
recycling programs within the state. This site would post information about what products the
recyclers are willing to accept from producers. This website should be developed in cooperation
with the County Agricultural Commissioners, the California Department of Food and
Agricultural, and/or the UC Cooperative Extension. The key to this website is to make it visible
to the producer. Benefits would accrue to the producer if an educational campaign focused on
how and where producers could recycle their agricultural plastic.
Future Research
The producers identified that their greatest difficulty with recycling agricultural plastic is that the
current recycling facilities are too far from their operation. This suggests further analysis is
needed to understand how far producers would travel to recycle their agricultural plastic. This
study examined how far producers would travel if recycling was free. Further studies should
focus on how far producers would travel if they had to pay to recycle their agricultural plastic or
if they were compensated for bringing their plastic to the recycling facilities. It is expected that
the cost and convenience of the service will dictate the true number of producers who would opt
in to a pick-up service for their agricultural plastic.

Contractor’s Report to the Board 87
A major difficulty cited by producers in their perception of recycling is that there are too many
restrictions by the recyclers. The study did not examine what restrictions are causing difficulties
for producers. It is recommended that a study be undertaken to identify the specific restrictions
that are causing difficulties for producers. Further, this study should examine what the benefits
and costs are to relaxing the restrictions imposed by the recycler. It should also be examined how
much each restriction needs to be relaxed to encourage producers to recycle.
Given that the other vegetable industry, as defined in this study, had the highest amount of
disposal, future studies should focus on examining the usage and disposal of agricultural plastic
by each commodity in this industry. It is conjectured that the reason the other vegetable industry
had such a large disposal rate was due to the large acreage devoted to that industry. Some
producers indicated they knew of recycling programs that would take their agricultural plastic,
but many others did not. It was shown that 22 percent of producers indicated they knew of
recycling programs in their county, while 27 percent knew of recycling facilities that would take
their agricultural plastic. Given that only 27 percent of the producers knew of recycling facilities
and 35 percent indicated that they recycle some of their agricultural plastic, it appears to indicate
that some producers are reusing some of their plastic rather than taking it to a recycling facility.
This would suggest that there is potentially unmet demand for agricultural plastic recycling
facilities, which may require additional research.
Summary This document provides an in-depth examination of the usage and disposal of agricultural plastic
by California agricultural producers. This survey was categorized into five different sections. The
first section of the survey collected information regarding the producers operation, i.e., general
demographic information. Sections two through four gathered specific information by type of
plastic regarding producers’ usage and disposal of agricultural plastic. Section five explored
general information regarding producers’ disposal and recycling of agricultural plastic.
The producers in the survey were represented by the following industry groups: berries other than
strawberries, strawberries, peppers, melons, tomatoes, nursery, greenhouse and horticulture,
dairy, hay, grapes, and orchards. Information was also collected regarding plastic usage by other
industries that produce a variety of vegetables besides the ones listed. These groups are believed
to use the bulk of the agricultural plastic in the state.
Surveys were sent out to 3,000 producers in the state. Of that number, 2,206 of the producers
responded to the survey by mail, by phone, or verbally declined over the phone to participate.
There were 895 producers who responded to at least a portion of the survey, with 389 respondents
indicating that they used agricultural plastic. Hence, 43 percent of the producers who filled out a
portion of the survey indicated they utilized some form of agricultural plastic. Examining this
usage rate by industry showed that the orchard industry had the lowest participation rate at 22
percent and the strawberry industry had the highest usage rate at 94 percent.
There currently is a group of producers who indicated that they are recycling some of their
agricultural plastic. This group represents 35.94 percent of the plastic users in the survey. This
suggests that there is a group of producers who have found value in recycling their agricultural
plastic and are currently undertaking the practice. Examining the recycling rate by industry shows
that the melon industry has lowest recycling rate at 13 percent, while the nursery industry has the
highest recycling rate at 46 percent. These results suggest that there is a current demand for
recycling services.

Contractor’s Report to the Board 88
Producers indicated in the survey that the greatest incentive for recycling is to offer on-farm pick-
up for agricultural plastic. It was discovered that a large group of producers would be encouraged
to recycle if this type of service existed. As a group and by industry, this incentive had the highest
number of respondents over all other options given, including financial incentives. There was a
group of producers in the survey who indicated they would pay for a pick-up service for their
agricultural plastic. The amounts that producers were willing to pay depended upon what industry
they were from. How much they were willing to pay also depended upon whether or not they had
to sort the plastic.
As a group, the producers in this study indicated that the greatest difficulty they perceive or have
encountered with recycling their agricultural plastic is that the recycling facilities are too far from
their operations. This would suggest that one way to increase the recycling rate is to provide
recycling facilities closer to the operation of producers. Another top identified difficulty was that
there are too many restrictions on recycling agricultural plastic.
Examining the survey responses revealed that the average results were substantially higher than
the median results. This indicates that there are a few producers at the upper end of the
distribution of each answer that pull the average away from the median. This suggests that the
agricultural plastic usage is concentrated on larger farms which utilize relatively large amounts of
plastic. This indicates that a successful recycling strategy can target getting these large producers
to participate in a recycling program.
The survey uses a refined estimate that takes into account that plastic disposal is dependent upon
the different industries that utilize agricultural plastic. Utilizing industry information provides an
estimate that 55,506.7 tons of agricultural plastic is disposed of annually. However, if there was
100 percent participation in usage by producers in each industry, this estimate would increase to
107,794.3 tons per year. This estimate provides a clear representation of agricultural plastic
disposal given current production methods in California.

Contractor’s Report to the Board 89

Contractor’s Report to the Board 90
Appendix A
Producer’s Survey Instrument

Contractor’s Report to the Board 91

Contractor’s Report to the Board 92

Contractor’s Report to the Board 93

Contractor’s Report to the Board 94

Contractor’s Report to the Board 95
Appendix B
Summary of County Information

Contractor’s Report to the Board 96
Table B1: Summary of the Number of Participants from Each County Who Were Contacted, Those Indicating They Used Plastic, and Those Indicating They Did Not Use Plastic
County Number of Participants from Each County Who
Were Contacted
Number of Producers Indicating
They Used Plastic
Number of Producers Indicating They Did
Not Use Plastic
Alameda 7 1 4
Butte 26 4 12
Calaveras 1 0 0
Colusa 18 1 4
Contra Costa 7 1 2
Del Norte 3 1 0
El Dorado 6 0 1
Fresno 258 22 69
Glenn 25 4 6
Humboldt 26 2 5
Imperial 52 5 9
Kern 93 6 21
Kings 55 7 14
Lake 5 1 2
Lassen 3 2 0
Los Angeles 47 14 6
Madera 62 8 12
Marin 8 0 2
Mendocino 15 4 4
Merced 111 18 31
Modoc 7 1 1
Mono 1 0 1
Monterey 120 30 9
Napa 23 6 4
Nevada 4 1 1
Orange 25 7 1
Placer 7 2 1
Plumas 2 1 0
Riverside 65 9 15
Sacramento 24 9 7
San Benito 23 5 6

Contractor’s Report to the Board 97
Table B1 Cont.: Summary of the Number of Participants from Each County Who Were Contacted, Those Indicating They Used Plastic, and Those Indicating They Did Not Use Plastic
County Number of Participants from Each County Who
Were Contacted
Number of Producers Indicating
They Used Plastic
Number of Producers Indicating They Did
Not Use Plastic
San Bernardino 42 6 8
San Diego 104 28 15
San Joaquin 166 21 60
San Luis Obispo 54 10 11
San Mateo 11 6 1
Santa Barbara 61 27 7
Santa Clara 37 15 7
Santa Cruz 60 16 6
Shasta 8 5 1
Sierra 2 0 1
Siskiyou 14 5 4
Solano 34 1 15
Sonoma 53 17 7
Stanislaus 98 14 25
Sutter 24 4 8
Tehama 14 2 3
Trinity 2 0 0
Tulare 130 11 37
Tuolumne 2 0 0
Ventura 87 16 15
Yolo 61 9 18
Yuba 10 1 6

Contractor’s Report to the Board 98
Bibliography Amidon Recycling. ―Use and Disposal of Plastics in Agriculture.‖ A report prepared for the
American Plastics Council, April 1994.
Bolda, M., L. Tourte, K. Klonsky, and R. De Moura. ―Sample Costs to Produce Strawberries.‖
University of California Cooperative Extension, Paper No. ST-SC-04, 2004.
California Department of Food and Agriculture (CDFA). ―California Agriculture Resource
Directory 2006.‖ 1220 N Street, 4th Floor, Sacramento, CA, 95814, 2006.
Clarke, S. ―Recycling Farm Plastic Films.‖ A Factsheet from the Ministry of Agricultural Food
and Rural Affairs, Ontario, Canada, February 1995.
Clarke, S. and C. Fletcher. ―Agricultural Plastics Recycling Handbook.‖ A report prepared for the
Ontario Ministry of Agriculture, Food and Rural Affairs, Ontario, Canada, June 2002.
Da Costa, C., J. Franklin, S. Jordan, S. Rainey, and D. Short. ―Agricultural Market Research
Study for New York State: Part One.‖ A report prepared for Cornell Cooperative
Extension and Cornell Waste Management by Canadian-US Business Consulting Service
at Clarkson University, May 14, 1996a.
———, ―Agricultural Market Research Study for New York State: Part Two.‖ A report prepared
for Cornell Cooperative Extension and Cornell Waste Management by Canadian-US
Business Consulting Service at Clarkson University, May 14, 1996b.
DSM Environmental Services, Inc. ―Best Management Practices for Agricultural Forage Film
Waste: Lessons Learned for Recycling and Composting.‖ A report prepared for the
American Plastic Council, Spring 1999.
Ennis, R. S. ―PlastigoneTM
,A New Time-Controlled Photodegradable Plastic Mulch Film.”
Proceedings of the National Agricultural Plastics Congress, 20, 83-90, 1987.
Environmental and Plastic Council. ―Best Practices Guide for Agricultural Plastic Film.‖ A guide
prepared for the Canadian Plastics Industry Association, Ontario, Canada,
http://www.cpia.ca/files/files/files_best_practices2.pdf, website accessed August 15,
2006, no publication date.
Garthe, James W. (2002). ―Used Agricultural Plastic Mulch as a Supplemental Boiler Fuel.‖ Penn
State University Cooperative Extension, University Park, PA, no date.
Garthe, J. and J. McCoy. ―Recycling Your Used Agricultural Plastics.‖ Agricultural and
Biological Engineering Solid Waste Management Bulletin C-22, Penn State University
Cooperative Extension, University Park, PA, September 2002.
Garthe, J. and P. Kowal. ―Recycling Plastics: The Process and Terms.‖ Agricultural and
Biological Engineering Solid Waste Management Bulletin C-10, Penn State University
Cooperative Extension, University Park, PA, June 1994.
Garthe, J. and P. Kowal. ―Resource Recovery: Turning Waste into Energy.‖ Agricultural and
Biological Engineering Solid Waste Management Bulletin C-11, Penn State University
Cooperative Extension, University Park, PA, June 1993.
Contractor’s Report to the Board 99
Garthe, J. and P. Kowal. ―Recycling Used Agricultural Plastics.‖ Agricultural and Biological
Engineering Solid Waste Management Bulletin C-8, Penn State University Cooperative
Extension, University Park, PA, no date.
Goldy, R. Baling Used Agricultural Plastic. Southwest Michigan Research and Extension Center,
1791 Hillandale Road, Benton Harbor, MI 49022, 311 Agriculture Hall, Michigan State
University, East Lansing, MI 48824, Electronic copy located at:
http://www.maes.msu.edu/swmrec/publicationsfolder/SWMRECOnlineReports/veggiere
ports/Baling%20Used%20Agricultural%20Plastic.pdf#searh='baling%20used%20agricul
tural%20plastic, no date.
Hussain, I and H, Hamid. ―Plastics in Agriculture.‖ In Plastics and the Environment edited by
Anthony Andrady, John Wiley & Sons, Inc., pp. 185-210, 2003.
Hemphill, Delbert D. (1993). ―Agricultural Plastics as Solid Waste: What Are the Options for
Disposal?‖ HortTechnology, v. 3(1), 70-73, 1993.
Jaeger, W. ―Economic Analysis of the Cost of producing Juniper-Plastic Fuel Cubes in the Upper
Klammath Basin.‖ A report prepared for ORE-CAL RC&D, PO Box 785, Dorris, CA,
accessed August 27, 2006, January 30, 2006.
Jensen, M. H. ―Plasticulture in the Global Community - View of the Past and Future.” 15th
International Congress for Plastics in Agriculture held concurrently with 29th National
Agricultural Plastics Congress in 2000 at Hershey, PA, 2000.
http://www.plasticulture.org/history_global_community.htm.
Kasperbauer, M. J. ―Strawberry Yield over Red versus Black Plastic Mulch.‖ Crop Science, Vol.
40, January–February, 2000.
Kwak, S., S. Yoo, and C. Kim. ―Measuring the Economic Benefits of Recycling: The Case of the
Waste Agricultural Film in Korea.‖ Applied Economics, v. 36, July 2004, pgs: 1445-
1453.
Levitan, L. and A Barros. ―Recycling Agricultural Plastics in New York State.‖ A research report
prepared for the Environmental Risk Analysis Program, Cornell University, Ithaca New
York, March 11, 2003.
Levitan, L., D. Cox, and M. Clarvoe. ―Agricultural Plastic Film Recycling: Feasibility and
Options in the Central LeatherStocking-Upper Catskill Region of New York State.‖ A
research report prepared for the Environmental Risk Analysis Program, Cornell
University, Ithaca New York, January 2005.
Orzolek, M. D. Plasticulture in North America. Plasticulture (4) v. 122, 2003, pgs: 33-47.
Parish, R., R. Bracy, and J. McCoy. ―Evaluation of Field Incineration of Plastic Mulch.‖ Journal
of Vegetable and Crops Production, v. 6(1), 2000.
Randall Conrad and Assoc. LTD. The Market Feasibility of Recycling/Recovering Post
Consumer Polypropylene Baler Twine in Alberta. A research report submitted to the
Poly-Twine Market Feasibility Steering Committee,
http://www.cpia.ca/files/files/files_baler_twine_study.pdf, accessed August 12, 2006,
March 15, 2006.

Contractor’s Report to the Board 100
Roos, D and D Jones. ―Season Extension.‖ North Carolina Cooperative Extension, Chatham
County Center,
http://www.ces.ncsu.edu/chatham/ag/SustAg/SeasonExtensionOctober2005a.pdf, no date.
Splittstoesser, W, and J. Brown. ―Current Changes in Plasticulture for Crop Production.”
Proceedings of the National Agricultural Plastics Congress, 23, 241-253, 1991.
United States Department of Agriculture—National Agricultural Statistical Service. ―Table 38.
Nursery, Greenhouse, Floriculture, Mushrooms, Sod, and Vegetable Seeds Grown for
Sale: 2002 and 1997.‖ 2002 Census of Agriculture. Washington, DC.
Trademark Names Used in this Report
Toro® is a registered trademark of the Toro Company.