Embed Size (px)
Citation preview
Postprandial glycemia (PPG): Should we keep it low? If yes, how?
Antonio Cerielloa,b

Impaired beta-cell function in normal glucose tolerance
Ferrannini E, Gastaldelli A, Miyazaki Y, Matsuda M, Mari A, DeFronzo RA. Beta-Cell function in subjects spanning the range from normal glucose tolerance to overt diabetes: a new analysis. J Clin Endocrinol Metab. 2005 Jan;90(1):493-500.
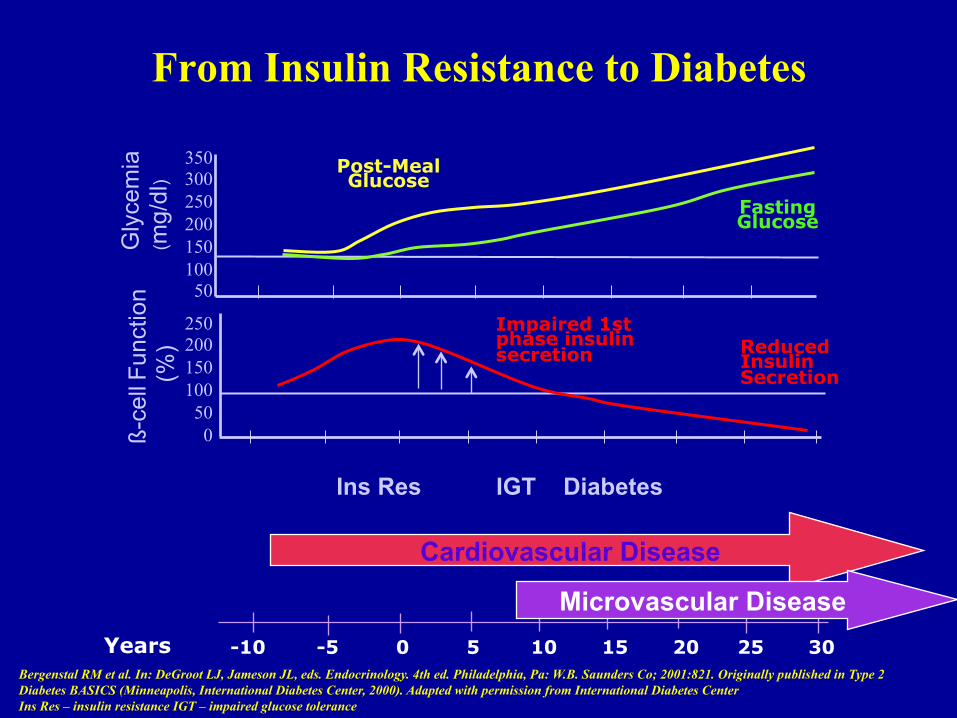
From Insulin Resistance to Diabetes
350 300 250 200 150 100 50
Reduced Insulin Secretion
250 200 150 100 50 0 ß-
cell F
unct
ion
(%
)
Fasting Glucose
Post-Meal Glucose
Gly
cem
ia
(mg/
dl)
Cardiovascular Disease
Ins Res IGT Diabetes
Years -10 -5 0 5 10 15 20 25 30
Microvascular Disease
Impaired 1st phase insulin secretion
Bergenstal RM et al. In: DeGroot LJ, Jameson JL, eds. Endocrinology. 4th ed. Philadelphia, Pa: W.B. Saunders Co; 2001:821. Originally published in Type 2 Diabetes BASICS (Minneapolis, International Diabetes Center, 2000). Adapted with permission from International Diabetes Center Ins Res – insulin resistance IGT – impaired glucose tolerance
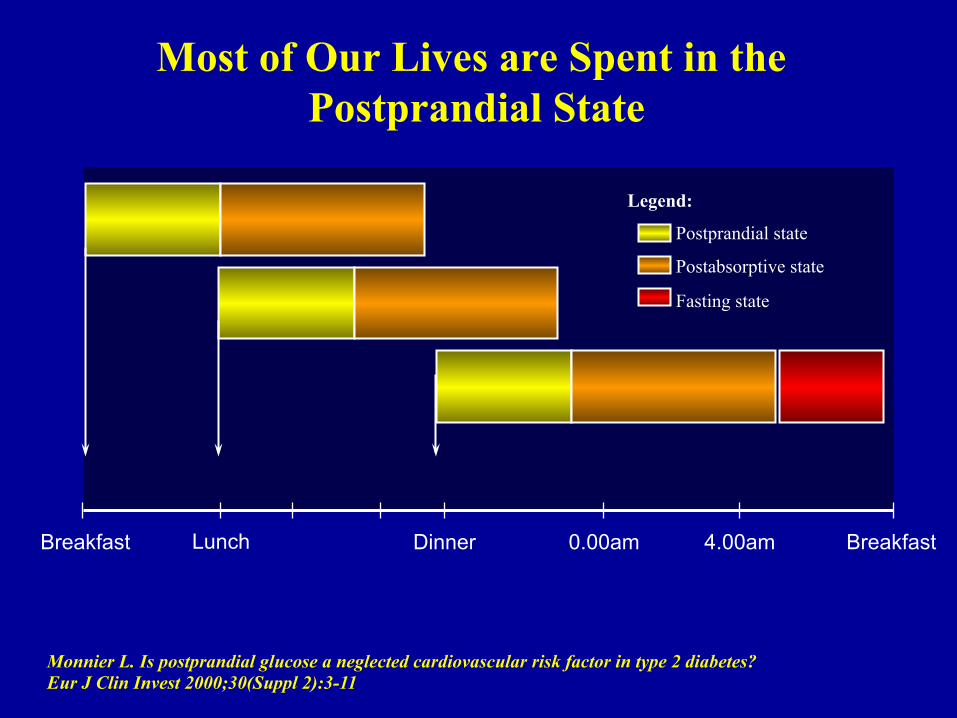
Breakfast Lunch Dinner 0.00am 4.00am Breakfast
Monnier L. Is postprandial glucose a neglected cardiovascular risk factor in type 2 diabetes? Eur J Clin Invest 2000;30(Suppl 2):3-11
Most of Our Lives are Spent in the Postprandial State
Legend:
Postprandial state
Postabsorptive state
Fasting state
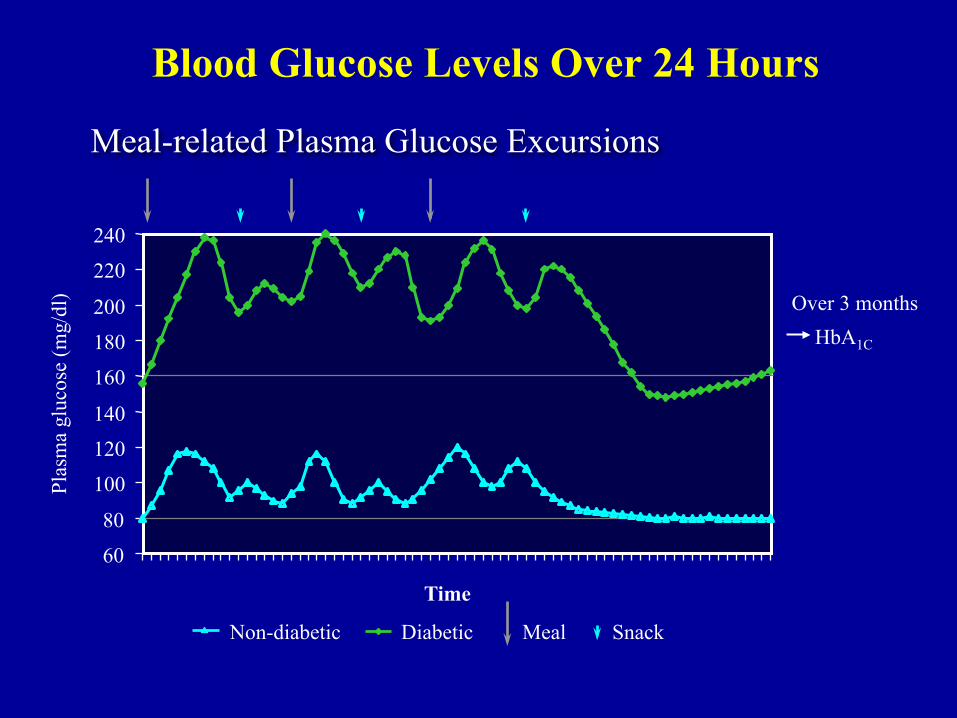
Blood Glucose Levels Over 24 Hours
60
80
100
120
140
160
180
200
220
240
Non-diabetic Diabetic
Plas
ma
gluc
ose
(mg/
dl)
Meal Snack
Time
Meal-related Plasma Glucose Excursions
Over 3 months HbA1C

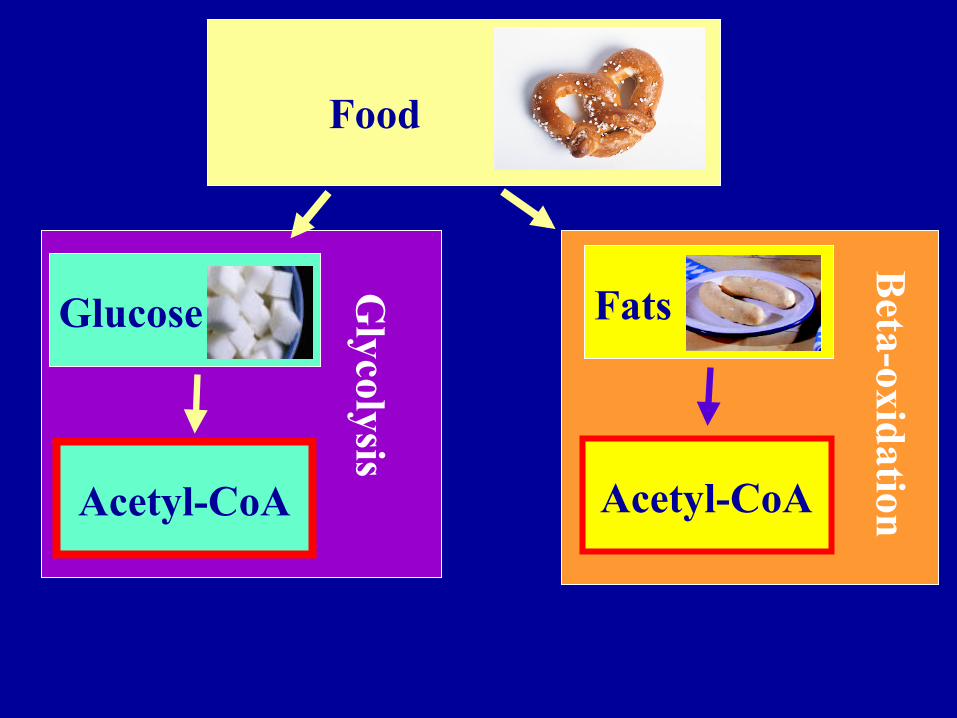
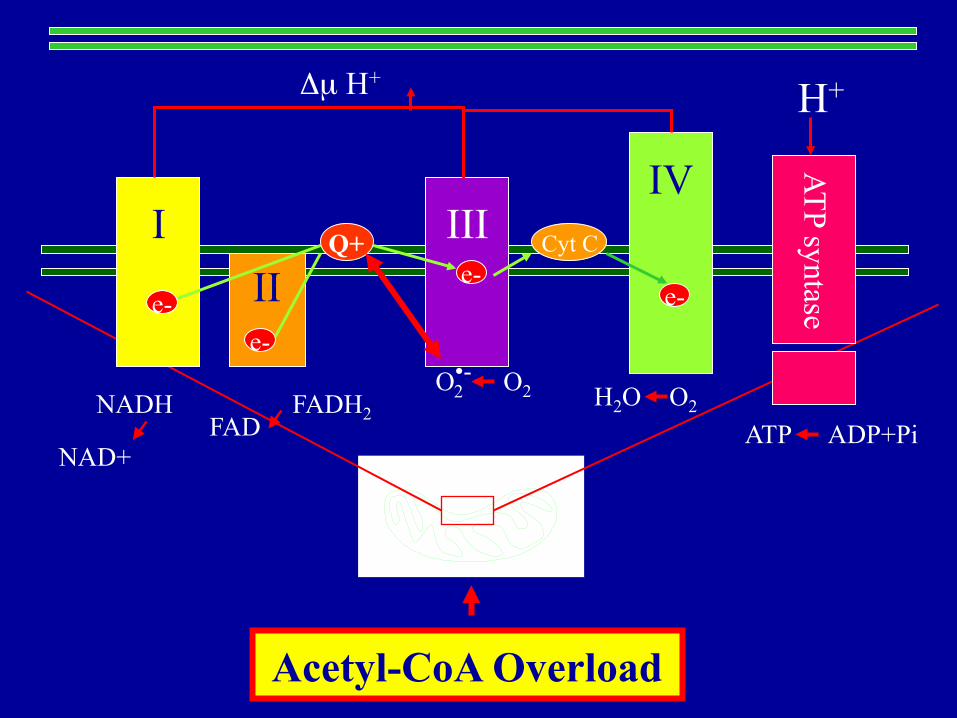
Food
Glucose Fats
Acetyl-CoA Acetyl-CoA
Glycolysis
Beta-oxidation
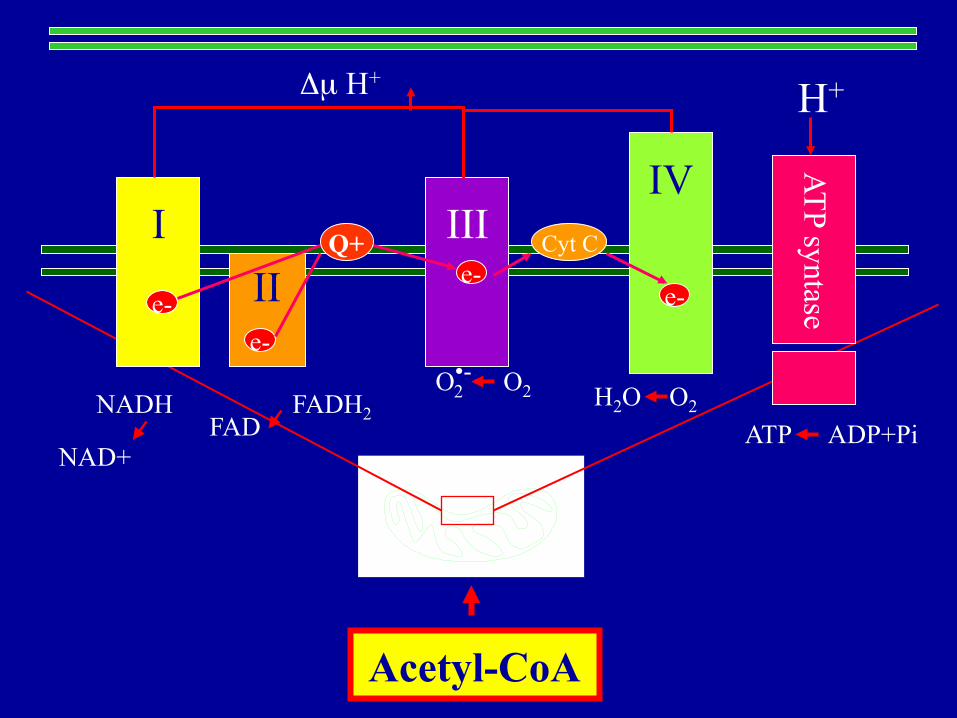
I
II
Q+ III
Cyt C
IV
ATP syntase e- e-
e- e-
NADH
NAD+
FADH2 FAD
H2O O2
ATP ADP+Pi
O•- 2 O2
Δµ H+ H+
Acetyl-CoA
I
II
Q+ III
Cyt C
IV
ATP syntase e- e-
e- e-
NADH
NAD+
FADH2 FAD
H2O O2
ATP ADP+Pi
O•- 2 O2
Δµ H+ H+
Acetyl-CoA Overload
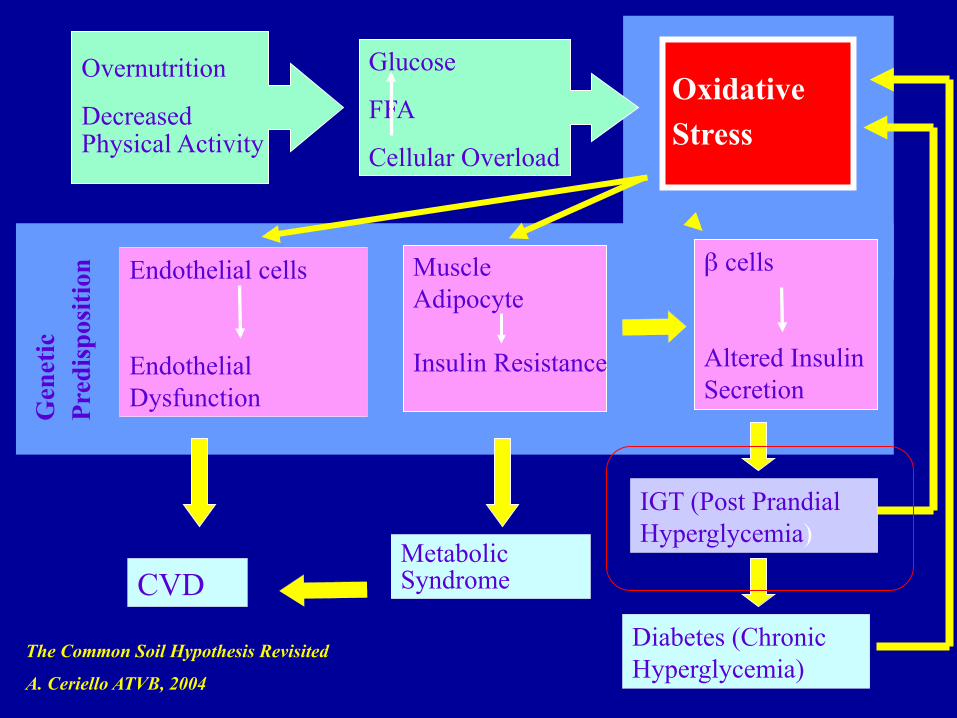
Oxidative
Stress
Glucose
FFA
Cellular Overload
β cells
Altered Insulin Secretion
Overnutrition
Decreased Physical Activity
CVD Metabolic Syndrome
Diabetes (Chronic Hyperglycemia)
IGT (Post Prandial Hyperglycemia)
Endothelial cells
Endothelial Dysfunction G
enet
ic
Pred
ispo
sitio
n Muscle Adipocyte Insulin Resistance
The Common Soil Hypothesis Revisited
A. Ceriello ATVB, 2004

Ceriello A, Diabetes Care 2010
Hyperglycemia
O2-
PKC
O2-
NAD(P)H oxidase
Peroxynitrite
NF-kB
iNOS eNOS
NO
Nitrotyrosine DNA damage
GAPDH NAD+
Adhesion molecules
Proinflammatory Cytokines
PARP
Endothelial dysfunction
Polyol Pathway
AGE Formation
Hexosamine Flux
Diabetic Complications
Mitochondria
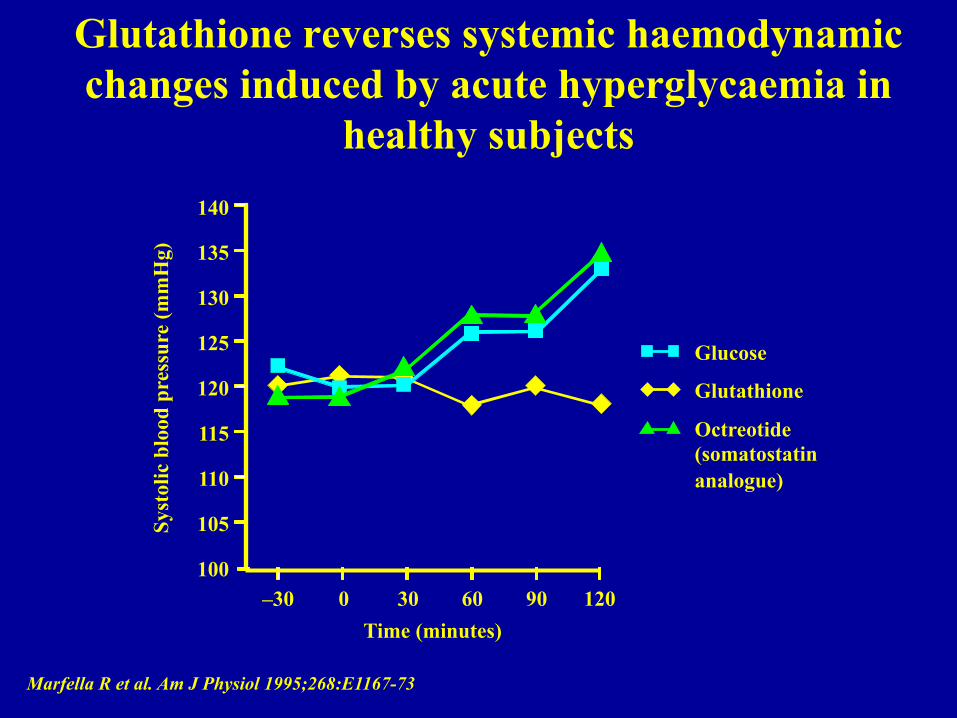
Glutathione reverses systemic haemodynamic changes induced by acute hyperglycaemia in
healthy subjects
Marfella R et al. Am J Physiol 1995;268:E1167-73
Syst
olic
blo
od p
ress
ure
(mm
Hg)
Time (minutes) –30 0 30 60 90 120
140
135
130
125
120
115
110
105
100
Glucose
Glutathione
Octreotide (somatostatin analogue)
Acute hyperglycemia and endothelial dysfunction: the role of oxidative stress
1. Williams SB et al. Circulation 1998; 97: 1695-701 2. Title LM et al. J Am Coll Cardiol 2000; 36: 2185-91 3. Beckman JA et al. Circulation 2001; 103: 1618-23 4. Beckman JA et al. Circ Res 2002; 90: 107-11
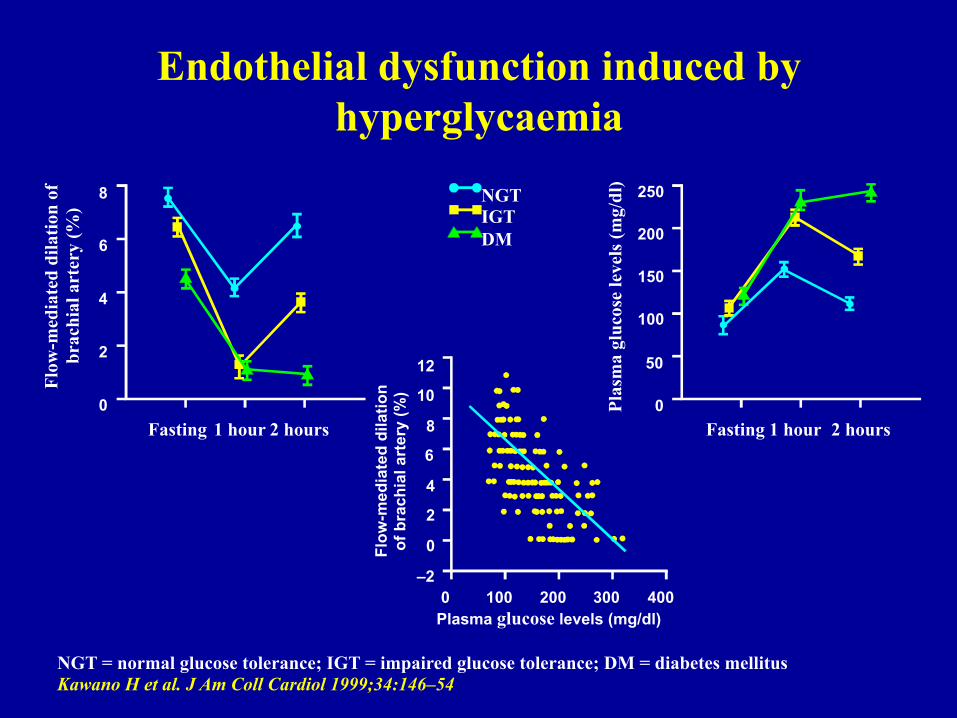
Endothelial dysfunction induced by hyperglycaemia
NGT = normal glucose tolerance; IGT = impaired glucose tolerance; DM = diabetes mellitus Kawano H et al. J Am Coll Cardiol 1999;34:146–54
NGT IGT DM
Flow
-med
iate
d di
latio
n of
br
achi
al a
rter
y (%
)
Flow
-med
iate
d di
latio
n
of b
rach
ial a
rter
y (%
)
Plas
ma
gluc
ose
leve
ls (m
g/dl
) 8
6
4
2
0
12
10
8
6
4
2
0
–2
250
200
150
100
50
0 Fasting 1 hour 2 hours Fasting 1 hour 2 hours
0 100 200 300 400 Plasma glucose levels (mg/dl)
Loss of endothelial glycocalyx during acute hyperglycemia coincides with endothelial
dysfunction and coagulation activation in vivo.
Nieuwdorp M, van Haeften TW, Gouverneur MC, Mooij HL, van Lieshout MH, Levi M, Meijers JC, Holleman F, Hoekstra JB, Vink H, Kastelein JJ, Stroes ES
Diabetes 2006 ;55:1127-32
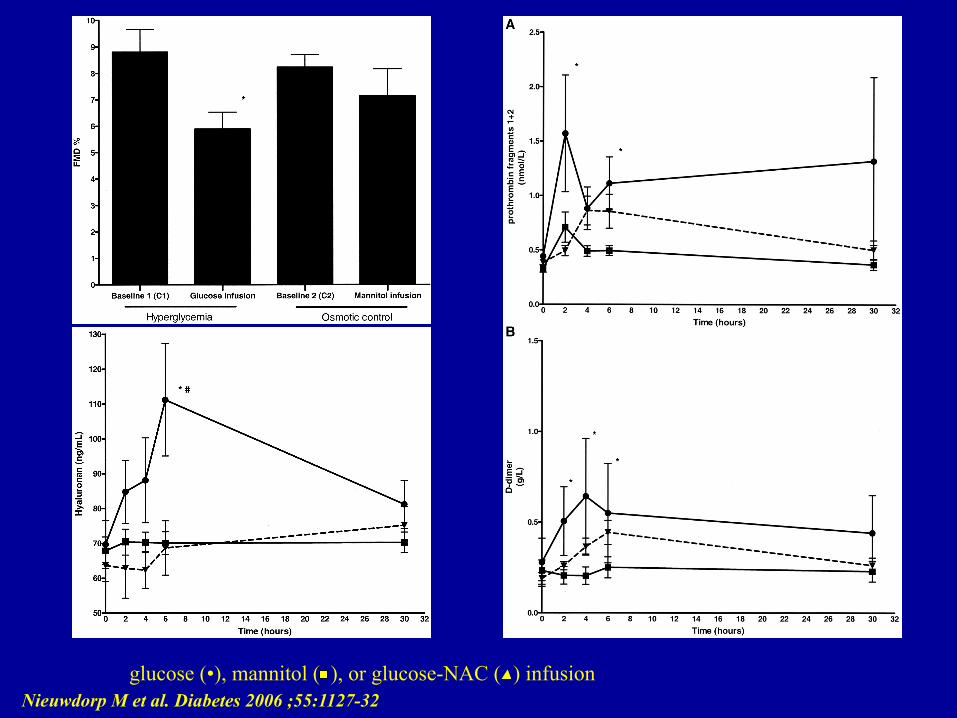
glucose (•), mannitol ( ), or glucose-NAC ( ) infusion Nieuwdorp M et al. Diabetes 2006 ;55:1127-32
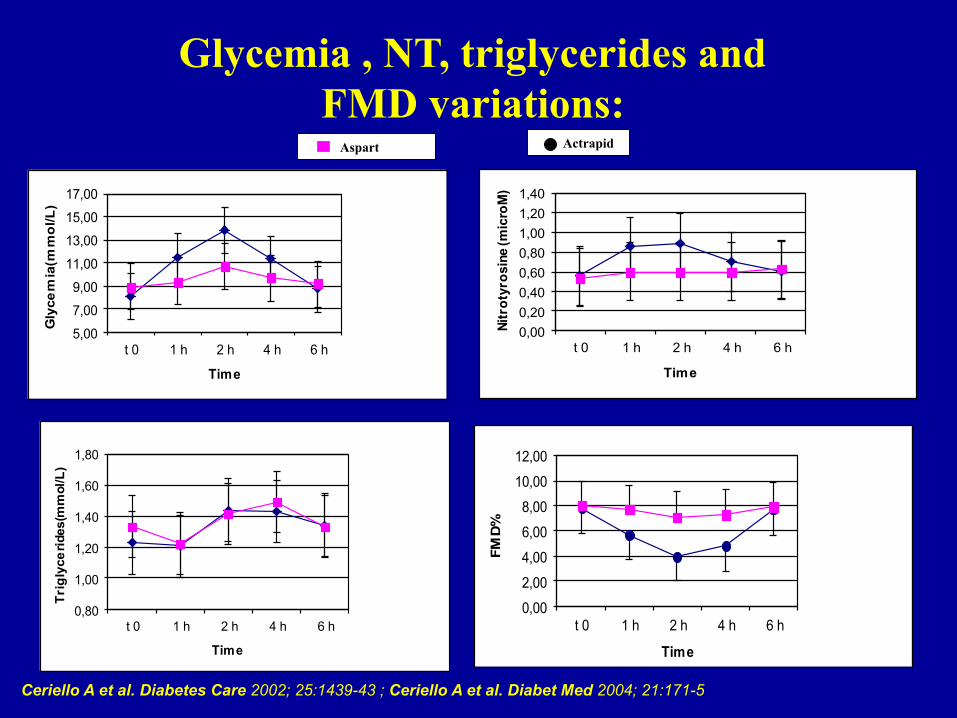
Glycemia , NT, triglycerides and FMD variations:
Ceriello A et al. Diabetes Care 2002; 25:1439-43 ; Ceriello A et al. Diabet Med 2004; 21:171-5
5,00
7,00
9,00
11,00
13,00
15,00
17,00
t 0 1 h 2 h 4 h 6 h
Glycemia(mmol/L)
Time
0,000,200,400,600,801,001,201,40
t 0 1 h 2 h 4 h 6 h
Nitr
otyr
osin
e (m
icro
M)
Time
0,80
1,00
1,20
1,40
1,60
1,80
t 0 1 h 2 h 4 h 6 h
Triglycerides(mmol/L)
Time
0,00
2,00
4,00
6,00
8,00
10,00
12,00
t 0 1 h 2 h 4 h 6 h
FMD%
Time
Aspart Actrapid

Acarbose therapy reduces coagulation marker levels in diabetic patients
Ceriello A et al. Diabetologia 1996;39:469–73
D-d
imer
(g/L
)
4.0
3.4
2.8
2.2 0 60 120 180 240
Duration (minutes)
Acarbose (n=17)
Placebo (n=17)
p<0.01 Acarbose (n=17)
Prot
hrom
bin
frag
men
t 1+2
(nm
ol/L
) 3.0
2.4
1.8
1.2
0.6 0 60 120 180 240
Duration (minutes)
Placebo (n=17)
p<0.05
0 120 (min)
0 120 (min)
0 120 (min)
90 85 80 75 70 65 60 55 50 45 40
18 16 14 12 10 8 6 4 2 0
200 190 180 170 160 150 140 130 120 110 100
Lag
pha
se (m
in)
Rat
e (m
in/g
r. pr
ot)
Die
ne p
eak
(min
)
=high-carbohydrate meal =low-carbohydrate meal
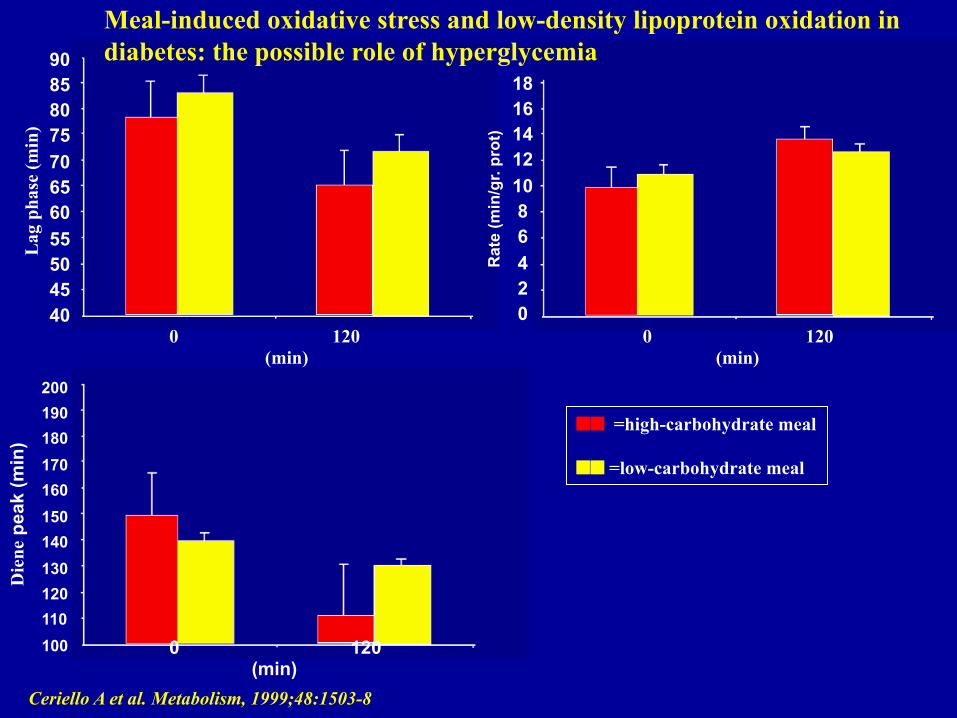
Ceriello A et al. Metabolism, 1999;48:1503-8
Meal-induced oxidative stress and low-density lipoprotein oxidation in diabetes: the possible role of hyperglycemia
Effects of different insulin regimes on postprandial
myocardial perfusion defects in type 2 diabetic patients
Scognamiglio R, Negut C, de Kreutzenberg SV, Tiengo A, Avogaro A.
Diabetes Care 2006 ;29:95-100
Type 2 diabetes 0
2
4
6
8
10
12
Control subject Placebo Regular insulin Insulin analog
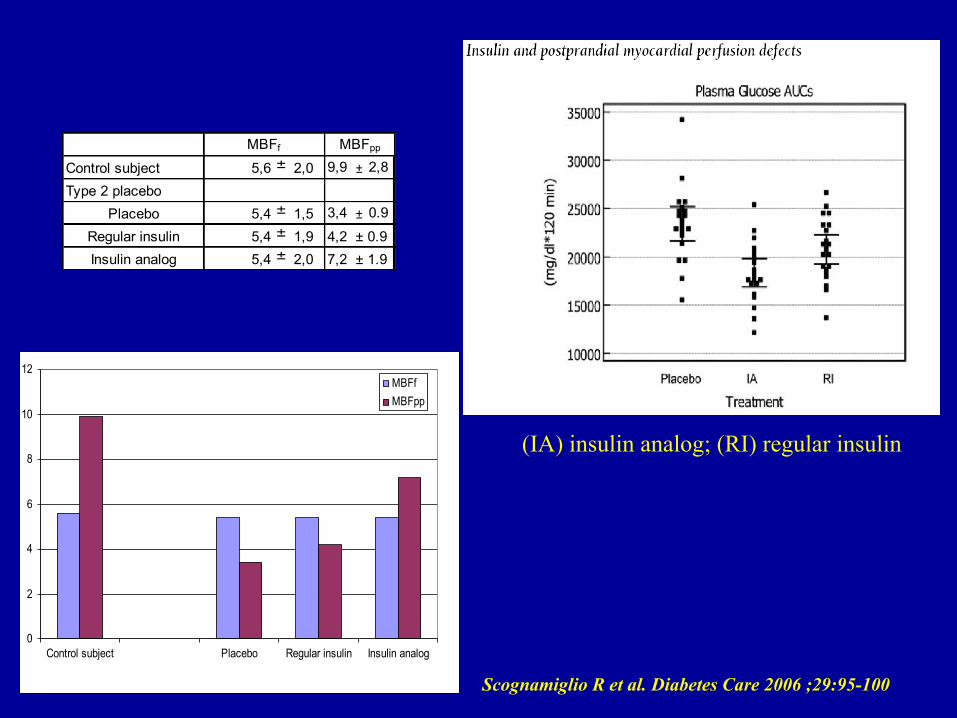
MBFfMBFpp
Control subject 5,6 ± 2,0 9,9 ± 2,8
Type 2 placeboPlacebo 5,4 ± 1,5 3,4 ± 0.9
Regular insulin 5,4 ± 1,9 4,2 ± 0.9Insulin analog 5,4 ± 2,0 7,2 ± 1.9
MBFf MBFpp
(IA) insulin analog; (RI) regular insulin
Scognamiglio R et al. Diabetes Care 2006 ;29:95-100

Regression of cartoid atherosclerosis by control of postprandial hyperglycaemia in type 2
diabetes mellitus
• Number of patients: 175 • Follow-up: 12 months
Esposito K et al. Circulation 2004;110:214–219
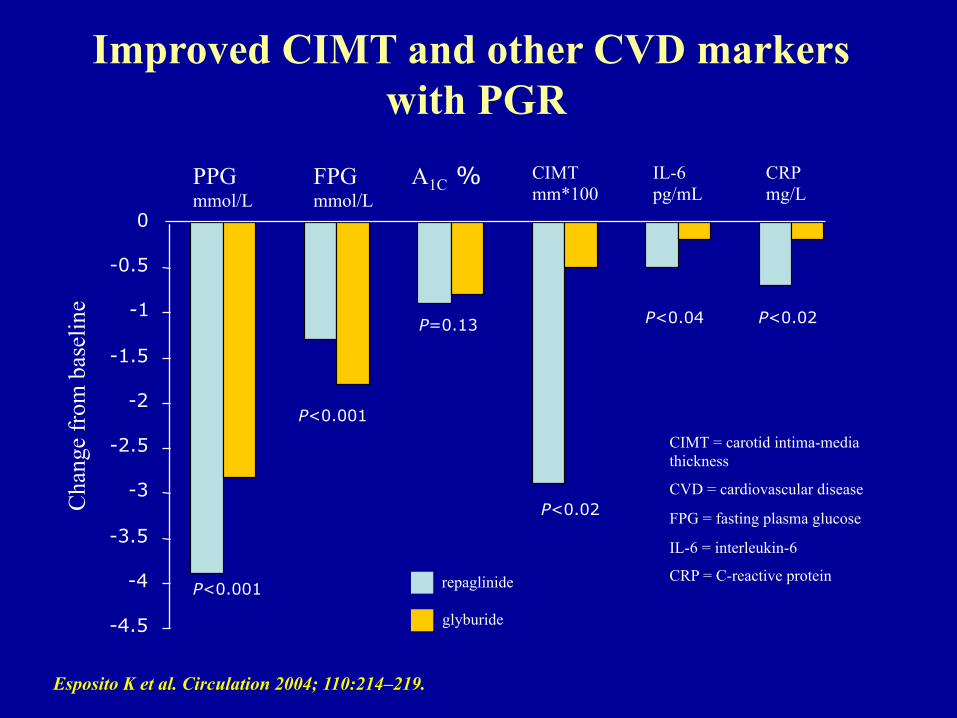
Improved CIMT and other CVD markers with PGR
Esposito K et al. Circulation 2004; 110:214–219.
PPG mmol/L
FPG mmol/L
A1C % CIMT mm*100
IL-6 pg/mL
CRP mg/L
P<0.001
P<0.001
P=0.13
P<0.02
P<0.02 P<0.04
-4.5
-4
-3.5
-3
-2.5
-2
-1.5
-1
-0.5
0
repaglinide
glyburide
CIMT = carotid intima-media thickness
CVD = cardiovascular disease
FPG = fasting plasma glucose
IL-6 = interleukin-6
CRP = C-reactive protein
Cha
nge
from
bas
elin
e
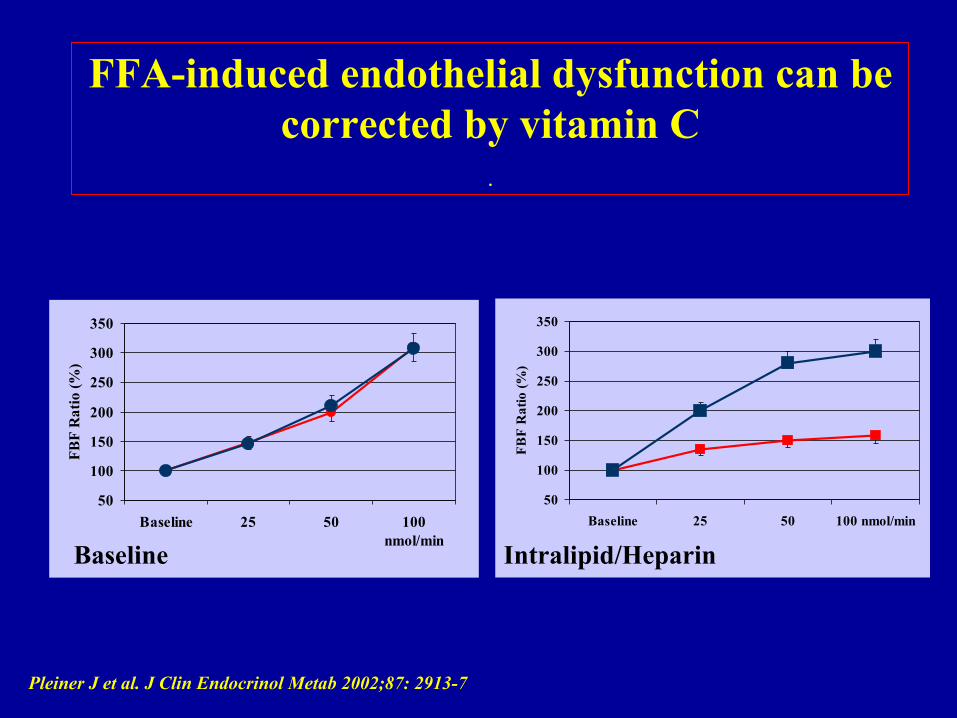
FFA-induced endothelial dysfunction can be corrected by vitamin C
.
50
100
150
200
250
300
350
Baseline 25 50 100nmol/min
FBF
Rat
io (%
)
Pleiner J et al. J Clin Endocrinol Metab 2002;87: 2913-7
50
100
150
200
250
300
350
Baseline 25 50 100 nmol/minFB
F R
atio
(%)
Baseline Intralipid/Heparin
0
2
4
6
8
10
12
14
16
0 1 2 3 4
Hours
Gly
cem
ia (m
mol
/L)
0
1
2
3
4
5
6
7
8
0 1 2 3 4
Hours
Trig
lyce
rides
(mm
ol/L
)
High fatOGTTHigh fat+OGTT
0
1
2
3
4
5
6
0 1 2 3 4
Hours
FMD%
0,4
0,5
0,6
0,7
0,8
0,9
1,0
0 1 2 3 4
Hours
Nitr
otyr
osin
e (m
icro
M)
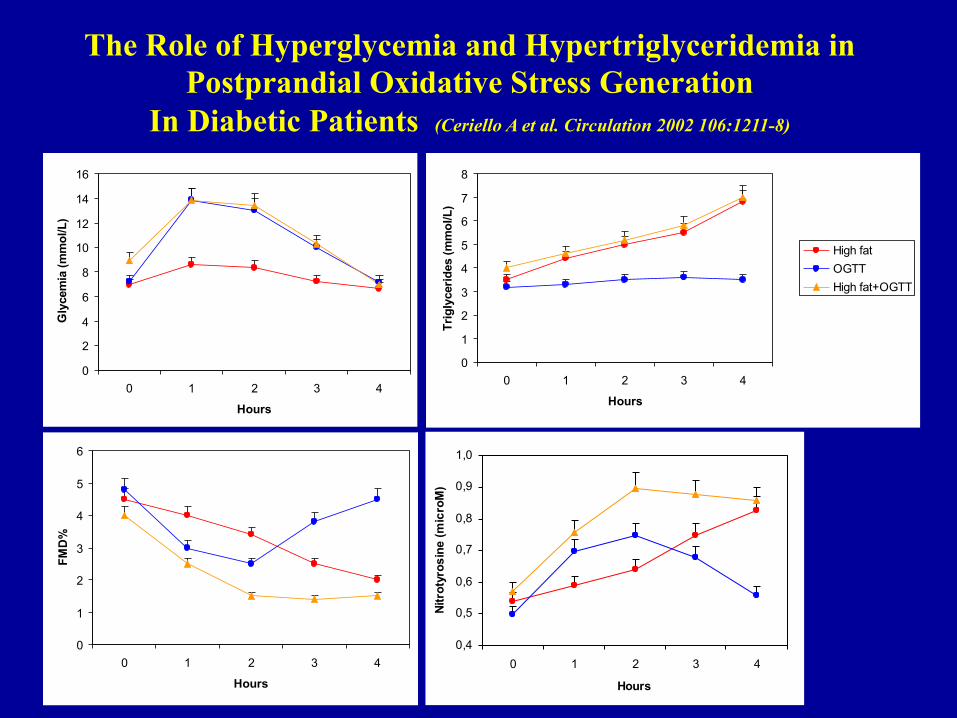
The Role of Hyperglycemia and Hypertriglyceridemia in Postprandial Oxidative Stress Generation
In Diabetic Patients (Ceriello A et al. Circulation 2002 106:1211-8)
Epidemiological Evidences
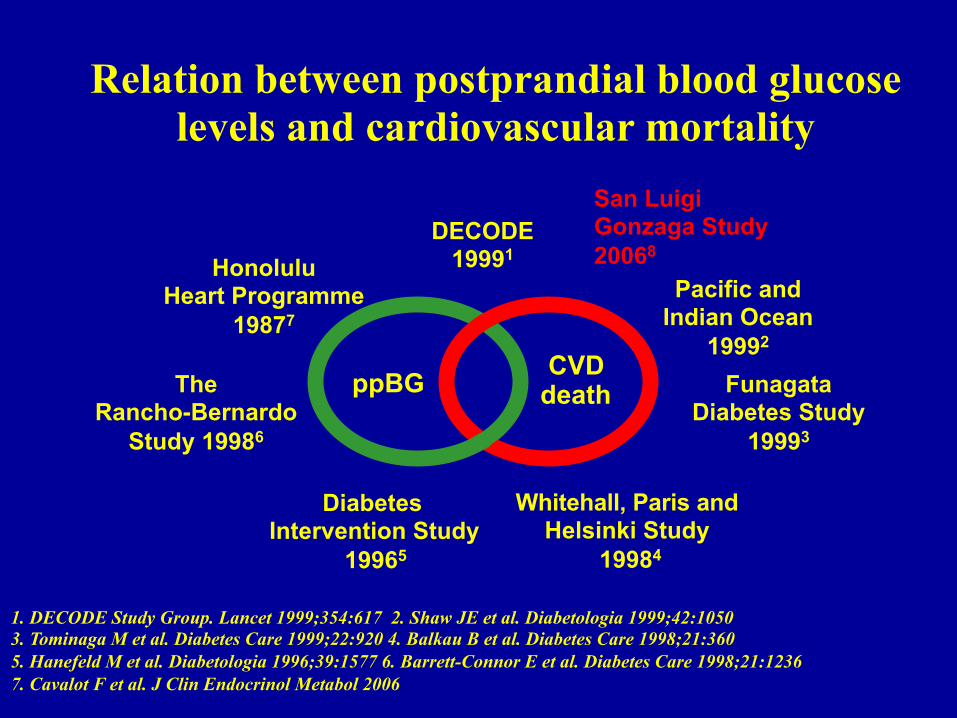
Relation between postprandial blood glucose levels and cardiovascular mortality
DECODE 19991
Pacific and Indian Ocean
19992
Funagata Diabetes Study
19993
Whitehall, Paris and Helsinki Study
19984
Diabetes Intervention Study
19965
The Rancho-Bernardo
Study 19986
ppBG
Honolulu Heart Programme
19877
CVD death
1. DECODE Study Group. Lancet 1999;354:617 2. Shaw JE et al. Diabetologia 1999;42:1050 3. Tominaga M et al. Diabetes Care 1999;22:920 4. Balkau B et al. Diabetes Care 1998;21:360 5. Hanefeld M et al. Diabetologia 1996;39:1577 6. Barrett-Connor E et al. Diabetes Care 1998;21:1236 7. Cavalot F et al. J Clin Endocrinol Metabol 2006
San Luigi Gonzaga Study 20068

San Luigi Gonzaga Diabetes Study
• 529 (284 men and 245 women) consecutive type 2 diabetic patients1 • 77 events over 5 years1 • Multivariate analysis including HbA1c, pre- and postprandial glucose
showed only post-lunch glucose to be predictive1 • Long-term follow-up (10 years) confirms this evidence2
1 JCEM 2005;91,813-819 2 Diabetes Care 2011; 34:2237-2243
Excess glycaemic excursions after an oral glucose tolerance
test compared with a mixed meal challenge and self-measured
home glucose profiles: is the OGTT a valid predictor of
postprandial hyperglycaemia and vice versa?
J. J. Meier, B. Baller, B. A. Menge, B. Gallwitz, W. E. Schmidt and M. A. Nauck
Diabetes, Obesity and Metabolism 2009; 11: 213–222
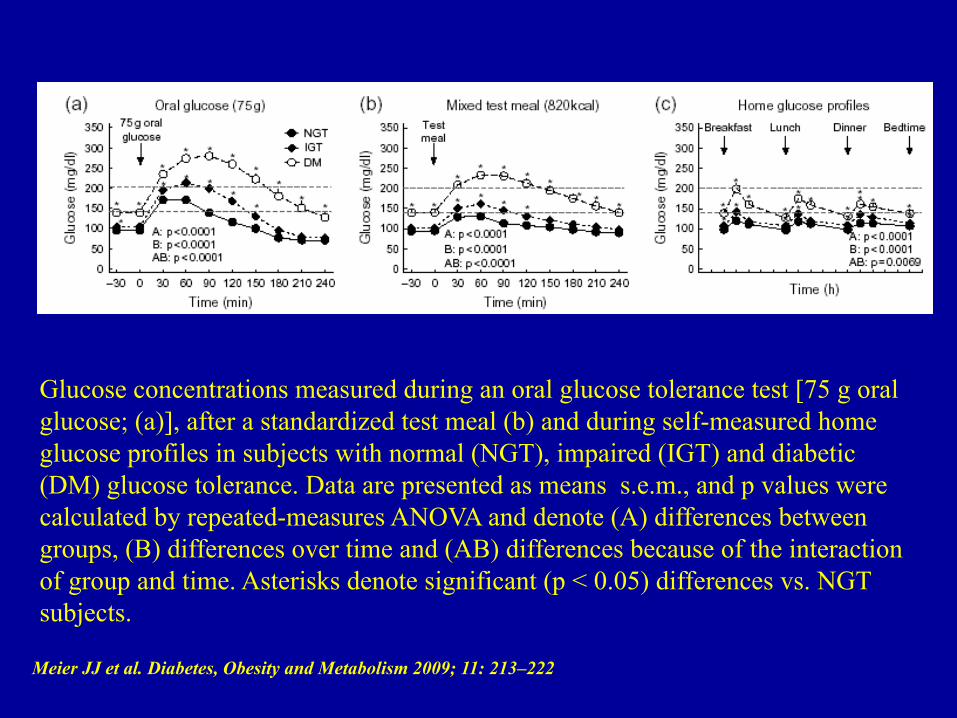
Meier JJ et al. Diabetes, Obesity and Metabolism 2009; 11: 213–222
Glucose concentrations measured during an oral glucose tolerance test [75 g oral glucose; (a)], after a standardized test meal (b) and during self-measured home glucose profiles in subjects with normal (NGT), impaired (IGT) and diabetic (DM) glucose tolerance. Data are presented as means s.e.m., and p values were calculated by repeated-measures ANOVA and denote (A) differences between groups, (B) differences over time and (AB) differences because of the interaction of group and time. Asterisks denote significant (p < 0.05) differences vs. NGT subjects.
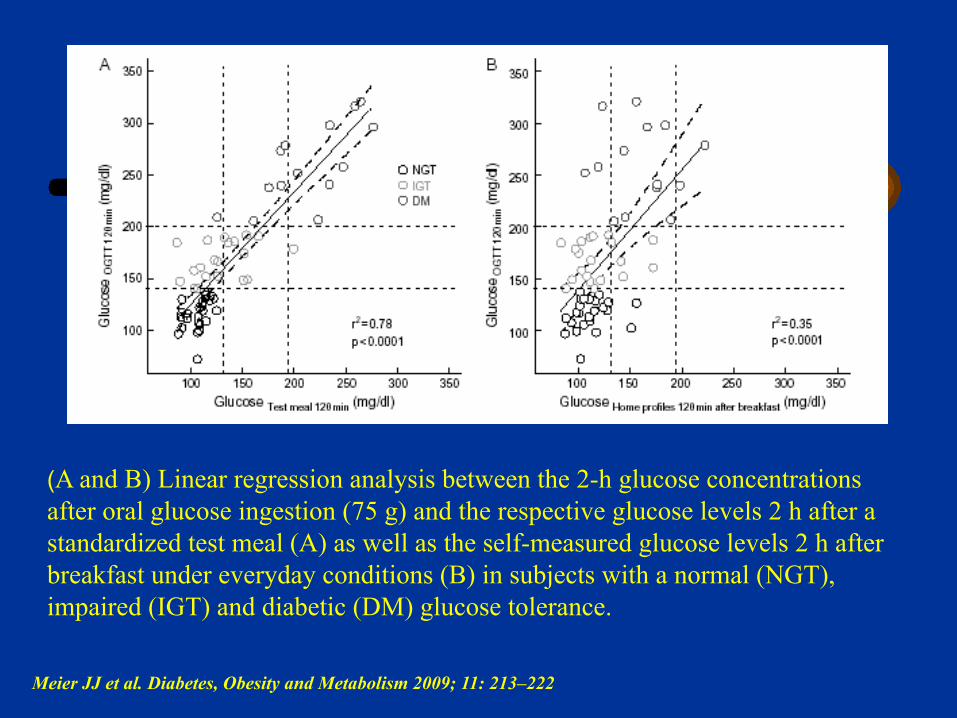
(A and B) Linear regression analysis between the 2-h glucose concentrations after oral glucose ingestion (75 g) and the respective glucose levels 2 h after a standardized test meal (A) as well as the self-measured glucose levels 2 h after breakfast under everyday conditions (B) in subjects with a normal (NGT), impaired (IGT) and diabetic (DM) glucose tolerance.
Meier JJ et al. Diabetes, Obesity and Metabolism 2009; 11: 213–222
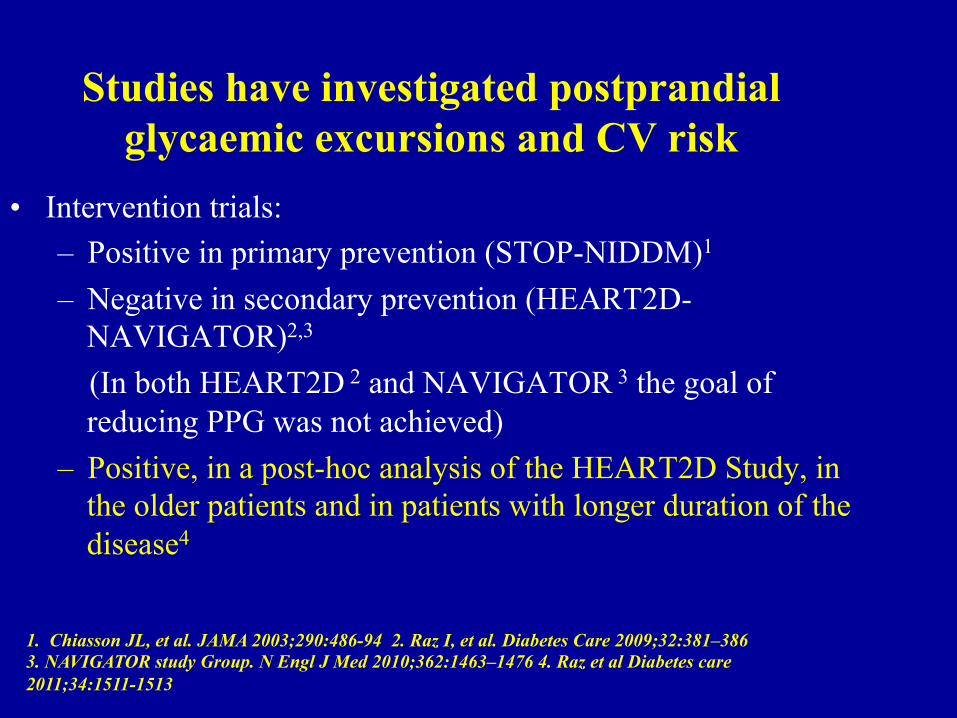
Studies have investigated postprandial glycaemic excursions and CV risk
• Intervention trials: – Positive in primary prevention (STOP-NIDDM)1 – Negative in secondary prevention (HEART2D-
NAVIGATOR)2,3 (In both HEART2D 2 and NAVIGATOR 3 the goal of
reducing PPG was not achieved) – Positive, in a post-hoc analysis of the HEART2D Study, in
the older patients and in patients with longer duration of the disease4
1. Chiasson JL, et al. JAMA 2003;290:486-94 2. Raz I, et al. Diabetes Care 2009;32:381–386 3. NAVIGATOR study Group. N Engl J Med 2010;362:1463–1476 4. Raz et al Diabetes care 2011;34:1511-1513
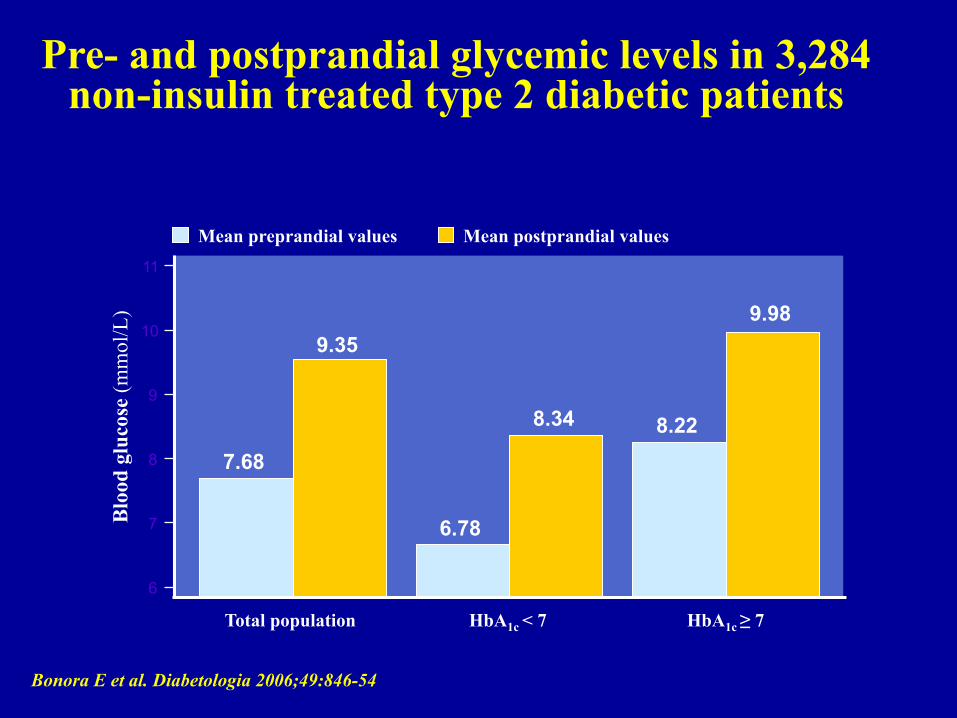
Pre- and postprandial glycemic levels in 3,284 non-insulin treated type 2 diabetic patients
11
10
9
8
7
6
Blo
od g
luco
se (m
mol
/L)
Mean preprandial values Mean postprandial values
Total population
7.68
9.35
HbA1c < 7
6.78
8.34
HbA1c ≥ 7
8.22
9.98
Bonora E et al. Diabetologia 2006;49:846-54
50
100
150
250
450
350
3 7 11 3 7 11 3 7 11 3 7 11 7
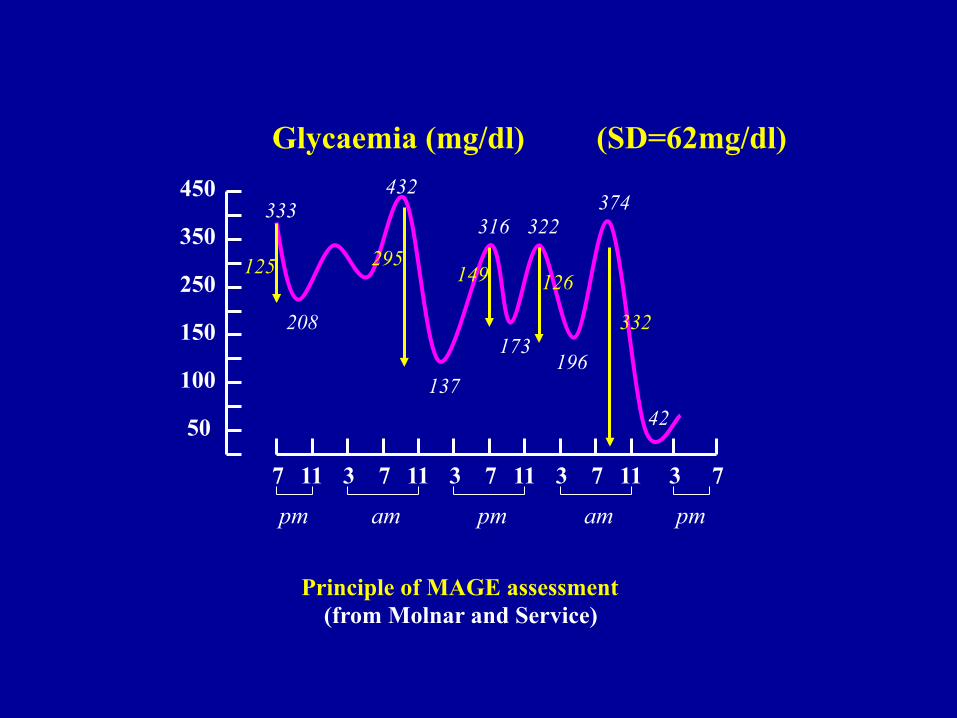
Principle of MAGE assessment (from Molnar and Service)
am pm am pm pm
Glycaemia (mg/dl) (SD=62mg/dl)
333
208
137
316
173
322
196
374
42
125 295 149 126
332
432
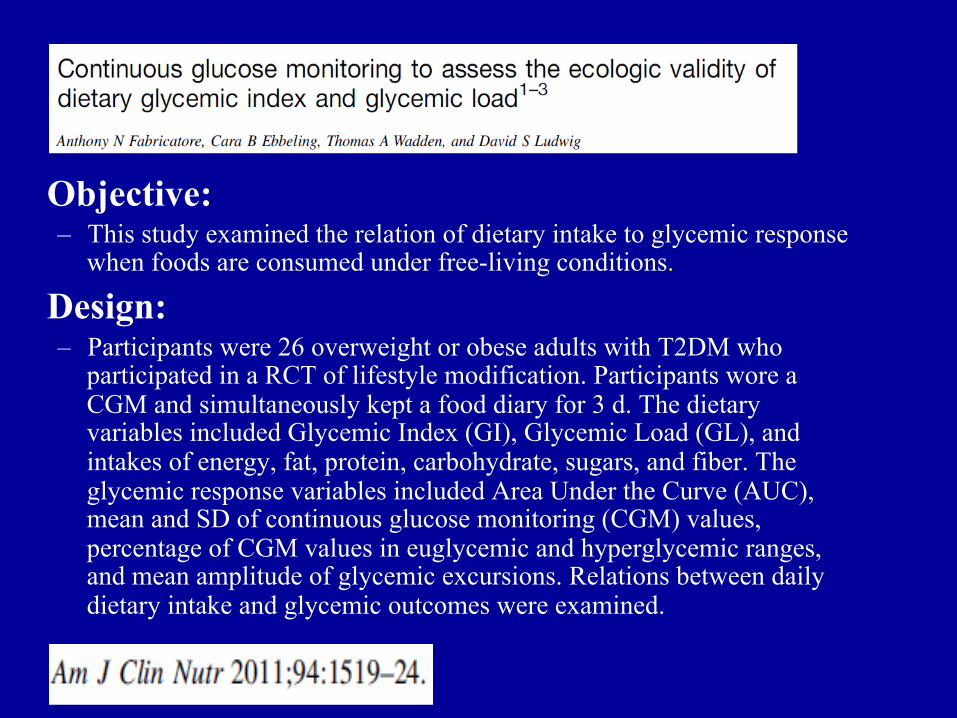
Objective: – This study examined the relation of dietary intake to glycemic response
when foods are consumed under free-living conditions.
Design: – Participants were 26 overweight or obese adults with T2DM who
participated in a RCT of lifestyle modification. Participants wore a CGM and simultaneously kept a food diary for 3 d. The dietary variables included Glycemic Index (GI), Glycemic Load (GL), and intakes of energy, fat, protein, carbohydrate, sugars, and fiber. The glycemic response variables included Area Under the Curve (AUC), mean and SD of continuous glucose monitoring (CGM) values, percentage of CGM values in euglycemic and hyperglycemic ranges, and mean amplitude of glycemic excursions. Relations between daily dietary intake and glycemic outcomes were examined.
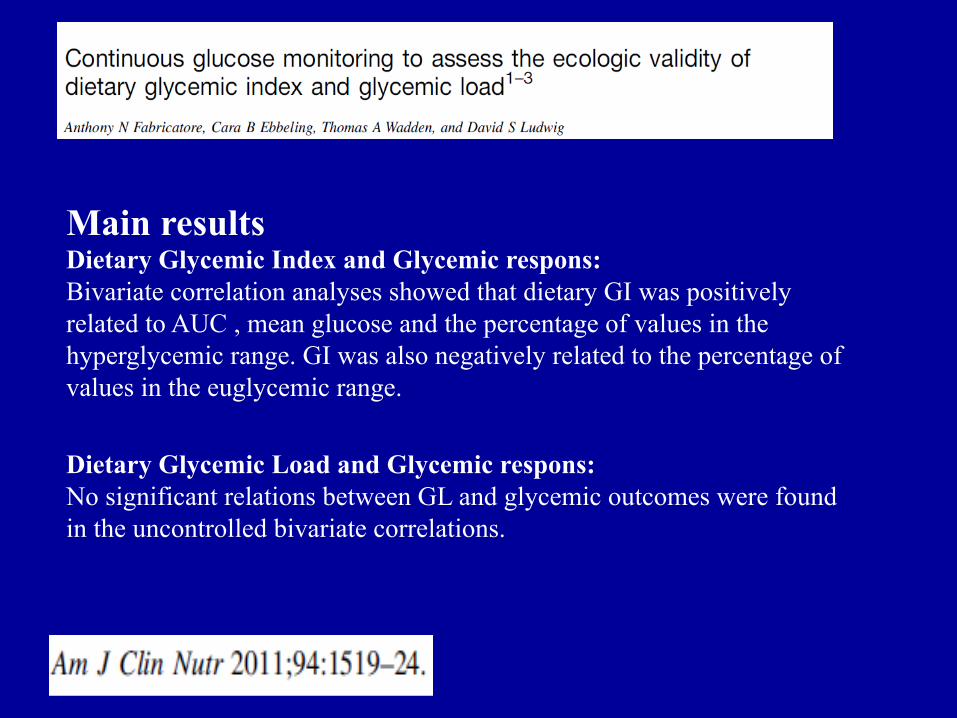
Main results Dietary Glycemic Index and Glycemic respons: Bivariate correlation analyses showed that dietary GI was positively related to AUC , mean glucose and the percentage of values in the hyperglycemic range. GI was also negatively related to the percentage of values in the euglycemic range. Dietary Glycemic Load and Glycemic respons: No significant relations between GL and glycemic outcomes were found in the uncontrolled bivariate correlations.
Conclusion – The data support the ecologic validity of the GI and GL constructs in
free-living obese adults with type 2 diabetes. GI was the strongest and the most consistent independent predictor of glycemic stability and variability.

• This study aims to determine the peak timing of postprandial blood glucose level (PBGL) of two breakfasts with different glycemic index (GI) in gestational diabetes mellitus (GDM).
• Ten women with diet-controlled GDM who were between 30 and 32 weeks of gestation were enrolled in the study. They consumed two carbohydrate controlled, macronutrient matched bread-based breakfasts with different GI (low vs. high) on two separate occasions in a random order after an overnight fast. PBGLs were assessed using a portable blood analyser.
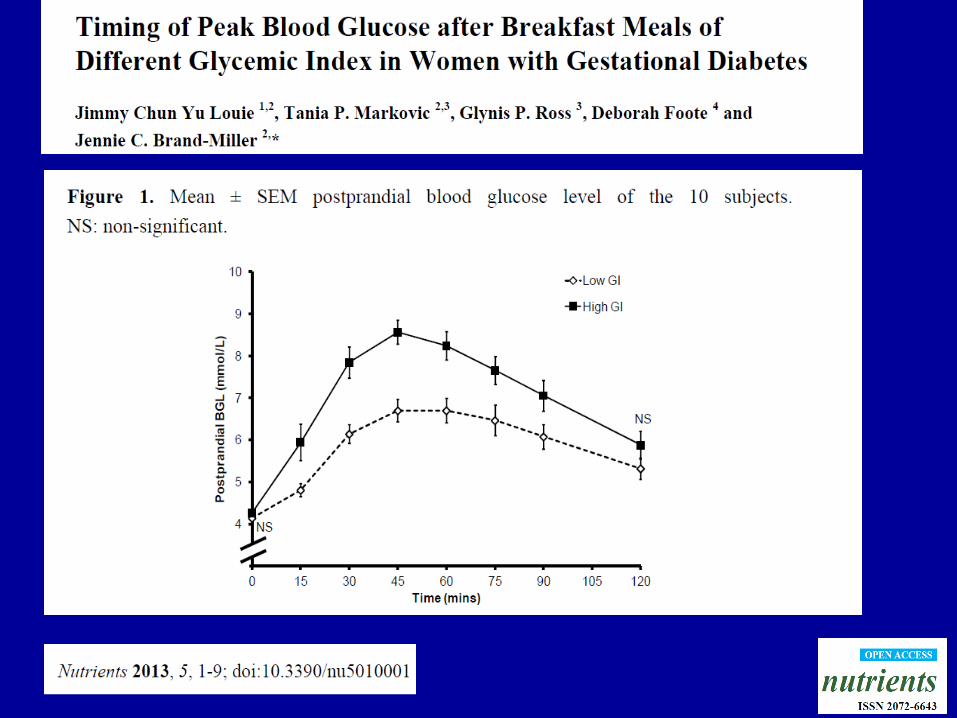
Conclusion: • the low GI breakfast produced lower postprandial glycemia, and the peak PBGL occurred closer to the time recommended for PBGL monitoring (i.e., 1 h postprandial) in GDM than a macronutrient matched high GI breakfast.
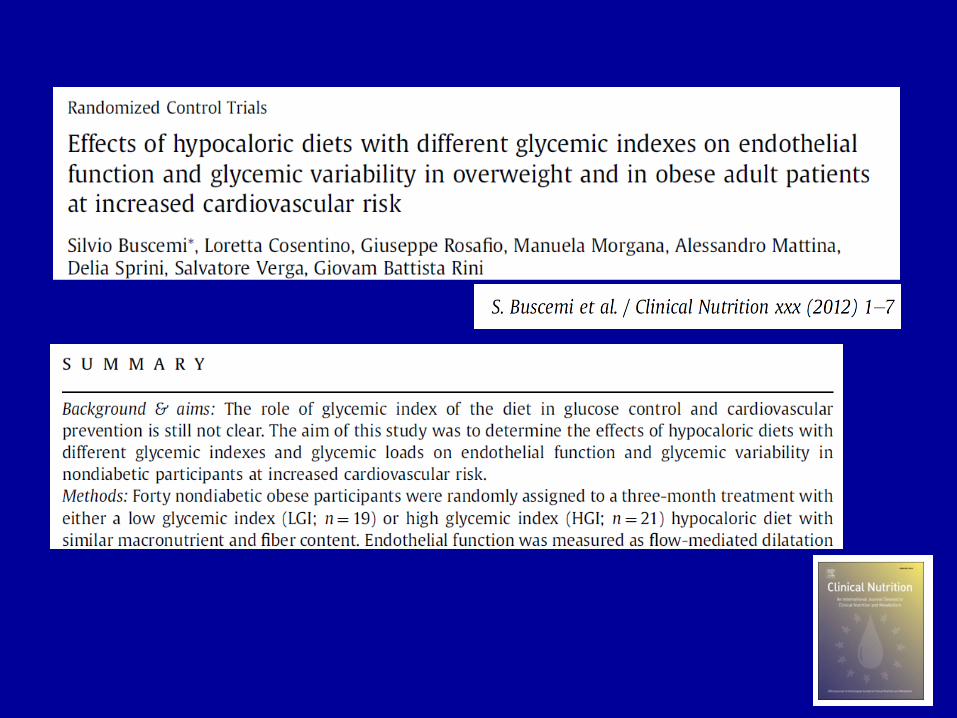

• Results: – The glycemic index of the diet significantly influenced the FMD (P <
0.005). In particular, the change of FMD was 2.3 2.6% following the LGI diet, and 0.9 3.6% after the HGI diet (P < 0.005).
– The glycemic index of the diet significantly influenced the 48-h glycemic variability measured as coefficient of variability (CV%; P< 0.001). The CV% decreased after the LGI diet (from 23.5 to 20.0%) and increased after the HGI diet (from 23.6 to 26.6%).
– The change in percentage of FMD was inversely correlated with the change in the 48-h glycemic CV% (r¼0.45; P < 0.05).
Conclusions: Endothelial function and glycemic
variability ameliorate in association with the adherence
to an LGI hypocaloric diet in nondiabetic obese persons

Characterizing Glucose Exposure for Individuals with
Normal Glucose Tolerance Using Continuous Glucose
Monitoring and Ambulatory Glucose Profile Analysis
R.S. Mazze, E. Strock, D. Wesley, S. Borgman, B. Morgan, R. Bergenstal and R. Cuddihy
Diabetes Technology & Therapeutics 2008 ;10:149-598
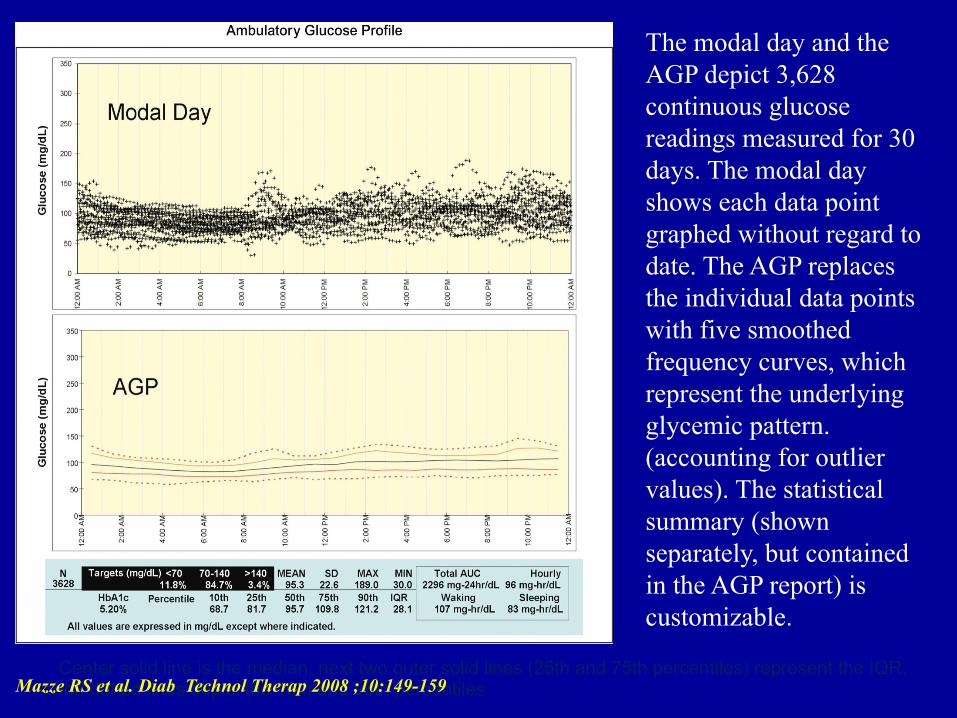
The modal day and the AGP depict 3,628 continuous glucose readings measured for 30 days. The modal day shows each data point graphed without regard to date. The AGP replaces the individual data points with five smoothed frequency curves, which represent the underlying glycemic pattern. (accounting for outlier values). The statistical summary (shown separately, but contained in the AGP report) is customizable.
Center solid line is the median, next two outer solid lines (25th and 75th percentiles) represent the IQR, the dotted lines depict the 10th and 90th percentiles Mazze RS et al. Diab Technol Therap 2008 ;10:149-159
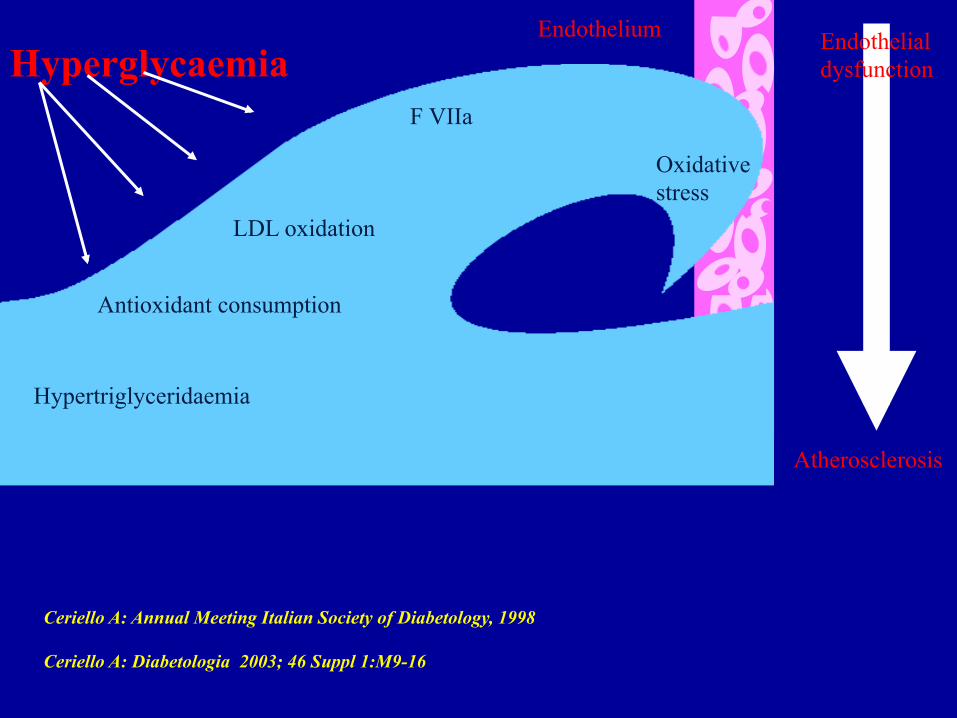
Oxidative stress
LDL oxidation
Antioxidant consumption
F VIIa
Hypertriglyceridaemia
Endothelium Endothelial dysfunction
Atherosclerosis
Hyperglycaemia
Ceriello A: Annual Meeting Italian Society of Diabetology, 1998 Ceriello A: Diabetologia 2003; 46 Suppl 1:M9-16
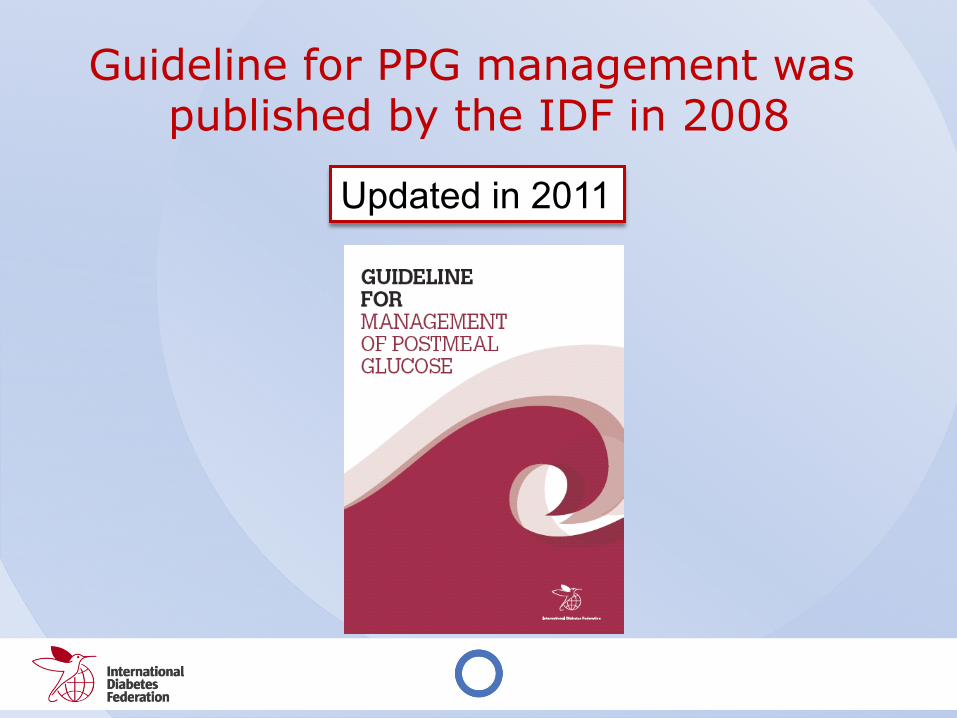
Updated in 2011
Guideline for PPG management was published by the IDF in 2008
CIMT = carotid-intima-media thickness
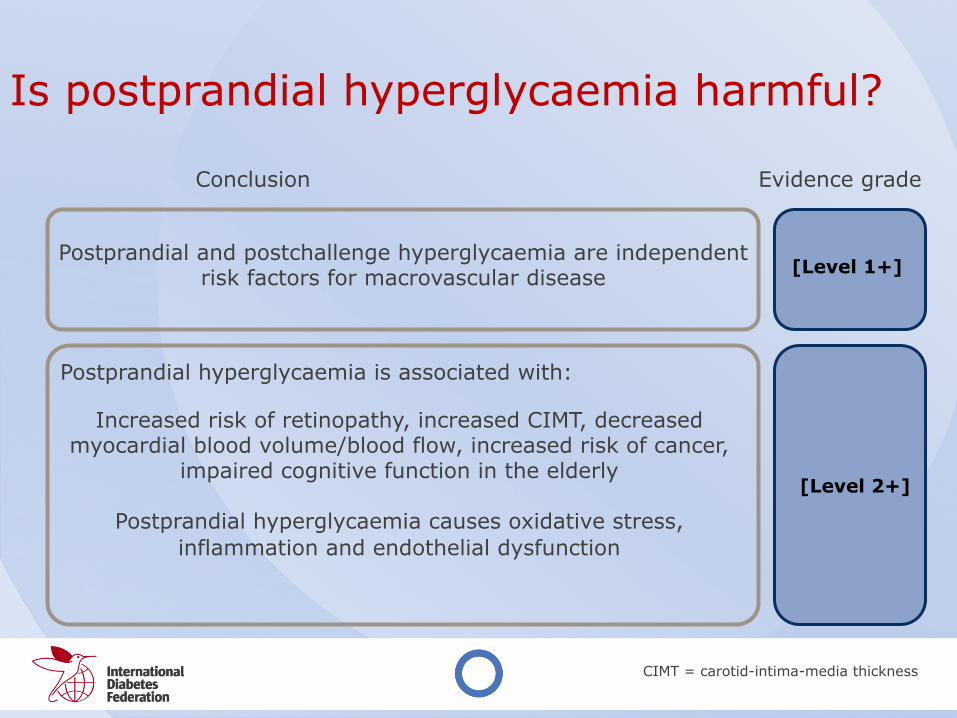
Is postprandial hyperglycaemia harmful?
Postprandial and postchallenge hyperglycaemia are independent risk factors for macrovascular disease
[Level 1+]
Postprandial hyperglycaemia is associated with:
Increased risk of retinopathy, increased CIMT, decreased myocardial blood volume/blood flow, increased risk of cancer,
impaired cognitive function in the elderly
Postprandial hyperglycaemia causes oxidative stress, inflammation and endothelial dysfunction
[Level 2+]
Conclusion Evidence grade
Is postprandial hyperglycaemia harmful?
Postprandial hyperglycaemia is harmful and should be addressed
IDF Recommendation:

Is treatment of postprandial hyperglycaemia beneficial?
There is currently a lack of randomised clinical trial evidence that correcting postprandial hyperglycaemia improves clinical outcomes
[Level 1]
Treatment with agents which target postprandial plasma glucose reduces vascular events in primary prevention [Level 1-]
Conclusion Evidence grade
Targeting both postprandial plasma glucose and fasting plasma glucose is an important strategy for achieving optimal glycaemic control
[Level 1+]
Is treatment of postprandial hyperglycaemia beneficial?
Implement treatment strategies to lower postprandial plasma glucose in people with postprandial hyperglycaemia.
IDF Recommendation:

Which therapies are effective in controlling postprandial plasma glucose?
Diets with a low glycaemic load are beneficial in improving glycaemic control
[Level 1+]
Several pharmacological agents preferentially lower postprandial plasma glucose [Level 1++]
Conclusion Evidence grade
Which therapies are effective in controlling postprandial plasma glucose?
A variety of both non-pharmacologic and
pharmacologic therapies should be considered to target postprandial plasma glucose
IDF Recommendation:
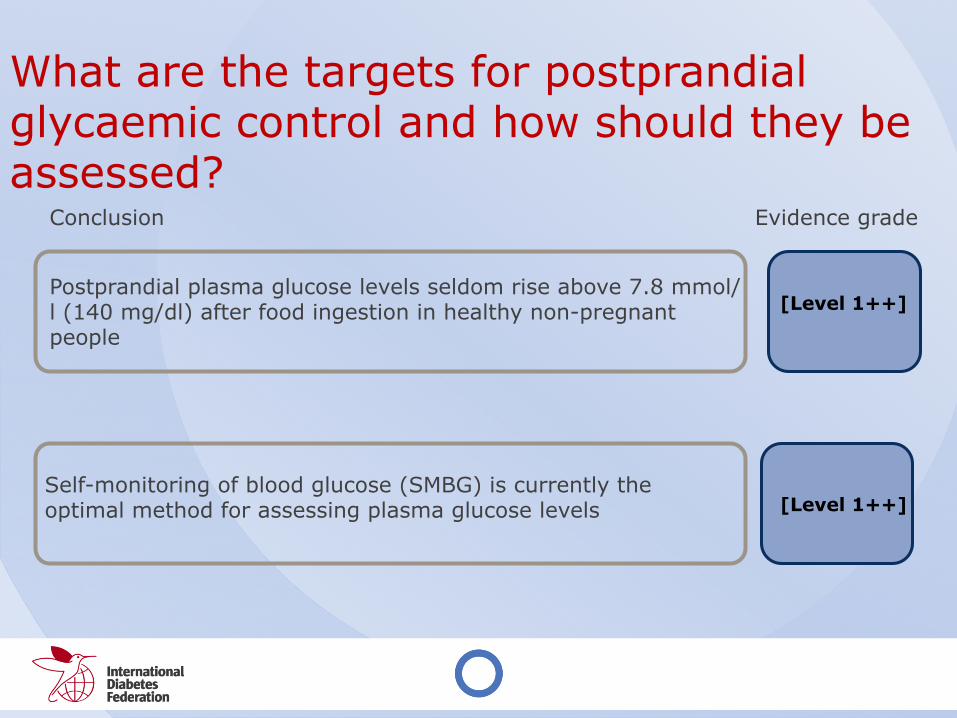
What are the targets for postprandial glycaemic control and how should they be assessed?
Postprandial plasma glucose levels seldom rise above 7.8 mmol/l (140 mg/dl) after food ingestion in healthy non-pregnant people
[Level 1++]
Self-monitoring of blood glucose (SMBG) is currently the optimal method for assessing plasma glucose levels [Level 1++]
Conclusion Evidence grade
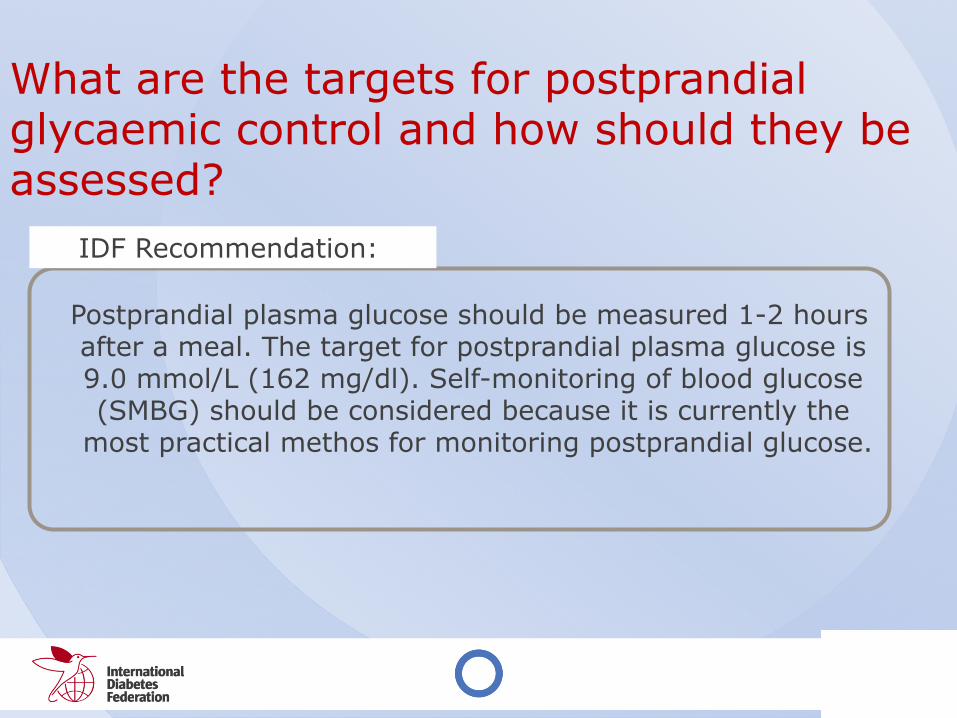
What are the targets for postprandial glycaemic control and how should they be assessed?
Postprandial plasma glucose should be measured 1-2 hours after a meal. The target for postprandial plasma glucose is 9.0 mmol/L (162 mg/dl). Self-monitoring of blood glucose (SMBG) should be considered because it is currently the
most practical methos for monitoring postprandial glucose.
IDF Recommendation: