Embed Size (px)
Citation preview

70
potential duration of active recreation season based on bioclimatic evaluation
S. DeStanIstanbul University, Department of Forest Management, Faculty of Forestry, 34473 Bahcekoy, Istanbul, Turkey
abstract
DeStan, S., 2013. Potential duration of active recreation season based on bioclimatic evaluation. Bulg. J. Agric. Sci., 19: 70-80
the objective of this study is to determine the bioclimatic recreation potential of a forest area located just north of Istanbul. the stages of the study covered: identifying the climatic and bioclimatic parameters, characterizing and evaluating the weather conditions, determining the bioclimatic characterization of the air temperature variation, the bioclimatic characteristics of the local weather conditions and a bioclimatic evaluation of the daytime weather conditions. the bioclimatic recreation potential is related to the various levels of human body activity during forest recreation. therefore, forest recreation can be categorized into activities with ‘high’, ‘moderate’ or ‘low’ human body activity. the accepted mean and borderline bioclimatic values for the various levels of human body activity were calculated using international standards, heat indices and data from previous studies of this area. the obtained results were correlated and analyzed with regard to the distribution of the average number of visitors in the area for the periods between 1970-1985 and 1990-2008. e established a clear link between the number of visits and types of physical activity to weather conditions. Compared with raw meteorological data, the potential for lower body activity decreased by 6.5%, the moderate body activity by 12.1%, while high body activity by 14.1%. Weighted average reduction was 11.2%, which equaled 18.1 days with 14 hours in the day for recreation. this classic approach to assessing the bio-climatic, combined with levels of physical activity, allows for specific forest management decisions in shaping the forest recreation areas.
Key words: forest recreation, bioclimatic, thermal comfort, body activity, forest management
Bulgarian Journal of Agricultural Science, 19 (No 1) 2013, 70-80Agricultural Academy
E-mail: [email protected]
introduction
nowadays, human activities occur in time of inten-sive urbanization and industrialization. therefore, op-timal solutions should be sought to ensure an optimal thermal environment for people. these require universal bioclimatic standards, which are to be used in planning open spaces. to achieve that, there are ongoing discus-sions on the Universal thermal Climate Index (UtCI) developed by the International Society on Biometeorol-ogy (ISB) Commission 6 and the european COSt ac-tion 730 (Jendritzky and de Dear, 2008; Jendritzky et al., 2008). at the same time the demand for forest recreation
services is on the increase. tourism is also sensitive to climate changes, which directly or indirectly affect a wide range of natural resources critical for it (Scott et al., 2009). the same author argues that unfortunately, the knowledge of climate impact on tourism as well as of climatic changes affecting this sector is limited. the work of de Freitas (2003) grew from initiatives of the In-ternational Society of Biometeorology’s Commission on Climate, tourism and Recreation (ISBCCtR). the ISB-CCtR was formed during the 15th Congress of the ISB held in november 1999 in Sydney, australia. among the issues discussed there was the need for a tourism cli-mate index (or indices) that integrates all facets of cli-

Potential Duration of Active Recreation Season Based on Bioclimatic Evaluation 71
mate, uses standard data and is objectively tested and verified. The objective of similar studies has also been to determine and forecast the bioclimatic tourism poten-tial at local and regional levels. For example, Matzarakis et al. (2007), based on 10-day intervals, forecasted the tourism potential of the low mountain ranges in Ger-many after a change in the climate conditions. the re-sults were presented using a Climate tourism Informa-tion Scheme (CtIS) based on biometeorological, physi-cal and aesthetic criteria as well as on the frequency of extreme meteorological phenomena. Having the same objective but approaching it through regional climate simulations, endler et al. (2009) analyzed the potential adaptability of tourism in the low mountain ranges in Germany for the period 1961-2050. to produce the cli-matological diagrams of the bioclimatic potential of a Croatian island off the adriatic coast, Zaninovich and Matzarakis (2009) also used data over 10-day intervals. according to the same authors, the availability of both climatic and bioclimatic data is extremely valuable to tourists as this enables them to choose the most suitable holiday period meeting their preferences and require-ments. a similar study by Blazejczyk (2002) based on the heat balance of the human body worked out a biocli-matic calendar for outdoor recreation in Warsaw using a number of climatic and meteorological data. In addition, holidaymakers travelling to long-distance destinations often experience thermally induced physiological strain called “acclimatization thermal loading” (atL) by De Freitas and Grigorieva (2009). to estimate, for practical purposes, the atL when such a trip goes through differ-ent climate conditions, these researchers developed the acclimatization thermal Strain Index (atSI). Matzara-kis et al. (1999) and Jendritzky et al. (2001) also worked on “universal thermal index” for “assessing climate for tourism purposes” (Matzarakis, 2001) and “adaptation to the tourism and recreation” Scott et al. (2009).
One of the biggest problems of forest recreation is the practical inapplicability of the results of bioclimatic studies. thus, the results of bioclimatic studies help in forest management of forest recreation areas in relation to stand structure to provide an ergonomic environment for visitors.
the reason is the lack of interdisciplinary studies with general-purpose applications.
a primary aim of this illustrative study is to deter-mine the bioclimatic recreation potential by type of hu-man body activity, and to establish its correlation with the distribution of the average number of visitors in the studied area for the periods between 1970-1985 and 1990-2008. along with this, a derivative aim of the study is to ascertain if it is possible to develop a realistic biocli-matic calendar based on 10-day intervals by using only regional climate data obtained from previous regional studies as well as the accepted international standards. the main objective of the study is to compile enough de-tailed results that can be used in the forest management practice for planning forest areas for recreation.
the object of study and materials
the object of study is the forest area located in close proximity north of Istanbul. It comprises 12 recreation zones visited by the citizens of the megalopolis. Its boundaries were defined based on the results obtained from the climatic study of east thrace by Irmak et al (1980). this hilly region has a relatively homogenous distribution of the most important climate parameters: air temperature, precipitation, relative air humidity and characteristic meteorological phenomena (Figure 1).
the data used in the study was received from the Bahcekoy Meteorological Station in Büyükdere, locat-ed at an altitude of 129.63 m, 49009′ N and 29003′ E, and local time difference of 64 minutes. From tables of me-teorological observations are derived data covering 42 years: from 1964 to 2004.
According to the accepted classifications for cat-egory, type and class, the recreation in this area falls
fig. 1. location of object of study
72 S. Destan
into: the category of relaxational and educational for-est recreation; the type of summer palliative recreation with only daytime visitors; the class of quiet recreation with low-level physical activities, walking, mass events and games with moderate level physical activities, and a small part belongs to the sports and fitness class requir-ing a high level of physical activity.
methodology
the theoretical basis for determining the bioclimatic recreation potential of the studied area is the classifi-cation by Tishkov (1989). This classification was made using the steps of the Integrated Climate analysis de-veloped and applied in different variants in eastern eu-rope. the methodology is presented below and has the following stages:
Identifying the bioclimatic parameters, characterizing and evaluating the weather conditions
the data used served as the basis for the calculation of the following climate parameters: mean air temper-atures (0C); number of days with degree of cloudiness in the ranges: 0.0–1.9; 2.0–8.0 and 8.1–10.0; air tempera-ture (0C) from 7 am to 9 pm; relative air humidity (%) from 7 am to 9 pm; duration of sunshine; number of days with decreased visibility (up to 1000 m); number of days with strong wind and thunderstorms; number of days with snowfall and snow cover; number of days with snow or rainfall; number of days with average relative air humidity of over 70%; water vapour pressure (mb); mean air and thermal sensitivity temperature (tH) in June, July and august. the sensible temperature was calculated using air temperature and humidity values from the following formula (Palmer, 1997):
TH = - 42.379 + 2.04901523 * T + 10.1433312 * RH - 0.22475541 * RH - 6.83783 * 10-3 *T2 - 5.481717 * 10-2 * RH + 8.5282 * 10-4 * T * RH2 - 1.99 * 10-5 *
Where, t – is the air temperature in ºF; RH – is the relative humidity in percentage. this formula calculat-ed the sensible temperature in ºF, and this value was converted to ºC. the cooling wind effect at low temper-atures was calculated using the Cactus2000 Converter for Wind Speed.
the next stage of the methodology involved deter-mining the bioclimatic characteristics of the air tem-perature variation. the aim of this was to establish the thermal potential of the aboveground air layer and the potential thermal comfort perceived by people. Using the above-mentioned climate and bioclimatic parame-ters, the following indicators were established: daytime and day-to-day temperature amplitudes. these biocli-matic indicators express the frequency of changes dur-ing the daytime and day after day. They were classified in groups based on their impact on the thermodynamics of the human body.
the daytime temperature amplitudes (at intervals of 40C) can be:
indifferent amplitudes (0-4• 0C) which indicate body thermal comfort during mass recreation activities un-der favourable climate conditions;transitional amplitudes (4.1-8.0• 0C) which are easily endured by healthy people, and therefore they are re-garded as not restricting mass recreation activities;sensitive amplitudes (8.1-12• 0C) which are temperature amplitudes perceived by healthy people, causing them negative body responses; therefore these amplitudes indicate a lack of thermal comfort during recreation activities;irritating amplitudes (>12• 0C) which are strongly per-ceived amplitudes causing disruption of the thermal balance of a healthy individual; to a larger degree, they make mass recreation activities impossible (tish-kov, 1989).
the day-to-day temperature amplitudes (at inter-vals of 20C) show the increase or decrease of the mean temperature over a 24-hour period in comparison with the one of the next 24-hour period. and daily tempera-ture variations are divided into four groups: indifferent (0–20C); transitional (2.1–40C); sensitive (4.1–60C; irri-tating (> 120C) (tishkov, 1989).
Bioclimatic evaluation of daily weather conditions is made in respect of human body activity during rec-reation in forests. The classification by Tishkov (1989) was also used to characterize the daytime weather con-ditions from a medical and climatic point of view. ac-cording to this classification, the results of the biocli-matic evaluation were grouped into three categories:
Without time Restrictions (WtR) category indicates •

Potential Duration of Active Recreation Season Based on Bioclimatic Evaluation 73
the potential for a prolonged outdoor activity;time With Partial Restrictions (tWPR) category is • a weather condition with short contrasting daytime weather variations typical of the respective area which requires temporary (partial) discontinuation of some types of recreation activities; this is an indicator of a restricted potential for daytime recreation activities;time Constraints (tC) category is a weather condi-• tion with long-lasing contrasting changes or extreme-ly adverse daytime conditions, which require discon-tinuation of all types of recreation activities (tishkov, 1989).
the evaluation was made based on criteria, stan-dards and factors related to the various levels of human body activity during recreation. therefore, recreation was categorized into activities with ‘high’, ‘moderate’ or ‘low’ human body activity. the range of recreation activities considered for the purposes of this study com-prised activities of all categories and types of recreation typical of the studied area. the results were summa-rized based on the above-mentioned categories (WtR, tWPR and tC). the summary is the generalized evalu-ation of the bioclimatic recreation potential of the area.
the values of the various parameters for the vari-ous levels of human body activity were obtained from the studies of Bahadir and Shen (1996) on the effect of sensitive temperatures in turkey in terms of the human health (table 1).
these effects and their related temperature ranges, however, are valid at a very low airflow velocity (up to 0.1 m/sec) as well as indoors. In fact, the greater part of the studies on this factor is valid for indoor spaces. For example Wigo and Knez (2005) studied the effect of
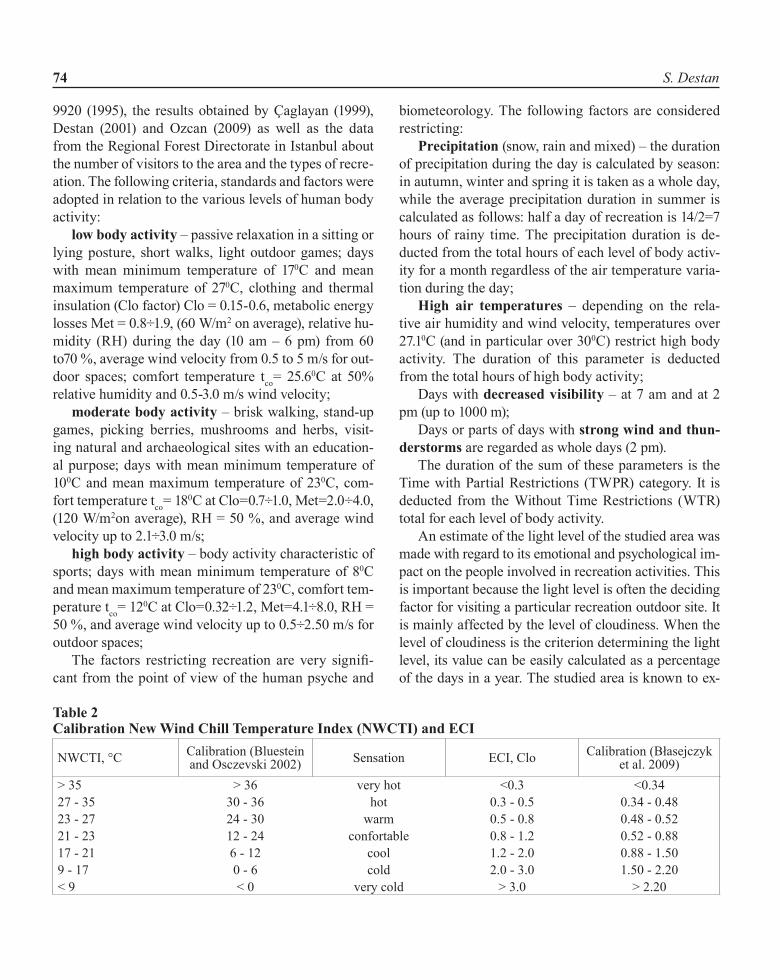
low (0.15 m/sec) and high (0.25 m/sec) air velocity in a classroom. the participants in the experiment said that the air temperature had decreased during the experi-ment although it had been increased from 21°C to 24°C (at air velocity of 0.15 m/sec) and from 25°C to 27°C (at air velocity of 0.25 m/sec). Kaynakli and Yilmazkara-deniz (2003) found out that the comfort air temperature of 25.5ºC at air velocity of 0.1 m/sec changed at air ve-locity of 0.5 m/sec to 27.8ºC. the literature focusing on thermal comfort of indoor spaces says that any decrease of the relative humidity by 10% requires an increase of the air temperature by 0.3ºC. Overall, the studies show the great combined effect of air temperature, humidity and velocity on the thermal body comfort. this study made use of the new Wind Chill temperature Index (nWCtI) and expected Clothing Insulation (eCI), as well as their calibrated results (table 2)
Blazejczyk et al. (2009) argued that with respect to the averaged dynamic thermal sensation, the UtCI val-ues between 18 and 26ºC may comply closely with the definition of the “thermal comfort zone” supplied in the Glossary of terms for thermal Physiology (IUPS ther-mal Commission, 2003). the UtCI equivalent tempera-ture categorized in terms of thermal stress is as follows: above +46ºC extreme heat stress; +38ºC to +46ºC very strong heat stress; +32ºC to +38ºC strong heat stress; +26ºC to +32ºC moderate heat stress; +9ºC to +26ºC no thermal stress; +9ºC to 0ºC slight cold stress; 0ºC to -13ºC moderate cold stress.
the bioclimatic evaluation of daytime weather con-ditions was made taking into account the results of the above-mentioned studies, the standards aSHRae 55-2004 (1995) ISO 7730 (1995), ISO 8996 (1990) and ISO
table 1 temperature-Humidity index (part of the table bahadir and shen 1996)temperature,ºC
Relative Humidity, %Category
10 20 30 40 50 60 70 80 9025 22 23 24 25 25 26 26 27 27 IV: 27-31ºC - exhaustion, nervousness and circulatory26 22 24 25 26 26 27 27 28 29 and respiratory disorders duе to the effect27 24 25 26 26 27 28 29 30 31 and duration of a stay under stress conditions28 25 26 27 27 29 30 32 33 35 III: 32-40ºC - Strong thermal stresses leading29 27 28 29 30 31 32 34 36 39 heat cramps and heat exhaustion to sunstrokes,
30 27 29 29 31 32 33 36 38 43 II: 41-53ºCStrong thermal stresses leading to heatstrokes
74 S. Destan
9920 (1995), the results obtained by Çaglayan (1999), Destan (2001) and Ozcan (2009) as well as the data from the Regional Forest Directorate in Istanbul about the number of visitors to the area and the types of recre-ation. the following criteria, standards and factors were adopted in relation to the various levels of human body activity:
low body activity – passive relaxation in a sitting or lying posture, short walks, light outdoor games; days with mean minimum temperature of 170C and mean maximum temperature of 270C, clothing and thermal insulation (Clo factor) Clo = 0.15-0.6, metabolic energy losses Met = 0.8÷1.9, (60 W/m2 on average), relative hu-midity (RH) during the day (10 am – 6 pm) from 60 to70 %, average wind velocity from 0.5 to 5 m/s for out-door spaces; comfort temperature tco= 25.60C at 50% relative humidity and 0.5-3.0 m/s wind velocity;
moderate body activity – brisk walking, stand-up games, picking berries, mushrooms and herbs, visit-ing natural and archaeological sites with an education-al purpose; days with mean minimum temperature of 100C and mean maximum temperature of 230C, com-fort temperature tco= 180C at Clo=0.7÷1.0, Met=2.0÷4.0, (120 W/m2on average), RH = 50 %, and average wind velocity up to 2.1÷3.0 m/s;
high body activity – body activity characteristic of sports; days with mean minimum temperature of 80C and mean maximum temperature of 230C, comfort tem-perature tco= 120C at Clo=0.32÷1.2, Met=4.1÷8.0, RH = 50 %, and average wind velocity up to 0.5÷2.50 m/s for outdoor spaces;
The factors restricting recreation are very signifi-cant from the point of view of the human psyche and
biometeorology. the following factors are considered restricting:
precipitation (snow, rain and mixed) – the duration of precipitation during the day is calculated by season: in autumn, winter and spring it is taken as a whole day, while the average precipitation duration in summer is calculated as follows: half a day of recreation is 14/2=7 hours of rainy time. the precipitation duration is de-ducted from the total hours of each level of body activ-ity for a month regardless of the air temperature varia-tion during the day;
High air temperatures – depending on the rela-tive air humidity and wind velocity, temperatures over 27.10C (and in particular over 300C) restrict high body activity. the duration of this parameter is deducted from the total hours of high body activity;
Days with decreased visibility – at 7 am and at 2 pm (up to 1000 m);
Days or parts of days with strong wind and thun-derstorms are regarded as whole days (2 pm).
the duration of the sum of these parameters is the time with Partial Restrictions (tWPR) category. It is deducted from the Without time Restrictions (WtR) total for each level of body activity.
an estimate of the light level of the studied area was made with regard to its emotional and psychological im-pact on the people involved in recreation activities. this is important because the light level is often the deciding factor for visiting a particular recreation outdoor site. It is mainly affected by the level of cloudiness. When the level of cloudiness is the criterion determining the light level, its value can be easily calculated as a percentage of the days in a year. the studied area is known to ex-
table 2 calibration new Wind chill temperature index (nWcti) and eci
nWCtI, °C Calibration (Bluestein and Osczevski 2002) Sensation eCI, Clo Calibration (Błasejczyk
et al. 2009)> 35 > 36 very hot <0.3 <0.3427 - 35 30 - 36 hot 0.3 - 0.5 0.34 - 0.4823 - 27 24 - 30 warm 0.5 - 0.8 0.48 - 0.5221 - 23 12 - 24 confortable 0.8 - 1.2 0.52 - 0.8817 - 21 6 - 12 cool 1.2 - 2.0 0.88 - 1.509 - 17 0 - 6 cold 2.0 - 3.0 1.50 - 2.20< 9 < 0 very cold > 3.0 > 2.20

Potential Duration of Active Recreation Season Based on Bioclimatic Evaluation 75
perience precipitation at cloudiness above level 6. Level 6 to 8 cloudiness was characteristic of approximately ¼ of the days with level 2-8 cloudiness. this was found out by comparing the data about cloudiness, precipita-tion and sunshine duration obtained from the respective tables of meteorological observations. However, the cal-culations made of the light level were provisional and in-dexed only against precipitation. to calculate accurately the light level, detailed data about sunshine duration can be used. For example, the total annual sunshine duration of the studied area is 2316.1 hours. theoretically, the av-erage duration of recreation activities in the studied area during the active season of recreation is 14 hours. there-fore, the light level is [(2316.1/14)/365]*100 = 45.3% of the total number of days in a year. Using the same meth-od, the light level during the active season of recreation (april, May, June, July and august) is 62.4%.
Determining the duration of the potential and real active recreation season
the Potential active Recreation Season (PaRS) is an important indicator of the potential for organizing mass recreation activities. In order to determine it, the results about the potential monthly distribution of rec-reational activities by body activity estimated based on the bioclimatic evaluation of the daytime weather con-ditions were used.
Determining the Real Active Recreation Season (RARS)
With the purpose of comparing the PaRS with the RaRS of the area, it was necessary to update the em-pirically determined real active recreation seasons for the periods between 1970-1985 by Pehlivanoglu (1986) and 1990-2000 by Destan (2001). It has been accepted that the duration of the RaRS should be calculated using the minimum number (or percentage) of visitors calculated in advance and serving as a borderline value of mass rec-reation. this is the minimum number of visitors, which delimits the beginning and the end of the RaRS. the lim-iting criterion is the degree of mass recreation, required services in the area and profitability. According to these criteria, 68% (± 3%) of the total number of visitors come to the area in this period. In fact, they represent the major-ity whose requirements should be given priority consider-ation when planning the forest recreation in the area.
results
the results are presented in a sequence following the stages of the study. the graphs are given in sets in order to be easily used; at the same time, their understanding is facilitated by avoiding data overload and presenting monthly average values for part of the indicators. the ini-tial distribution of mean air temperatures (Figure 2a) was re-calculated into sensible temperatures (Figure 2b).
In order to account for the time with Partial Restric-tions (tWPR) category), the graphs showing the annual distribution of meteorological events (Figure 3a, 3b, 3c and table 3).
to determine the time Constraints (tC) category, the graphs of the daytime and day-to-day temperature amplitudes were produced (Figure 4a, 4b and 4c).
7
9
11
13
15
17
19
21
1 3 5 7 9 11 13 15 17 19 21 23 25 27 29 31 33 35
in hours
Decadesfig. 2a. annual distribution of mean air
temperatures in the studied area
79111315171921
1 3 5 7 9 11 13 15 17 19 21 23 25 27 29 31 33 35
in hours
Decades
26-27 25-26 24-25 23-24 22-23 21-22 20-21 19-20 18-1917-18 16-17 15-16 14-15 13-14 12-13 11-12 10-11 9-108-9 7-8 6-7 5-6 4-5 3-4 2-3 1-2 0-1
fig. 2b. annual distribution of mean sensible temperatures in the studied area

76 S. Destan
When determining the time Constraints (tC) cate-gory, the irritating daytime and day-to-day temperature amplitudes were regarded as continuing for 14 hours (for a whole day), while the sensitive ones – for half a day (14/2=7 hours). a more realistic graph of the results
was drawn (based on the rows in Figure 2b), along with the graph of the distribution of body activity types dur-ing daytime recreation (Figure 5). the next stage was producing the graph (Figure 6a) of the annual distribu-tion of the types of body activity while accounting for
table 3 duration of weather restricting recreationMonths I II III IV V VI VII VIII IX X XI XIIDays with low Visibility, days
7.00am 1.74 2.54 2.83 2.49 1.17 0.29 0.11 0.17 0.46 1.23 1.54 0.9114.00pm 1.00 0.94 1.14 0.40 0.14 0.00 0.00 0.00 0.00 0.03 0.20 0.37
Days of strong wind and storm, days
Strongwind 0.74 0.63 0.49 0.46 0.31 0.26 0.37 0.46 0.31 0.15 0.51 0.51Windstorm 0.00 0.00 0.00 0.00 0.00 0.00 0.00 0.03 0.00 0.00 0.00 0.00
10 8 94 2 1 1 2 2
6 7 10
12 10 9
8 119
14 14 109 11
11
88
8
9 9 1111 11
11 910
81 3 5
9 9 105 5 7 7 3 1
0%10%20%30%40%50%60%70%80%90%
100%
1 2 3 4 5 6 7 8 9 10 11 12
Fig.
4a.
Bet
wee
n da
ily te
mpe
retu
re a
mpl
itude
s, da
ys
Months
>12°C 8.1-12°C 4.1-8°C 0-4°C
14 13 15 13 17 1924 24
19 16 13 15
10 8 8 109
96 6
99
10 9
5 5 5 54 2 1 1 2
4 5 52 3 3 2 1 1 0 0 0 1 2 2
0%
20%
40%
60%
80%
100%
1 2 3 4 5 6 7 8 9 10 11 12Months
Fig.
4b.
Dai
ly te
mpe
ratu
re
diff
eren
ces,
days
6.1c 6.0c 4.0c 2.0c
37.2 40.8 35.728.217.2
7.2 4.7 7.7 822.224.616.8
1 2 3 4 5 6 7 8 9 10 11 12
Fig.
4c.
Tota
l hou
rs
Months
Distribution of "time with partial restrictions" for recreational activities
fig. 4a, 4b, 4c. bioclimatic characteristics of the air temperature variation
0
1
2
3
4
5
6
7
1 3 5 7 9 11 13 15 17 19 21 23 25 27 29 31 33 35
Num
ber f
o da
ys
Decades
"clear" degree 1.9"partly cloudy" degree 8.0"cloudy" degree 1.0
0
1
2
3
4
5
6
5
15
25
35
45
55
65
1 3 5 7 9 11 13 15 17 19 21 23 25 27 29 31 33 35Decades
Rai
nfal
l, m
m
Rainfall (mm)
Number of rainy days
Num
berof days
4
6
8
10
12
14
16
1 3 5 7 9 11 13 15 17 19 21 23 25 27 29 31 33 35
Pres
sure
of w
ater
vap
or,
mm
Decades
14,00 hoursAverage daily
fig. 3. more important climatic parameters in the studied area
Potential Duration of Active Recreation Season Based on Bioclimatic Evaluation 77
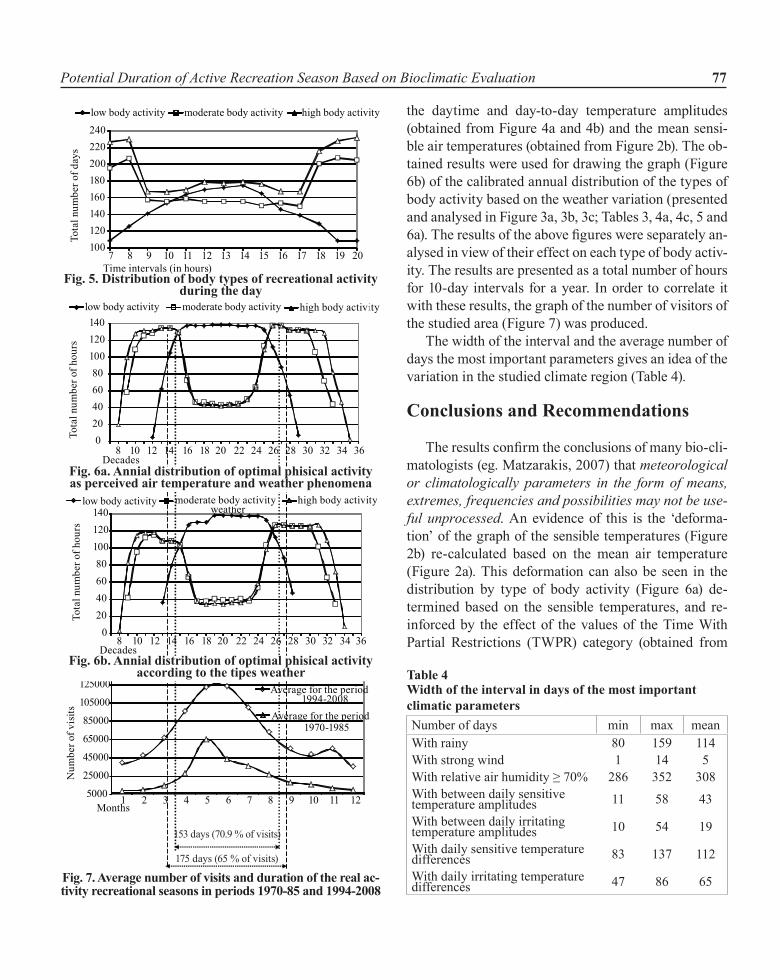
the daytime and day-to-day temperature amplitudes (obtained from Figure 4a and 4b) and the mean sensi-ble air temperatures (obtained from Figure 2b). the ob-tained results were used for drawing the graph (Figure 6b) of the calibrated annual distribution of the types of body activity based on the weather variation (presented and analysed in Figure 3a, 3b, 3c; tables 3, 4a, 4c, 5 and 6a). The results of the above figures were separately an-alysed in view of their effect on each type of body activ-ity. the results are presented as a total number of hours for 10-day intervals for a year. In order to correlate it with these results, the graph of the number of visitors of the studied area (Figure 7) was produced.
the width of the interval and the average number of days the most important parameters gives an idea of the variation in the studied climate region (table 4).
conclusions and recommendations
The results confirm the conclusions of many bio-cli-matologists (eg. Matzarakis, 2007) that meteorological or climatologically parameters in the form of means, extremes, frequencies and possibilities may not be use-ful unprocessed. an evidence of this is the ‘deforma-tion’ of the graph of the sensible temperatures (Figure 2b) re-calculated based on the mean air temperature (Figure 2a). this deformation can also be seen in the distribution by type of body activity (Figure 6a) de-termined based on the sensible temperatures, and re-inforced by the effect of the values of the time With Partial Restrictions (tWPR) category (obtained from
5000
25000
45000
65000
85000
105000
125000
1 2 3 4 5 6 7 8 9 10 11 12
Num
ber o
f vis
its
Months
Average for the period1994-2008
Average for the period1970-1985
100120140160180200220240
7 8 9 10 11 12 13 14 15 16 17 18 19 20
Tota
l num
ber o
f day
s
Time intervals (in hours)
low body activity moderate body activity high body activity
020406080
100120140
8 10 12 14 16 18 20 22 24 26 28 30 32 34 36
Tota
l num
ber o
f hou
rs
Decades
low body activity moderate body activity high body activity
020406080
100120140
8 10 12 14 16 18 20 22 24 26 28 30 32 34 36
Tota
l num
ber o
f hou
rs
Decades
weatherlow body activity moderate body activity high body activity
153 days (70.9 % of visits)
175 days (65 % of visits)
table 4 Width of the interval in days of the most important climatic parametersnumber of days min max meanWith rainy 80 159 114With strong wind 1 14 5With relative air humidity ≥ 70% 286 352 308With between daily sensitive temperature amplitudes 11 58 43
With between daily irritating temperature amplitudes 10 54 19
With daily sensitive temperature differences 83 137 112
With daily irritating temperature differences 47 86 65
fig. 6a. annial distribution of optimal phisical activity as perceived air temperature and weather phenomena
fig. 6b. annial distribution of optimal phisical activity according to the tipes weather
fig. 7. average number of visits and duration of the real ac-tivity recreational seasons in periods 1970-85 and 1994-2008
fig. 5. distribution of body types of recreational activity during the day

78 S. Destan
Figure 4c). However, the most pronounced deforma-tion is in the yearly distribution by type of body activ-ity based on the weather variations (Figure 6b). this graph shows the accumulation of the deformation effect of the sensible temperatures and the time with Partial Restrictions (tWPR) and time Constraints (tC) cat-egories. In comparison to Figure 6a, the potential for low body activity recreation shows a decrease by 126 hours (6.5%), the average body activity recreation by 277 hours (12.1%) and the high body activity recreation by 2181 hours (14.1%). the weighted average decrease was 11.2%, which equalled 18.1 days with 14 hours of daytime recreation. However, it should be noted that this decrease mainly concerned the RaRS. the dis-tribution by type of body activity in daytime (Figure 5) was shown as a number of days. these are the an-nual average results showing the potential for use. at the same time, they provide an answer to the question why the visitors to the area concentrate between 9 am and 6 pm. the plateau-like shape of the curves of the average and high body activity should be noted. this is due to both the hourly distribution of the high daytime temperatures and to the 10-day intervals within the hot summer season. the reasons for the deformations can easily be explained by the detailed graphic data of the rest of the figures.
as it was pointed out, Figure 6b takes into consid-eration all factors (a total of 12) which were analyzed with regard to their effect on each type of body activity separately. an analysis like this one may have a degree of subjectivism, and therefore, in order to overcome it, a careful approach should be adopted. there is also subjectivism in identifying the criteria, standards and factors characterizing the types of body activity. al-though international standards and results were used, the determined ranges of the types of body activity are, in essence, the thermal comfort zone established and accepted based on thermal indices and the physiologi-cal equivalent temperature (Pet). However, like many other researches, Höppe (1999) also claimed that nei-ther the Pet, nor the traditional thermal indices could be an absolute measure of thermal comfort. even these scientifically identified thermal indices had not been sufficiently tested on people, and did not account for the adaptability to climate conditions (Monteiro et al.,
2006). to solve these issues, calibration of equivalent index temperatures is now being applied along with their forecasting based on terrain tests (e.g. Monteiro et al., 2006). However, they are the standards only for the area where tested. another development of bio-climatic studies is determining the thermal ranges of the thermal comfort zone for people in different geographic areas and counties (e.g. Matzarakis and Hwang, 2009). With regard to planning forest recreation, the studies on the assessment of the thermal environment at a local level are even more important. analyzing this approach, Ma-teeva (2001) suggested the planning optimal recreation and tourism required detailed bio-climatic analyses at macro, meso and micro levels.
the updated results show that the PaRS begins on 21 March and ends on 10 September (175 days) which is 47.4% of the total days in a year. the total number of visitors during the PaRS is, on average, 582,776 people that is 65% of the total number of visitors to the study forest area being 3.82% in the period of 21-31 March and 3.2% in the period of 1-10 September. the differ-ence with the season length for the period of 1970-1985 (153 days) was 22 days or 14.3%, and this was used to update the season length. the reasons for this update were mainly due to the fact that the average number of total visitors for the last five years increased by 324% in comparison to the one for the period ending in 1985. all this proves that the recreation activities in the area changed both quantitatively and qualitatively. the ongo-ing urbanization of the Istanbul megalopolis (as of 2011 its population exceeds 13 million people, and it reaches 15 million people during the tourist season), the inten-sified industrialization as well as the insufficient green areas for recreation caused the quest for recreation in woodland environment. the qualitative changes led to the increased share of the types of recreation with aver-age and high body activity. Due to these changes, the potential for recreation with average and high body ac-tivity before 9 am and after 6 pm proved insufficient, and the process required the expansion of the Real ac-tive Recreation Season (RaRS). Of course, the process involved other social factors as well: non-working days, national holidays etc. these are related to the category of leisure time, standard of living, cultural level, educa-tion level etc., and can be studied in further studies.

Potential Duration of Active Recreation Season Based on Bioclimatic Evaluation 79
the purpose of this study is illustrative presentation of a relevant approach, which includes the idea that any user of any forestry can draw a calendar of bioclimatic potential recreation activities. the practical contribu-tion is the established bioclimatic calendar is tied to a specific bodily activity. This information is essential for planning forest recreation in order to take the right sil-vicultural decisions regarding the canopy cover, stand density, stocking level of a recreation area. this is con-firmed by studies as these by Holst et al. (2005) on the radiation balance of two forested slopes facing different directions, by Schiller (2001) who studied the micro-climate differences caused by different vegetative units and their impact on people engaged in recreation, by Irwan et al. (2006) on the effect of trees with different canopy covers and etc. this all allows taking the right decisions regarding the required ratio of ‘closed’, ‘semi-closed’, ‘semi-open’ and ‘open’ spaces in a recreation area in accordance with the types and classes of rec-reation in this woodland. Failure to take into account the factor of thermal body comfort has always led to inadequate forest management as well as to inefficient functioning of the forest recreation areas. the availabil-ity of data about the bioclimatic characterization of the local weather as well as of data about the types of recre-ation activities that will take place in the areas designed for recreation in a managed woodland will enable a for-est manager to recommend the optimal ratio of the area types mentioned above and the required stand density and tree canopy cover.
In conclusion, it should be noted that the studies (e.g. Brandenburg and arnberger, 2001) whose results can provide feedback on the relationship between man and the environment i.e. the impact of the bioclimate of the environment on the number of visitors engaged in rec-reation and tourism would be the most important in the future.
referencesasHrae 55-2004, 1995. thermal environmental Condi-
tions for Human Occupancy anSI/ aSHRae addenda d, e, f, and g to anSI/ aSHRae Standard 55-2004.
bahadir, s. and o. shen, 1996. Distribution of perceived temperature in turkey in terms of human health. Bulletin of Technical University of Istanbul, (in press) (tr).
blazejczyk, K., 2002. Bioclimatic calendar for recreational activity in Warsaw. Proceeding of 15th Conf. on Biom-eteorology and aerobiology and the 16th International Congress of Biometeorology (Kansas City, MO), meet-ing 16a.7.
blazejczyk, K., p. broede, d. fiala, G. Havenith, i. Holm-er, G. Jendritzky, b. Kampmann and a. Kunert, 2009. Principles of the new Universal thermal Climate Index (UTCI) and its application to bioclimatic research in eu-ropean scale. In 2009 the COSt action, 730: 1-10.
brandenburg, c. and a. arnberger, 2001. The influence of the weather upon recreation activities. In: Matzarakis, a., Freitas, de C. (editors): Proc., First International Work-shop on Climate, tourism and Recreation in Halkidiki, Greece, 5-10 October 2001, International Society of Bio-meteorology, Commission on Climate tourism and Rec-reation, 1-10: 123-132.
cadlayan, a. Y., 1999. Investigation of Characteristics of Recreational Demands in Belgrad Forest. Ph.D. thesis Istanbul University, Science Institute. p. 186 (tr).
Converter for wind speed, http://www.cactus2000.de/uk/unit/masswsp.shtml.
de freitas, c. r., 2003. tourism climatology: evaluating environmental information for decision-making and busi-ness planning in the recreation and tourism sector. Inter-national Journal of Biometeorology, 48 (1/9): 45-54.
de freitas, c. r. and e. a. Grigorieva, 2009. the accli-matization thermal Strain Index (atSI): a preliminary study of the methodology applied to climatic conditions of the Russian Far east. International Journal of Biom-eteorology, 53 (4/7): 307-315.
destan, s., 2001. Management and Functional Characteris-tics and assessment of Forest ecosystems in Forest Man-agement activities. Ph.D. thesis, Faculty of Forestry, University of Forestry, Sofia-Bulgarian, p. 248 (Bg).
endler, c., K. oehler and a. matzarakis, 2009. Vertical gradient of climate change and climate tourism condi-tions in the Black Forest. International Journal of Biom-eteorology, 54 (1): 45-61.
Holst, t., J. rost and H. mayer, 2005. net radiation bal-ance for two forested slopes on opposite sides of a valley. Springer Berlin/ Heidelberg, International Journal of Bi-ometeorology, 49 (5/5): 275-284.
Höppe, p., 1999. the physiological equivalent temperature-a universal index for the biometeorological assessment of the thermal environment. International Journal of Biom-eteorology, 43 (2): 71-75.
iups thermal commission, 2003. Journal of Thermal Bi-ology, 28 (2003) third edition: 75-106, Pergamon.
irmak, a., a. Kunter and m. d. Kantarci, 1980. Classifi-

80 S. Destan
cation of Site Conditions in thrace. Istanbul University, Faculty of Forestry, 276: 351.
irwan, s. n. r., t. Kinoshita and Y. tashiro, 2006. Study of thermal Comfort in tree-shaded areas in the Green Space of Yogyakarta, Indonesia: Journal of the Japanese Institute of Landscape Architecture, 69 (5): 617-622.
iso 8996, 1990. ergonomics – Determination of Metabolic Heat Production. 1990/1.
iso 7730, 1995. Moderate environment – Determination of the PMV and PPD indices and specification of the condi-tions for thermal comfort.
iso 9920, 1995. ergonomics of thermal environment – es-timation of the thermal insulation and evaporative resist-ance of clothing ensemble. 1995:1.
iups thermal commission, 2003. Journal of Thermal Bi-ology, 28 (2003) third edition: 75-106, Pergamon.
Jendritzky, G., and r. de dear, 2008. adaptation and ther-mal environment. Biometeorology for adaptation to Cli-mate Variably and Change. Biometeorology, 1(I):9-32.
Jendritzky, G., a. maarouf and H. staiger, 2001. Look-ing for a Universal thermal Climate Index UtCI for Outdoor applications. Windsor-Conference on thermal Standards, april 5-8, Windsor, UK, pp. 1-17.
Jendritzky, G., p. Weihs, e. batchvarova, G. Havenith and r. dear, 2008. the Universal thermal Climate Index UtCI: Goal and State of COSt action 730 and ISB Commission, Proceedings of 6. Conference: air Conditioning and the Low Carbon Cooling Challenge, Cumberland Lodge, Windsor, UK, 27-29 July 2008: 1-4, network for Comfort and energy Use in Buildings, http://nceub.org.uk.
Kaynakli, o. and r. Yilmazkaradeniz, 2003. thermal comfort for required body temperatures and ambient conditions. Gazi University Journal of Science, 16 (2): 327- 338.
mateeva, Z., 2001. Bioclimatic diversity of Bulgaria: a re-source or a limiting factor of the recreation & tourism? Proceedings of the First International Workshop on Cli-mate, tourism and Recreation. Report of a Workshop Held at Porto Carras, neos Marmaras, Halkidiki, Greece, 5 -10 October 2001. International Society of Biometeor-ology, 274: 55-67.
matzarakis, a., 2001. assessing climate for tourism pur-poses: existing methods and tools for the thermal com-plex. Proceedings of the First International Workshop on Climate, tourism and Recreation. Report of a Workshop Held at Porto Carras, neos Marmaras, Halkidiki, Greece, 5-10 October 2001. December 2001. International Soci-ety of Biometeorology, 274:105-111.
matzarakis, a., 2007. Climate, thermal comfort and tourism.
Climate Change and tourism – assessment and Coping Strategies. Maastricht-Warsaw-Freiburg, ISBn: 978-00-023716-4, 2007, ed. amelung, Blazejczyk and Matzar-akis, 227: 140-172.
matzarakis, a., H. mayer and m. G. iziomon, 1999. ap-plications of a universal thermal index: physiological equivalent. International Journal of Biometeorology, 43 (2): 76-84.
matzarakis, a., c. r. de freitas and d. scott, 2007. Cli-mate change and tourism potential in the Black Forest – a tourism and climate approach for forest areas. Interna-tional Journal of Biometeorology, 47 (3/5): 1-7.
matzarakis, a. and Hwang, ruey-lung, 2009. Shading ef-fect on long-term outdoor thermal comfort Building and Environment, 45 (1): 213-221.
monteiro, l. m. and m. p. alucci, 2006. Calibration of out-door thermal comfort models. PLea2006 – Proceding of 23rd Conference on Passive and Low energy architec-ture, 6-8 September Geneva, Switzerland, 2006, 1-8.
ozcan, m., 2009. evolution of Recreational areas in Reser-voir Series of Belgrade Forest from Forest Management Point of View. Istanbul University, Faculty of Forestry, I. Sc. thesis, p.198 (tr).
palmer, c., 1997. Information network, www.com/weather/whumcale.htm.
pehlivanoglu, m. t., 1986. Determination of Recreational Po- tential and Planning Principles for Belgrad Forest. Ph. D. thesis, Faculty of Forestry, Istanbul University, p. 276 (tr).
scott, d., c. de freitas and a. matzarakis, 2009. adapta-tion to the tourism and recreation sector. G. R. McGregor, I. Burton, K. ebi (eds.), Biometeorology for Adaptation to Climate Variability and Change, Springer, i: 171-194.
schiller, G., 2001. Biometeorology and recreation in east Mediterranean forests. Landscape and Urban Planning, 57 (1): 1-12.
stoops, J. l., 2006. Indoor thermal Comfort, an evolutio-nary Biology Perspective. Lawrence Berkeley national Laboratory, University of California, Paper LBnL-60755, Permalink: http://escholarship.org/uc/item/5f65k96n .
tishkov, K., 1989. natural and economic Potential of the Mountains in Bulgaria. nature and Resources, Volume I, Publishing House of the Bulgarian Academy of Sciences, Sofia, p. 519, pp. 117-146 (Bg).
Wigo, H. and i. Knez, 2005. Psychological impact of air velocity variations in a ventilated room. Ergonomics, 48: (9) 1086-1096.
Zaninovich, K. and a. matzarakis, 2009. the Biometeo-rological Leaflet as a means conveying climatological information to tourists and the tourism industry. Interna-tional Journal of Biometeorology, 53 (4/7): 369-374.
Received June, 20, 2012; accepted for printing December, 2, 2012.