Embed Size (px)
Citation preview
1
Potential Energy and Emissions Benefits of Vehicle
Automation and ConnectivityAndrew Eilbert, Lauren Jackson, George Noel, and Scott Smith
2017 International Emission Inventory ConferenceTools and GIS Session
The National Transportation Systems Center
Advancing transportation innovation for the public good
U.S. Department of Transportation
Office of the Secretary of Transportation
John A. Volpe National Transportation Systems Center
August 17, 2017
2
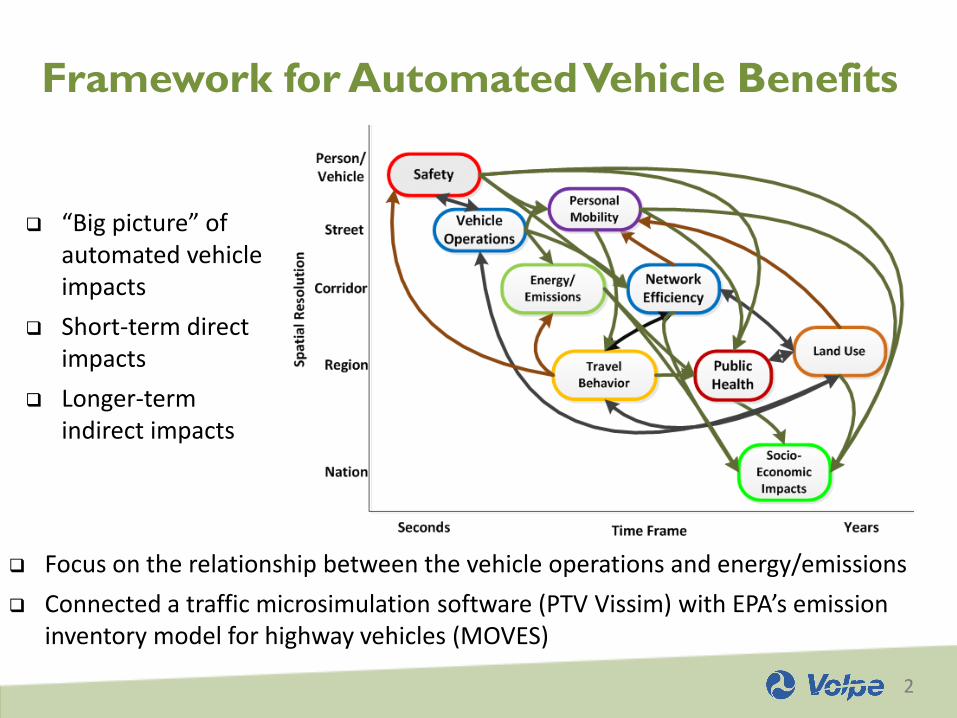
Framework for Automated Vehicle Benefits
“Big picture” of automated vehicle impacts
Short-term direct impacts
Longer-term indirect impacts
Focus on the relationship between the vehicle operations and energy/emissions
Connected a traffic microsimulation software (PTV Vissim) with EPA’s emission inventory model for highway vehicles (MOVES)
3
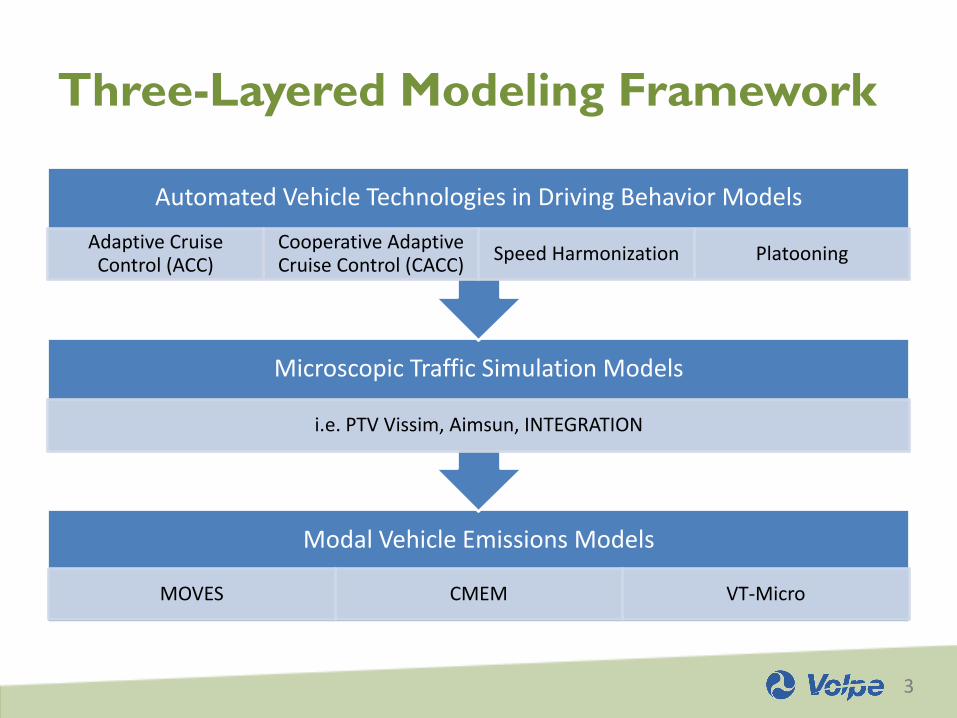
Three-Layered Modeling Framework
Modal Vehicle Emissions Models
MOVES CMEM VT-Micro
Microscopic Traffic Simulation Models
i.e. PTV Vissim, Aimsun, INTEGRATION
Automated Vehicle Technologies in Driving Behavior Models
Adaptive Cruise Control (ACC)
Cooperative Adaptive Cruise Control (CACC)
Speed Harmonization Platooning
4
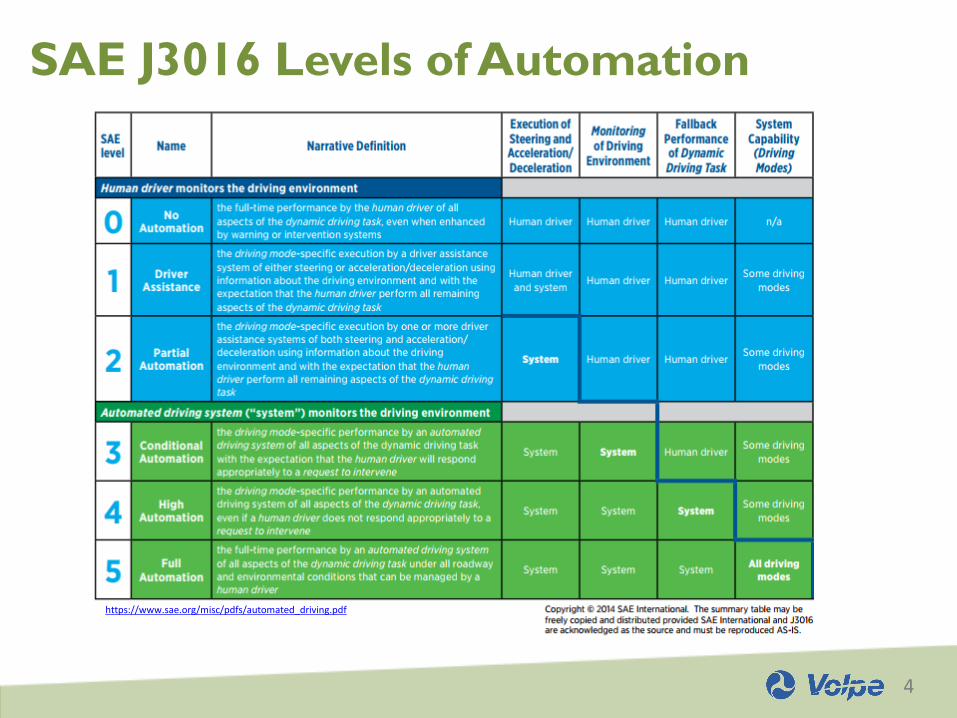
SAE J3016 Levels of Automation
https://www.sae.org/misc/pdfs/automated_driving.pdf
5
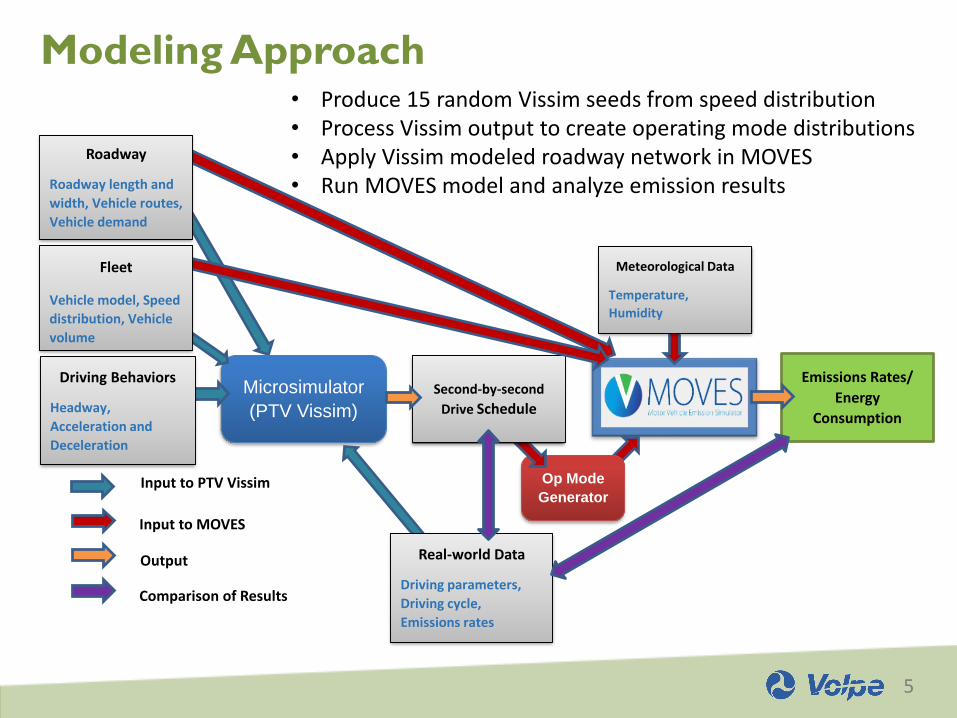
Modeling Approach • Produce 15 random Vissim seeds from speed distribution• Process Vissim output to create operating mode distributions• Apply Vissim modeled roadway network in MOVES • Run MOVES model and analyze emission results
Input to PTV Vissim Op Mode
Generator
Emissions Rates/
Energy
Consumption
Input to MOVES
Output
Comparison of Results
Roadway
Roadway length and
width, Vehicle routes,
Vehicle demand
Microsimulator
(PTV Vissim)
Driving Behaviors
Headway,
Acceleration and
Deceleration
Real-world Data
Driving parameters,
Driving cycle,
Emissions rates
Second-by-second
Drive Schedule
Fleet
Vehicle model, Speed
distribution, Vehicle
volume
Meteorological Data
Temperature,
Humidity
6
Scenario Development
Modeled passenger cars on Interstate 91 northbound near Springfield, MA▪ Speeds and traffic volumes from MassDOT
Modified CACC Driver Model DLL from Turner-Fairbank Highway Research Center (FHWA)▪ Does not include platooning, lane change, or designated lane
Ran three different microsimulation scenarios in Vissim:1) Baseline with default Wiedemann 99 car-following algorithm
2) All vehicles using CACC driver model
3) Default Wiedemann 99 algorithm with traffic oscillations set to zero
MOVES project-level energy and emissions calculated on a per vehicle basis for each scenario

7
Weidemann Car Following
A closer following headway
The reduction of oscillations in driver car following behavior
Capri (2012), International Journal of Traffic and Transportation Engineering
8
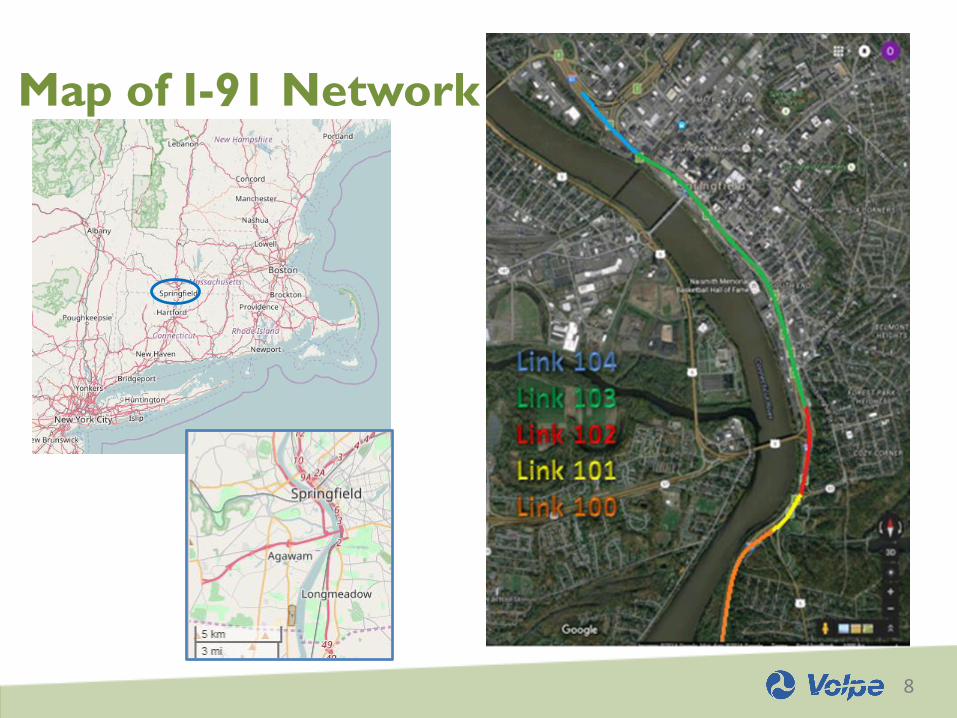
Map of I-91 Network
9
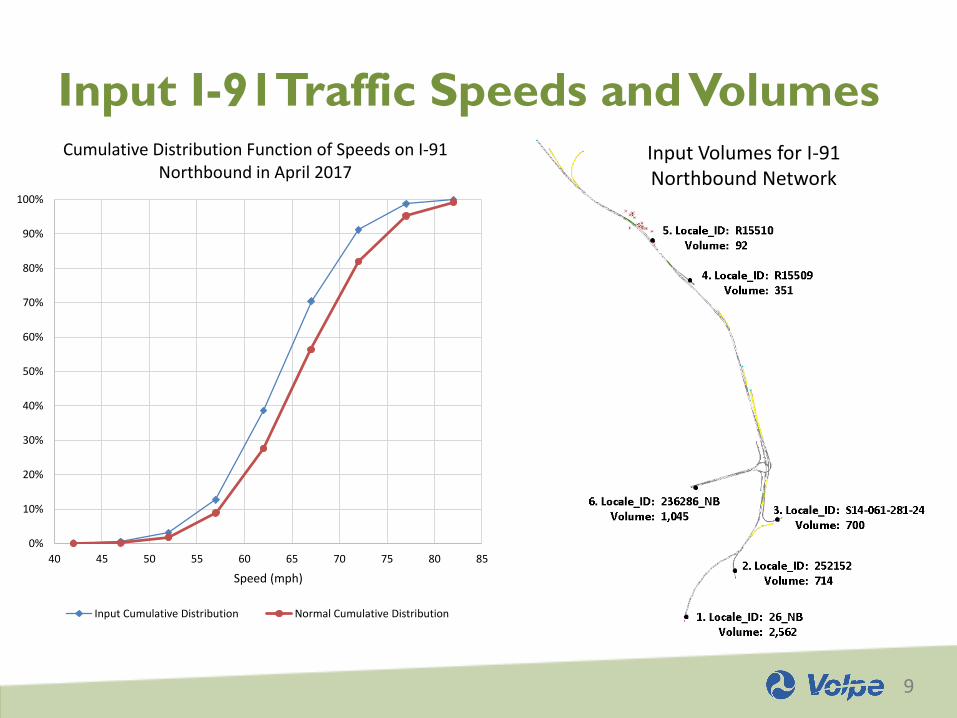
Input I-91Traffic Speeds and VolumesInput Volumes for I-91 Northbound Network
0%
10%
20%
30%
40%
50%
60%
70%
80%
90%
100%
40 45 50 55 60 65 70 75 80 85
Speed (mph)
Cumulative Distribution Function of Speeds on I-91 Northbound in April 2017
Input Cumulative Distribution Normal Cumulative Distribution
10
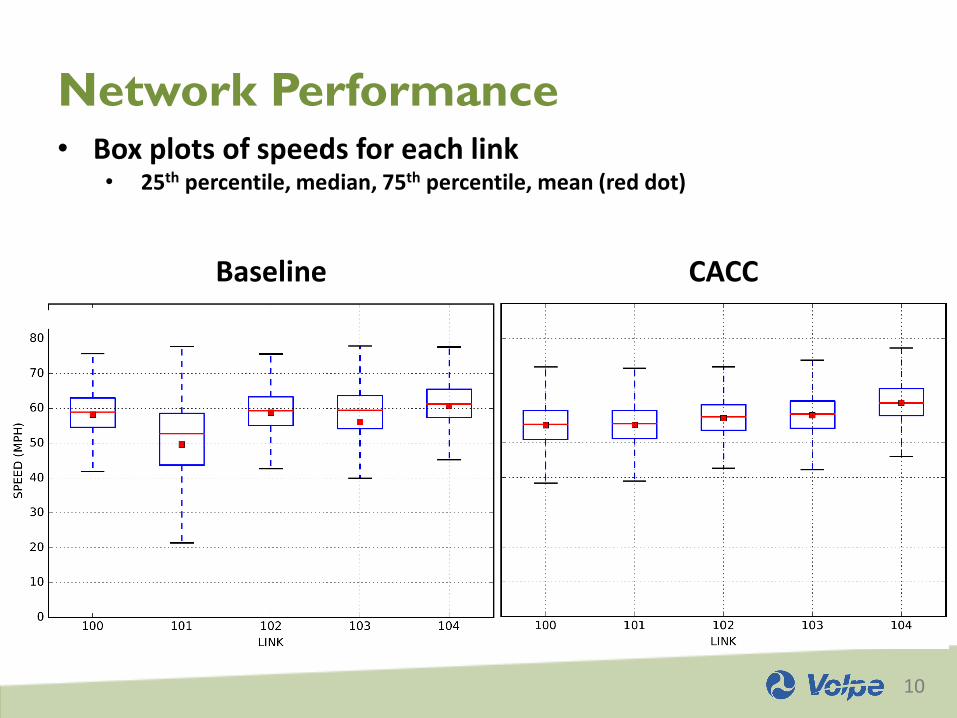
Network Performance• Box plots of speeds for each link
• 25th percentile, median, 75th percentile, mean (red dot)
Baseline CACC
11
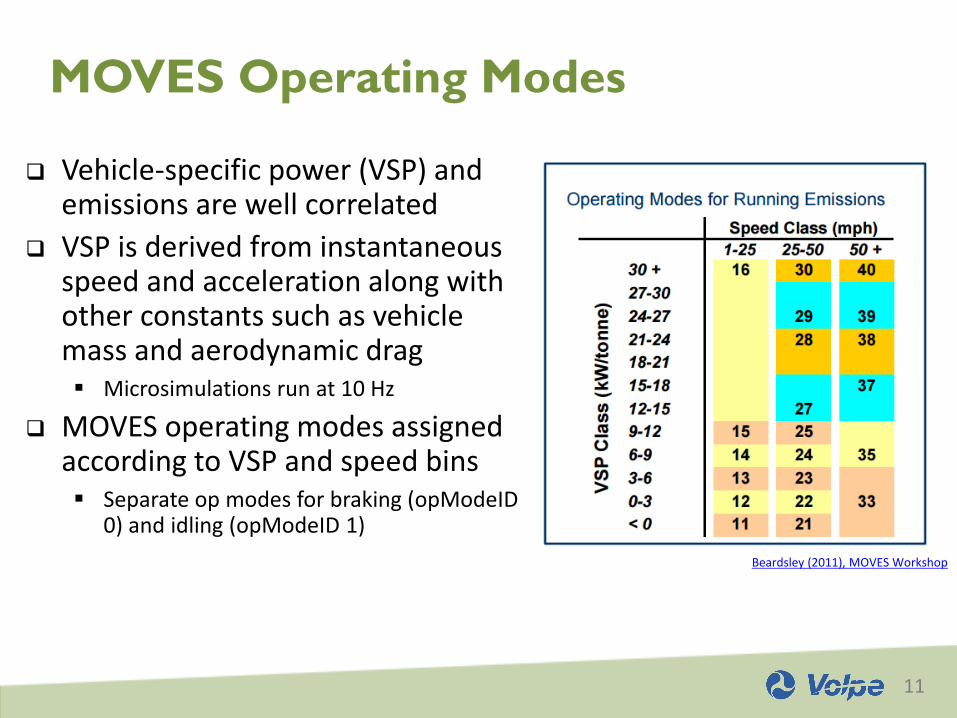
Vehicle-specific power (VSP) and emissions are well correlated
VSP is derived from instantaneous speed and acceleration along with other constants such as vehicle mass and aerodynamic drag▪ Microsimulations run at 10 Hz
MOVES operating modes assigned according to VSP and speed bins▪ Separate op modes for braking (opModeID
0) and idling (opModeID 1)
MOVES Operating Modes
Beardsley (2011), MOVES Workshop
12
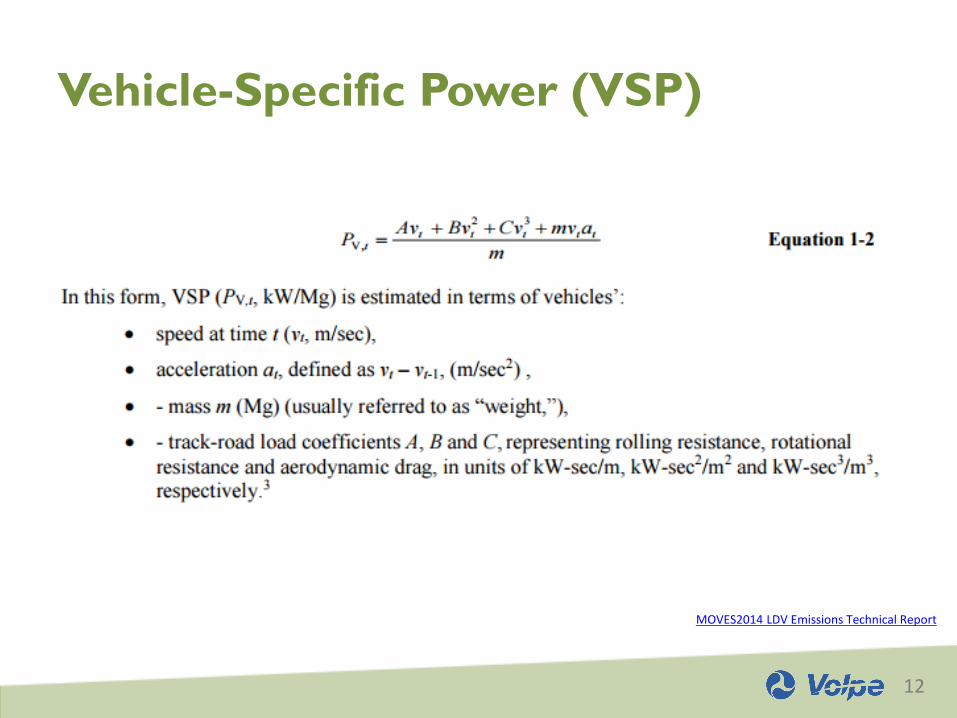
Vehicle-Specific Power (VSP)
MOVES2014 LDV Emissions Technical Report
13
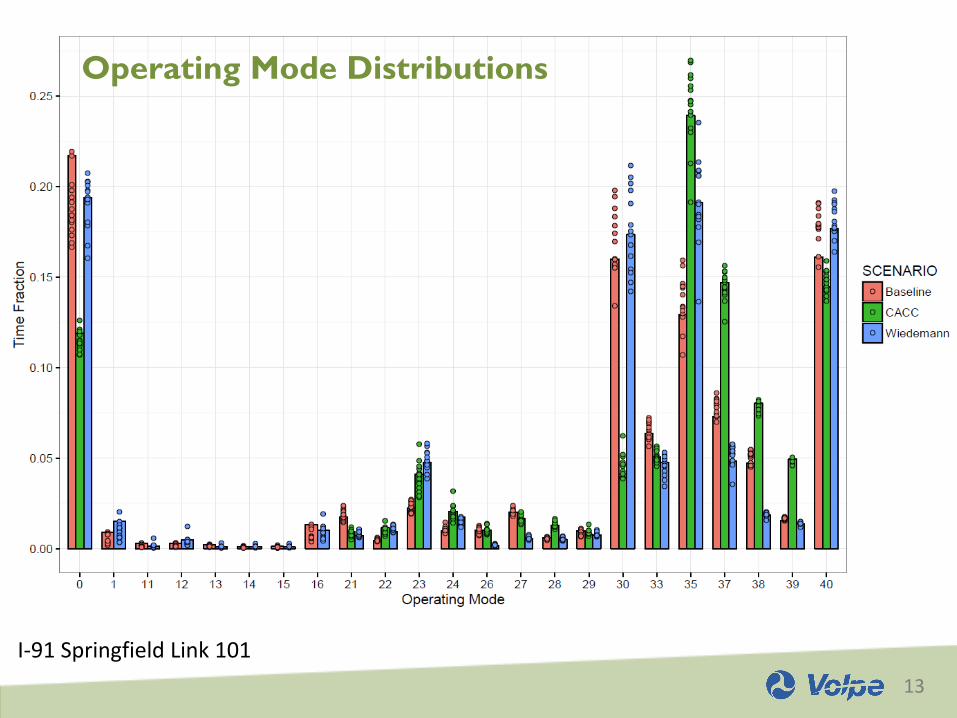
Operating Mode Distributions
I-91 Springfield Link 101
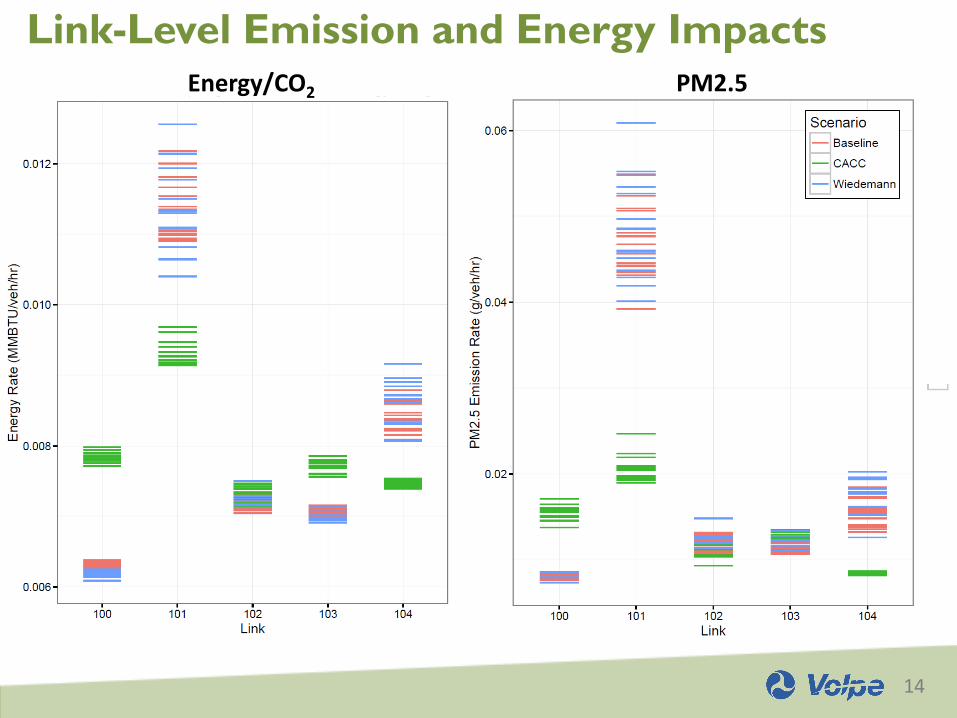
14
Link-Level Emission and Energy ImpactsEnergy/CO2 PM2.5
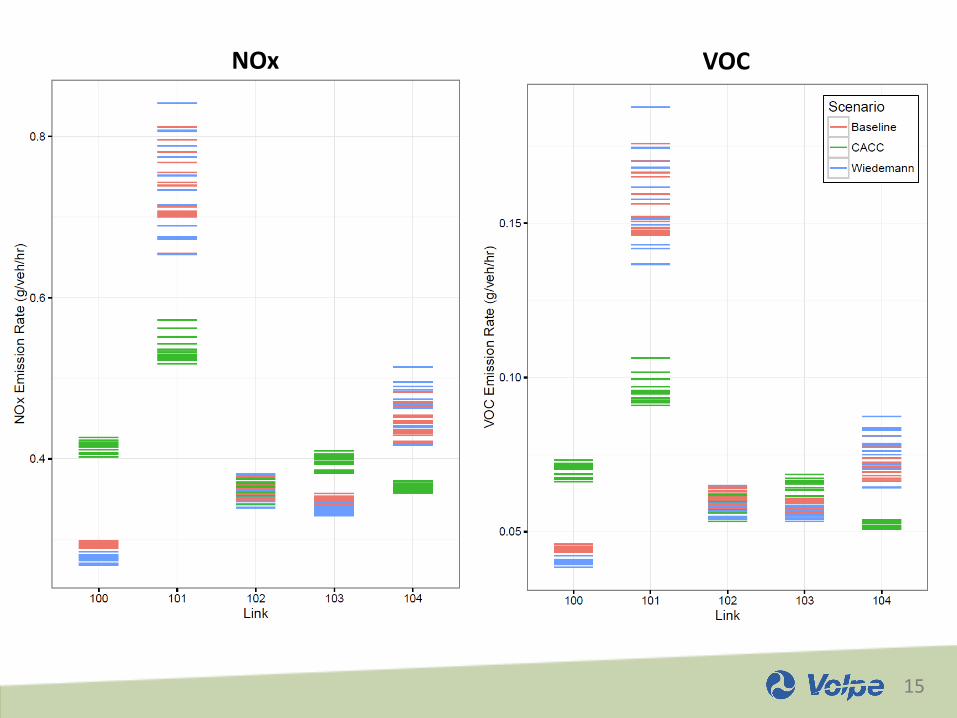
15
NOx VOC
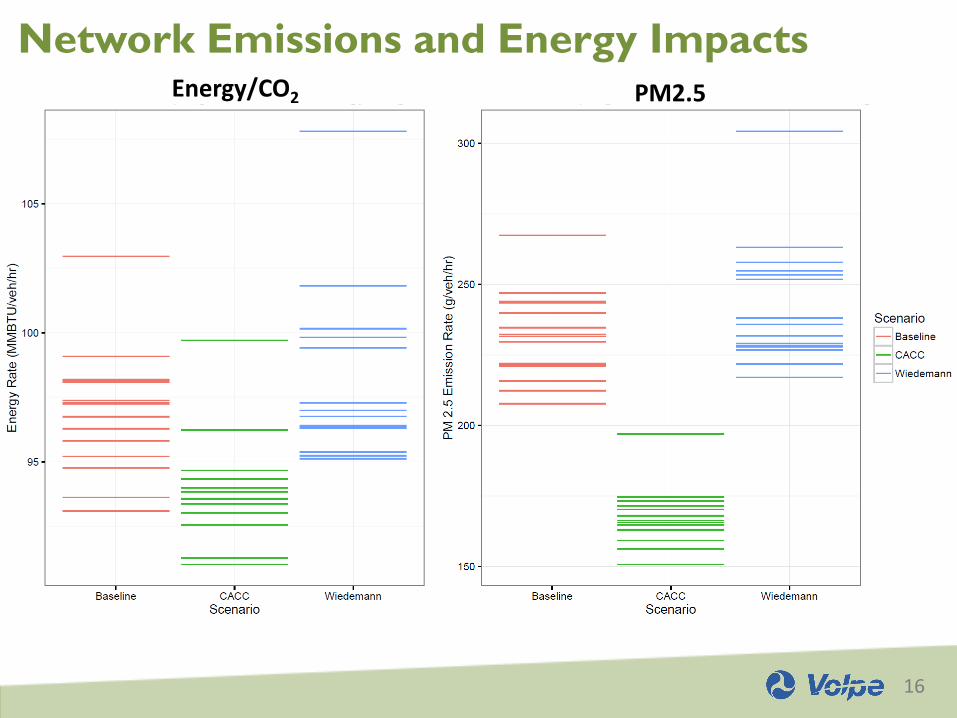
16
Network Emissions and Energy ImpactsEnergy/CO2 PM2.5
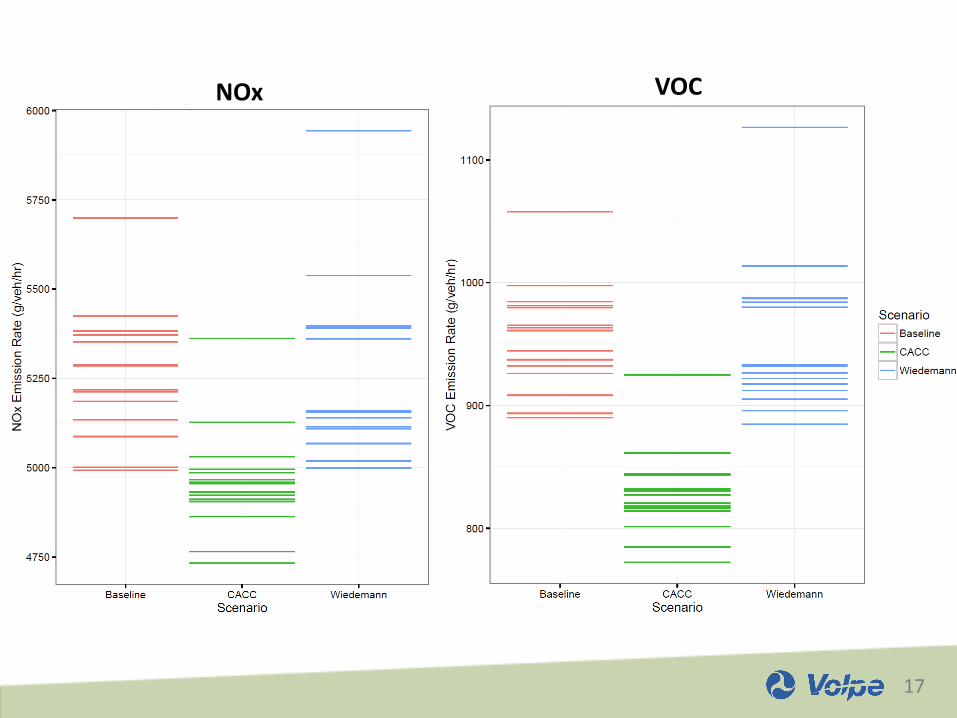
17
NOx VOC
18
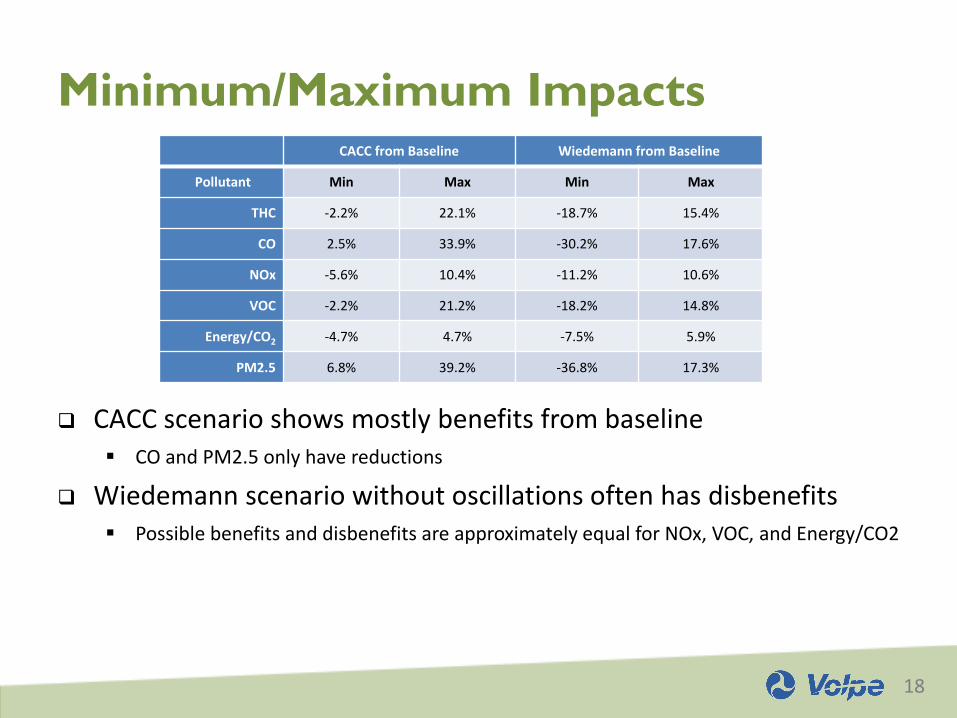
Minimum/Maximum Impacts
CACC scenario shows mostly benefits from baseline▪ CO and PM2.5 only have reductions
Wiedemann scenario without oscillations often has disbenefits▪ Possible benefits and disbenefits are approximately equal for NOx, VOC, and Energy/CO2
CACC from Baseline Wiedemann from Baseline
Pollutant Min Max Min Max
THC -2.2% 22.1% -18.7% 15.4%
CO 2.5% 33.9% -30.2% 17.6%
NOx -5.6% 10.4% -11.2% 10.6%
VOC -2.2% 21.2% -18.2% 14.8%
Energy/CO2 -4.7% 4.7% -7.5% 5.9%
PM2.5 6.8% 39.2% -36.8% 17.3%
19
Conclusions and Future Work
Results▪ Automated vehicles generally show less braking, leave less headway, and have
less fluctuations in speed and acceleration than baseline
▪ CACC has less of an effect on energy and emissions in freely flowing traffic
▪ Wiedemann oscillation smoothing does not produce much benefit
▪ DLL needs to be thoroughly tested and validated
Next Steps▪ Vary traffic volumes to simulate more heavily congested scenarios
▪ Experiment with different penetrations of CACC-enabled vehicles
▪ Investigate lane changing capabilities to accommodate merging
20
Discussion
Modeling Recommendations▪ Update tools to reflect connected and automated vehicle (CAV) technologies
o Integrate CAV technologies into MOVES driving behavior
o Add custom operating mode distributions for regulatory analysis
Broader Issues▪ Travel behavior
o Shared vehicles
o Shared trips
o Effect on VMT
o Parking
▪ Vehicle operations
o Drivetrain technologies (fossil fuel vs. electric)
o Emission sources (mobile vs. stationary)
21
For More Information http://www.dot.gov/
Kevin Dopart
US DOT / ITS JPO
Scott Smith
US DOT / Volpe Center
Andrew Eilbert
US DOT / Volpe Center
Sponsorship through US DOT Intelligent Transportation Systems Joint Program Office (ITS JPO)