Embed Size (px)
Citation preview
Potential fungal attack for wood in Mato Grosso state, Brazil
Nativa, Sinop, v.4, n.3, p.156-161, mai./jun. 2016.Pesquisas Agrárias e AmbientaisDOI: 10.14583/2318-7670.v04n03a07http://www.ufmt.br/nativa
ISSN: 2318-7670
Bruno Henrique CASAVECCHIA1*, Adilson Pacheco de SOUZA2,Diego Martins STANGERLIN2, Rafael Rodolfo de MELO2
1 Instituto de Ciências Humanas, Naturais e Sociais, Universidade Federal de Mato Grosso, Sinop, Mato Grosso, Brasil.2 Instituto de Ciências Agrárias e Ambientais, Universidade Federal de Mato Grosso, Sinop, Mato Grosso, Brasil.
* E-mail: [email protected]
ABSTRACT: This work characterizes the temporal and spatial distribution of Fungal Attack Potential (FAP) for wood in Mato Grosso state, Brazil. The meteorological data of temporal series of 7 years (2008-2014) were used, from 30 automatic weather stations (AWS ‘s) of the stations network of the National Institute of Meteorology (INMET). The monthly average of air temperature and the number of days with rain over than 0.30 mm the month were used. The interpolation by Arcgis 10.0 software was used, with FAP discretization in months, dry and rainy and annual season. The results showed a great variation of FAP to Mato Grosso, with the highest and lowest rates, occurred in January and July. In the dry season, there is a low potential wood deterioration by the fungus (FAP between -2.70 to 3.40). In contrast, in the rainy season, FAP ranged from 16.60 to 25.90, depending on the concentration of days with precipitations over 0.30 mm. The total annual sum of FAP ranged from 119 to 198, and the north of the state showed the highest values by having high rainfall rates. It is recommended attention on drying and storage of wood in the rainy season (October to April) to the North, Northwest, Northeast and West of Mato Grosso state.
Keywords: biodeterioration, wood decay fungus, environmental variables.
Potencial de ataque fúngico para madeiras no estado do Mato Grosso
RESUMO: Este trabalho caracteriza a distribuição temporal e espacial do Potencial de Ataque Fúngico (PAF) para a madeira no Estado do Mato Grosso. Utilizou-se os dados meteorológicos de series temporais de 7 anos (2008-2014) de 30 estações meteorológicas automáticas (EMA’s), da rede de estações do Instituto Nacional de Meteorologia (INMET). Utilizou-se as médias mensais de temperatura do ar e o número de dias com chuva acima de 0,30 mm no mês. Empregou-se a interpolação pelo software Arcgis 10.0, com discretizações de PAF em meses, estações seca e chuvosa e anual. Os resultados apresentaram grande variação de PAF para o Mato Grosso, tendo os maiores e menores índices ocorrido em janeiro e julho. Na estação seca ocorre um baixo potencial de deterioração da madeira por fungos (PAF entre -2,70 à 3,40). Em contrapartida, na estação chuvosa, PAF variou de 16,60 a 25,90, em função da concentração de dias com precipitações acima de 0,30mm. O somatório total anual de PAF variou de 119 a 198, tendo a região norte do Estado os maiores valores por possuir altos índices pluviométricos. Recomenda-se atenção na secagem e armazenamento da madeira na estação chuvosa (outubro a abril) para as regiões Norte, Noroeste, Nordeste e Oeste do estado de Mato Grosso.
Palavras-chave: biodeterioração, fungos xilófagos, variáveis ambientais.
Recebido em agosto/2015; Aceito em março/2016.
1. INTRODUCTION
Brazil has an immense amount of forest resources, highlighting the wide variety of native species, which together with good soil and climate conditions for the implementation of fast-growing species, they favor the development of forestry activities (SHIMIZU 2007). For having good chemical, physical, and mechanical properties, and high decorative value, wood has great applicability in engineering and architectural projects, musical instruments and other products. However, due to the environment exposure, biological agents may
damage it, especially fungus, which has a rapid development of the environments of wood use. Being developed in warm and moist environments, cut and stored logs in the forest are soon contaminated by wood-destroying fungus, as they found a favorable environment and the main nutrients necessary for their survival in this material (LEVY 1983; MORESCHI 2013).
Funguses are bio-deterioration agents and can compromise wooden structures that are located also above ground (SCHMIDT 2007). The temperature and humidity of the wood are the main factors that interfere with the fungal attack because their characteristics favor the metabolism and cell wall degradation

Potential fungal attack for wood in Mato Grosso state, Brazil
Nativa, Sinop, v.4, n.3, p.156-161, mai./jun. 2016
157
by the fungus (MORRIS 2011). Some conditions are required for the fungus development in the wood, such as the oxygen availability (higher than 20%); pH in the acidic range (4.5 to 5.5); a temperature between 25 and 30 °C, and particularly, wood moisture content higher than 20%. The absence of these conditions limits the development of most fungus in the wood (MORESCHI, 1980). In this sense, to control the wood moisture content becomes a fundamental instrument for their protection, especially when its use is exposed to the atmosphere. Therefore, substances repellent to moisture can be used, leaving it away from liquids or reducing the accessibility of cell walls to water (RINGMAN et al., 2014).
A fungus causes stains on wood by the results of the light reflection on the pigmented hyphae, mainly releasing pigments in the empty spaces of the wood. The cell walls keep their natural and practically intact color when attacked by strainers and moldy fungus, or they show small perforations caused by appressoria for the passage of the hyphae from a cell to another. The installation of the fungus in the wood causes the mischaracterization of its color due to the presence of pigments in its cavity, and causes obstruction of the scores of cell walls, thus making a barrier when it needs to dry out or impregnate the wood with some preservative substances (MORESCHI, 2013).
Application of Fungal Attack Potential (FAP) for wood represents the risk of decay, where the wood is submitted by climatic variations, and it is considered an important tool to support better use of wood in different regions (MARTINS, 2003).
Therefore, this study aimed to characterize the temporal and spatial distribution of the fungal attack potential for wood in Mato Grosso state.
2. MATERIAL AND METHODS
2.1. LocationThe state of Mato Grosso has two defined seasons: dry
(May to September) and rainy (October to April). The weather is characterized as Aw (Savannah Tropical Weather) - tropical weather with average temperatures above 18 oC every month, where autumn and winter represent the dry season and the rainy season spring/summer and Cwa (Temperate or Altitude Tropical Weather) – is the weather with dry winter, where the hottest month temperatures are above 22 oC (SOUZA et al., 2013).
2.2. Data collectionMeteorological data were obtained from the National
Institute of Meteorology (INMET), collected in the network of automatic stations (AWS’s) installed in the state of Mato Grosso, covering the period from 2008 to 2014, and represented by 30 AWS’s (Table 1 and Figure 1).
2.3. Fungal attack potentialFor the determination of Fungal Attack Potential (FAP) the
SCHEFFER methodology (1971) was used and adapted by MARTINS (2003) (Eq. 1) to the Brazilian climatic conditions. The values were monthly obtained through the average temperatures and the mean number of days with precipitation above 0.30 mm, each month.
Table 1. Automatic weather stations in the state of Mato Grosso, Brazil.
Code City nameLat.
(S)
Long.
(W)
Hei.
(m)
A-908 1. Água Boa -14.0161 -52.2122 432A-924 2. Alta Floresta -10.0672 -56.7522 294A-910 3. Apiacás -9.5639 -57.3936 220A-905 4. Campo N. d. Parecis -13.7833 -57.8333 570A-912 5. Campo Verde -15.3139 -55.0808 749A-926 6. Carlinda -9.9703 -55.8272 300A-913 7. Comodoro -13.4231 -59.4546 591A-918 8. Confresa -10.6539 -51.5668 237A-919 9. Cotriguaçu -9.9061 -58.5719 261A-901 10. Cuiabá -15.5594 -56.0628 240A-930 11. Gaúcha do Norte -13.1847 -53.2575 379A-906 12. Guarantã -9.9500 -54.8833 320A-932 13. Guiratinga -16.3417 -53.7661 526A-933 14. Itiquira -17.1750 -54.5014 585A-914 15. Juara -11.2803 -57.5267 260A-920 16. Juína -11.3750 -58.7750 374A-928 17. Nova Maringá -13.0386 -57.0922 353A-929 18. Nova Ubiratã -13.4111 -54.7522 518A-927 19. Novo Mundo -12.5219 -58.2314 431A-917 20. Pontes de Lacerda -15.2511 -59.3467 256A-935 21. Porto Estrela -15.3247 -57.2264 145A-907 22. Rondonópolis -16.4500 -54.5666 284A-936 23. Salto do Céu -15.1247 -58.1275 303A-931 24. Santo Ant. do L. -14.9278 -53.8836 648A-921 25. São F. do Ar. -11.6189 -50.7278 218A-903 26. São J. do R. C. -13.4500 -56.6666 350A-917 27. Sinop -11.9822 -55.5658 371A-904 28. Sorriso -12.5452 -55.7113 380A-902 29. Tangará da Serra -14.6500 -57.4315 321A-922 30. Vila Bela S. T. -15.0628 -59.8729 222
Figure 1. Spatial distribution of automatic weather stations assessed to estimate the FAP, Mato Grosso state, Brazil.
( )( )T 2 D 3FAP
16.7− −
= (1)
Tabela 1. Estações meteorológicas automáticas do estado de Mato Grosso, Brasil.
Figura 1. Distribuição espacial das estações meteorológicas automáticas avaliadas na estimativa do PAF, Estado de Mato Grosso, Brasil.
where: FAP = Fungal Attack Potential suspended in wood; T = average temperature in the month, D = number of days with rainfall over 0.30 mm in the month.

Casavecchia et al.
Nativa, Sinop, v.4, n.3, p.156-161, mai./jun. 2016
158
Therefore, the larger the FAP value, the greater the fungal attack potential on wood.
2.4. MapsFor the processing of spatial data, the ArcGIS 10.0 software
was used, and the monthly average values of FAP of AWS’s were inserted and, in a second stage, the data were grouped into two periods, the months that correspond to the dry season (May to September) and rainy season in the state of Mato Grosso (October to April). Finally, the total sums of each AWS’s were performed.
Thus, the interpolations of FAP values were created through the Spatial Analyst Tools instrument; interpolation; IDW (Interpolation of the points by pondering the inverse of the distance), showing the values through maps with different values classes.
3. RESULTS AND DISCUSSION
The average annual temperatures ranged between 22.58 and 26.35 oC to Comodoro and Confresa, respectively (Table 2). The month of September showed the highest average monthly air temperature, regardless of geographical location and/or altitude of the AWS. The dry months showed larger daily amplitudes trends, corroborating Souza et al. (2013). The monthly thermic amplitude range varied from 1.64 oC (North Guarantã) 5.65 oC (Cuiabá), indicating that average monthly temperatures in the state did not show significant variations in the different biomes and the seasons.
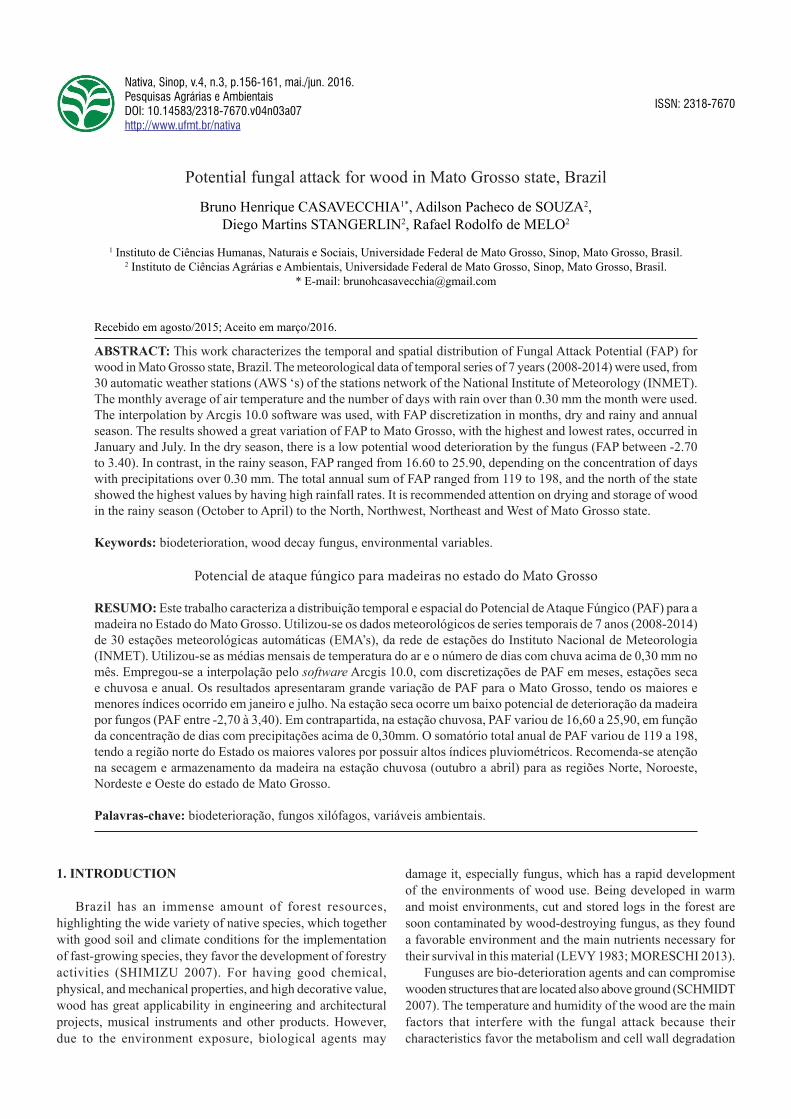
For FAP values, there was a great variability, especially when compared discretization’s of January and July classes, and in January reached average up to 35.00; while in July occurred extreme values lower than -5.00, i.e., to Mato Grosso PAF suffers a variation of 40.00 units. This occurs due to the definition of the two climatic periods very different during the year. The months from October to May showed high-temperature values (Table 2) because in these months there is a low variation of the temperature throughout the day due to the presence of water vapor in the atmosphere, with a predominance of rainfall in this period (SOUZA et al., 2013). Monthly and yearly total rainfall variations are the result of the regional atmospheric circulation behavior throughout the year, together with local or regional geographical factors (PEREIRA et al., 2002).
The FAP regionalization trend was observed in the north and northwest regions when compared to the rest of the state (Figure 2). According to Nimer; Brandão (1989), the annual rainfall average in this region of the state can reach values greater than 2750 mm decreasing towards East, West and South, which results in a spatial and irregular temporal distribution rainfall throughout the year, with highs in summer and low in winter since the concentrations of 70% of the rainfall is between November and March (summer), and whose rainiest months are concentrated from January to March. During this quarter, the precipitation reaches 45 to 55% of the total annual rainfall (SETTE; RATE, 2000b). This behavior directly influences in the FAP seasonality in the state.
StationsMonths Anual
meanJan Feb Mar Apr Mai Jun Jul Aug Sep Oct Nov Dec
1.Água Boa 24.65 24.64 24.94 25.11 24.30 24.06 24.36 25.80 27.75 26.60 25.08 24.68 25.162.Alta Floresta 24.54 24.41 24.92 25.13 25.12 24.24 23.72 24.55 26.27 25.48 24.94 25.01 24.863.Apiacás 25.28 24.84 24.76 25.12 25.51 25.38 25.64 26.81 27.14 25.67 25.39 25.39 25.584.Campo N. d. P. 24.18 23.75 23.97 25.57 23.13 22.56 22.90 24.41 26.33 25.69 24.63 24.97 24.345.Campo Verde 22.89 23.18 23.41 23.12 21.81 22.15 22.48 24.45 25.90 24.75 23.90 23.33 23.456.Carlinda 24.50 24.78 25.04 25.25 25.35 25.43 25.83 26.89 26.66 25.77 25.20 24.94 25.477.Comodoro 23.10 22.93 23.13 22.86 21.59 21.02 20.65 21.50 23.53 23.78 23.56 23.34 22.588.Confresa 25.24 25.33 25.97 25.98 26.39 26.01 26.14 27.46 28.66 27.12 26.07 25.77 26.359.Cotriguaçu 24.63 24.71 24.74 25.06 24.73 24.56 24.55 25.20 26.29 25.86 25.40 25.24 25.0810.Cuiabá 26.23 25.53 26.60 26.76 24.41 23.87 23.45 25.51 29.11 28.02 27.28 26.77 26.1311.Gaúcha do Norte 25.10 25.17 25.70 26.00 25.37 25.10 25.14 25.60 27.47 26.72 25.59 25.07 25.6712.Guarantã do No. 24.91 25.09 25.37 25.72 25.50 24.87 24.86 25.57 26.50 25.99 25.46 25.19 25.4213.Guiratinga 25.96 24.99 25.38 25.21 23.97 23.75 23.45 25.11 27.52 27.19 25.88 25.42 25.3214.Itiquira 24.42 24.39 24.64 24.04 22.35 22.59 22.37 23.93 26.27 25.88 25.03 24.59 24.2115.Juara 25.34 25.10 25.52 25.66 25.28 24.98 25.21 26.73 27.59 26.91 26.06 25.54 25.8316.Juína 24.56 24.77 24.66 24.89 24.73 24.30 24.44 25.27 26.76 25.88 25.04 24.86 25.0117.Nova Maringá 26.32 27.52 26.70 25.85 24.79 23.87 23.57 25.12 26.88 26.87 25.97 25.45 25.7418.Nova Ubiratã 23.66 23.97 24.86 25.41 23.81 24.93 24.54 25.41 27.18 26.07 24.72 24.30 24.9119.Novo Mundo 24.02 24.22 24.45 24.57 24.08 24.17 24.61 26.25 27.51 26.08 25.07 24.40 24.9520.Pontes de Lacerda 25.67 25.22 25.60 24.98 23.45 23.08 23.11 24.87 26.89 27.05 26.31 25.96 25.1821.Porto Estrela 27.60 26.21 26.39 26.07 25.32 23.50 22.75 24.35 27.36 27.67 26.94 26.50 25.8922.Rondonópolis 25.43 25.33 25.55 25.13 23.23 22.71 22.63 24.78 27.73 27.80 26.43 25.92 25.2223.Salto do Céu 25.35 25.05 25.17 24.44 22.71 22.21 21.88 23.30 25.78 26.26 25.90 25.49 24.4624.Santo Ant. do L. 23.61 23.70 24.21 23.54 22.63 22.49 22.63 24.39 26.24 25.34 24.16 23.70 23.8925.São F. do Ar. 25.35 25.72 26.16 26.60 25.67 24.17 25.83 27.39 28.72 27.23 25.13 25.44 26.1226.São J. do R. C. 24.76 24.56 25.38 25.17 23.96 23.64 22.78 23.96 27.95 25.80 25.34 25.25 24.8827.Sinop 25.07 24.57 25.16 24.99 24.44 24.26 24.65 26.19 27.08 26.09 25.30 24.94 25.2328.Sorriso 24.92 24.91 25.54 25.91 25.10 24.87 25.44 26.96 28.05 26.58 25.50 25.33 25.7629.Tangará da Serra 24.99 24.86 24.72 24.34 23.03 23.22 23.25 25.29 26.70 25.86 25.10 24.96 24.6930.Vila Bela S. T. 25.64 25.32 25.75 25.23 23.85 23.12 22.93 24.29 26.45 26.73 26.47 26.08 25.15
Tabela 2. Temperaturas médias mensais e anuais de 2008 a 2014(em °C) nas estações meteorológicas automáticas da rede do Instituto Nacional de Meteorologia (INMET), no Estado de Mato Grosso, Brasil.
Table 2. Monthly and annual temperatures averages 2008-2014 (°C) in automatic weather stations of the National Institute of Meteorology network (INMET), in Mato Grosso state, Brazil.
Potential fungal attack for wood in Mato Grosso state, Brazil
Nativa, Sinop, v.4, n.3, p.156-161, mai./jun. 2016
159
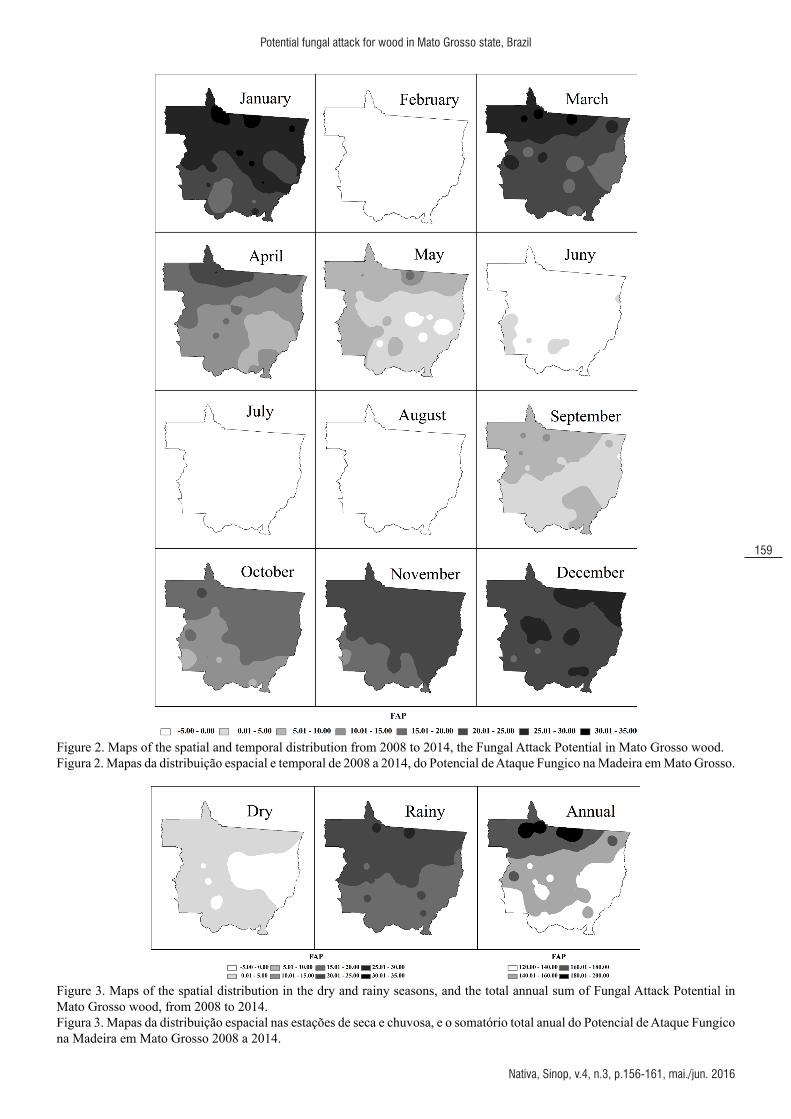
Figure 3. Maps of the spatial distribution in the dry and rainy seasons, and the total annual sum of Fungal Attack Potential in Mato Grosso wood, from 2008 to 2014.
Figura 2. Mapas da distribuição espacial e temporal de 2008 a 2014, do Potencial de Ataque Fungico na Madeira em Mato Grosso.Figure 2. Maps of the spatial and temporal distribution from 2008 to 2014, the Fungal Attack Potential in Mato Grosso wood.
Figura 3. Mapas da distribuição espacial nas estações de seca e chuvosa, e o somatório total anual do Potencial de Ataque Fungico na Madeira em Mato Grosso 2008 a 2014.

Casavecchia et al.
Nativa, Sinop, v.4, n.3, p.156-161, mai./jun. 2016
160
Casavecchia et al. (2011) in FAP studies in 2007-2009 for the Sinop/Mato Grosso region, north of Mato Grosso, observed that because the region has a summer with average air temperatures around 25 °C and high rainfall, the months of the rainy season have the highest FAP indexes, corroborating MORESCHI (1980). This behavior is due to the hygroscopic potential of wood, absorbing higher water content available in the environment, allowing a favorable humid microenvironment for the development of fungus on the surface of the wood (Bordin, 1999; Accarini et al., 2000). Casavecchia et al. (2011) also stress the importance of the distribution of rainfall in the deterioration of wood, as in July 2007 Sinop/Mato Grosso accumulated 20 mm of rain, elevating the FAP to levels close to the rainy season.
In July and August (Figure 2), regardless of the region of the state, the FAP was null or very low. Generally, FAP rate depends on the average monthly temperature and the number of rainy days greater than 0.30 mm. Accordingly, the absence of rainfall and high temperatures during the dry period allowed the obtainment of negative FAP values. The South, Southeast, Southwest and Eastern state regions have the lowest FAP values, regardless of the time of the year.
According to Souza et al. (2013), winter is extremely dry in the state, with rare rains distributed in four to five days in the months of June, July, and August, with very low totals, between 20 and 80 mm. Generally, the winter rains in the state are the result of frontal formations, which are provided by the passage of polar fronts brought from the South by the polar anticyclone. The occurrences of rainfall in the extreme north of Mato Grosso are the troubled west circulation system consequences caused by winds brought by tropical lines instabilities (TI). In this context, regardless of the time of the year, there is a tendency of the North region (Amazon) showing a higher humidity compared to the Southern and Eastern regions (Cerrado).
Considering the rainy season (October to April), similarities with the average annual behavior is noted, demonstrating that there is a great dependence of the index on the number of rainy days above 0.30 mm (Figure 3). Meyer; Brischke (2015) studied the influence of moisture to the white rot fungus attack in a range of species and obtained high FAP values in those months. They indicated that the fungus attack could worsen during the following months, by the continuation of the rainy season.
The mean annual FAP classes values show an oscillation of 120 to 198, for the South and North of the state, respectively. Evaluating the FAP throughout Brazil, Martins (2003) found values ranging from 20 (northeast) 270 (north of the Amazon), and for most of the Mato Grosso state FAP was 120, and only the extreme north showed a value of 170, underestimating the fungal attack potential, mainly by using few weather stations in their studies, not showing the region of greater wood production of the state in a satisfaction way.
Studying different wood species in Europe Meyer et al. (2015) found that the minimum required moisture content was 19.2% to occur the biodegradation by fungus and this value varies from species to species and fungus to fungus.
In this sense, evaluating the moisture content of seven species of Amazon wood, in the city of Sinop/Mato Grosso, Cassiano et al. (2013) found values over 19.2% for woods of low density, in the months of December and January, indicating that in these months, vulnerability to fungal attack is very
large, especially in areas of higher productivity as the results presented here.
4. CONCLUSIONS
The state of Mato Grosso presented a variation of the fungal attack potential between the dry and rainy seasons, with greater potential bio-deterioration of wood by fungus between October and April.
The North, Northwest, Northeast and West regions and Mato Grosso state show higher FAP in the rainy season, with higher fungal attack possibilities in the wood on this season.
This information can guide the adoption of drying techniques, storage and/or use of preservatives, and thus, extend the life of wood in use.
5. ACKNOWLEDGEMENT
To the National Institute of Meteorology (INMET) for the availability of meteorological databases to the authors.
6. REFERENCES
ACCARINI, J. H.; MAZOCATO, M. A.; COSTA, O. G. P.; LUENGO, R. F. A. Pontos de estrangulamento: os obstáculos internos e externos representam vicissitudes a serem vencidas pela olericultura brasileira. Agroanalysis, Rio de Janeiro, v. 20, n. 2, p. 32-36, 2000.
BORDIN, M. R. Embalagem levada a sério: o CETEA projeta embalagens baseadas em resultados práticos, o que proporciona rapidez e baixo custo de desenvolvimento. Agroanalysis, Rio de Janeiro, v. 19, n. 6, p. 46-48, 1999.
CASAVECCHIA, B. H.; SOUZA, A. P.; STANGERLIN, D. M. Determinação do potencial de ataque fúngico na madeira para Sinop-MT. In: Congresso Brasileiro de Agrometeorologia. Anais... Guarapari, Brasil. p.1-5, 2011.
CASSIANO, C.; SOUZA, A. P.; STANGERLIN, D. M.; PAULINO, J.; MELO, R. R. Sazonalidade e estimativas da umidade de equilíbrio de madeiras amazônicas em Sinop, Estado do Mato Grosso. Scientia Forestalis, Piracicaba, v. 41, n. 100, p. 457-468, 2013.
LEVY, J. F. The action of wood preservatives in relation to wood anatomy. Holz als Roh- und Werkstoff, Berlin, v. 41, n. 6, p. 241-245, 1983.
MARTINS, V. A.; ALVES, M. V. da S.; SILVA, J. de F. da; REBELLO, E. R. G.; PINHO, G. S. C. de. Umidade de equilíbrio e risco de apodrecimento da madeira em condições de serviço no Brasil. Brasil Florestal, Brasília, n.7 6, p. 29-34, 2003.
MEYER, L.; BRISCHKE, C. Fungal decay at different moisture levels of selected European-grown wood species. International Biodeterioration & Biodegradation, Barking, v. 103, p. 23-29, 2015. http://dx.doi.org/10.1016/j.ibiod.2015.04.009
MORESCHI, J. C. Biodegradação e Preservação da Madeira. 4ª edição. Curitiba, PR: UFPR, 2013. 49p.
MORESCHI, J. C. Biodegradação da Madeira. Curitiba: UFPR, 1980, 38p.
MORRIS, P. I.; WANG, J. Scheffer index as preferred method to define decay risk zones for above ground wood in building codes. International Wood Product Journal, v. 2, n. 2, p. 67-70, 2011. http://dx.doi.org/10.1179/2042645311Y.0000000012
Potential fungal attack for wood in Mato Grosso state, Brazil
Nativa, Sinop, v.4, n.3, p.156-161, mai./jun. 2016
161
NIMER, E.; BRANDÃO, A. M. P. M. Balanço hídrico e clima da região dos cerrados. Rio de Janeiro: IBGE, 1989. 166p.
PEREIRA, A. R.; et al. Agrometeorologia: fundamentos e aplicações práticas. Guaíba: Agropecuária, 478 p. 2002.
RINGMAN, R.; PILGÅRD, A.; BRISCHKE, C.; RICHTER, K.. Mode of action of brown rot decay resistance in modified wood: a review. Holzforschung, v 68, p. 239-246, 2014. http://dx.doi.org/10.1515/hf-2013-0057
SCHEFFER, T. C. A climate index for estimating potential for decay in wood structures above ground. Forest Products Journal, Madison, v. 21, n. 10, p. 25-31, 1971.
SCHMIDT, O. Indoor wood-decay basidiomycetes: damage, causal fungi,physiology, identification and characterization, prevention and control. Mycological Progress, v. 6, p. 261-279, 2007. http://dx.doi.org/10.1007/s11557-007-0534-0
SERVIÇO FLORESTAL BRASILEIRO; INSTITUTO DO HOMEM E MEIO AMBIENTE DA AMAZÔNIA – SFB; IMAZON. A atividade madeireira na Amazônia brasileira: produção, receita e mercados. Belém: SFB/IMAZON, 2010. 20p.
SETTE. D. M.; TARIFA, J. R. O holorítmo e a gênese dos climas no Mato Grosso – Brasil. In: SIMPÓSIO BRASILEIRO DE CLIMATOLOGIA GEOGRÁFICA, 4, Rio de Janeiro, Rio de Janeiro. Anais... Rio de Janeiro: UFRJ, 2000.
SHIMIZU, J.Y.; KLEIN, H.; OLIVEIR, J.R.V. Diagnóstico das Plantações Florestais em Mato Grosso 2007. Cuiabá, MT: Central de Texto, 2007. 63p.
SOUZA, A.P.; MOTA, L.L.; ZAMADEI, T.; MARTIM, C.C.; ALMEIDA, F.T., PAULINO, J. Classificação climática e balanço hídrico climatológico no estado de Mato Grosso. Nativa, Sinop, v. 1, n. 1, p. 34-43, 2013. http://dx.doi.org/10.14583/2318-7670.v01n01a07