Embed Size (px)
Citation preview

The power system in Great Britain is undergoing a radical transformation –
towards a decarbonised, decentralised, and digitalised system. These trends are
profoundly changing the structure of the electricity market, and creating new
challenges for the management and operation of the power system.
This report argues that in order to further decarbonise the power system, and
integrate renewables, we will need to create a power system which is smarter
and more flexible. Many technologies can provide this flexibility, including thermal
power stations, storage, demand response, and interconnectors. However,
the current policy and regulatory framework appears to favour some of these
technologies over others. The regulatory framework has struggled to keep up with
the pace of change within the power system, and needs to be modernised.
This report identifies how to remove the regulatory and policy barriers facing
technologies such as demand response and storage, and create a level playing
field. It also identifies the need for longer term reform of the wholesale power
market to ensure that it values and encourages flexibility, drawing on examples
from other power markets such as Germany and the US. Taken together, these
proposals could create a power system which is smarter, greener, cheaper, and fit
for the 21st Century.
£10.00ISBN: 978-1-910812-20-4
Policy Exchange8 - 10 Great George StreetWestminsterLondon SW1P 3AE
www.policyexchange.org.uk
Policy ExchangePow
er 2.0: Building a smarter, greener, cheaper electricity system
Power 2.0Building a smarter, greener, cheaper electricity system
Richard Howard and Zoe Bengherbi

Policy Exchange is the UK’s leading think tank. We are an educational charity whose mission is to develop and promote new policy ideas
that will deliver better public services, a stronger society and a more dynamic economy. Registered charity no: 1096300.
Policy Exchange is committed to an evidence-based approach to policy development. We work in partnership with academics and other
experts and commission major studies involving thorough empirical research of alternative policy outcomes. We believe that the policy
experience of other countries offers important lessons for government in the UK. We also believe that government has much to learn
from business and the voluntary sector.
Trustees
David Frum (Chairman of the Board), Diana Berry, Candida Gertler, Greta Jones, Edward Lee, Charlotte Metcalf, Krishna Rao, Andrew Roberts,
George Robinson, Robert Rosenkranz, Peter Wall, Simon Wolfson.
Power 2.0Building a smarter, greener, cheaper electricity system
Richard Howard and Zoe Bengherbi

| policyexchange.org.uk2
© Policy Exchange 2016
Published byPolicy Exchange, 8 - 10 Great George Street, Westminster, London SW1P 3AEwww.policyexchange.org.uk
ISBN: 978-1-910812-20-4Printed by Heron Dawson and Sawyer
About the Authors
Richard Howard joined Policy Exchange in 2014 as Head of the Environment & Energy Unit. He has since produced a number of influential reports on topics including energy policy and regulation, energy efficiency and fuel poverty, and air quality. Richard has more than 10 years’ experience in energy and environmental policy, economics, and government affairs. His last role was as Chief Economist at The Crown Estate, and prior to that he worked as an economic consultant. He has a BSc in Economics from the University of Bristol and an MSc in Sustainability, Planning and Environmental Policy from Cardiff University, where he has been a visiting lecturer since 2009.
Zoe Bengherbi is a Research Fellow in Policy Exchange’s Environment and Energy Unit. Prior to joining Policy Exchange, Zoe worked as a Researcher at Dearman, looking at the environmental and health impacts of cooling technologies, before becoming an Associate in the team leading on international strategy and engagement. Zoe read Politics at the University of Nottingham, and has since completed an MSc in Advanced Environmental and Energy Studies from The Centre for Alternative Technologies.

policyexchange.org.uk | 3
Policy Exchange’s Environment & Energy Unit
Policy Exchange’s Environment & Energy Unit conducts innovative and independent policy research into a wide range of environmental, infrastructure and regulatory challenges. Our objectives are to influence policy making and to shape debate. We produce publications, organise events and use the media to promote our findings and policy proposals. A key focus of our work is to identify ways to tackle environmental challenges effectively, while minimising adverse impacts on living standards. We promote well-designed regulation to exploit the power of markets to achieve environmental outcomes innovatively and cost-effectively. If you would like to find out more about our work, please contact:
Richard HowardHead of Environment and EnergyPolicy Exchange8-10 Great George StreetLondon SW1P 3AEEmail: [email protected]: 0207 340 2650www.policyexchange.org.uk

| policyexchange.org.uk4
Contents
About the Authors 2 Policy Exchange’s Environment & Energy Unit 3 Acknowledgements 5 Glossary of terms 6 Executive Summary 7 1 Transformation of the Power System 15 2 New Challenges for the Power System 22 3 Benefits of Flexibility 35 4 Levelling the Playing Field 42 5 Unlocking Flexibility 55 Appendix 1: Overview of Storage Technologies 65 Appendix 2: Data Tables 66

policyexchange.org.uk | 5
Acknowledgements
Policy Exchange is very thankful to Centrica, National Grid and Open Energi for their generous support for this research. The authors would also like to thank Alex Coulton (RES) and Filippo Gaddo (Arup) for providing comments on a draft of this report, as well as the many companies and stakeholders who provided inputs and views during the course of this project.
This report was produced by Policy Exchange, and the views and recommendations in the report are those of Policy Exchange.
| policyexchange.org.uk6
Glossary of terms
Term Definition
BEIS The Department for Business, Energy and Industrial Strategy. Formed in 2016 through the merger of the Department of Energy and Climate Change, and the Department for Business, Innovation and Skills.
DNO Distribution Network Operator: regulated companies which own and operate the 14 regional distribution networks across Great Britain
Demand Side Response Demand response refers to the act of adjusting power demand to meet available supply
CCC The Committee on Climate Change: an independent body established under the Climate Change Act to advise the UK Government on reducing greenhouse gas emissions.
CCGT Combined Cycle Gas Turbine, a type of highly efficient gas power station.
CO2 Carbon Dioxide (CO2) is the main greenhouse gas and the vast majority of CO2 emissions come from the burning of fossil fuels such as coal, gas and oil.
CO2e Carbon Dioxide equivalent: A term used to account for the “basket” of greenhouse gasses and their relative effect on climate change compared to carbon dioxide.
DECC Department of Energy and Climate Change: a former UK government department (see BEIS above).
Embedded Generation Power generation connected directly to the low-voltage distribution network (as opposed to the high-voltage transmission network).
Emissions Intensity A measure of the average greenhouse gas emissions per unit of energy used to provide heating, measured in gCO2/kWh.
Frequency Frequency is a measure of how often the electrical current changes direction within an alternating current power system (such as in the UK).
gCO2/kWh Grams of carbon dioxide equivalent emissions per kilowatt hour of energy used or produced. A measure of “carbon intensity” of a fuel.
kW Kilowatt: a measure of power or electrical output. One kilowatt (kW) equals 1,000 Watts, one Megawatt (MW) equals 1,000 kWs, one Gigawatt (GW) equals 1,000 MWs.
kWh Kilowatt Hour: a measure of electrical energy equivalent to the power consumption of one kilowatt for one hour. One Megawatt hour (MWh) equals 1,000 kWh, one Gigawatt hour (GWh) equals 1,000MWh, and one Terawatt hour (TWh) equals 1,000 GWh.
Ofgem Office of Gas and Electricity Markets: the independent economic regulator for gas and electricity markets and networks, and a non-ministerial Government department.
Reserve Power Sources of power which are used to deal with unforeseen changes in demand and supply.
Transmission System Operator
A company responsible for ensuring the stable and secure operation of the whole transmission system. In the UK, this role is performed by National Grid Electricity Transmission plc (NGET).

Executive Summary
policyexchange.org.uk | 7
1 This report focuses on the power system in Great Britain. Northern Ireland is part of the Single Electricity Market in Ireland, which has its own distinct rules and regulations.
2 Domah, P and Pollitt, M. (2001) ‘The Restructuring and Privatisation of Electricity Distribution and Supply Businesses in England and Wales: A Social Cost–Benefit Analysis’, Fiscal Studies vol. 22, no. 1, pp 107-146
Executive Summary
Transformation of the power systemThe electricity sector in Great Britain1 has changed dramatically since the privatisation of the industry from 1989 onwards. The breakup of the Government-controlled Central Electricity Generating Board (CEGB) led to the creation of a number of regional generation, supply and distribution businesses, as well as National Grid. The regulated market structure that was established emphasised economic efficiency and competition, and ultimately delivered significant savings to consumers (particularly from 1999 onwards).2
Since the 2000s, policy and regulation has shifted to focus on how to decarbonise the power system, and the economy more widely. Under the Climate Change Act (2008) the UK has set a target to reduce annual greenhouse emissions by 80% by 2050 (compared to a 1990 baseline). Power sector emissions have already reduced by 50% since 1990, in part due to the rapid growth of renewable generation capacity, which has increased ten-fold since 2000 and now stands at 32.5 Gigawatts (GW). At the same time, there has been a rapid decline in thermal generation capacity (e.g. coal, oil, gas and nuclear) due to a combination of carbon taxes, environmental regulations and the retirement of ageing power stations. Our analysis shows that a total of 23GWs of thermal capacity has been closed or mothballed since 2010, and a further 24GWs of coal and nuclear capacity is expected to close between now and 2025. The decarbonisation imperative has resulted in a policy and regulatory framework which is no longer about managing conventional market efficiency, but how to reduce environmental externalities in the most cost effective way.
Alongside decarbonisation, the power system is becoming far more decentralised, with a shift from large-scale power stations towards renewables and smaller scale gas and diesel power stations. The share of total generation capacity connected to local distribution networks (as opposed to the transmission network) increased from 8% in 2010 to 26% in 2015, and this is expected to increase further in the future. For example, there are now around 890,000 solar photovoltaic installations around the country totalling 11 GWs of capacity.
The electricity system is also going through a process of digitalisation. The advent of smart meters, advanced controls, improved communications, and decentralised generation and storage is enabling power consumers to become more self-sufficient in energy, and actively manage their demand. For example, many large-scale industrial and commercial businesses now shift their power consumption away from peak times to avoid higher prices, as well as generating additional revenue by providing power to the grid.
The demand for electricity is also changing. Total electricity demand has declined by 15% over the past decade, partly due to improvements in energy efficiency, and partly due to lower economic growth since the 2008 recession.

| policyexchange.org.uk8
Electricity demand may start to increase by 2030 if and when heating and transportation are electrified, but the timing and scale of this growth is highly uncertain due to the costs involved.
New challenges for the power systemThe trends described above have profoundly changed the structure of the electricity market in Great Britain. It was previously the case that power generators made most of their revenue from selling into the wholesale market; market prices were set by the marginal price of fossil fuel generation; and prices provided a signal for new investment. However, the decarbonisation of the power system significantly alters the economics of generation. Renewables and nuclear have high upfront capital costs, but low or negligible running costs. The growth of renewables (in particular solar and wind) is pushing down market prices on average, but also creating greater price volatility. This has vitiated the marginal cost price setting model, and dampened the signal for investment in new generation capacity.
Alongside this, the trends towards decarbonisation and decentralisation are creating some significant challenges for the management and operation of the power system, as follows:
l Balancing: managing the power system is a constant balancing act between supply and demand. This is nothing new, but the growth of renewables capacity has made the job of balancing all the more difficult, given that the power output from wind and solar is more volatile and less controllable than conventional thermal power stations.
l Capacity adequacy: the power system must have sufficient capacity to meet demand at peak times in order to avoid power shortages. Analysis by both Ofgem and National Grid has shown that the “capacity margin” has fallen to very low levels, which is already resulting in price spikes when supplies are tight. The Government has intervened to secure additional capacity through the Capacity Market and other mechanisms.
l Excess capacity and constraints: in contrast to the above, parts of the power system now experience an excess of generation at particular times. For example, on windy or sunny days during the summer the output from renewables capacity in Scotland and Cornwall can exceed the demand for power locally. Where this excess generation exceeds the capacity of the transmission and distribution network, generators may have to be “constrained off” the grid, and in some cases this triggers compensation payments to generators. The total value of these constraint payments more than tripled from less than £100 million in 2005 to £340 million in 2013-14.
l Connection: linked to the above, there are now parts of the grid where it is difficult to connect new generation due to a shortage of spare capacity. This has led to a significant backlog of connection offers in parts of the country such as the South West, where there is already a large amount of solar capacity.
l System (in)stability: the power grid is designed to run at or around a constant frequency and voltage in order to maintain stability and avoid blackouts. System stability has traditionally been maintained by using the “inertia” from thermal
Power 2.0: Building a Smarter, Greener, Cheaper Electricity System
Executive Summary
policyexchange.org.uk | 9
power stations (such as coal, gas and nuclear). However, with the growth of renewables and the decline of thermal capacity, the System Operator National Grid now has to look at alternative ways to stabilise the system, including new technologies such as battery storage.
The upshot of this is that the System Operator (National Grid) is spending more on “balancing services” to manage the system and keep the lights on. The total value of these balancing services has increased from £642 million in 2005-06 to £1,002 million in 2013-14, with these costs ultimately passed on to consumers.
The case for flexibilityOverall it is clear that in order to further decarbonise the power system, it will need to become smarter and more flexible. A number of previous reports have shown that there are significant consumer and environmental benefits from increasing the amount of flexibility in the power system, including through the use of new smart technologies such as storage and demand response. A report by the National Infrastructure Commission suggested that this could yield consumer savings worth £2.9-8.1 billion per year by 2030, equivalent to a reduction in the average household energy bill of £30-90 per year.
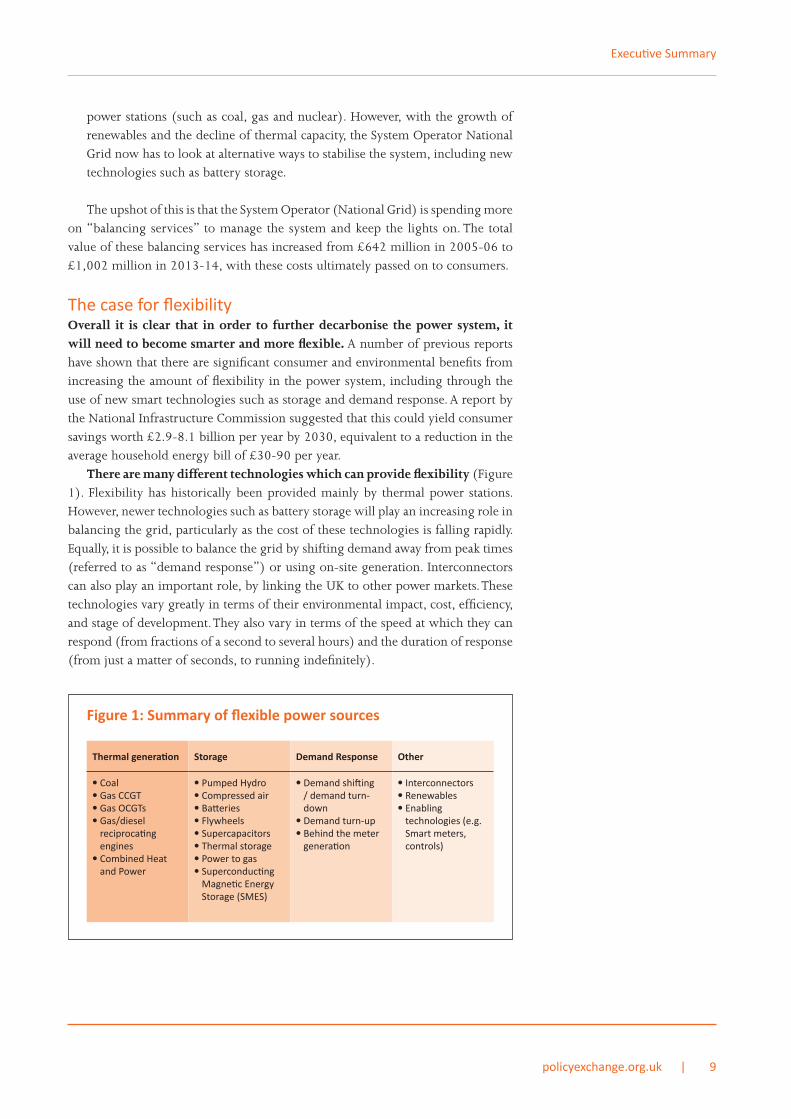
There are many different technologies which can provide flexibility (Figure 1). Flexibility has historically been provided mainly by thermal power stations. However, newer technologies such as battery storage will play an increasing role in balancing the grid, particularly as the cost of these technologies is falling rapidly. Equally, it is possible to balance the grid by shifting demand away from peak times (referred to as “demand response”) or using on-site generation. Interconnectors can also play an important role, by linking the UK to other power markets. These technologies vary greatly in terms of their environmental impact, cost, efficiency, and stage of development. They also vary in terms of the speed at which they can respond (from fractions of a second to several hours) and the duration of response (from just a matter of seconds, to running indefinitely).
Figure 1: Summary of flexible power sources
Thermal generation Storage Demand Response Other
l Coall Gas CCGTl Gas OCGTsl Gas/diesel
reciprocating engines
l Combined Heat and Power
l Pumped Hydrol Compressed airl Batteriesl Flywheelsl Supercapacitorsl Thermal storagel Power to gasl Superconducting
Magnetic Energy Storage (SMES)
l Demand shifting / demand turn-down
l Demand turn-upl Behind the meter
generation
l Interconnectorsl Renewablesl Enabling
technologies (e.g. Smart meters, controls)

| policyexchange.org.uk10
It is clear from our analysis that these technologies are not treated equally within the current regulatory, policy and fiscal regime. Some of the cleanest forms of flexibility (such as demand response and storage) face policy and regulatory barriers which are inhibiting their deployment. On the other hand, the policy and regulatory framework appears to favour much dirtier forms of flexibility, in particular diesel engines. This is damaging both from a consumer and environmental point of view. The focus of this report is on how to address these barriers and distortions, “level the playing-field” and put all technologies on a more even footing.
Levelling the playing fieldThe current regulatory regime was to a large extent devised during the process of privatisation from the 1990s onwards. Whilst it has evolved to an extent, the regulatory regime has struggled to keep up with the pace of transformation of the power system now underway. This has created a number of barriers to the deployment of clean flexibility technologies such as demand response and storage, as follows:
Storage: At present, electricity storage is not defined as a distinct type of regulated activity. This has created a number of issues such as ‘double charging’. When power is consumed, a number of levies are charged relating to the cost of clean energy policies such as the Renewables Obligation. In the case of storage these charges are levied twice – once when the storage device is charged, and again when the same power flows to an end consumer. This presents a major cost to storage operators, which is not borne by other forms of flexibility such as thermal power stations, and puts them at a commercial disadvantage.
l We recommend that the Electricity Act 1989 and associated grid codes are updated to define new activities such as storage and demand response.
l Regulatory changes are needed to remove the ‘double-charging’ of environmental levies on storage. This could be achieved by exempting storage from these charges altogether, or calculating them on a ‘net’ basis rather than a ‘gross’ basis. Storage should still pay for the use of the grid system.
Demand Response: There is significant potential for businesses (and to a lesser extent households) to adjust their power usage in order to help balance the electricity system. For example, major power users already reduce their demand at peak times or shift their consumption to other times of day to avoid peak power prices. This is often done through an “aggregator” company, which sells this demand flexibility into the market. However as it stands, the regulatory regime prevents aggregators from participating in the wholesale electricity and balancing markets, despite the fact that they could play an important role in helping to balance demand and supply.
l We recommend that regulations are changed to allow aggregators to sell demand response into the wholesale electricity market and balancing market. In doing so, it is crucial that the relationship and responsibilities of aggregators and energy suppliers are clearly defined.
Power 2.0: Building a Smarter, Greener, Cheaper Electricity System

Executive Summary
policyexchange.org.uk | 11
In addition to technology-specific issues there are some wider regulatory and policy design issues, which are holding back the deployment of smart technologies and distorting competition between flexibility options, such as:
Regulation of Distribution Network Operators (DNOs): DNOs are private companies which own and operate the 14 regional distribution networks across Great Britain. They have a responsibility to distribute power to end-users, as well as connecting new generation to the grid. They are obliged to do this in the least-cost way, since network costs are ultimately passed on to consumers.
The role of DNOs is changing significantly as we move towards a more decentralised pattern of generation. Previously DNOs had a relatively passive role, distributing power from the transmission system down to end users. The growth in decentralised generation has complicated the picture and created a number of new issues for the management and operation of distribution networks. DNOs will need to take a far more active role in managing their networks going forward.
l DNOs should be encouraged to consider new approaches to managing their networks such as demand response and storage. The rules and regulations governing DNOs are outdated, and need to be updated to reflect these new possibilities.
l DNOs should not be permitted to own storage, since this could distort competition, but should be able to procure the services of batteries and other forms of storage to alleviate network constraints.
l There will need to be greater coordination between DNOs and the System Operator (National Grid) to manage the overall power system.
Capacity Market: The Capacity Market is a mechanism that was introduced by the Government in order to ensure there is enough capacity on the system to meet peak demand in the future. Capacity is procured through a series of annual auctions. The Capacity Market was intended to be technology-neutral but its design has created barriers to smart technologies such as demand response and storage. The Government has already made progress to rectify this but more needs to be done to level the playing field.
l Review Capacity Market rules and requirements to ensure that they do not unfairly penalise cleaner forms of flexibility such as demand response and storage.
l Allow demand response providers to access a 3-year capacity contract on the same basis as power stations undergoing refurbishment.
l Discontinue the separate Transitional Arrangements auction for demand response.
Overall, it is clear that cleaner forms of flexibility such as demand response and storage face a number of policy and regulatory barriers, which are not faced by other forms of flexibility. Conversely, there are aspects of the current regime which create an advantageous position for dirtier forms of flexibility, such as small-scale diesel engines. This has led to a proliferation of “diesel farms” over the last few years, with a significant share of contracts being awarded to diesel in the last two Capacity Market auctions. Whilst diesel engines are cheap to build,

| policyexchange.org.uk12
they are also highly polluting – emitting significant quantities of greenhouse gases and local pollutants which are harmful to human health. Despite this, they fall outside the remit of many policies concerning emissions of greenhouse gases and local pollutants, giving them an unfair advantage over other forms of flexibility.
l Diesel generators are the most carbon intensive form of generation and should be subject to carbon taxes. The Carbon Price Support and Climate Change Levy should be extended to liquid fuels used in power generation, such as diesel and oil.
l Defra should create a set of national standards to regulate emissions from small scale diesel and gas generators (under 50MWs). This should be a two-tier system with different standards for more and less polluted areas. The regulations need to distinguish backup generators from those used commercially.
Unlocking flexibilityBeyond these short term actions, there is also a need for much longer term thinking on how to create a smarter, more flexible power system. The challenges identified above cannot be tackled purely through a piecemeal and incremental approach to policymaking. What is needed is a more substantial overhaul of the foundations of the power market itself, as well as the ancillary markets and network charging arrangements which sit around it. We argue that as far as possible this should be done through market-based mechanisms, rather than “procuring” flexibility, and suggest how these markets should be designed.
Reform of the wholesale market The nucleus of the power system in Great Britain is already shifting away from the wholesale market towards the Capacity Market and ancillary services. The Government and the System Operator now play an ever-increasing role in “procuring” capacity and flexibility. This creates a temptation to “pick winners” and favour certain technologies rather than focusing on least-cost solutions. However the transition away from the wholesale market is not inevitable. Successful reform of the wholesale market could mean that less balancing is required outside the market. We propose a substantial redesign of the wholesale market in order to increase its dynamism, efficiency and flexibility, as follows:
Firstly, the wholesale market could be reformed to build in more temporal resolution. The power market in Great Britain currently operates in 30 minute blocks, with all trading ceasing one hour before the delivery of power. Allowing trading to continue closer to the point of delivery of electricity would mean that more balancing can be done within the wholesale market, reducing the need to balance outside the market.
Secondly, the wholesale market could also build in greater geographic resolution, possibly moving to a system of ‘nodal pricing.’ At present we have a single wholesale market across the whole of Great Britain, which neither reflects the geographical patterns of demand and supply, nor the physical constraints within the power network. For example, energy retailers may purchase generation from Scotland or the South West of England, even if it is not possible for this power to travel to end users due to a network constraint. Network operators may
Power 2.0: Building a Smarter, Greener, Cheaper Electricity System

Executive Summary
policyexchange.org.uk | 13
3 Source: Adapted from Open Energi
then have to take costly actions to balance the system on both sides, by turning down the excess generation, and turning on generation on the other side of the constraint. These constraint issues are likely to be exacerbated as we move to a system with more renewables and decentralised generation capacity.
A possible solution would be to move to a system of “nodal pricing”, in which the system is disaggregated into a number of nodes, and the value of electricity generated at each node can vary. The market price will tend to drop when an area is over-supplied, and increase when there is a shortage of power. Moving to this type of system would create a locational price signal, encouraging generators to locate closer to demand and reduce their impact on the grid network. It would also strengthen the economic case for new technologies such as demand response and storage. Examples of successful nodal markets include New Zealand, Singapore, and several US regional markets. Evidence from these markets suggests that there are significant consumer benefits from moving to a nodal pricing system, which far outweigh the implementation costs.
Reform of Ancillary MarketsAlongside this, there will still be a need for other ancillary services to balance the grid (such as the Capacity Market, frequency response, and reserve). In the UK, these markets are generally run by the System Operator (National Grid). There has been a significant expansion in the scope and extent of these markets in recent years, and there are now over 20 individual mechanisms used to manage the grid. There is now a very complex web of policies and incentives for companies wishing to offer flexibility to the market (Figure 2).
Figure 2: Markets for flexibility3
Procured services
Reserve
DSBR
SBR
BM Start-Up
Fast Reserve
STOR
Demand Management
Demand Turn-Up
Frequency regula�on
Capacity Market
T-1 auc�on
T-4 auc�on
TA auc�on
EDR pilot
Distribu�on Network Operators
Price Signals
Balancing Mechanism
Wholesale Market
Day Ahead Trading
Intraday Trading
Grid charges/levies
BSUoS
DUoS(Red Rate)
TNUoS (Triad periods)
Capacity Market Levy
Site Op�misa�on
Maximum Import Managment
Import/ Export Tariff
Mandatory Frequency Response
FCDM
FFR
EFR
EFCC

| policyexchange.org.uk14
This complexity makes it very difficult for companies to navigate the various markets and incentives in order to make their projects viable. It has also created some tensions and unintended consequences. For example, participants in one flexibility market are sometimes precluded from operating in another market, simply due to the differences in how these services are procured or the operational restrictions placed on participants. There are also examples of over-lapping policies which provide multiple incentives to achieve the same objective.
We recommend that the Government, Ofgem and the System Operator work together to reform these ancillary markets, based on the following broad principles:
l Reduce complexity: ancillary markets should be rationalised and simplified to reduce complexity. For example, Germany has just three balancing and ancillary markets, which operate on a shared market platform.
l Follow system needs: ancillary markets should be designed to address specific system needs at both transmission and distribution level. This needs to reflect new system issues (such as excess summer generation) as well as well-established issues (such as ensuring there is enough capacity to meet peak demand).
l Create liquid markets: where possible, ancillary services should take the form of liquid, traded markets, with multiple buyers and sellers of a particular service. The Balancing Mechanism is a good example of such a liquid market. Other ancillary markets could move towards this model, for example, both the System Operator and DNOs could procure flexibility through a common trading platform.
l Open, technology neutral markets: ancillary markets should be open, competitive, and technology-neutral, identifying the cheapest technologies able to meet system needs, rather than designing services with a particular technology in mind. The Government and System Operator should avoid setting technology-specific targets for demand response or storage.
l Transparency: The System Operator and DNOs should provide greater transparency on current and future system needs, including an indication of the requirements for ancillary services and the timing of future tenders.
Reform of Network ChargesAs well as reforming markets, there is a need to reform network charges to ensure that they are cost-reflective. Network charges are used to recover the cost of maintaining transmission and distribution networks. They are paid by generators and consumers of electricity, and currently make up 25% of the average household energy bill. The design of network charges has a very significant bearing on the behaviour of generators and users of power. Network charges should ideally be designed to reflect the cost that different activities place on the system. However there is a broad consensus that it is not the case and there is a need for reform.
An issue which has attracted significant attention is “embedded benefits” – the financial benefits available to generators connecting to the distribution network. Ofgem recently announced that it intends to review embedded benefits, and favours an approach of incremental changes through modifications of industry codes. However, this approach fails to acknowledge that changes to embedded benefits in isolation could have far reaching impacts on the electricity industry. We recommend Ofgem should undertake a holistic review of network charging arrangements to ensure that they are cost-reflective. This will take considerable time, therefore it would be sensible to also advance some short term measures to contain the issue of embedded benefits until the wider review has been completed.
Power 2.0: Building a Smarter, Greener, Cheaper Electricity System
policyexchange.org.uk | 15
4 Domah, P and Pollitt, M. (2001) ‘The Restructuring and Privatisation of Electricity Distribution and Supply Businesses in England and Wales: A Social Cost–Benefit Analysis’, Fiscal Studies vol. 22, no. 1, pp 107-146
5 Committee on Climate Change (2016) Meeting Carbon Budgets – 2016 Progress Report to Parliament
6 Ibid.
7 DECC (2005) Digest of UK Energy Statistics
8 Ibid.
1Transformation of the Power System
The electricity system in Great Britain has changed dramatically in the period since the privatisation of the industry from 1989 onwards. The breakup of the Government-controlled Central Electricity Generating Board (CEGB) led to the creation of a number of regional generation, supply and distribution businesses, as well as National Grid. The regulated market structure that was established following privatisation emphasised economic efficiency and competition, and ultimately delivered significant savings to consumers (particularly from 1999 onwards).4
The power system has changed dramatically since 2000, with trends towards decarbonisation, decentralisation, digitalisation, and changes in demand, as described below. Chapter 2 sets out how these rapid and profound changes are altering the economics of the power market, and creating challenges for the operation and management of the power system.
DecarbonisationUnder the Climate Change Act (2008) the UK has committed to reduce annual greenhouse gas emissions by 80% by 2050, relative to 1990 levels. In addition, the Government has set a series of five-yearly “carbon budgets”, the latest of which covers the period 2028-2032. Electricity generation currently accounts for just over one fifth of total UK greenhouse gas emissions (21%).5 Significant progress has already been made to decarbonise the power sector, with annual emissions having halved since 1990.6 This is due to a rapid expansion of renewable electricity capacity, combined with a shift away from highly carbon-intensive forms of generation such as coal and oil.
The UK has seen a huge expansion in renewables since 2000 (in particular since 2010) as the UK has sought to deliver against not only carbon targets, but also the renewable energy targets established under the European Renewable Energy Directive (2009). Renewable energy projects have been subsidised through a number of mechanisms such as the Renewable Obligation, Feed-in Tariff, and most recently the Contract for Difference. As of June 2016, there was a total of 32.5 Gigawatts (GWs) of renewable generation capacity, mainly comprising solar (10.6GW), onshore wind (9.6GW), offshore wind (5.1GW) and biomass (3.2GW). This represents a more than ten-fold increase since 2000, when total renewable energy capacity stood at just 3 GWs.7 The proportion of electricity generated from renewables increased from 2.5% in 2000, to 7% in 2010 and almost 25% in 2015.8

| policyexchange.org.uk16
9 BEIS (2016) Digest of UK Energy Statistics. Data is provided in tabular form in Appendix 2.
10 Source: The Crown Estate
11 On a ‘levelised cost’ basis. Source: Bloomberg New Energy Finance
12 KPMG / REA (2015) UK solar: beyond the transition
13 Howard, R. (2015) Powering Up, Policy Exchange
14 National Grid (2016) Future Energy Scenarios
Figure1.1:Electricitygenerationfromrenewables,2000-20159
0
10
20
30
40
50
60
70
80
90
Teraaw
att H
ours
(TW
h)
Offshore wind Onshore wind Solar photovoltaics Bioenergy Hydro
20002001
20022003
20042005
20062007
20082009
20102011
20122013
20142015
The growth of renewables is expected to continue rapidly. There is a significant amount of capacity currently under construction, for example a further 4.5GW of offshore wind capacity is expected to be constructed between now and 2020, taking the total installed capacity to nearly 10 GWs.10 As renewables are deployed, their cost tends to fall due to economies of scale and technology advances. The most rapid cost reductions can be seen in solar photovoltaics (PV), where over the period 2009 to 2013, the global installed capacity increased from around 20 GWs to nearly 140GWs, and costs fell by more than 60%.11 The rapid decline in the cost of solar PV means that it has already reached cost-parity with fossil fuel generation in some parts of the world. It is expected that solar PV could become viable without subsidy in the UK by around 2020 for commercial-scale installations, and by the mid-2020s for smaller-scale domestic installations.12
Similarly, there has already been a substantial reduction in the cost of onshore wind, as documented in our previous report Powering Up.13 The cost of offshore wind is also declining rapidly: projects committed in 2014 secured subsidies of up to £150/MWh, whereas it is expected that projects built in the early 2020s will cost £85-105/MWh or less. In line with these reductions in cost, the Government has reduced the level of subsidy available and moved to a more competitive process for allocating support in order to minimise the cost to the consumer (as recommended in our previous reports Going, Going Gone, and The Customer is Always Right).
Overall, it is expected that the share of generation from renewables will continue to increase to around 50% by 2030. The Committee on Climate Change has suggested that renewables will need to provide 45-55% of all electricity by 2030 in order for the UK to deliver the emissions reduction set in the 5th Carbon Budget (which covers the period to 2032). Similarly, National Grid scenarios suggest that renewables will provide 42% to 70% of all power output in 2030.14
Whilst the UK is experiencing a boom in renewables, there has been a significant decline in the fleet of large thermal power stations (coal, oil, gas and nuclear). In 1990, the GB power system was dominated by coal and oil power stations, which together supplied nearly 80% of all power (Figure 1.2). The generation mix changed significantly during the 1990s, with a “dash for gas” culminating in over 20 GWs of Combined Cycle Gas Turbines (CCGTs) being
Power 2.0: Building a Smarter, Greener, Cheaper Electricity System

Transformation of the Power System
policyexchange.org.uk | 17
15 BEIS (2016) Digest of UK Energy Statistics, Table 5.1.1
16 BEIS (2016) Historical electricity data: 1920 to 2015. Data is provided in tabular form in Appendix 2.
17 BEIS (2016) Digest of UK Energy Statistics, Table 5.C
18 Fiddler’s Ferry and Eggborough
constructed between 1990 and 2010. This was driven by the privatisation of the energy industry, the lifting of restrictions on gas generation, the increasing gas production from the North Sea, and the low gas prices at the time. The share of gas generation increased from close to zero in 1990 to 46% in 2010.15 CCGTs are considerably cleaner than coal or oil generation (in terms of emissions of greenhouse gases and local pollutants) and are also able to operate more flexibly than coal or nuclear.
Figure 1.2: Electricity supplied by technology, 1970 to 201516
0
50
100
150
200
250
300
350
400
Terawatt
Hou
rs (T
Wh)
Renewables (wind, solar, hydro) Nuclear Gas CCGT Coal, oil & biomass
1970 1975 1980 1985 1990 1995 2000 2005 2010 2015
Power generation from coal and oil has declined significantly, falling from 79% of total generation in 1990 to 34% in 2015. This is due to a combination of factors including carbon taxes, environmental regulation, and competition from gas and renewables. Under the European Large Combustion Plant Directive, introduced in 2001, power stations either had to comply with specific emissions limits, or “opt out” - in which case they were subject to restricted running hours and had to close altogether by 2015. In addition, the UK Government introduced a Carbon Price Floor in 2013, which imposed an additional tax on fossil fuel generation, increasing the relative cost of coal generation. As a consequence of these policies, over 15 GW of coal and oil power stations have closed since 201017 and another 4GW of coal capacity is likely to close in 2017.18 Beyond this, the Government announced in November 2015 that it intends to phase out coal generation entirely by 2025, which will result in the remaining 13.5 GW of coal capacity closing.
Whilst coal generation has generally been in decline, it did experience a short renaissance over the period 2010-2012, as the shale gas boom in the US led to the European market being flooded with cheap coal. This caused gas power stations to run for fewer hours, damaging their profitability, and around 4.5 GW of gas power plants were either closed or mothballed during the period 2010 and 2015.

| policyexchange.org.uk18
19 BEIS (2016) Historical electricity data: 1920 to 2015
20 BEIS (2016) Digest of UK Energy Statistics
21 Gov.uk (date unknown) Table of past and present UK nuclear reactors
22 Of which 13.7 GW coal, 3.7GW oil, 4.4GW gas and 1.4GW nuclear
23 BEIS (2016) Digest of UK Energy Statistics, Table 5.12
24 BEIS (2016) Solar Photovoltaics Deployment in the UK, August 2016
25 National Grid (2016) Future Energy Scenarios
Alongside this, generation from nuclear has also been in decline since 1990 due to the retirement of the first generation of Magnox reactors (totalling around 4.1 GWs of capacity). The proportion of power supplied by nuclear fell from a peak of 27% in 1993 to 20% in 2015.19 Today the UK has 10GWs of remaining nuclear capacity20 but over two thirds of this is due to retire from the system by 2025.21 The UK plans to deliver a new generation of nuclear power stations, and has recently approved the 3.2GW Hinkley Point C project in Somerset, which is scheduled to be operational by 2025 and provide around 7% of total power generation.
Overall, the generation mix in Great Britain has changed dramatically since 1990, as the decarbonisation of the power system has gathered pace. Since 2010, a total of 23GWs of thermal capacity has been closed or mothballed.22 A further 24GWs of coal and nuclear capacity is expected to close between now and 2025. Meanwhile, renewable energy capacity has increased ten-fold since 2000, and now stands at 32.5GWs.
DecentralisationAlongside the shift from fossil fuel to renewable generation, there has also been a marked change in the size and location of generation plants in recent years. At the point of privatisation, the power system was composed mainly of large-scale coal, gas and nuclear power stations. This formed a top-down system in which power was generated at transmission level and flowed down through distribution networks to end users (Figure 1.3).
In recent years, there has been a significant growth in “distributed” or “embedded” generation and storage capacity connected to the local distribution network. This includes everything from solar photovoltaic (PV) panels at domestic scale, to gas turbines located at industrial and commercial premises, to medium-scale onshore wind farms. The amount of distribution-connected capacity increased from 7.1GWs in 2010 to 25.1GW in 2015, whilst over the same period the amount of transmission-connected capacity declined from 81.9GWs to 70.9GWs.23 Distribution-connected capacity now makes up 26% of all capacity, compared to just 8% in 2010. The bulk of this growth relates to solar PV and onshore wind. Government data shows that there are now 890,000 small-scale solar PV installations around the country, totalling 11GWs of capacity.24 National Grid predicts that up to a further 16.8GWs of distributed capacity could be added to the power system between 2015 and 2025.25
The growth in distributed generation has been driven partly by the change in the technology mix, for example solar PV installations are generally connected to the distribution network since they are each relatively small. The growth of distributed generation has been further encouraged due to the structure of grid charges, which creates a significant cost advantage for projects connecting to the distribution network (see Chapter 5 for further discussion). The growth of distributed generation has implications for the management of the power system (see Chapter 2) since this capacity is not visible or controllable by the System Operator, National Grid and results in more complex power flows across the grid network (see Figure 1.3).
Power 2.0: Building a Smarter, Greener, Cheaper Electricity System

policyexchange.org.uk | 19
26 NIC (2016) Smart Power
Figure 1.3: Evolution of the power system26
DigitalisationElectricity consumers have traditionally been thought of as largely passive: using power when they need it, but not actively participating in the power market. However, this is beginning to change due to the advent of digital technologies such as smart meters, advanced controls, and batteries.
Smart meters and controls can provide consumers with more information about their power usage and energy costs. Having this information may encourage consumers to use less power, or to change their patterns of energy use, provided that incentives are in place to do so. As it stands, large industrial and commercial consumers are exposed to fluctuations in prices to a far greater extent than domestic consumers. For example, large consumers with half-hourly meters
Transformation of the Power System
TRADITIONAL POWER SYSTEM
GENERATIONTRANSMISSION
DISTRIBUTION
DISTRIBUTIONAUTOMATION
DEVICES
Power Sta�on Power Transformer Transmission substa�on
Distribu�onsubsta�on
Storage
RESIDENTIALCONSUMERS
COMMERCIAL AND INDUSTRIAL BUSINESS
CONSUMERS
FUTURE POWER SYSTEM
GENERATIONTRANSMISSION
DISTRIBUTION
RESIDENTIALCONSUMERS
COMMERCIAL AND INDUSTRIAL BUSINESS
CONSUMERS
Power Sta�on Power Transformer Transmission substa�on
StorageStorage
Solar PV power plant
Solar PV power plant
Solar PVpower plant
DISTRIBUTIONAUTOMATION
DEVICES
Wind power plant
Wind power plant
Distribu�onsubsta�on

| policyexchange.org.uk20
27 Frontier Economics / LCP (2015) Future potential for DSR in GB.
28 DTI (2015) DTI Energy and Emission Projections
29 National Grid (2016) Future Energy Scenarios
are able to avoid certain network charges by reducing their power consumption during peak periods (so called “red rate” or “Triad” periods). The largest energy consumers purchase power directly from the wholesale market, rather than through a supplier, and are therefore exposed to fluctuations in spot prices. This means that companies that are able to adjust their demand patterns to avoid peak periods can save a significant amount on their energy bills, whilst also helping to alleviate system challenges.
At present most domestic consumers are not exposed to these price signals, since they are charged the same flat price for all the power they use (the exception being customers on off-peak “Economy 7” tariffs). However, the rollout of smart meters will enable energy suppliers to offer “Time of Use” tariffs – whereby prices vary according to the time of day. Some suppliers are already experimenting with these types of tariffs, such as the “FreeTime” tariff offered by British Gas, whereby customers get free electricity on Saturday or Sunday daytimes.
In addition, more and more households and businesses now have some form of on-site generation or storage – whether this is in the form of a backup generator, solar panels or a battery. A report for Government estimated that there could be as much as 20GW of back up generation already installed in industrial and commercial premises in the UK.27 The use of on-site generation allows consumers not only to reduce the amount of power they draw from the grid, but potentially also to export power in order to generate revenue and help to alleviate system constraints. As discussed further in Chapter 3, this form of “demand response” can make a significant contribution to increasing flexibility and reducing system challenges.
Demand uncertaintySignificant changes are taking place in terms of the demand for electricity. Total power consumption increased significantly during the 1990s and early 2000s, reaching a peak of 377TWhs in 2005 (Figure 1.4). At the time, the Department for Trade and Industry projected that electricity demand would stay at a similar level or increase by 2020.28 However, electricity demand has in fact fallen by some 15% since 2005 due to the impact of the recession from 2008 onwards, rapid increases in electricity prices, and significant improvements in energy efficiency (e.g. more efficient lighting and appliances).
There is significant uncertainty about electricity demand going forward. Scenarios produced by National Grid show that electricity demand is likely to fall by up to 5% between now and the mid-2020s, as a result of further improvements in efficiency.29 Beyond this there is far greater uncertainty (Figure 1.4). The electrification of heating and transport could potentially increase power demand by as much as 20% over the period 2020 to 2040. However, the previous Government’s strategy to largely electrify heating by 2050 could turn out to be extremely expensive, as discussed in our recent report, Too hot to handle?.
The pattern of electricity consumption is also expected to become more “peaky”, with peak demand increasing faster than total annual demand. National Grid’s “Gone Green” scenario suggests that peak demand could increase from the current level of 61.1GWs to as much as 75.5GWs by 2040.
Power 2.0: Building a Smarter, Greener, Cheaper Electricity System

Figure 1.4: National Grid scenarios for annual electricity demand30
Chapter summary
l The UK power system is changing rapidly due to a number of ongoing trends:
l Decarbonisation: Power sector emissions have fallen by 50% since 1990. The UK’s fleet of coal, oil and nuclear power stations is in decline, with 23GWs of capacity having closed since 2010, and a further 24GWs due to close by 2025. At the same time, renewable electricity capacity has increased from 3GWs in 2000 to 32.5GWs in June 2016, and renewables now account for 25% of total power generation.
l Decentralisation: there has been a shift from large thermal power stations connected to the transmission system towards small scale generation connected to the local distribution system. National Grid forecasts that up to a further 16.8GWs of distributed capacity could be added to the power system between 2015 and 2025.
l Digitisation: the advent of smart meters, controls and distributed generation is allowing electricity consumers to become active rather than passive. Large industrial and commercial power users are already shifting their demand in order to reduce their electricity bills.
l Demand: electricity demand has reduced by 15% over the last decade, and is expected to decline further by the early 2020s. The electrification of heating and transport may lead to an increase in power demand, although this is somewhat uncertain.
policyexchange.org.uk | 21
30 National Grid (2016) Future Energy Scenarios. Data is provided in tabular form in Appendix 2.
250
270
290
310
330
350
370
390
410
TWh/
year
Historic Gone Green Slow Progression No Progression Consumer Power
2005 2010 2015 2020 2025 2030 2035 2040
Transformation of the Power System

| policyexchange.org.uk22
31 BEIS (2016) Digest of UK Energy Statistics. Power stations over 1MW installed capacity.
32 DECC (2015) Delivery UK Energy Investment: Networks
33 The remaining 7% of total demand relates to losses within the system
34 National Grid (2016) Future Energy Scenarios
35 NIC (2016) Smart Power
2New Challenges for the Power System
This Chapter describes how the power system and markets operate in Great Britain. It then sets out how the trends outlined above towards decarbonisation, decentralisation and digitalisation, are creating new challenges for the management and operation of the power system, and altering the economics of the power market.
Overview of the power system in Great BritainThe power system in Great Britain consists of around 740 major power stations31 and 26 million customers (households and businesses). These are connected together by a grid network of 800,000 kilometres of cables, comprising a national transmission system, and 14 local distribution networks.32 Total electricity consumption was 334 TWhs in 2015, with a fairly even split between residential (33%), industrial (30%), and commercial demand (30%).33
The demand for electricity varies constantly over the course of the year. Businesses tend to use electricity mostly during the working day whereas households tend to use more electricity in the mornings and evenings. Peaks in demand occur in the late afternoon in the winter when both business and domestic users are drawing power from the grid (Figure 2.1). National Grid figures indicate that peak demand was 61.1GWs in 2015.34
Figure 2.1: GB electricity demand profile35
Winter Summer
60
Noon6 am 6 pm
50
40
30
20
10
0
Dem
and
(GW
)

New Challenges for the Power System
policyexchange.org.uk | 23
36 Adapted from ELEXON
The power system must achieve a constant balance between demand and supply, since there is only a limited amount of storage within the system. This balance is achieved firstly through the “dispatch” of power stations, with the output from power stations adjusted up and down in order to reflect demand patterns. Electricity is traded in the wholesale market between generators and suppliers, with suppliers purchasing electricity on behalf of their customers. This trading can either take place through bilateral deals, or on trading platforms such as APEX and Nordpool. Electricity is traded in half hourly blocks called “settlement periods” (there are 48 settlement periods per day). Trading takes place well ahead of the settlement period itself, sometimes even years ahead, and continues right up to one hour before delivery - a moment that is referred to as “gate closure”.
Figure 2.2: Operation of the power system36
Wholesale Market Secondary Markets
Settlement Period
Imbalance Settlement
Years in advance 1 hour 30 minutes 14 months
ELEXON
Sellers
Buyers
Balancing Mechanism
& Balancing Services
Delivery of power
Gat
e Cl
osur
e
All generators and suppliers must try to match their actual generation and demand respectively to their traded contracts so that they do not have either a surplus or deficit of electricity (which would otherwise result in them having to pay imbalance penalties). In order to help them predict how much electricity will need to be dispatched and when, National Grid produces forecasts based on historic demand patterns (Figure 2.1).
All trading in the wholesale market stops at gate closure, one hour prior to delivery. All parties then send their final energy positions to National Grid which adds them together in order to find out whether the system will be in balance or not, taking into account the predicted generation, likely demand, and the contracts in place. It then becomes the responsibility of National Grid as the System Operator to act as the residual balancer and ensure that demand and supply will balance in real-time. Along with a notification of their final positions, suppliers and generators submit bids and offers to modify their positions in exchange for

| policyexchange.org.uk24
37 Frerk, M. (2015) Presentation, Power Responsive, 18 June
38 For example the Balancing Services Use of System (BSUoS) charge and the Transmission Network Use of System charge (TNUoS).
39 Distribution Use of System charge (DUoS)
40 Ofgem (2015) Supply market indicator – March 2014 to April 2015
remuneration. This system of bids and offers is called the Balancing Mechanism, and operates for the final hour before the delivery of power (Figure 2.2).
In addition to maintaining a balance between demand and supply over each settlement period, National Grid also needs to account for short term events such as fluctuations in demand or power station outages. For example, large surges in power demand can occur during advertisement breaks in popular TV programmes, when people turn on their kettle or open a fridge door - a phenomenon known as a “TV pickup”. Andy Murray’s victory in Wimbledon in 2013 led to a massive 1.6GW drop in electricity demand as people watched the game, followed by a surge in demand as people resumed their normal activities (Figure 2.3). Similarly, Open Energi noticed a 280 MW spike in electricity demand in the last week of August 2016 immediately following the broadcast of a new episode of the Great British Bake Off.
Figure 2.3: UK electricity demand during Andy Murray’s 2013 Wimbledon final37
29.8
30.0
30.2
30.4
30.6
30.8
31.0
31.2
31.4
31.6
31.8
15:00 14:00 16:00 17:00 18:00 19:00
Typical day
Men’s FinalMatch begins
End of 2nd set
Murray breaks for match
End of broadcast
Murray wins
Dem
and
(GW
)
End of 1st set
Besides the Balancing Mechanism, National Grid uses a range of tools to manage the power system. These are referred to as “ancillary services”, and include services such as Frequency Response, and Reserve to ensure the system remains stable in the face of changes in demand and unexpected events (see below for further discussion). National Grid recovers the cost of balancing the power system and running the transmission network through charges levied on generators and end-consumers.38 Similar charges are levied on consumers and generators to cover the cost of running local distribution networks.39 In total these network and system charges make up a quarter of the average household electricity bill (see Chapter 5).40
Balancing challengeThe transition to a lower carbon power system is making the job of balancing demand and supply more difficult and costly. Traditionally the power system has operated with a mixture of “baseload”, “flexible” and “peaking” power stations. Baseload power stations, such as coal and nuclear, run continuously at full capacity. On top of this, flexible power stations such as Combined Cycle Gas Turbines
Power 2.0: Building a Smarter, Greener, Cheaper Electricity System
policyexchange.org.uk | 25
41 National Renewable Energy Laboratory (2014) Flexibility in 21st Century Power Systems
42 Ibid
(CCGTs) can be dispatched to match the general profile of demand. Finally, since there is a limit to the flexibility even of CCGTs, the system also relies upon smaller scale “peaking plants” and pumped hydro storage facilities which can react very quickly to changes in demand. Together these have formed the backbone of power system operations over the last few decades.
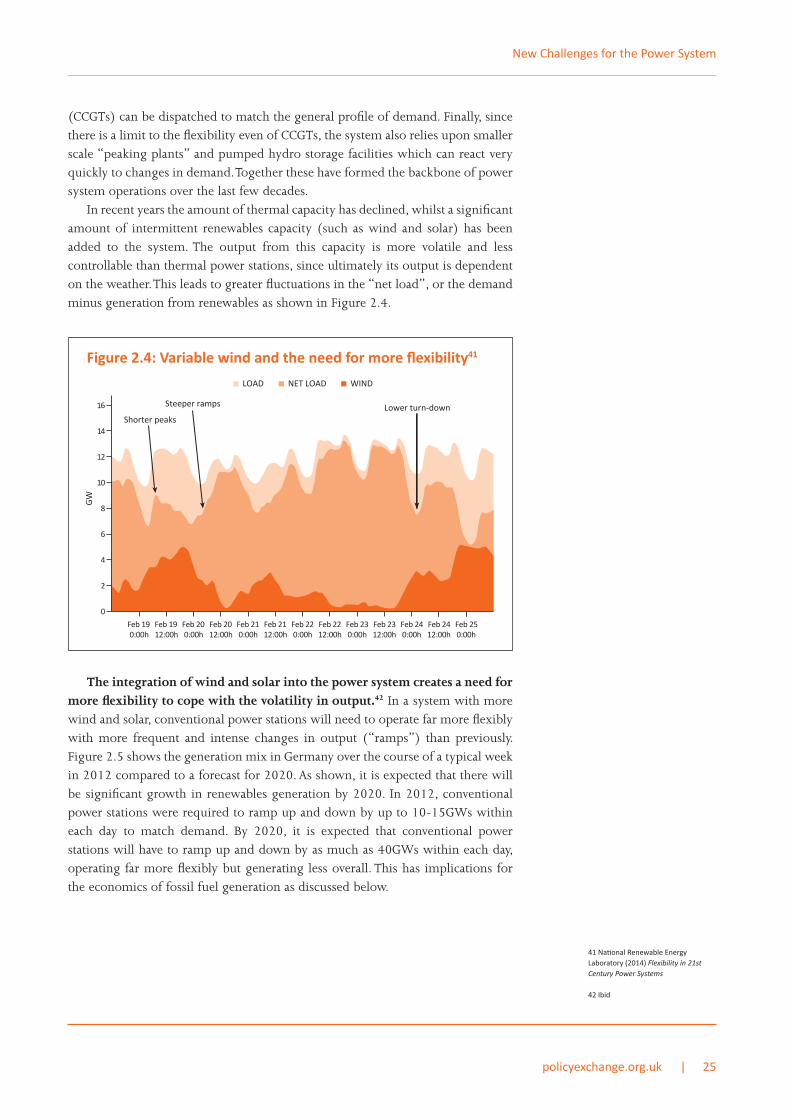
In recent years the amount of thermal capacity has declined, whilst a significant amount of intermittent renewables capacity (such as wind and solar) has been added to the system. The output from this capacity is more volatile and less controllable than thermal power stations, since ultimately its output is dependent on the weather. This leads to greater fluctuations in the “net load”, or the demand minus generation from renewables as shown in Figure 2.4.
Figure 2.4: Variable wind and the need for more flexibility41
0
2
4
6
8
10
12
14
16 Steeper ramps
Shorter peaksLower turn-down
GW
LOAD NET LOAD WIND
Feb 190:00h
Feb 1912:00h
Feb 200:00h
Feb 2012:00h
Feb 210:00h
Feb 2112:00h
Feb 2212:00h
Feb 2312:00h
Feb 2412:00h
Feb 220:00h
Feb 230:00h
Feb 240:00h
Feb 250:00h
The integration of wind and solar into the power system creates a need for more flexibility to cope with the volatility in output.42 In a system with more wind and solar, conventional power stations will need to operate far more flexibly with more frequent and intense changes in output (“ramps”) than previously. Figure 2.5 shows the generation mix in Germany over the course of a typical week in 2012 compared to a forecast for 2020. As shown, it is expected that there will be significant growth in renewables generation by 2020. In 2012, conventional power stations were required to ramp up and down by up to 10-15GWs within each day to match demand. By 2020, it is expected that conventional power stations will have to ramp up and down by as much as 40GWs within each day, operating far more flexibly but generating less overall. This has implications for the economics of fossil fuel generation as discussed below.
New Challenges for the Power System

| policyexchange.org.uk26
43 ODI (2016) Rethinking power markets: capacity mechanisms and decarbonisation
44 Ofgem (2015) Electricity security of supply report
45 National Grid (2016) Winter Outlook Report 2016/17
Figure 2.5: Renewables integration and the need for flexibility in Germany43
0
20
40
60
80
Gig
awatt
s (G
W)
A week in May 2012
Conventional Renewables
A week in May 2020
Pumped Storage Coal and GasNuclear Solar Wind Biomass Hydro
Mon Tue Wed Thu Fri Sat Sun Mon Tue Wed Thu Fri Sat Sun
In response to these challenges, National Grid has developed a suite of balancing services which can provide reserve capacity to deal with sudden changes in demand and supply, as follows:
l Short Term Operating Reserve (STOR): This mechanism is for capacity able to deliver power within 4 hours and for at least 2 hours. STOR is procured via competitive tender three times per year. In addition, there is also an Enhanced Optional STOR Service for providers not in the Balancing Mechanism, and a specific STOR auction for demand response providers.
l Fast Reserve: This is for capacity able to deliver power within 2 minutes and for at least 15 minutes. It is procured by National Grid through monthly tenders.
l Demand Management: This mechanism allows demand response to provide reserve capacity. Participants must be able to reduce power demand for at least an hour. This is procured by National Grid via bilateral agreements.
l BM Start-Up: This gives National Grid access to generation in the Balancing Mechanism which would otherwise not have run, with National Grid incentivising power stations to stay on standby to run if required. This service is procured through bilateral agreements between National Grid and generators.
Capacity adequacy Another challenge for system operation is to ensure that there is enough capacity to meet peak demand. The loss of over 20GWs of thermal power stations in recent years has resulted in a much tighter system and a lower “capacity margin” (the margin between peak capacity and available supply). Ofgem analysis suggests that the capacity margin for the winter 2015/16 fell to around 1.0-2.4% (or 5.0-6.4% once the Contingency Balancing Reserve is taken into account).44 More recent analysis by National Grid shows that the capacity margin for 2016/17 is 6.6%.45
Power 2.0: Building a Smarter, Greener, Cheaper Electricity System

policyexchange.org.uk | 27
46 National Grid (2016) Winter Outlook Report 2016/17
47 NAO (2014) Electricity Balancing Services
This analysis is based on an assessment of the likelihood of different forms of generation being available at peak times. It is assumed that thermal power stations such as coal, gas and nuclear will generally be available at peak times, after making an allowance for breakdowns and maintenance (e.g. an assumed availability of 88% for a gas CCGT, and 84% for nuclear). However, intermittent renewables such as solar and wind provide little in the way of firm capacity. Solar will not be generating during the winter peak, whereas wind may be generating depending on weather patterns, but cannot be relied upon. National Grid ascribes a capacity factor of 21% to wind, which means that 1GW of wind capacity provides the same benefit as 210MWs of firm capacity.46
The decarbonisation of the power system, growth of renewables, and loss of thermal capacity, presents a significant challenge to maintaining sufficient capacity on the system. Consequently, Government and the System Operator (National Grid) have taken steps to intervene in the market to ensure there will be sufficient capacity going forward. Government has established a Capacity Market, which procures a pre-determined volume of capacity through a series of annual auctions. National Grid also put in place a transitional mechanism known as the Supplemental Balancing Reserve to procure a limited amount of reserve capacity ahead of the main Capacity Market auction (which will only be operational from 2017/18 onwards). The Government and National Grid have also created two standalone mechanisms for demand response (known as the Transitional Arrangements auction and Demand Side Balancing Reserve) which were intended to develop demand response capability ahead of the main Capacity Market auction (see Chapters 4 and 5 for more discussion of these mechanisms).
Excess capacity and constraintsWhilst a shortage of generation capacity can be a problem, so can an excess of generation. Parts of the power system are rapidly moving towards the point where there could be excess generation during the summer, when demand is generally low, and can be exceeded by the combined output of solar, wind and nuclear generation. Figure 2.6 shows the generation and demand profile for a typical winter and summer’s day in Cornwall. As shown, the output from connected capacity vastly exceeds demand during the day, due to the amount of solar PV capacity. This excess of generation can be exported to other parts of the country provided there is sufficient network capacity available. However, if there is insufficient network capacity, then generators may have to be “constrained off” the grid. In some cases this triggers compensation payments to generators. The total value of these constraint payments has more than tripled from less than £100 million in 2005 to £340 million in 2013-14.47 Rather than constraining generation, an alternative is to allow power users in constrained areas to use more power. National Grid has recently created a mechanism called “Demand turn-up” in which users are incentivised to consume additional power when the market is over-supplied.
New Challenges for the Power System

| policyexchange.org.uk28
48 Turvey, N. (2016) Challenges to the Electricity Network of a Low Carbon Cornwall, Western Power Distribution
Figure 2.6: Typical summer day compared with typical winter day48
In areas with a large amount of distributed capacity or renewables, the shortage of network capacity is making it difficult to connect any new generation. New generators wishing to connect in such areas are usually required to contribute towards the reinforcement of the network, and this often renders such projects uneconomic. As an alternative, some Distribution Network Operators (DNOs) now offer “flexible connection agreements” under which new generators can avoid network reinforcement costs, but are then constrained off the network when it reaches capacity with no compensation. Whilst this may result in a cost saving, it adds significant risk to new generation projects, since there is uncertainty about the extent to which they will be constrained, making it more difficult to finance these projects. This has led to a significant backlog of connection offers in parts of the country, for example in the South West of England where there is already a large amount of solar capacity.
Grid stability The decarbonisation of the power system also adds to the challenge of maintaining grid stability. The electricity network, and everything connected to it such as power plants and appliances, are all designed to work at a specific frequency. In the UK and many other countries, the frequency of the grid is 50 Hertz (Hz). This means that flow of electrical current (measured in Volts) changes direction between a positive and negative value, 50 times a second.
If the frequency falls outside a safe margin, then this can destabilise the grid, and impair or damage appliances and power stations. Maintaining grid frequency is therefore one of the most important roles performed by the System Operator, National Grid. Frequency constantly fluctuates depending on the balance between demand and supply. If demand exceeds supply, then the frequency drops, and conversely if supply exceeds demand, then demand increases. Managing the power grid is a constant balancing act between demand and supply so that frequency remains within a safe range.
600
500
400
300
200
100
0
Pow
er (M
W)
Typical summer day
00:00 04:48 09:36 14:24 19:12 00:00
Time
600
500
400
300
200
100
0
Pow
er (M
W)
00:00 04:48 09:36 14:24 19:12 00:00
TimeConnected Generation Demand
Typical winter peak demand day
Power 2.0: Building a Smarter, Greener, Cheaper Electricity System

policyexchange.org.uk | 29
49 Source: Open Energi
Figure 2.7 provides an example of the interaction between demand, supply and frequency. On the morning of the 19th October 2016, there was a sudden drop in electricity demand of more than 1GW within a period of ten minutes. This caused a sudden increase in frequency. National Grid subsequently intervened to turn down generation from gas power stations by more than 450MWs, and frequency was restored to normal levels.
Figure 2.7: Managing frequency49
Conventional power stations are synchronised with the grid, which means their frequency is identical to grid frequency. They are able to stabilise the grid because of a property known as “inertia”. If there is an imbalance between electricity supply and demand, conventional power stations that have a large rotating mass (such as coal, gas and nuclear) will slow the rate at which system frequency changes. In addition, some conventional power stations will “load follow” and automatically rotate faster or slower, helping to rebalance system frequency. Conventional power stations therefore act as a form of shock absorber within the power system. If a power station suddenly fails, then the system frequency will not drop immediately, but there will be a delay. By contrast, solar panels and wind turbines provide very little inertia or system resilience. Solar panels stop producing electricity as soon the sun stops shining, and start generating immediately once the sun is shining again. This creates issues for the regulation of frequency across the electricity network.
As thermal generation is being replaced by renewables, the amount of inertia in the system is declining, whilst generation output is becoming more volatile. In practice this means that the ability of the system to absorb sudden changes in supply and demand is diminishing. National Grid has a number of mechanisms to secure frequency response capability, and is increasingly looking to use alternative technologies such as storage and demand response to regulate frequency (see Chapter 3):
50.25
Freq
uenc
y, H
z (or
ange
)
Dem
and,
GW
(blu
e)
50.20
50.15
50.10
50.05
50.00
49.95
49.90
49.85
26.6
26.4
26.2
26.0
25.8
25.6
25.4
25.2
25.002:40 02:50 03:00 03:10 03:20 03:30 03:40
100
Chan
ge in
CCG
T, M
W
0
-100
-200
-300
-400
-50002:40 02:50 03:00 03:10 03:20 03:30 03:40
New Challenges for the Power System

| policyexchange.org.uk30
50 The standard Voltage in the UK system was previously 240 V. Voltage has since been standardised across Europe at 230 V ±10%.
l Mandatory Frequency Response: All transmission-connected generators are required to have the capability to automatically change their power output in response to a frequency change.
l Frequency Control by Demand Management (FCDM): This mechanism provides frequency response through the interruption of power to certain customers.
l Firm Frequency Response (FFR): This provides dynamic or non-dynamic response to changes in Frequency. FFR is procured monthly through a competitive tender process, and includes a separate mechanism for demand response providers.
l Enhanced Frequency Response (EFR): This new mechanism is for providers of very fast frequency response – those capable of reacting within 1 second (or less) of a frequency deviation. Batteries storage has been very successful in this market, with 200MW of capacity procured in the first auction in summer 2016.
l Enhanced Frequency Control Capability (EFCC): This is a project under Ofgem’s Network Innovation Competition which is testing the capability of wind farms, solar PV, energy storage and demand response to help control system frequency.
The increasing amount of distributed generation capacity on the system could lead to voltage instability. This is important because in a similar manner as with frequency, the grid and the appliances that are connected to it are designed to operate at a certain voltage.50 Any significant deviation outside of a safe range can damage the grid and appliances, and ultimately lead to power outages. Traditionally, the power system was designed for power to flow from large scale generators on the transmission network to customers within the distribution networks – or from high-voltage zones to low-voltage zones. The growth of distributed generation is changing this pattern and can sometimes results in “reverse power flows” from local distribution networks to the national transmission network (see Figure 1.3). This causes a “voltage rise” in the network where embedded generation is located. Unlike frequency, voltage has to be regulated at local rather than national level.
Institutional challenges The integration of renewables and distributed generation also presents challenge in terms of the roles and responsibilities of institutions which manage the grid. Traditionally, the System Operator, National Grid has been solely responsible for issues such as balancing and grid stability, whilst Distribution Network Operators (DNOs) had a responsibility to distribute power to end consumers. The growth of renewables and distributed generation is blurring the lines between these two roles. In particular, DNOs now have to closely monitor and actively manage their network in order to avoid network constraints and stability issues. DNOs increasingly need to coordinate their activities with the System Operator because the latter has little or no visibility of embedded generation. As discussed in Chapter 4, the regulatory regime needs to be updated to reflect this change in roles and responsibilities of network companies.
Power 2.0: Building a Smarter, Greener, Cheaper Electricity System

policyexchange.org.uk | 31
Economics of generation The transformation of the power system described in Chapter 1 is leading to some significant changes in terms of the economics of power generation, and the operation of the wholesale power market.
Firstly, the substantial growth in renewable power has contributed to a reduction in average wholesale power prices. Unlike conventional fossil fuel power stations, solar and wind farms have high upfront capital costs, and low or negligible running costs. Given that the wholesale market is based on the short run marginal costs of different forms of generation, this means that solar and wind out-compete conventional generation on a moment by moment basis (irrespective of their average cost). The result of this is that the growth of solar and wind generation puts downward pressure on wholesale electricity prices, as illustrated by Figure 2.8. Analysis by Good Energy suggests that in 2014, wind and solar generation caused a reduction in average wholesale power prices of £5.50/MWh (or over 10%) resulting in an overall saving across the power system of £1.7 billion per year.
Figure 2.8: The merit order effect of renewables on wholesale prices
Secondly, the increasing penetration of renewable energy also tends to cause prices to become more volatile and peaky. Analysis by Aurora Energy Research suggests that the spread of wholesale power prices (from the highest to lowest priced periods across the year) is likely to increase significantly between now and 2040 (Figure 2.9). Price spikes are already beginning to occur. For example, on 14 September 2016, the day ahead power price briefly went up to £1,000/MWh (compared to an average wholesale price of around £40/MWh) because of a combination of low renewables output, some planned and unplanned outages at gas, coal, and nuclear power stations, and limited availability of interconnectors. To our knowledge this was the highest wholesale price ever recorded in Great Britain.
Thirdly, the growth in renewables is resulting in more periods of very low or negative prices. Renewable technologies such as wind and solar receive
Renewables Nuclear Gas Coal Oil
Mar
gina
l cos
t, £/
MW
h
Capacity, GW
Demand
Renewables Nuclear Gas Coal Oil
Mar
gina
l cos
t, £/
MW
h
Capacity, GW
Demand
New Challenges for the Power System
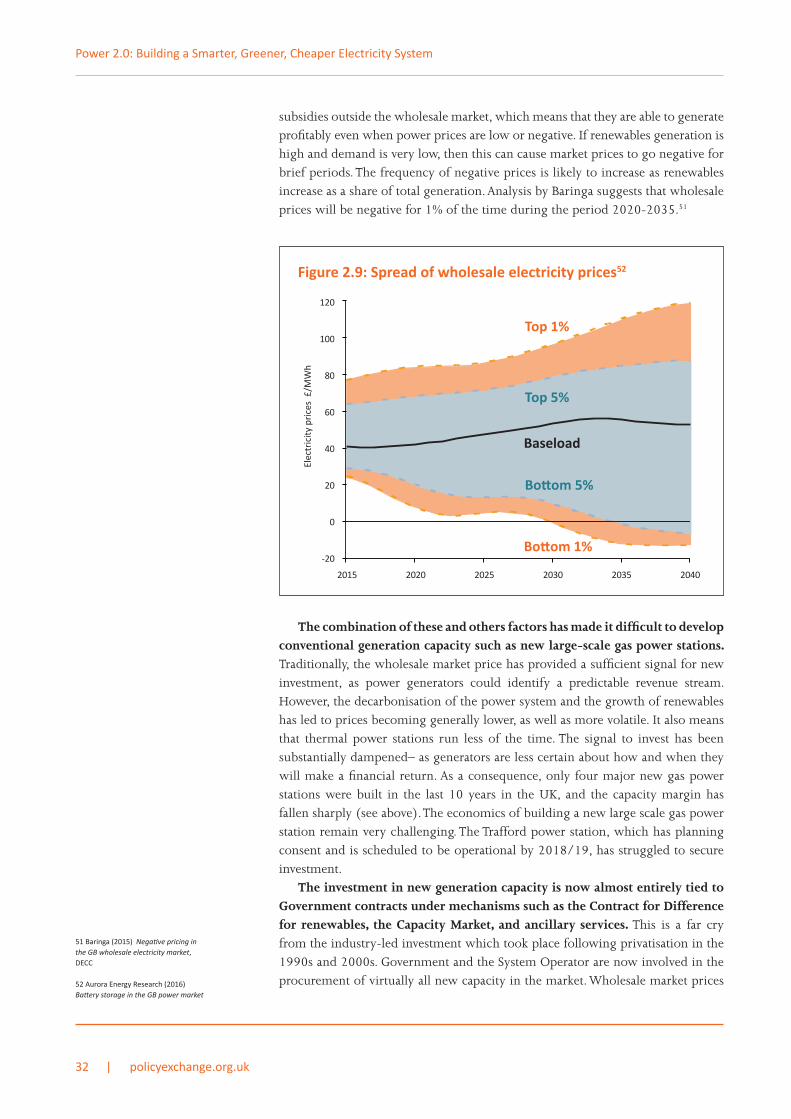
| policyexchange.org.uk32
51 Baringa (2015) Negative pricing in the GB wholesale electricity market, DECC
52 Aurora Energy Research (2016) Battery storage in the GB power market
subsidies outside the wholesale market, which means that they are able to generate profitably even when power prices are low or negative. If renewables generation is high and demand is very low, then this can cause market prices to go negative for brief periods. The frequency of negative prices is likely to increase as renewables increase as a share of total generation. Analysis by Baringa suggests that wholesale prices will be negative for 1% of the time during the period 2020-2035.51
Figure 2.9: Spread of wholesale electricity prices52
The combination of these and others factors has made it difficult to develop conventional generation capacity such as new large-scale gas power stations. Traditionally, the wholesale market price has provided a sufficient signal for new investment, as power generators could identify a predictable revenue stream. However, the decarbonisation of the power system and the growth of renewables has led to prices becoming generally lower, as well as more volatile. It also means that thermal power stations run less of the time. The signal to invest has been substantially dampened– as generators are less certain about how and when they will make a financial return. As a consequence, only four major new gas power stations were built in the last 10 years in the UK, and the capacity margin has fallen sharply (see above). The economics of building a new large scale gas power station remain very challenging. The Trafford power station, which has planning consent and is scheduled to be operational by 2018/19, has struggled to secure investment.
The investment in new generation capacity is now almost entirely tied to Government contracts under mechanisms such as the Contract for Difference for renewables, the Capacity Market, and ancillary services. This is a far cry from the industry-led investment which took place following privatisation in the 1990s and 2000s. Government and the System Operator are now involved in the procurement of virtually all new capacity in the market. Wholesale market prices
Elec
tric
ity p
rice
s £
/MW
h
-20
0
20
40
60
80
100
120
2015 2020 2025 2030 2035 2040
Top 5%
Bottom 5%
Bottom 1%
Top 1%
Baseload
Power 2.0: Building a Smarter, Greener, Cheaper Electricity System

policyexchange.org.uk | 33
53 Gosden, E. (2016) ‘Balancing demand ‘could cost National Grid £2bn’, The Telegraph
54 NAO (2014) Balancing system cost
55 NIC (2016) Smart Power
56 CCC (2015) Power Sector Scenarios for the Fifth Carbon Budget. This figure represents the marginal system integration cost of adding solar and wind capacity in a system with a carbon intensity of 100gCO2/kWh.
57 CCC (2015) Power Sector Scenarios for the Fifth Carbon Budget. This figure represents the system integration cost of solar and wind in a system with a carbon intensity of 50gCO2/kWh.
are in decline, whilst at the same time the value of the Capacity Market, Balancing Market and ancillary services continues to grow. For example, the total cost of balancing services increased from £642 million in 2005-06 to £1.08 billion in 2015-16 (Figure 2.10).53 Aurora Energy Research has calculated that the cost of balancing services is increasing by an average of 11% per year; whilst National Grid expects balancing costs to increase further to reach £2 billion by 2020. Generators now look to “stack” these different revenue streams in order to make their projects viable. For example, flexible generators can make money by selling power into the wholesale and balancing markets, and by providing ancillary services directly to National Grid.
Figure 2.10: Total cost of balancing services54
The increase in the cost of managing the power system is in part due to the growth in renewables capacity. Renewables impose additional costs on the power system (referred to as “system integration costs”) relating to balancing, the management of network constraints, and the cost of securing backup capacity. The National Infrastructure Commission estimates that curtailing excess wind generation is already costing the UK £90 million a year for example.55 Analysis by the Committee on Climate Change suggests that the total system integration cost of wind and solar is £6-9/MWh (for the period to 2030).56 Beyond that, as the system is decarbonised further still it is estimated that the system integration cost could increase to £9-27/MWh.57
Alongside this, the growth of embedded generation is also having a significant impact on the rest of the power system and markets. Generators that connect directly to the distribution network can avoid paying certain grid charges (e.g. Transmission Charges). Moreover, the structure of grid charges is such that they can negotiate arrangements with suppliers to be paid to provide power at peak times. This has created a significant cost advantage for capacity connected to the distribution grid – which is often referred to as an “embedded benefit”. However, this is starting to create distortions, undermining the case for investment
1200
1000
800
600
400
200
0
2005-06
2006-07
2007-08
2008-09
2009-10
2010-11
2011-12
2012-13
2013-14
£ m
illio
n
External costs
Internal costs
New Challenges for the Power System

| policyexchange.org.uk34
58 Energy and Climate Change Committee (2015) Low carbon network infrastructure inquiry, Written evidence submitted by the National Grid (LCN0047)
in large-scale transmission-connected power stations (see Chapter 5 for further discussion). It also affects system balancing, since the System Operator does not have visibility of embedded generation. National Grid has also indicated that the growth of distributed generation has resulted in a need to reinforce the transmission network.58
Chapter summary
l The fundamental change in the generation mix is creating a number of new challenges for the operation and management of the power system:
l Balancing: Managing the power grid is a constant balancing act between demand and supply. As traditional thermal power plants are disappearing from the generation mix and are replaced by intermittent renewables capacity, the power system is becoming less able to react to sudden changes in supply and demand.
l Capacity Adequacy: The power system must have sufficient capacity to meet demand at peak times in order to avoid power shortages. Peak demand typically occurs on cold, winter evenings when solar and wind capacity cannot be relied upon to deliver power. The “capacity margin” has fallen to very low levels, which is already resulting in price spikes when supplies are tight.
l Excess Capacity and Constraints: The growth of renewable and decentralised capacity means that parts of the grid now have an excess of generation capacity, particularly during the summer when demand levels are low. In some cases, generators need to be constrained off the grid, adding to the cost of operating the grid or to generating low carbon electricity.
l Grid Instability: Conventional thermal power stations have a stabilising effect on grid frequency. As the generation mix shifts from conventional power stations to renewables, the System Operator is having to find new ways to stabilise the grid, such as demand response and storage.
l Institutional Challenges: The growth of distributed generation has created new challenges for Distribution Network Operators, forcing them to become more active in the way they run local distribution networks.
l Economics of Generation: The decarbonisation of the power system and growth of renewables has significantly altered the economics of power generation, dampening the wholesale market price, and the signal for new investment. At the same time the value of balancing and ancillary markets is growing year on year. Generators now have to “stack” these revenue streams in order to make projects viable. Virtually no investment in new generation capacity is taking place without some form of Government contract.
Power 2.0: Building a Smarter, Greener, Cheaper Electricity System

policyexchange.org.uk | 35
3Benefits of Flexibility
The previous Chapters describe the transition taking place within the electricity industry, and the challenges that this transition presents in terms of the management and operation of the power system. It is clear that in order to further decarbonise the power system, it will need to become smarter and more flexible. This section sets out the full range of technologies which can provide this flexibility, and the benefits of creating a smarter, more flexible power system.
Flexible technologiesThere are many different technologies which can provide flexibility to the power system. These include thermal power stations, electricity storage, demand response, and other technologies such as power interconnectors and renewables (Figure 3.1). These technologies vary greatly in terms of their environmental impact, cost, efficiency, and stage of development. They also vary in terms of the speed at which they can respond (from within a fraction of a second to several hours) and the duration of time they can provide capacity (from a matter of seconds, to running indefinitely).
Figure 3.1: Summary of flexible power technologies
Thermal generationConventional thermal power stations such as coal, gas and nuclear have traditionally formed the backbone of the power system in Great Britain, as described in Chapter 1. Coal and nuclear are mainly used to provide baseload power, whilst gas can provide flexible and peaking capacity. Balancing services have mainly been
Thermal generation Storage Demand Response Other
l Coall Gas CCGTl Gas OCGTsl Gas/diesel
reciprocating engines
l Combined Heat and Power
l Pumped Hydrol Compressed airl Batteriesl Flywheelsl Supercapacitorsl Thermal storagel Power to gasl Superconducting
Magnetic Energy Storage (SMES)
l Demand shifting / demand turn-down
l Demand turn-upl Behind the meter
generation
l Interconnectorsl Renewablesl Enabling
technologies (e.g. Smart meters)

| policyexchange.org.uk36
59 POST (2011) Carbon Footprint of electricity Generation. The figures relate to total lifecycle emissions, not instantaneous emissions.
provided by peaking power stations such as Open Cycle Gas Turbines (OCGTs) and small gas and diesel engines. They can ramp up and down very quickly, providing a great deal of flexibility to the system. However, power stations powered by coal and diesel emit significant quantities of greenhouse gasses as well as harmful local pollutants such as nitrogen oxides. By way of comparison, diesel engines have a “carbon intensity” of 1,010 grams of CO2 per kWh of electrical output, compared to 786-990 gCO2/kWh for coal power stations, and 356-488 gCO2/kWh for a gas CCGT.59
Storage There is no universal definition of storage but generally it refers to processes and technologies which can capture energy and release it again at a later time. There is a wide range of storage technologies which vary greatly in terms of their storage capacity and their speed and duration of response (Figure 3.2). Appendix 1 provides further data about the main storage technologies.
Figure 3.2: Summary of storage technologies
There is currently around 3.2GW of electricity storage capacity installed in the UK power system. Most of this is pumped hydro storage, in which electricity is stored in the form of potential energy by pumping water into an upper reservoir and generating electricity again later using a hydro-electric turbine. The four main pumped hydro schemes are Ffestiniog (360MW) and Dinorwig (1,728MW) in Wales, and Cruachan (440MW) and Foyers (300MW) in Scotland. Pumped hydro is a very mature technology – all the schemes listed were constructed between 1963 and 1984. Hydro storage can be used for large-scale bulk storage of power, and is also capable of responding within seconds.
Other forms of large-scale storage include compressed air storage, ‘power to gas’ and thermal storage. Compressed air storage uses electricity to compress air which can later be used to drive a turbine and generate power. Power to gas
Power to Gas
Flywheel & Capacitors
Batteries
CAES
Pumped-Storage
1
1 day
1 month
1 year
1GWh 1TWh
<1 minute
Dis
char
ge T
ime
(H)
Scale
1 kWh
10
1000
1 hour
ThermalStorage
Power 2.0: Building a Smarter, Greener, Cheaper Electricity System

Benefits of Flexibility
policyexchange.org.uk | 37
60 BNEF (2016) Lithium-ion battery cost breakdown and forecast
61 Aurora Energy Research (2016) Battery storage in the GB power market
62 Bloomberg New Energy Finance, cited in National Grid (2016) Future Energy Scenarios. Data is provided in tabular form in Appendix 2.
uses electricity to produce hydrogen (through electrolysis of water) or synthetic natural gas (through the combination of hydrogen and carbon dioxide) both of which can be stored and used later to generate electricity. Thermal storage allows electricity to be converted to heat (or cold) which can then either be used to provide heating or cooling, or converted back to electricity at a later date. These technologies have the potential to store large amounts of power for long periods of time if needed.
At the opposite end of the scale, there are a number of technologies which can respond very rapidly (potentially within milliseconds) providing large amounts of power output for a relatively short period of time. This makes these technologies suitable for real-time grid stabilisation, but less useful for longer-term electricity storage. Technologies in this grouping include batteries, flywheels, and super-capacitors. These technologies can be deployed at varying scales, from domestic applications such as home-scale battery systems, to grid-scale storage solutions which can provide frequency control and other balancing services. Lithium-ion batteries are the fastest growing technology in this category, and are rapidly becoming commercially viable as a form of grid-scale storage. The cost of Lithium-ion batteries has fallen significantly in recent years on the back of the development of electric vehicles (Figure 3.3). Bloomberg New Energy Finance predicts that the cost of battery packs will fall by a further 42-60% between 2015 and 2025.60 Some commentators think that battery costs could come down even faster. For example, Aurora Energy Research predict that technology breakthroughs could mean that the cost of batteries falls to £150/kWh by 2018, leading to the mass adoption of batteries by 2030.61 Other battery technologies such as sodium sulphur and flow batteries are also becoming commercially available. Flywheels allow energy to be stored by rotating a large mass, which can then be used to generate large amounts of electricity for a very short period of time. The main example of this technology in the UK is the 400MW flywheel at the JET nuclear fusion research centre in Didcot.
Figure 3.3: Historic and forecast cost of Lithium-Ion batteries62
0
200
400
600
800
1000
1200
2010 2015 2020 2025 2030
US$
/kW
h
Historic Average Forecast Average

| policyexchange.org.uk38
63 Frerk, M. (2015) Presentation, Power Responsive, 18 June
The cost and performance characterisitics of storage technologies (i.e. their speed and duration of response) determines the markets they are able to operate in. Pumped hydro stations are able to generate revenue by selling power into the wholesale market and balancing market, as well as providing ancillary services to the grid (such as frequency response). At present, the main market in which batteries operate is frequency response. As the cost of batteries continues to fall they will become commercially viable in a much wider range of applications, such as helping to shift the profile of demand (see below), and smoothing output from renewables.
Demand ResponseDemand response refers to the act of adjusting power demand to meet available supply. This can be done if energy users reduce their consumption at peak times when supplies are short (“demand turn down”) or increase their consumption at times when there is an excess of supply (“demand turn-up”) to modify their profile of demand (Figure 3.4). Varying demand in this way is seen as a “clean” form of flexibility since it does not directly consume any fossil fuels. It is also a relatively cheap form of flexibility - made possible through the use of simple controls, or automated controls linked to sophisticated software.
Figure 3.4: Types of Demand Response63
Energy users can engage in demand response either through the services of an “aggregator”, or directly if they purchase their own power from the wholesale market. Aggregators are private companies which work with businesses to identify how they can shift their demand, and make this flexibility available to the market.
Dem
and
Time
Dem
and
Time
Dem
and
Time
Dem
and
Time
Dem
and
Time
Time-shift load
Time-critical reduction
‘Smooth’ general load
shape
A net load turn-down
Load turn-up
Power 2.0: Building a Smarter, Greener, Cheaper Electricity System

policyexchange.org.uk | 39
64 The Energyst (2016) Demand Side Response: Turning Inertia into Inertia
65 ADE (2016) Flexibility on Demand: Giving Customers Control to Secure our Electricity System
66 Open Energi (2016) UK Demand Side Flexibility Mapped
This allows businesses to generate additional revenue by shifting their demand to meet the needs of the system. A recent survey found that almost 9 out of 10 businesses would be interested in providing demand response provided that it did not disrupt their core business.64
Businesses are often able to vary their usage of heating, ventilation and air conditioning (HVAC) and cooling devices (fridges/freezers) for short periods without any impact on their business. For example, Sainsbury’s has a deal with OpenEnergi (an aggregator) to equip 200 stores with demand response technology. OpenEnergi has effectively turned the supermarket’s HVAC systems into smart devices which can respond to fluctuations in electricity supply and demand in real-time. Once aggregated across many energy users, this amounts to a significant amount of demand, which can be shifted as required to help to stabilise the grid. Industry evidence suggests that there is significant potential for demand response over short periods of time (seconds or minutes) but the ability to shift demand for longer periods of time (e.g. several hours) is far less common.
Instead of turning down their demand, energy users can also reduce the amount of power they take from the grid by using on-site generation (also referred to as “behind the meter” generation). This can take a number of forms including diesel or gas generators, renewables, or batteries (see above). The use of behind the meter generation at peak times can alleviate system issues, for example if the system is already operating close to capacity. However, diesel generators are a highly polluting form of generation, as discussed in Chapter 4.
A recent report from the Association for Decentralised Energy estimates that there could be a total of 10GW of demand response capacity in total by 2020.65 Of this total, the majority relates to behind the meter generation (5.3GW). The remainder is demand flexibility from major industrial energy users (2.8GW) and commercial and public sector energy users (1.7GW). National Grid has been running the “Power Responsive” campaign to promote demand response as an option for major energy users, and help to identify the barriers to demand response. In addition to this, it is thought that there might be up to 3.2GW of demand flexibility from domestic consumers. However it is generally thought that it will be more difficult and expensive to tap into this flexibility than for large energy users – in part due to behavioural factors which limit the ability or enthusiasm of households to vary their demand.66
Other technologiesMany other technologies can provide flexibility to the power system. There are already four interconnectors which physically link the power system in Great Britain to neighbouring markets in France, Ireland and the Netherlands. These power cables allow power to be traded across borders, and in doing so provide greater flexibility to balance demand and supply. As highlighted in our previous report, Getting Interconnected, a number of new interconnector projects are being planned to link Britain with Norway, Denmark, Iceland, and Belgium, and increase the connection capacity to France.
Renewables can also provide flexibility to a degree. For example, whilst the power output from wind farms is variable, they can provide flexibility by adjusting their output downwards. This could be used to provide frequency regulation, although to date this potential is not being used in the UK.
Benefits of Flexibility

| policyexchange.org.uk40
67 DECC (2015) Towards a Smart Energy System
68 Adapted from DECC (2015) Towards a Smart Energy System
69 NIC (2016) Smart Power
70 Assuming that 33% of the benefit accrues to households, based on their share of total power consumption.
71 Carbon Trust (2016) Can storage help reduce the cost of a future UK electricity system?
Finally, many enabling technologies such as smart meters, smart controls and the “internet of things” will facilitate the transition toward a more flexible system. As discussed above, the use of smart meters and controls underpins the ability of users to engage in demand response. Many companies are also developing “connected home” devices, including smart thermostats and lighting controls. These can be controlled remotely and some are capable of learning from user behaviour to improve efficiency. Lastly, advances are also being made in the way that signals can be communicated to and from these smart devices. Smart devices are generally controlled via standard telecommunications – such as telephone or broadband. However, a company called Reactive Technologies is now trialling a system whereby the electricity grid network itself is used to carry information to devices. This is an important milestone toward the implementation of a smarter power system, because it will allow devices to be reached which are not connected to an internet or phone line.
The benefits of flexibilityA number of studies have quantified the economic and environmental benefits of moving to a smarter, more flexible power system. DECC produced a publication, Towards a Smart Energy System, which identified savings of “tens of billions pounds to the consumer by 2050.”67 The savings can be attributed to a number of different factors as shown in Figure 3.5.
Figure 3.5: Savings realised by adopting a smart power system68
The National Infrastructure Commission produced a follow-up report, Smart Power, which estimated that the savings associated with adopting flexible technologies could amount to £2.9 billion to £8.1 billion per year by 2030.69 This equates to a saving of around £30-£90 per household by 2030 (assuming this benefit flows to end consumers).70 The Carbon Trust also published a report quantifying the benefits of deploying smart technologies such as storage, and estimates this would reduce total system costs by £2.4 billion to £7.0 billion per year in 2030.71
Category of savings
Defer or avoid network reinforcement
Reduce the need for conventional generation
Meet binding targets with lower renewable capacity
Optimise balancing of the system
Benefits of flexibility
Reduce the stress on network infrastructure by smoothing demand, and making renewable generation more predictable.
Reduce the need for backup plant by shifting demand away from peak times, and storing excess low-carbon electricity.
Maximising the use of renewables, for example by storing excess renewable energy when it is not needed.
Providing more efficient and diverse balancing options to National Grid
Potential savings
Up to £12 billion by 2050
£0.5-£5.0 billion per year in 2050. Cumulative benefits are in the magnitude of tens of billions.
Reduce curtailment by up to 100TWh a year by 2050
Total balancing costs are £1 billion per year. This may be reduced with a smart power system
Power 2.0: Building a Smarter, Greener, Cheaper Electricity System

policyexchange.org.uk | 41
72 Imperial College and NERA (2015) Value of Flexibility in a Decarbonised Grid and System Externalities of Low-Carbon Generation Technologies
A recent study by Imperial and NERA for the Committee on Climate Change shows that decarbonising the power sector at least cost needs to go hand in hand with creating a more flexible power system. The study includes a number of scenarios, all of which assume that the carbon intensity of electricity is reduced to 100g CO2 per kWh by 2030 (from the current figure of 371 gCO2/kWh). It estimates that increasing the amount of flexibility could result in a tenfold decrease in the system integration cost of renewables.72 For example, if the power system remains relatively inflexible, then the system integration cost of wind generation could be as high as £14/MWh, but in a scenario with a very flexible power system this reduces the cost to £1.3/MWh. Similarly, in a scenario with limited flexibility, it would be more expensive to incorporate solar in to the system than nuclear, but in a system with large amounts of flexibility it becomes cheaper to integrate solar than nuclear. Overall the report concludes that the saving to consumers of creating a more flexible power system would be between £3.8 billion and £8.1 billion per year. The savings are greater in a scenario in which the power system is decarbonised further.
At the time of writing, Imperial College is about to publish a new study about the system integration costs of a range of generation technologies including renewables and nuclear. The study will conclude that in a system with a high proportion of renewable power generation, increasing the amount of flexibility could result in savings of £5 billion per year. The study also shows that the overall cost of a power system with a larger amount of renewables capacity and flexibility is no higher than a system with a greater amount of nuclear capacity. The study includes a sensitivity analysis which illustrates what could happen beyond 2030 if we move to a power system which is almost completely decarbonised, and has very high levels of renewable power generation. The analysis suggests that increasing the amount of flexibility in the power system is essential in order to deliver such a high level of renewables penetration at least cost.
Chapter summary
l The decarbonisation of the power system and integration of renewable generation needs to go hand in hand with the development of a smarter, more flexible power system.
l Increasing the amount of flexibility could result in system savings worth £2.9 billion to £8.1 billion per year by 2030 (or £30-90 per household per year).
l There are many different technologies which can provide this flexibility, including thermal power stations, electricity storage, demand response, interconnectors and renewables. These options vary greatly in terms of their cost, efficiency, speed and duration of response, stage of development, and potential applications.
Benefits of Flexibility

| policyexchange.org.uk42
4Levelling the Playing Field
The previous Chapter describes how many different technologies can be used to provide flexibility within the power system. However, it appears that some technologies are doing better than others. In general, cleaner forms of flexibility such as storage and demand response are failing to live up to their potential, and losing out to dirtier forms of flexibility such as small-scale diesel and gas engines.
The focus of this research is to identify whether these technologies are treated equally within the current policy and regulatory framework. Consistent with a number of other studies, our research suggests that demand response and storage face barriers to deployment, which are not faced by other forms of flexibility. This is detrimental from a consumer point of view, since it is possible that more cost effective flexible technologies are being held back. It is also detrimental from an environmental perspective, since polluting forms of flexibility such as diesel generators are being used in place of cleaner forms of flexibility.
The remainder of this Chapter identifies the barriers to cleaner forms of flexibility, and how these can be removed. This is not a case of providing subsidy or explicit policy support for particular technologies, but simply “levelling the playing field” between technologies. As part of the research process we have reviewed a substantial body of evidence on the barriers faced by clean flexibility technologies. This included a review of existing literature, and consultations and roundtables with a large number of industry participants and policymakers. The remainder of this section provides a description of what are seen as the most problematic aspects of the current regime, and how these can be addressed.
Regulatory barriersThe most commonly identified barriers to the deployment of clean flexibility technologies such as demand response and storage revolve around regulation – the rules of the energy market. The current regulatory regime was to a large extent devised during the process of privatisation from the 1990s onwards, when the main objectives were the promotion of competition and the liberalisation of the sector. Although the regulatory regime was successful in fulfilling these original objectives, it has struggled to keep up with the pace of transformation of the power system now underway. Ofgem has itself recognised the challenges of keeping regulation up to date with the needs of the power system – for example it issued a consultation on how regulation should adapt to reflect the “non-traditional business models” emerging in the sector. It could be argued that regulation has not kept up with the trends towards low carbon and decentralised energy and the extra flexibility this requires (as highlighted in Chapter 1 and 2). The Electricity

Levelling the Playing Field
policyexchange.org.uk | 43
73 UK Power Networks (2015) Electricity Storage in GB: SNS 4.7 Recommendations for regulatory and legal framework (SDRC 9.5)
Act (1989) and associated grid codes, were devised to suit a system comprised of large centralised power stations, but make no or little mention of new clean flexibility technologies such as demand response and storage. This creates a significant barrier to the development of these technologies since the regulatory framework defines how technologies can operate within the power system and is often the basis on which new policies are designed and implemented. In 2012, Ofgem launched the Electricity Balancing Significant Code Review (EBSCR) which has already resulted in some modifications of industry codes, but the regulatory framework needs to evolve further to reflect new trends and technologies.
Regulation of storageAt present, electricity storage is not defined as a distinct type of regulated activity, unlike in the gas sector where gas storage facilities must obtain a specific type of licence. In the absence of definitive definition, electricity storage is treated in regulatory terms as a type of generation.
This has created an issue referred to as “double-charging”. When electricity is consumed, a number of levies are charged relating to the cost of clean electricity policies such as the Climate Change Levy, Renewables Obligation, Contract for Difference, and the Small Scale Feed-in Tariff. These charges are supposed to be levied on the final consumption of electricity. However, in the case of a battery or other storage device, these levies are charged twice on the same power – once when it flows into a battery, and again when the same electricity re-enters the grid and is consumed by an end user.
Storage devices do not actually ‘consume’ electricity – they simply store electricity and then put it back in the grid at a later point (minus any losses), and in doing so help the system to operate more efficiently. But since the regulatory status of storage is ambiguous, charges are currently being levied on the “gross” amount of electricity used to charge a storage device, not the “net” amount actually consumed. This puts storage devices at a commercial disadvantage compared to other forms of flexibility such as thermal power stations, which do not pay these charges. A report by UK Power Networks and Smartest Energy found that the cost of clean energy policies represents around 80% of all non-energy related costs for operating a storage device.73 This has a significant impact on the commercial viability of storage devices, limiting their deployment.
Storage operators have also identified the fact that they face significant costs for the use of the grid network, in the form of ‘use of system’ charges (see Chapters 2 and 5 for more details). Storage operators are charged for the use of the grid system when they charge the storage device, and again when it is discharged, since grid charges contain both a supply and demand element. Some storage operators have suggested that it is unfair to be charged twice, particularly since they provide flexibility and benefits to the power system, and have suggested that the regulations should be changed to exempt them from grid charges altogether. We disagree with this position and would urge Government not to take this course of action. The fact that storage devices are charged twice for use of the grid reflects the fact that they use the grid twice – both as a supplier and user of power. If storage providers were excluded from paying grid charges then this would remove the incentives for them to minimise their impact on the network. Whilst this is true, we do think there is a case for reform of the structure of grid charges to make them more cost-reflective (a point we return to in Chapter 5).

| policyexchange.org.uk44
74 Clean Energy Wire (2016) Tempus Energy closes its supply division, 24th October 2016.
It is unclear whether a separate licencing regime is required for storage. There are clear benefits to be gained from developing a clear regulatory definition of storage as this could then be applied across all policies and industry codes. The case for a new licencing regime for storage is less clear cut. This could be beneficial from the perspective of providing greater clarity to investors. However, there is a risk that this could stifle innovation. Most storage devices are currently licence exempt, so creating a new regulatory regime would increase the administrative burden. Moreover, creating a new licence criteria for storage could lead to unintended consequences, such as allowing network companies to own storage (see below for further discussion). If Ofgem wishes to create a licencing regime for storage, then this should primarily be focused on large scale storage, with a de minimis exemption for smaller installations.
Recommendations:
l The Electricity Act 1989 and associated grid codes should be updated to define new activities such as storage and demand response.
l Regulatory changes are needed to remove the ‘double-charging’ of environmental levies on storage. This could be achieved by exempting storage from these charges altogether, or calculating them on a ‘net’ basis rather than ‘gross’ basis. Storage operators should continue to pay for their use of the grid network (as both a supplier and user of power).
Regulation of Demand ResponseSimilar to storage, there are barriers to the use of demand response due to regulatory barriers. As described in the previous chapter, there is potential for end-users to vary their demand patterns in order to help balance the system, and to be rewarded in the process. Companies often develop their demand response capability by working with an “aggregator” – a private company which sells their flexibility into the market on their behalf. Aggregators have been successful in utilising demand response for the purpose of providing frequency response (see Chapter 2). However as it stands, the regulatory regime precludes aggregators from participating in other markets such as the wholesale electricity market and Balancing Mechanism – despite the fact that aggregators could play an important role in helping to balance demand and supply.
The wholesale and balancing markets are governed by a set of rules known as the Balancing and Settlement Code (BSC). This requires all market participants to hold a supplier licence. This means that the only way aggregators could participate in these markets would be to acquire a supplier licence (even though they do not supply electricity) or to contract directly with other licensed energy suppliers. Some aggregators such as Tempus Energy and LimeJump acquired a supplier licence (although Tempus Energy has since closed its supply business74). Acquiring a supply licence is an expensive process at a cost of around £1 million, and is likely to be prohibitively expensive for some aggregators. Aggregators could contract directly with suppliers, but the companies we consulted with indicated that it is not commercially feasible for them to do so. Overall, the current regulatory regime is creating unnecessary barriers to the use of demand response in electricity markets.
Power 2.0: Building a Smarter, Greener, Cheaper Electricity System

policyexchange.org.uk | 45
We recommend that the BSC rules are updated to allow aggregators to participate in the wholesale and balancing markets. This would allow aggregators to contract in these markets to vary the consumption of electricity and help to keep the grid in balance. In doing so, this would reduce the need for National Grid to take balancing actions outside the market, and is likely to reduce the overall cost of balancing the system. Demand response could be particularly useful within the balancing mechanism, where it could provide flexibility at short notice. This would allow providers to generate additional revenues, which would improve the economic case for offering demand response.
There has been some resistance to the idea that aggregators should participate in these markets, as it complicates the interaction between end-users, aggregators and energy suppliers. For example, if the system is tight and an aggregator offers to reduce demand from an end user in order to balance the system, the end user’s energy supplier may then be out of balance themselves (i.e. they may have bought more electricity than is now required). This problem can be overcome provided that aggregators are required to notify the relevant energy suppliers that the demand profile has changed, and settle their energy positions.
Recommendation:
l Regulations should be changed to allow aggregators to sell demand response into the wholesale electricity market and balancing market. This could either be achieved by extending access to these markets to unlicensed entities, or by creating a new regulatory status specifically for aggregators. In doing so, it is crucial that the relationship and responsibilities of aggregators and energy suppliers are clearly defined.
Regulation of Distribution Network Operators (DNOs)As described in Chapter 2, Distribution Network Operators are private companies which manage the 14 local power distribution networks across Great Britain. DNOs have a responsibility to manage these networks such that power can flow from generators to end consumers, and to connect new generators to the grid. The regulatory regime requires DNOs to carry out this duty in the least-cost way, since network costs are ultimately passed on to consumers.
Our review of evidence suggests that the regulatory framework for DNOs has become outdated, and is holding back the transition towards a smarter, more flexible power system. As outlined in Chapter 1, the power system has conventionally been arranged with power generated mainly at transmission level, and then transported down through distribution networks to end consumers. However, the growth in renewable and decentralised energy is fundamentally altering this model. As described in Chapter 2, this has created a number of issues at local level such as network constraints, ‘reverse power flows’ from the distribution network to the transmission network, and voltage instability. These challenges mean that going forward DNOs will need to adopt a more active role in managing their networks. This will require a re-think of the foundations on which networks were conceived and built, changing the way the grid is managed from a top-down approach to a more horizontal and flexible one. Overall, DNOs need to undergo a culture change from a passive role to a far more active role in
Levelling the Playing Field

| policyexchange.org.uk46
managing their networks, becoming what has been referred to as ‘Distribution System Operators’ (DSOs). Whilst fine in theory, this is something that DNOs have neither been equipped nor incentivised to do to date, and the regulatory regime is holding them back from innovating.
For example, DNOs are required as part of their licence to comply with a security of supply standard known as Engineering Recommendation P2/6. This defines a set of standards and methodologies for how DNOs should evaluate security of supply, and the options they should consider when making new investments into their network. DNOs have traditionally responded to network constraints by building or upgrading assets such as cables and transformers, which can involve significant time and money. However, new technologies such as demand response and storage could also be used to relieve network constraints, and remove the need to expand the network. At present, Engineering Recommendation P2/6 does not explicitly recognise these “non-build” solutions. For example there is no standardised methodology for how DNOs should assess the network benefits of storage or demand response. This creates ambiguity, making it more difficult for DNOs to justify innovative approaches. Some DNOs have experimented with these technologies under a mechanism called the Low Carbon Networks Fund (LCNF), as in the following examples, but at present these remain small scale experiments, and are not being pursued by DNOs in their normal course of business:
l UK Power Networks is the DNO covering London, the South East and the East of England. As part of its Smarter Energy Storage project, UKPN has been trialling a 6MW/10MWh Lithium-ion storage facility in Leighton Buzzard. This will demonstrate the multi-purpose application of storage to address a range of different system challenges. UKPN also ran a Flexible Plug and Play project in which it trialled new technologies and commercial arrangements to connect distributed generation to constrained areas of the network.
l Electricity North West ran the CLASS project, the purpose of which was to explore whether innovative voltage management techniques could help to reduce demand at peak times and thereby relieve network constraints. The research found that it is possible to reduce voltage by 5% without any adverse impact on consumers. Applied across the power system this approach has the potential to unlock up to 3.3GW of demand response (of which 1GW is domestic demand).
l Scottish and Southern Electricity Networks is the DNO covering central southern England, and the north of Scotland. It has undertaken several innovation projects under the Low Carbon Networks Fund including the Northern Isles New Energy Solutions (NINES) project in Shetland, the Thames Valley Vision in Bracknell, and the Energy Storage Park in Orkney. These projects have trialled the application of new flexibility technologies including storage and Active Network Management (ANM) systems to address the challenges of integrating renewables.
Related to this is the question of whether or not DNOs should be allowed to directly own and operate storage assets such as batteries or pumped storage. Under the Electricity Act 1989 and EU Electricity Directive 2009/72/EC, network operators are prohibited from generating or supplying electricity, under “ownership
Power 2.0: Building a Smarter, Greener, Cheaper Electricity System

policyexchange.org.uk | 47
75 There is a de minimis exemption which allows DNOs to make up to 2.5% of their total revenue from non-distribution business activities, including storage.
76 Source: Ofgem
77 ENA (2016) Transmission and Distribution Interface Steering Group Report
unbundling” requirements. These rules were put in place to prevent discriminatory behaviour by vertically integrated companies owning networks as well as generation and supply businesses. Network and supply businesses can be part of the same group but must be legally separate entities (as in the case of the SSE group in the UK, which owns a generation and supply business, as well as a networks business). As currently defined, the unbundling requirements mean that DNOs are not allowed to own power storage devices, since they are classed as generation.75
Some DNOs have called for this to be changed so that they can own storage as part of their regulated business. However, we would urge Government not to allow DNOs to directly own storage, since this could undermine competition and would be in direct conflict with the ownership unbundling requirements set out above. Network operators are monopoly businesses within their area of operation, and the direct ownership of storage could lead to discriminatory behaviour as well as internal conflicts of interest. By owning storage, DNOs would effectively buy a network management service from themselves, rather than through any form of competitive process, with the cost passed on to consumers.
The alternative would be for DNOs to procure storage as a service, rather than owning it directly. DNOs are incentivised under regulatory arrangements to identify the cheapest technology solutions to address network issues. Where storage is the most economic solution, this could be procured from storage operators through a competitive process, ensuring best value for money for consumers. This is similar to the OFTO system, in which licences for offshore transmission links are competitively tendered, which has led to consumer savings of £0.6-£1.2 billion to date.76 In the longer term there is potential to create more sophisticated markets for flexibility, in which both National Grid and DNOs could procure services such as storage from a single market (see Chapter 5).
DNOs also need to develop more sophisticated ways of connecting new generation capacity to the grid. As described in Chapter 2, the growth in decentralised energy has led to some parts of the network becoming heavily constrained. As a consequence, companies often face very substantial costs to connect to the network, making projects uneconomical. The Energy Networks Association estimates that for every 10 connection applications, there is only one project which accepts an offer to connect to the network.77 Some DNOs have started offering “flexible connection agreements” which offer a lower-cost route to connecting new capacity (see Chapter 2). However, the availability of these types of agreements varies across the country, since there is no obligation on DNOs to offer such agreements.
Interestingly, in some part of the UK there is a backlog of both generation and storage projects wishing to connect to the network. DNOs could think more creatively about how connection agreements for generation and storage could be coordinated to enable additional connections without compromising the network. As noted above, this type of innovative thinking is held back by the current regulations (such as Engineering Recommendation P2/6).
A number of technical obstacles also need to be cleared in order to enable DNOs to take a more active role in managing their network. A major problem for DNOs is that they lack visibility about what is happening on their network in real time. In traditional top-down power systems, DNOs did not need to have much visibility of their network, as there was relatively little embedded generation, and overall demand
Levelling the Playing Field

| policyexchange.org.uk48
78 ENA (2016) Transmission and Distribution Interface Steering Group Report
79 Source: Electricity Network Innovation Competition Screening Submission Pro-forma, Electricity Network Innovation Competition Screening Submission Pro-forma
could be assessed at the interaction between the DNO and transmission system. As a consequence, distribution networks were not fitted with the technologies required to monitor and control activities on their network in real time.
However, as generation becomes more decentralised, and as demand becomes more reactive to market conditions, DNOs will require real-time information on what is taking place within their networks in order to manage system issues. This will require a range of smart technologies such as software and controls, which taken together are referred to as Active Network Management (ANM). ANM technologies will enable DNOs to manage network assets, demand and generation dynamically in real time.
Related to this, if DNOs take a more active role in managing their network, then this will need to be coordinated with other network operators such as the Transmission System Operator (National Grid). It is possible that actions by a DNO to manage their local network will also be beneficial from an overall GB system point of view, but equally there may also be situations where actions at a local level will cause issues further up the network. In order to manage potential conflicts of interest, DNOs and the TSO will need to develop a framework in which they can communicate their mutual requirements and the actions they are taking to manage their networks. The Energy Networks Association has initiated a Transmission Distribution Interface Steering Group to try and resolve these sorts of issues as they arise.78 79 There remains a need for Ofgem to clarify the respective roles and responsibilities of DNOs and TSOs, as DNOs take a more active role in network management.
Finally, changes are needed to ensure that DNOs and the System Operator have the basic information required to manage their networks. DNOs have indicated that they do not always have information on where decentralised generation is located on their network. For example, nearly 900,000 small scale renewable energy installations have been installed across the UK under the Feed in Tariff scheme. In the early days of the scheme, participants did not have no notify the relevant DNO that they were connecting new capacity. The rules subsequently changed, and installers are now required to notify the DNO, although the checks on whether this actually takes place in practice remain weak. This could be rectified by strengthening regulations to ensure that all new capacity is notified to the relevant DNO. Government should also encourage greater sharing between energy suppliers, DNOs and the System Operator on the location of decentralised energy installations.
In Germany there is a requirement for all renewable energy installations to be registered on a central database before they can receive subsidy support. This has created a transparent accessible database on all renewable energy projects (although curiously the requirement to register installations was dropped in 2015). The UK Government should consider the merits of replicating this model in the UK.
Recommendations:
l Distribution Network Operators (DNOs) should be encouraged to investigate innovative solutions to network management such as demand response and storage, where these are cheaper than other options available.
l The network security of supply standard (Engineering Recommendation P2/6) should be updated to include non-build solutions such as demand response and storage.
Power 2.0: Building a Smarter, Greener, Cheaper Electricity System

policyexchange.org.uk | 49
80 BEIS (2016) The Capacity Market (Amendment) Rules 2016
81 Orme, B. (2016) Incapacitated: Why the capacity market for electricity generation is not working, and how to reform it, IPPR
l Regulations should allow DNOs to procure the services of storage, but not to own it directly (unless in a legally-separate entity).
l All DNOs should be required to offer flexible connection agreements to new generators.
l Energy suppliers, DNOs and National Grid should work more closely to identify the location of decentralised energy capacity. The Government should consider the cost and benefits of creating a central, accessible database of all decentralised/renewable capacity on the power system to increase transparency.
l Ofgem should clarify the roles and responsibilities of DNOs and National Grid, to encourage greater collaboration and coordination.
Policy barriersIn addition to regulatory barriers, there are also a number of policy barriers that are hampering the development of clean flexibility technologies such as demand response and storage. In particular, there are a number of examples where the rules concerning the Capacity Market and Ancillary Services appear to put demand response and storage at a commercial disadvantage relative to conventional power stations.
Capacity MarketAs described in Chapter 2, the Capacity Market is a relatively new mechanism which is used by Government to ensure there is sufficient capacity in the power system. Capacity contracts are let through a series of annual auctions. The main auction for each delivery year is held four years ahead, with a smaller supplementary auction held one year ahead. For example the next round of auctions in December 2016 will include a four-year ahead auction for 2020/21, and a one year ahead auction for 2017/18, as well as standalone auction for demand response providers. The successful participants in the auction receive a capacity contract, under which they secure an annual payment for providing firm capacity.
The original intention was for the Capacity Market to be a technology neutral mechanism – procuring the cheapest forms of capacity available. However, certain aspects of its design appear to have created barriers to unconventional technologies such as demand response and storage, putting conventional generators at an advantage. The Government has already made some progress to level the playing field between different technologies. For example, the minimum size threshold for participation in the CM has been reduced from 2MW to 500kW in order to allow participation by smaller players.80 However, more needs to be done to ensure cleaner forms of flexibility can participate fairly in the Capacity Market.
The first issue concerns the rules for pre-qualification, ahead of the Capacity Market auction. Participants must pass a series of metering tests in order to qualify. The design of those tests is perceived by some industry participants as overly stringent, and makes it difficult for demand response aggregators to pre-qualify. Even if they do quality qualify, the design of the tests increases risk at later stages of the process. For example, if an aggregator decides to change the type of capacity they wish to offer (i.e. ‘turn-down’ replaced by behind the meter generation) or to change the end-user company they wish to work with, they would have to go through metering tests again.81 This process is time-consuming and creates an extra layer of complexity which could hamper the ability of demand response
Levelling the Playing Field

| policyexchange.org.uk50
82 Byron Orme (2016) Incapacitated: Why the capacity market for electricity generation is not working, and how to reform it, IPPR
providers to participate in the Capacity Market. It is also not clear why is it is necessary to have such stringent tests, since auction participants already face tough penalties if they fail to meet their obligations under a capacity contract.
Our investigation also revealed that the structure and length of Capacity Market contracts puts demand response at a competitive disadvantage. Under the Capacity Market it is possible to secure a 1 year capacity contract for existing capacity, a 3 year contract for capacity which requires refurbishment, and up to a 15 year contracts for new-build capacity. This system has been designed to provide security for those building new capacity that they will recover their capital investment, but not to over-reward existing capacity. For storage and generation capacity, the overall structure appears reasonable, but the same cannot be said of demand response. Under the current rules, demand response providers only receive a 1 year contract (since they fall below the capital expenditure threshold to qualify for a longer contract). However, the reality is that demand response aggregators do need to convince businesses to participate, and then install the technologies required to modify their demand up and down. This clearly involves less capital investment than say a new build power station (where a 15-year contract is available), but more than an existing power station (where no new investment is required). An option to resolve this could be to allow demand response providers to access the 3 year refurbishment contracts that cover similar activities with lower level of investment (by lowering the capital expenditure threshold).
Lastly, the requirements for how capacity providers must act in the event of a capacity shortage may also create a barrier to the participation of demand response and storage providers in the Capacity Market. Under the rules, if National Grid issues a Capacity Market Warning, then capacity providers must be prepared to provide capacity within the next four hours, and respond for an indefinite period of time. In practice, this creates a significant barrier to the participation of demand response and storage in the CM, since in general they cannot provide capacity indefinitely. For example, users may be able to reduce their demand for a few hours at peak times, but cannot be expected to reduce their demand for a period of days or more. Storage devices only have a finite capacity. By contrast, a gas or diesel power station could commit to running for an indefinite period of time if required (although clearly this is would be harmful from an emissions point of view). If demand response and storage providers take a capacity contract, then they run the risk that they could be penalised if they fail to provide capacity.
It is not clear whether from a system point of view, there is a need for all capacity providers to be able to respond indefinitely, since in general periods of tight supply tend to only last for a few hours at most. But as it stands, the requirement to respond indefinitely creates a significant barrier (or risk) to the participation of demand response and storage in the Capacity Market.
A number of other commentators have suggested much more substantial changes to the Capacity Market to encourage demand response and storage and penalise diesel generators. For example, the Institute for Public Policy Research (IPPR) published a report in which it argues that the Capacity Market should include an emissions performance standard, blocking all diesel generators from receiving support.82 Under this model, the Capacity Market would cease to be a technology-neutral mechanism, and the cost of securing capacity would increase.
Power 2.0: Building a Smarter, Greener, Cheaper Electricity System

policyexchange.org.uk | 51
83 Gosden, E. (2016) ‘Dirty diesel generators in line for UK subsidies’, The Telegraph, 17th October 2016
A better option would be to ensure that all generators are subject to appropriate carbon taxes and environmental regulations outside the Capacity Market, so that it remains a technology-neutral and cost-effective mechanism to procure capacity. As discussed in the next section, diesel generators currently are not subject to carbon taxes and environmental standards are weak.
Green Alliance published a report recently in which it suggests that the Capacity Market should provide different levels of support depending on whether or not a technology is also able to provide flexibility as well as capacity. This would inevitably mean that Government or System Operator would play a great role in determining the generation mix and therefore represents a further departure from the notion of a technology neutral mechanism. The report fails to recognise that there are already many other mechanisms to encourage flexibility (see Chapter 2) and that the purpose of the Capacity Market is to secure capacity, not flexibility.
Recommendations:
l Review Capacity Market rules and requirements to ensure that whilst they suit the needs of the system, they do not unfairly penalise cleaner forms of flexibility such as demand response and storage.
l Allow demand response providers to access a 3-year capacity contract on the same basis as a power station undergoing refurbishment.
Realising that demand response was at a disadvantage in the Capacity Market, the Government introduced a standalone mechanism for demand response known as the Transitional Arrangements auction (TA). This was intended to foster the development of demand response, as a precursor to companies then participating in the main Capacity Market. In our view, it would be preferable to reform the main Capacity Market to enable all technologies to participate, rather than continuing standalone mechanisms for individual technologies. This would create more competitive tension between technologies in the Capacity Market, with the cheapest overall solutions prevailing, saving money for the consumer.
Recommendations:
l Reform the Capacity Market to remove barriers to demand response, and discontinue the separate Transitional Arrangements auction.
Diesel enginesWhereas clean flexibility technologies face a number of barriers as outlined above, it is also clear that the current policy, regulatory and fiscal regime also creates certain advantages to much dirtier forms of flexibility such as small scale diesel engines. As a consequence, there has been a proliferation of ‘diesel farms’ and small-scale gas power stations in recent years. For example, diesel and gas engines account for a quarter of new generation capacity within the Short Term Operating Reserve, and almost half of new capacity awarded a contract in the first Capacity Market auction. Recent analysis suggests that 5.4GWs of small scale diesel and gas capacity has pre-qualified for the next Capacity Market auction in December 2016 – a significant increase on previous auctions.83
Levelling the Playing Field

| policyexchange.org.uk52
84 Timera Energy (2014) Investment in UK peaking assets
85 POST (2011) Carbon Footprint of electricity Generation. The figures relate to total lifecycle emissions, not instantaneous emissions.
86 Defra (2010) Air Pollution: Action in a Changing Climate
87 RCP / RCPCH (2016) Every breath we take: The lifelong impact of air pollution
88 Defra (2010) Air Pollution: Action in a Changing Climate
89 The 20MW minimum is based on fuel input not electricity output, on a net calorific value basis.
The main reason for the recent success of gas and diesel engines is that they are relatively cheap to build, costing two to three times less than a large scale Combined Cycle Gas Turbine (CCGT).84 Diesel engines are commonly used as a form of backup power – for example in many hospitals, universities, industrial premises and office blocks. As the power system is becoming tighter, many companies are looking at how they can run backup diesel generators for commercial reasons, and are also looking to develop new ‘diesel farms’, comprising a number of generating units. It is possible for these to generate revenue in a number of different ways – by selling power into the wholesale and balancing markets, or obtaining a contract to provide capacity or reserve. As we move toward a system with higher renewable penetration and more ‘peaky’ wholesale price patterns (see Chapter 2), diesel and gas engines are likely to run more often. Our consultations with operators of diesel generators as part of this project revealed that they are already running more frequently and for longer periods of time than expected (for example one operator suggested they are running for as much as 50 hours per month, for periods up to several hours in duration).
The downside is that diesel is a particularly polluting form of generation, with a carbon intensity of around 1,010 grams of CO2 per kWh of electrical output, compared to 786-990 gCO2/kWh for coal power stations, and 356-488 gCO2/kWh for as gas CCGT.85 Diesel engines also emit significant quantities of local air pollutants such as particulate matter and nitrogen oxides which are harmful to human health and biodiversity. A recent study by the Royal College of Physicians and the Royal College of Paediatrics and Child Health concluded that exposure to particulate matter and nitrogen oxide pollution is responsible for the equivalent of 40,000 deaths each year in the UK, and imposes a cost to society of between £15 billion and £20 billion per year.86 87 This is greater than the annual health cost associated with obesity (£10 billion).88 As identified in our recent report, Up in the Air, the combustion of gas and diesel in power generation, industry and buildings is responsible for a significant proportion of nitrogen oxide emissions.
Despite this, diesel generators fall outside the remit of many policies concerning emissions of greenhouse gases and other pollutants. For example, diesel generators are largely exempt from the carbon taxes faced by other forms of generation. The EU Emissions Trading Scheme has a minimum size threshold of 20MWs89, and many diesel generators fall under this threshold. Moreover, they are not covered by the Climate Change Levy and Carbon Price Support taxes, which only apply to fuels such as coal, gas, and LPG. Fuel duty is not levied on the so-called ‘red-diesel’ used for power generation. In effect, the most carbon intensive form of generation in the GB power system pays no carbon tax at all. We recommend that the Government revises the Climate Change Levy and Carbon Price Support regimes to place a carbon tax on diesel and oil used for power generation. At current Carbon Price Support rates, this alone would impose a cost of around £18/MWh on diesel generation.
Moreover, diesel generators also fall outside the remit of many regulations aimed at pollution control. The European Large Combustion Plant Directive only applies to power stations over 50MWs, as does the UK Emissions Performance Standard for new power stations. The European Commission has now agreed a Medium Combustion Plant Directive which will apply to much smaller diesel and
Power 2.0: Building a Smarter, Greener, Cheaper Electricity System

policyexchange.org.uk | 53
90 Directive (EU) 2015/2193
91 Source: National Grid, Power Responsive website.
gas generators, but installations will be exempted if they run for fewer than 500 hours per year.90 In any case, following Brexit it is unclear whether the directive will still be transposed into UK law. There are also examples in the UK of Local Authorities introducing specific emissions limits, for example in London, but this is inconsistent and patchy.
In our most recent report on air pollution, Up in the Air: Part 2, we recommended that Government should develop tighter emission standards to limit the development of more polluting forms of generation such as diesel engines. The Government is now acting on this recommendation, and Defra is developing a set of national emission limits for diesel and other small-scale generators. Defra has indicated that it will consult on these regulations in autumn 2016, ahead of the next Capacity Market auction in December 2016. The latest update from Defra indicated that the regulations will “primarily affect diesel engines”, and could potentially apply to both new and existing projects.
In developing these regulations, it is important that an appropriate balance is struck between limiting the damage done in terms of air pollution, whilst not undermining the need to ensure security of supply and flexibility in the power system. Diesel generators are the cheapest form of capacity available at present, so limiting their development altogether is likely to increase the cost of procuring new capacity. On the other hand, large parts of the UK already experience levels of nitrogen dioxide (NO2) which are well above legal and healthy limits, and allowing further development of diesel generators in these areas would only make matters worse.
For this reason, we suggest that Defra should bring forward a two-tier system of emission standards. This would impose tough emission standards in areas at or above legal NO2 concentration limits, and a somewhat less stringent set of standards for other parts of the UK. London has already created a two-tiered system of standards for small combustion plants including diesel, which could be used as a model. If standards are designed correctly this would make it difficult or impossible to build a new diesel generator where NO2 levels are already too high, and encourage developers to locate elsewhere. Equally the regulations would encourage developers to utilise less polluting forms of generation, such as gas engines or diesel engines fitted with pollution reduction technology (such as Selective Catalytic Reduction).
The more difficult question for Defra is what to do about existing diesel generators. Defra has signalled that generators used solely for backup purposes would be exempt from the new regulations. However, the distinction between backup generators and those used for commercial purposes is becoming blurred. National Grid and aggregators have been actively recruiting companies to make backup generators available at peak times and avoid blackouts.91 Whilst this is desirable from a security of supply point of view, it is more questionable from an air quality point of view – particularly since many of these generators are located in urban areas. The emission regulations need to be designed so as to avoid placing undue restrictions on genuine backup generators, but at the same time limit the extent to which these same generators can run purely for commercial reasons. Enforcement could also be an issue, since some have been in place for decades and there is no official data on the location of small generators, or which fuels they use.
Levelling the Playing Field

| policyexchange.org.uk54
Recommendations:
l Diesel generators are the most carbon intensive form of generation and should be subject to carbon taxes. The Carbon Price Support and Climate Change Levy should be extended to liquid fuels used in power generation, such as diesel and oil.
l Defra should create a set of national standards to regulate emissions from small scale diesel and gas generators (under 50MWs). This should be a two-tier system with different standards for more and less polluted areas. The regulations need to distinguish backup generators from those used commercially.
Power 2.0: Building a Smarter, Greener, Cheaper Electricity System

policyexchange.org.uk | 55
5Unlocking Flexibility
The previous Chapter describes how we can start to move towards a smarter, more flexible power system by making policy and regulatory changes today. Specifically, it makes recommendations on how to level the playing field between technologies, by addressing the barriers faced by some technologies and the advantageous position held by others.
However, the scale of the challenges described in Chapter 1 cannot be tackled purely through a piecemeal and incremental approach. It is clear from the analysis throughout this report that the overall architecture of the power system in Great Britain is becoming outdated and reflects the challenges of a previous era. Policies and regulation have not kept pace with the transformation of the power system now underway.
The remainder of this Chapter describes how fundamental reform of the power market can help to deliver the vision of a smarter, more flexible system. The suggested approach avoids prescribing a particular solution or technology mix, but shows how market signals can be created to value and encourage the deployment of flexible power technologies. As described in Chapter 3, this will ultimately deliver a better outcome both from a consumer and environmental perspective.
Reform of the wholesale electricity marketThe power market in Great Britain is structures as a wholesale market, complemented by a number of other markets for balancing, capacity and ancillary services. In recent years there has been a significant shift in value away from the wholesale market towards these other markets, as described in Chapter 2. The value of power traded in the wholesale market is in decline, and the market price no longer provides a signal for new investment. At the same time, the value of capacity and balancing markets continues to increase, and the Government and the System Operator now “procure” almost all new capacity. This represents a seismic shift away from the liberalised electricity market created in the 1990s and 2000s.However, the demise of the electricity market is not inevitable. There are examples in other markets such as Germany and the US, which show how successful reform of power markets can make them more suitable for dealing with new system challenges.
According to Ofgem a “well-functioning market” is one which works for consumers and acts as “a dynamic and sustainable mechanism in which informed participants can confidently and efficiently buy and sell the energy they need at a price that reflects economic cost.” The reality is that the design of the

| policyexchange.org.uk56
92 E.g. in 2008, Utilita raised BSC Standing Issue 35 referring to the ‘Timing of Gate Closure and Related Matters’
93 BSC modification proposal P342
94 Hirth & Ziegenhagen (2015) Balancing power and variable renewables
95 Frontier Economics (2016) Cost benefit Analysis of a Change to the Imbalance Settlement Period: A report for ENTSO-E
wholesale electricity market in Great Britain is based on a somewhat outdated and oversimplified representation of the electricity system. The design of the market preceded the decarbonisation, decentralisation and digitalisation trends which have since taken place. The wholesale market neither reflects what is happening in real time, nor the location of demand and supply across the country. For example, is it appropriate to have a single power market for the whole of Great Britain, given the geographic patterns of demand and supply, and the physical constraints within the system?
In order to adapt to the new dynamics of the power system, the wholesale market needs to be modernised so that it performs as a “well-functioning market.” In particular, by building more temporal and geographic resolution into the wholesale market, the whole system could operate more efficiently, and reduce costs to the consumer.
Firstly, the wholesale market needs to be reformed to build in more temporal resolution. The current design of the wholesale market is such that electricity is traded in half-hourly blocks, and all trading ceases one hour prior to the delivery of power (see Figure 2.2). However, as described in Chapter 2, the demand and supply of electricity varies over very short timescales, and at short notice. The consequence of the current market design is that the wholesale market will only ever do part of the job of balancing the system, and actions will need to be taken outside the market to balance supply and demand.
Allowing trading much closer to the point of delivery would give generators and suppliers the opportunity to adjust and fine-tune their positions and help balance the system. At present, all trading in the wholesale market ceases at “gate closure”, one hour ahead of the delivery of power. Industry participants previously raised the possibility of moving gate closure closer to the point of delivery, as is the case in other European markets.92 EDF Energy recently suggested that energy trading should be allowed to continue beyond gate closure.93 This would allow generators and suppliers who are out of balance after gate closure to trade and reduce their exposure. In doing so this would allow more balancing to take place within the market, reducing the need for the System Operator to take action outside the market. According to EDF Energy, this would allow a more efficient and effective transfer of risk, from willing buyers to willing sellers, at a fair market price while promoting competition in the market.
Trading power in shorter time periods could also encourage more flexibility. For example the power market design in Germany has been adapted over the last few years to include several 15-minute products (as opposed to the 30-minute settlement periods in Great Britain). These now represent about 20% the power traded in the intraday market, and are strongly associated with variations in solar generation. Taken together, these arrangements have reduced the cost of balancing the system by 50%, despite the amount of solar capacity tripling since 2008.94 This could be replicated within the GB market, although any changes would need to be considered very carefully. A cost-benefit analysis by Frontier Economics concluded that the net benefits of moving to 15-minute settlement periods can be positive or negative, depending on how the change is implemented.95 There are ongoing discussions regarding the harmonisation of settlement periods across Europe (eight Member States already use 15-minute settlement periods). Regardless of the outcome of Brexit negotiations, Britain
Power 2.0: Building a Smarter, Greener, Cheaper Electricity System

Unlocking Flexibility
policyexchange.org.uk | 57
96 Ofgem (2015) Wholesale Energy Markets in 2015
97 International Energy Agency (2016) Re-Repowering Markets
will need to decide whether to adopt 15-minute settlement periods in order to facilitate the trading of electricity with neighbouring countries.
Secondly, there is a need to build more geographic resolution into the wholesale market. At present we have a single wholesale market across the whole of Great Britain, which “allows market participants to trade…as if there were no limits on being able to transfer power from one part of the network to another.”96 In reality, the geographic patterns of demand and supply are very different, and there are constraints within the system.
For example, under the current market arrangements, energy retailers may purchase wind generation from Scotland, even if it is not possible for this power to travel to end users due to a network constraint. Network operators may then have to take costly actions to balance the system on both sides, by turning down the excess wind renewable generation, and turning on generation on the other side of the constraint. The power market was designed for a system composed of large thermal power stations and few network constraints, and is not as well suited to a system with more distributed and renewable generation, and network constraints.
A possible solution would be to move to a system of regional markets and pricing. For example in a “nodal pricing” model, the power market is disaggregated into a number of nodes, and the value of electricity at each node can vary. Nodal markets reflect the physical characteristics of the grid, with network capacity and constraints hardwired into the market. In doing so, this means that network constraints are managed by the power market itself, reducing the need for balancing actions outside the market. In nodal markets, the market price will tend to drop when an area is over-supplied, and increase when there is a shortage of power. Moving to this type of system would create a locational price signal, encouraging generators to locate closer to demand and reduce their impact on the grid network. It would also strengthen the economic case for new technologies such as demand response and storage.
Examples of successful nodal markets include New Zealand, Singapore, and several US regional markets. The PJM market, which covers the East Coast of the United States, is comprised of more than 10,000 price nodes grouped into 12 bidding hubs. A software programme called a Market Management System calculates the price at each node every 5 minutes using an algorithm. The software combines the bids from different forms of generation and calculates the least cost way of dispatching power stations whilst maintaining system stability. This results in different electricity prices across the different nodes.97
Evidence from PJM and other markets suggests that there are significant consumer benefits from moving to nodal pricing, as it increases the efficiency of the power system (Figure 5.1). For example it is estimated that the use of a nodal system in PJM results in a saving to consumers of around $2.2 billion per year, far outweighing the cost of implementation ($0.1 billion). The implementation costs of moving to a nodal pricing system are generally recouped within less than one year of operation.

| policyexchange.org.uk58
98 Neuhoff, K. and Boyd, R.(2011) International Experiences ofNodal Pricing Implementation
99 Adapted from Open Energi
Figure 5.1: Annual benefits and one-off costs of moving to nodal pricing98
Procured services
Reserve
DSBR
SBR
BM Start-Up
Fast Reserve
STOR
Demand Management
Demand Turn-Up
Frequency regula�on
Capacity Market
T-1 auc�on
T-4 auc�on
TA auc�on
EDR pilot
Distribu�on Network Operators
Price Signals
Balancing Mechanism
Wholesale Market
Day Ahead Trading
Intraday Trading
Grid charges/levies
BSUoS
DUoS(Red Rate)
TNUoS (Triad periods)
Capacity Market Levy
Site Op�misa�on
Maximum Import Managment
Import/ Export Tariff
Mandatory Frequency Response
FCDM
FFR
EFR
EFCC
0
500
1000
1500
2000
2500
0 50 100
ISO-NE
NYISO
ERCOT
MISO
PJM
PJM
150 200
Cost
/ Be
nefit
(USD
Mill
ion)
Capacity (GW)
Cost/Benefit (USD Million/year)
One-off implementation cost (USD Million)
Balancing and Ancillary ServicesThe examples above show how improvements in the design of the wholesale market could significantly improve its efficiency. However, even with an improved market design, there will still be a need for the System Operator to carry out some balancing outside the market. In order to adapt to the new challenges facing the power system, the Government and the System Operator have developed a range of other markets and tools, including the Capacity Market, and ancillary services such as frequency response and a balancing reserve (see Chapter 2). The number and scope of these services has expanded significantly, and there are now more than 20 mechanisms to encourage flexibility. These are split into procured services, and price-based mechanisms (which encourage power generators to run at peak times, and power users to reduce their demand). This has resulted in a very complex web of mechanisms and incentives, which companies must navigate in order to access revenues streams and bring forward viable projects (Figure 5.2).
Figure 5.2: Markets for flexibility99
Power 2.0: Building a Smarter, Greener, Cheaper Electricity System

policyexchange.org.uk | 59
Our investigation has revealed that the sheer complexity of the current framework has created overlaps and tensions between different mechanisms. For example, National Grid recently announced it was cancelling an auction for Demand Side Balancing Reserve (DSBR) because there was insufficient interest in the scheme. DSBR was designed to procure demand response from major energy users who would turn down their power usage at peak times to avoid system shortages. Our consultations with demand response providers revealed that they were already being incentivised to reduce their demand at peak periods through other mechanisms, which meant they were unable to offer any additional demand response under the DSBR mechanism. DSBR offers a lower financial reward than other mechanisms, undermining its purpose as a mechanism of last resort. This shows that having several mechanisms aimed at achieving the same outcome can be inefficient and confusing for the industry.
The policy complexity is exacerbated by the fact that these mechanisms are all designed slightly differently, with different criteria and technical requirements. There are examples of ancillary services with mutually exclusive contract requirements, preventing participants from operating in multiple markets at the same time and “stacking” revenue streams.
Some services are contracted through bilateral negotiations between National Grid and market participants, whilst others are procured through open tenders or auctions. Procured services are often tendered at different times, through different platforms. In some cases there is very good information available about forthcoming auctions and the outcome of previous auctions, but this level of transparency is not universal and could be improved further.
We recommend that Government, Ofgem and National Grid work to reform the suite of ancillary markets in Britain in order to reduce complexity and remove overlaps, improve transparency and efficiency, and reduce the overall cost to the consumer.
A good example of how ancillary markets can be simplified is in Germany. Here there are four Transmission System Operators, which all procure balancing and ancillary services through a shared market platform (https://www.regelleistung.net/). This includes just three markets for balancing and frequency response, which are procured through open, transparent and competitive auctions on a regular basis. Providers of generation, demand response, and storage are all able to bid into the same markets. The three markets are defined by how quickly participants are able to respond, as follows:
l Primary control is a fast synchronous and spinning reserve which can be activated within 30 seconds and for a period up to 15 minutes.
l Secondary control (SC) is also a spinning reserve, but for participants able to respond within five minutes. Both primary and secondary controls are used for frequency control and for system balancing.
l Tertiary control (TC) must be provided within 15 minutes and for periods of up to an hour.
Primary and secondary control services are procured in weekly tenders while tertiary reserve is procured daily. Participants must pre-qualify in order to access the tenders, but the pre-qualification requirements are the same for all services. The tenders have minimum bids, but pooling is allowed in order to allow smaller companies to participate.
Unlocking Flexibility
| policyexchange.org.uk60
The German example offers some lessons which could be adopted within the UK. Equally, there are other successful regional markets in the US which also offer examples of best practice. We recommend that balancing and ancillary markets in Great Britain are redesigned, based on the following broad principles:
Reduce complexity: the German example shows that it is possible to run a system with far fewer balancing and ancillary markets than we currently have in Britain. The system in GB is extremely complex, creating tensions between mechanisms, and unintended consequences (Figure 5.2). Ultimately this reduces the efficiency of the power system, and adds cost to consumers. Ancillary markets should be rationalised and simplified to reduce the level of complexity.
Follow system needs: The starting point for the design of ancillary services should be to identify the current and future needs of the power system, reflecting emerging system issues (such as excess summer generation) as well as well-established issues (such as ensuring there is enough capacity to meet peak demand). Transmission system requirements are relatively well-expressed, through National Grid’s “System Operability Framework” document, which is published annually. But, the system needs at distribution level are far less clear. The growth of embedded generation has created challenges for the management of the distribution system, but at present these have not been translated into ancillary markets. These “missing markets” mean that providers of flexibility are not rewarded for all of the benefits they provide to the system.
Create liquid markets for particular services: Where possible balancing and ancillary services should take the form of liquid traded markets, with multiple buyers and sellers of the product or service trading on a common trading platform. The reserve markets in Germany and the Balancing Mechanism in Britain are good examples of market based mechanisms. However, many other ancillary services in Great Britain take the form of bilateral deals or tender exercises. These are not “markets” as such, but could in principle be developed into markets going forward. The evolving role of Distribution Network Operators means that they may also need to contract ancillary services to manage their networks. This could be done through a common market platform, as in the case of Germany, rather than DNOs procuring services individually.
Liquidity and competition can be increased further by allowing the trading of contracts for the provision of capacity and flexibility, after they have been agreed. Trading of Capacity Market contracts is now permitted, but trading is specifically restricted for some other ancillary services.
Technology-neutral competition: ancillary markets should be open, competitive, and technology neutral, identifying the cheapest technologies able to meet system needs, rather than designing services with a particular technology in mind.
It will not be possible for all services to operate as a “market” and some services will still need to be secured through competitive procurement. At present there are still some services which are secured through bilateral negotiations, such as contracts for “Black Start”. Black Start is used to recover the power system in the event of a total or partial shutdown. National Grid recently awarded contracts worth £113 million on a bilateral basis to two companies – SSE and Drax. In our view, it would be preferable to secure all ancillary services through open, transparent and competitive processes to guarantee value for money for consumers.
The current framework also includes several schemes which are specifically at particularly technologies. For example the Demand Side Balancing Reserve,
Power 2.0: Building a Smarter, Greener, Cheaper Electricity System

policyexchange.org.uk | 61
100 Energy and Climate Change Committee (2016) The energy revolution and future challenges for UK energy and climate change policy. HC705
101 Ofgem (2015) Supply market indicator – March 2014 to April 2015
Demand Turn-up mechanism and Transitional Arrangements are only for demand response providers. There are also examples where the level of support differs across technologies – for example conventional generators are able to secure longer contracts than demand response within the Capacity Market (see Chapter 4). In our view it would be preferable to create markets and mechanisms in which all forms of flexibility are able to compete on an equal basis, thereby increasing competition and driving down costs.
For the same reasons, the Government and the System Operator should avoid “picking winners” or setting targets for particular technologies. The Energy and Climate Change Committee recently suggested that the Government should “set out a high-level public commitment to making the UK a world-leader in storage and…. a storage procurement target for 2020.”100 National Grid has set an indicative target to use demand response for between 30% and 50% of balancing by 2020. In our view, the Government and System Operator should avoid set targets for particular technologies, and instead focus on levelling the playing field between technologies such that the cheapest technologies prevail. Ultimately this will minimise the cost to the consumer.
Improve Transparency: the System Operator and DNOs could improve transparency about the current and future needs of the system, and the likely requirement for ancillary services. For example, this could include providing more information on the timing and parameters of forthcoming tenders. Our discussions with industry participants revealed that many are unclear about which services are being procured when, and the likely volume of each service required. By contrast, in the German system there are auctions at regular intervals, and all of the information about forthcoming and previous auctions is made available through a single auction platform. National Grid has already made some improvements to the information provided to market participants, but more could be done to improve transparency.
Reform of network chargesIn addition to reform of wholesale and ancillary markets, there is also a need to reform network charging arrangements. Network charges have grown in recent years, and now make up 25% of the average household electricity bill.101 These charges recover the cost of operating and managing transmission and distribution networks, including the cost of balancing the system. The three main network charges are as follows:
l Distribution Use of System (DUoS): DUoS charges cover the cost of running distribution networks, including maintaining, repairing, replacing and reinforcing network assets, making up 17% of the average electricity bill.
l Transmission Network Use of System (TNUoS): TNUoS charges cover the cost of installing and maintaining the transmission system, and are levied by National Grid both on generators and consumers of electricity, making up 6% of the average electricity bill.
l Balancing Services Use of System (BSUoS): BSUoS charges are levied by National Grid and recover the day to day cost of operating the transmission system. They are paid for both by generators and users of power.
Unlocking Flexibility

| policyexchange.org.uk62
102 Ofgem (2015) Supply market indicator – March 2014 to April 2015
103 ADE (2016) A Review of the Embedded Benefits accruing to Distribution Connected Generation in GB
104 Ofgem (2016) Open letter: Charging arrangements for embedded generation
Figure 5.4: Breakdown of average household electricity bill102
Wholesale costs(33%)
Transmission costs(7%)
Distribu�on costs(17%)
Balancing costs(2%)
Environmental andsocial obliga�on
costs (13%)
Supplier opera�ngcosts (13%)
VAT(5%)
Pre-tax margin(10%)
As well as making up a significant proportion of energy bills, the design of these charges has a very significant bearing on the behaviour of generators and users of power.
Ideally, use of system charges should be designed to be “cost reflective”. This means that charges should be structured to reflect the cost of any given activity on the power system, such that generators and users of power are exposed to the consequences of their actions. For example, grid charges can be structured such that the cost of securing peak capacity falls on those who use power at peak times, encouraging them to shift their demand to other times of day.
However, there is a broad consensus that current network charging arrangements are not cost-reflective, and need to be reformed. For example, an issue which has attracted significant attention recently is “embedded benefits”. This refers to the fact that generators connected to the distribution network do not have to pay charges relating to the cost of the transmission network. Moreover, embedded generators can also secure additional revenues by selling their output to energy suppliers at peak times, allowing those suppliers to significantly reduce the network charges they face (so-called “Triad charges”). In effect this means there is a double benefit for generators connecting to the distribution network rather than the transmission network. It is thought that distribution-connected generators now derive between 20% and 50% of their revenue from these embedded benefits.
There are concerns that this is now distorting the market – creating a strong incentive to build smaller power stations embedded in the distribution network, rather than large-scale power stations connected to the transmission network.103 Indeed, the growth of small scale diesel and gas engines highlighted in Chapter 4 is partly attributable to the structure of these charges and the scale of embedded benefits. The upshot of this is that unless the charging arrangements are changed, there will be fewer and fewer power stations contributing to the upkeep of the transmission network. The scale of embedded benefits has been consistently rising in recent years, and going forward is expected to increase further still.104
Power 2.0: Building a Smarter, Greener, Cheaper Electricity System

policyexchange.org.uk | 63
105 Ibid
106 Ofgem (2016) Open letter: Charging arrangements for embedded generation
107 ADE (2016) Security of supply policy: Risks to energy intensive industries and local generation?
108 KPMG (2016) The effects of changes to Embedded Benefits on the Energy Trilemma
Ofgem has been undertaking a review of transmission network charging arrangements to address these concerns, and recently published a call for evidence on this issue.105 Ofgem has indicated that it had ruled out doing a full review of network charging because it would take too long, and that it is in favour of making incremental change via modifications of industry codes.106
Whilst Ofgem has correctly identified this as a significant issue, their intended direction of travel is somewhat concerning. Although there is an immediate issue surrounding embedded benefits in relation to Triad charges and transmission charges, this is part of a much broader issue concerning the design of network charges in general. Making changes to Triad charges in isolation could have far-reaching consequences for both new and existing generators.
For example, a report by the Association of Decentralised Energy concluded that reducing or removing embedded benefits would lead to additional costs for end consumers through higher electricity prices and Capacity Market payments. The report warns that the removal of embedded benefits could increase energy costs for manufacturers by £170 million per year.107 A reduction or removal of embedded benefits would also affect the economic viability of existing distribution-connected capacity, and could therefore threaten security of supply. A report by KPMG suggests that the 2GW of distributed capacity secured through previous Capacity Market auctions could be at risk if embedded benefits are removed.108 This would penalise diesel and gas engines but also technologies such as storage and renewables which are connected to the distribution network. In short, this is a very complex issue and any changes to the network charging regime need to be considered very carefully.
Ofgem’s favoured approach, to amend transmission charging arrangements through the modification of industry codes, appears not to reflect this level of complexity. The code modification process started with two very specific rule change proposals concerning how to correct distortions within the Capacity Market through modifications to Triad charges. This has since given rise to over 50 alternative proposals by other industry participants - each of which reflects the commercial position and vested interests of individual generators. The proposed rule changes generally relate to transmission charging arrangements rather than considering network charges in the round. The proposals are now being considered by a code review panel, which mainly consists of representatives from large-scale generators and National Grid (i.e. no smaller scale generators). It is far from clear how this process will deliver the best outcome for consumers, not least because it is only considering one small part of a much wider issue concerning network charging arrangements.
Instead, we recommend that Ofgem conducts an independent review of all network charging arrangements. This should be based on the following broad principles:
l Holistic review: Instead of looking of focusing on Triad payments in isolation, Ofgem should conduct a holistic review of network charges across distribution and transmission. The ADE report, for example, concluded that the value of embedded benefits as a whole is broadly cost-reflective, but that individual elements may be under or over-valued. This indicates that a reduction or removal of embedded benefits in isolation could create distortions and make network charging even less cost-reflective.
Unlocking Flexibility

| policyexchange.org.uk64
109 Cornwall Energy (2016) Embedded Benefits: Addressing Market Distortions
l Cost-reflectivity: The review should aim to develop network charging arrangements that are cost-reflective, to incentivise generators and users of power to minimise their impact on the grid. Network charges should include a temporal element, for example creating higher charges at peak times to incentivise users to shift their demand. They should also include a locational element to reflect the full costs of transporting power to and from different locations. In particular, the split between the residual and locational elements of transmission charges should be reviewed because there are concerns that locational price signals are currently too weak.
Notwithstanding this, it is clear that there is an immediate issue concerning embedded benefits and this is already distorting the power market as well as the Capacity Market auction. Alongside the long-term review of network charges suggested above, we suggest that Ofgem should also take action in the short term. For example, Cornwall Energy has proposed that a cap on Triad payments should be introduced whilst Ofgem conducts a fundamental review of network charging arrangements.109
Power 2.0: Building a Smarter, Greener, Cheaper Electricity System

Appendix 1
policyexchange.org.uk | 65
Batteries Thermal Storage
App
endi
x 1:
Ove
rvie
w o
f Sto
rage
Tec
hnol
ogie
s
Tech
nolo
gyA
ppro
xim
ate
Rate
d Ca
paci
tySp
eed
Of
Resp
onse
Dur
ation
Of
Resp
onse
Dur
ation
Of
Stor
age
Life
span
(Yea
rs)
Pow
er S
yste
m
Cost
($/k
W)
Ener
gy C
ost (
$/M
Wh)
Effici
ency
Tech
nolo
gy
Read
ines
s
Pum
ped
Hyd
ro50
kW-3
GW
Seco
nds
Hou
rsH
ours
-Day
s30
-60+
$1,1
44-$
2,70
0 $1
70-$
338
60%
-85%
Com
mer
cial
Com
pres
sed
Air
Sto
rage
80
KW-3
50M
WSe
cond
s-M
inut
esH
ours
Day
s-M
onth
s10
-30+
$960
-$2,
150
$120
-$21
065
-75%
Earl
y Co
mm
erci
al
Lith
ium
-Ion
Batt
erie
s1k
W-4
0MW
Mill
isec
onds
Hou
rsH
ours
-Day
s5-
10+
$750
-$4,
100
$320
-$2,
200
80%
Com
mer
cial
Adv
ance
d Le
ad A
cid
Batt
erie
s1k
W-4
0MW
Mill
isec
onds
Hou
rsH
ours
-Day
s4-
5$1
,085
-$4,
100
$220
-$3,
800
85-9
0%Ea
rly
Com
mer
cial
Sodi
um S
ulph
ur (N
aS)
Batt
erie
s1M
W-5
0MW
Mill
isec
onds
Hou
rsH
ours
-Day
s10
+$3
50-$
3,00
0$2
60-$
1129
74-8
6%D
emon
stra
tion
Flow
Batt
erie
s5k
W-1
5MW
Mill
isec
onds
Hou
rsH
ours
-Day
s20
$950
-$3,
700
$248
-$1,
657
75%
Dem
onst
ratio
n
Flyw
heel
s5K
W-2
00M
WH
undr
edth
s of
a
seco
ndSe
cond
s-m
inut
esH
ours
10+
$1,0
00-$
2,20
0$2
76-$
989
87.5
%Co
mm
erci
al
Supe
rcap
acito
rs1k
w-1
MW
Mill
isec
onds
Seco
nds
Day
s20
-30
$50-
$2,0
00
$300
-$20
,000
85
-95%
Dem
onst
ratio
n
Supe
rcon
ducti
ng M
agne
tic E
nerg
y St
orag
e (S
MES
)1-
10M
WM
illis
econ
dsM
illis
econ
ds-
Seco
nds
Hou
rs20
-30
$200
-$35
0$1
,000
-$10
,000
90-9
7%Ea
rly
Com
mer
cial
Pow
er to
Gas
- H
ydro
gen
Stor
age
and
Fuel
Cel
l0-
50M
WSe
cond
sSe
cond
s-ho
urs
Day
s-M
onth
s30
?$1
,500
-$10
,000
+$6
-$72
520
-85%
Earl
y Co
mm
erci
al
Hea
t Sto
rage
(Ice
, Bo
reho
les
etc.
)1-
200k
WM
inut
esH
ours
Hou
rs20
-30
$500
-$4,
000
$80-
$110
85%
Earl
y Co
mm
erci
al
Mol
ten
Salts
/ H
eate
d G
rave
l20
0kW
-10+
MW
Min
utes
Hou
rsD
ays
10-3
0+$5
00-$
4,00
0$1
20-3
0075
%Ea
rly
Com
mer
cial
Liqu
id A
ir10
kW-1
00M
W10
-20
Min
utes
Hou
rsD
ays-
Mon
ths
10-3
0+$9
00-$
2,00
0$2
60-$
530
70%
Dem
onst
ratio
n
Ther
moc
hem
ical
Ene
rgy
Stor
age
0-10
0+M
W-
Hou
rsD
ays-
Mon
ths
10-3
0+$1
,000
-$3,
000
$25-
75-
Dem
onst
ratio
n
Sour
ces:
Car
bon
Trus
t & Im
peri
al C
olle
ge L
ondo
n (2
015)
, Can
sto
rage
hel
p re
duce
the
cost
of a
futu
re U
K el
ectr
icity
sys
tem
?; U
S D
OE
(201
6) ‘G
loba
l Ene
rgy
Stor
age
Dat
abas
e’; R
enew
able
Ene
rgy
Ass
ocia
tion
(201
5) E
nerg
y St
orag
e in
the
UK:
An
Ove
rvie
w;
US
Dep
artm
ent o
f Ene
rgy/
EPRI
(201
3) E
lect
ricity
Sto
rage
Han
dboo
k in
Col
labo
ratio
n w
ith N
RECA
; Laz
ard
(201
5) L
azar
d’s
Leve
lized
Cos
t of S
tora
ge A
naly
sis
– Ve
rsio
n 1.
0

| policyexchange.org.uk66
110 BEIS (2016) Digest of UK Energy Statistics
Appendix 2: Data Tables
Table 1.1: Electricity generation from renewables, 2000-2015 (TWh)110
Year Onshore wind
Offshore wind
Solar photovoltaics
Hydro Bioenergy Total
2000 0.9 0.0 0.0 5.1 3.9 9.9
2001 1.0 0.0 0.0 4.1 4.5 9.5
2002 1.3 0.0 0.0 4.8 5.1 11.1
2003 1.3 0.0 0.0 3.1 6.2 10.6
2004 1.7 0.2 0.0 4.8 7.4 14.1
2005 2.5 0.4 0.0 4.9 9.1 16.9
2006 3.6 0.7 0.0 4.6 9.3 18.1
2007 4.5 0.8 0.0 5.1 9.3 19.7
2008 5.8 1.3 0.0 5.1 9.5 21.8
2009 7.5 1.8 0.0 5.2 10.7 25.2
2010 7.2 3.1 0.0 3.6 11.9 25.8
2011 10.5 5.1 0.2 5.7 13.0 34.5
2012 12.2 7.6 1.4 5.3 14.6 41.1
2013 16.9 11.5 2.0 4.7 18.2 53.3
2014 18.6 13.4 4.0 5.9 22.7 64.6
2015 22.9 17.4 7.6 6.3 29.4 83.5
Power 2.0: Building a Smarter, Greener, Cheaper Electricity System

policyexchange.org.uk | 67
111 BEIS (2016) Historical electricity data: 1920 to 2015
112 National Grid (2016) Future Energy Scenarios
113 Bloomberg New Energy Finance, cited in National Grid (2016) Future Energy Scenarios
Table 1.2: Electricity supplied by technology, 1970-2015 (TWh)111
Year Coal, oil & biomass
Gas CCGT Nuclear Renewables (wind, solar,
hydro)
Total
1970 203 - 23 5 231
1975 222 - 26 4 253
1980 229 - 32 4 265
1985 217 - 54 4 275
1990 234 0 59 5 298
1995 183 49 81 5 318
2000 147 126 78 6 358
2005 155 139 75 8 378
2010 123 169 56 14 363
2011 124 140 63 22 348
2012 158 94 64 26 343
2013 149 89 64 35 338
2014 125 94 58 42 319
2015 109 93 64 54 320
Table 1.4: National Grid scenarios for annual electricity demand (TWh)112
Historic Projections
Year 2005 2010 2015 2020 2025 2030 2035 2040
Historic 377 346 334
Gone Green 322 327 346 366 384
Slow Progression 324 319 318 323 329
No Progression 330 325 322 325 331
Consumer Power 326 324 331 342 352
Appendix 2
Year 2010 2011 2012 2013 2014 2015 2020 2025 2030
Historic average
1,000 800 642 599 540 400
Forecast average
277 229 210
Table 3.3: Historic and forecast cost of Lithium-Ion batteries (US$/KWh)113

The power system in Great Britain is undergoing a radical transformation –
towards a decarbonised, decentralised, and digitalised system. These trends are
profoundly changing the structure of the electricity market, and creating new
challenges for the management and operation of the power system.
This report argues that in order to further decarbonise the power system, and
integrate renewables, we will need to create a power system which is smarter
and more flexible. Many technologies can provide this flexibility, including thermal
power stations, storage, demand response, and interconnectors. However,
the current policy and regulatory framework appears to favour some of these
technologies over others. The regulatory framework has struggled to keep up with
the pace of change within the power system, and needs to be modernised.
This report identifies how to remove the regulatory and policy barriers facing
technologies such as demand response and storage, and create a level playing
field. It also identifies the need for longer term reform of the wholesale power
market to ensure that it values and encourages flexibility, drawing on examples
from other power markets such as Germany and the US. Taken together, these
proposals could create a power system which is smarter, greener, cheaper, and fit
for the 21st Century.
£10.00ISBN: 978-1-910812-20-4
Policy Exchange8 - 10 Great George StreetWestminsterLondon SW1P 3AE
www.policyexchange.org.uk
Policy ExchangePow
er 2.0: Building a smarter, greener, cheaper electricity system
Power 2.0Building a smarter, greener, cheaper electricity system
Richard Howard and Zoe Bengherbi


![Cheaper Medicines Act [Revised]](https://img.pdfslide.net/doc/110x75/577d267e1a28ab4e1ea15ff4/cheaper-medicines-act-revised.jpg)