Embed Size (px)
Citation preview

7/15/2014
1
What is Energy?
• ENERGY: The ability to do work
– Work: exerting a force on another system over some distance
– Can be transferred/transformed but never created nor destroyed
– Standard (SI) measurement: joule
How is Energy Measured on
Your Utility Bill • Electricity bill measurement:
KILOWATT-HOUR (kWh) • 1 kWh = 3.6 million joules
(megajoules)
• 3412 BTUs in one kWh – 1 BTU (British Thermal Unit) is
the heat from one match
• Gas bill measurement: THERMS or cubic foot – 100,000 BTUs in one Therm
Many forms of energy
– Radiant (e.g. sunlight)
– Chemical (stored in chemical bonds – e.g.
plants, fossil fuels)
– Nuclear (stored in bonds of nucleus – e.g.
nuclear power)
– Thermal (heat)
– Mechanical (e.g. machines)
– Electrical (electrons moving along
conductor)
Energy Transformations
Radiant Energy Chemical Energy
Energy Transformations
Electrical energy Thermal Energy
Energy Sources
• PRIMARY ENERGY SOURCE: Energy in the form that it is first accounted for before transformation to other forms of energy
– What we typically say when we talk about “energy”
• Fossil fuels (coal, natural gas, petroleum)
• Uranium
• Renewable sources (biomass, wind, solar, hydroelectric, geothermal, etc.)

7/15/2014
2
Power
• POWER: Rate (measured in energy and
time) of energy transfer
– Standard (SI) measurement:
Watt (W) = 1 joule per second
– Power = Energy/Time
• Energy = Power x Time
Energy vs. Power
Graphic Source: The WATT? An Energy 101 Primer from Focus the Nation, 2012
Energy vs. Power – Electricity
Consumption • Toaster consumes a constant rate of
~1000 watts, or 1 kilowatt (1 kW) of electrical power when running
– If I leave toaster running for 1 hour, I’ve consumed 1 kilowatt-hour (kWh) of electric energy
• 1 kilowatt x 1 hour = 1 kilowatt-hour (kWh)
• Same amount of energy as using ten 100-watt light bulbs for 1 hour
• Same amount of energy as using one 100-watt light bulb for 10 hours
Orders of Magnitude
Order of
Magnitude
Energy Power
1 Watt-hours (Wh) Watts (W)
1 thousand Kilowatt-hours (kWh) Kilowatts (kW)
1 million Megawatt-hours (MWh) Megawatts (MW)
1 billion Gigawatt-hours (GWh) Gigawatt (GW)
1 trillion Terawatt-hours (TWh) Terawatt (TW)

7/15/2014
3
Energy vs. Power – Electricity
Generation • CAPACITY: (nameplate capacity,
installed capacity) The maximum (full-
load) output of power that a power plant
can deliver under ideal conditions
– Actual power delivered can be different
• Depends on weather conditions,
economics/market dynamics, demand,
maintenance/repair, flexibility of power plant
(able to ramp up and down power output)
Capacity Examples
Power Plant Capacity Toasters Households
Point Beach
Nuclear Plant –
2 reactors
~1 gigawatt (GW)
(1 billion watts)
1 million
toasters
800,000 households
West-Campus
Cogeneration –
2 gas turbines
~150 megawatts (MW)
(150 million watts)
150,000
toasters
120,000 households
Epic’s Galactic
Wind Farm –
6 turbines
~10 megawatts (MW)
(10 million watts)
10,000
toasters
8,000 households
Solar Array on
Wisconsin
Energy Institute
Roof
~20 kilowatts (kW)
(20 thousand watts)
20 toasters 16 households
iClicker Question
• Which of these power plants is most
likely to run near their capacity (max
output) most of the time (~90%)
– A) Natural gas
– B) Wind turbine
– C) Nuclear
– D) Solar PV
Energy vs. Power
• GENERATION: amount of electric energy
a power plant produces over a period of
time
• CAPACITY FACTOR: the ratio of the actual
output of a power plant over a period of
time and its potential output if it had
operated at full capacity the entire time
– The closer to 100%, the closer it is to running
at full power all the time
Why Capacity Factor Matters
• Power plants with low fuel costs (traditionally coal & nuclear) are more efficient to run all the time and generate a lot of electric energy (high capacity factor, above 70%)
• Power plants with higher fuel costs or more flexibility (traditionally gas) run less often (lower capacity factor)
• Wind and solar power vary based on weather/sunlight conditions (lower capacity factor)
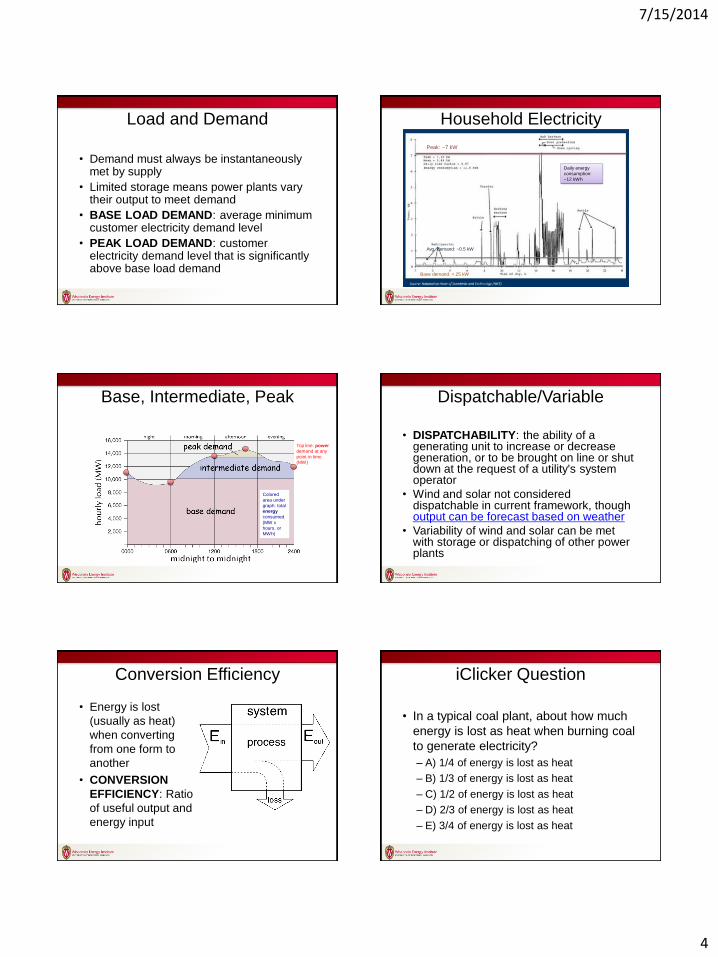
Load and Demand
• LOAD: device or customer that receives
power from the electric system.
• DEMAND: the measure of power that a
load receives or requires
• Often used interchangeably
7/15/2014
4
Load and Demand
• Demand must always be instantaneously met by supply
• Limited storage means power plants vary their output to meet demand
• BASE LOAD DEMAND: average minimum customer electricity demand level
• PEAK LOAD DEMAND: customer electricity demand level that is significantly above base load demand
Household Electricity
Peak: ~7 kW
Base demand: <.25 kW
Avg. demand: ~0.5 kW
Daily energy
consumption:
~12 kWh
Base, Intermediate, Peak
Top line: power
demand at any
point in time
(MW)
Colored
area under
graph: total
energy
consumed
(MW x
hours, or
MWh)
Dispatchable/Variable
• DISPATCHABILITY: the ability of a generating unit to increase or decrease generation, or to be brought on line or shut down at the request of a utility's system operator
• Wind and solar not considered dispatchable in current framework, though output can be forecast based on weather
• Variability of wind and solar can be met with storage or dispatching of other power plants
Conversion Efficiency
• Energy is lost
(usually as heat)
when converting
from one form to
another
• CONVERSION
EFFICIENCY: Ratio
of useful output and
energy input
iClicker Question
• In a typical coal plant, about how much
energy is lost as heat when burning coal
to generate electricity?
– A) 1/4 of energy is lost as heat
– B) 1/3 of energy is lost as heat
– C) 1/2 of energy is lost as heat
– D) 2/3 of energy is lost as heat
– E) 3/4 of energy is lost as heat

7/15/2014
5
Conversion Efficiency Generator Conversion Steps Typical
Efficiency
Coal Power Plant Chemical>Thermal>
Mechanical>Electrical
35%
Natural Gas Combined
Cycle Power Plant
Chemical>Thermal>
Mechanical>Electrical
60%
Solar Photovoltaic Cell Radiant>Electrical 20%
Consumer Conversion Steps Typical
Efficiency
Incandescent Bulb Electrical>Radiant 5%
Electric Motor Electrical>Mechanical 80-90%
Electric Power Generation,
Transmission, and Distribution • GENERATION—process of creating
electrical energy from other forms of energy
• TRANSMISSION—the bulk transfer of high‐voltage electrical energy from its source at generating plants to substations
• DISTRIBUTION—the transfer of high voltage electrical energy from substations to the end customer
Current Electricity
Graphic Source: The WATT? An Energy 101 Primer from Focus the Nation, 2012
CURRENT: Flow of electrons along a pathway
(conductor, e.g. copper wire)
Electrical Current Discoveries
• 1800 Alessandro Volta of Pavia develops the first “voltaic battery.”
• 1807 Sir Humphrey Davy improved and expanded on Volta’s design, and developed the first arc light to run off of his battery.
Electrons flow from negative electrode
(anode) to positive electrode (cathode)

7/15/2014
6
Electromagnetism
• Q: How does shake flashlight create electricity without a battery?
• A: Induction: moving a magnet through a conductor (coiled copper wire) induces a current (causes electrons to flow) – Also works the other way around
• Discovered by Michael Faraday in 1831 – Basis of most electrical
generators and electric motors
Shake Flashlight
Source: Energy Flows, The NEED Project
Generator
GENERATOR: Converts one form of energy
(e.g. mechanical) to electrical energy
• Q: What turns the generator?
• A: TURBINE: a machine for generating rotary mechanical power from a fluid flow (air, steam, water)
– Steam turbine (Coal, nuclear)
– Gas turbine (Natural gas)
– Wind turbine
– Hydroelectric turbine (waterwheel)
– COMBINED CYCLE: Steam and gas turbine (natural gas)

7/15/2014
7
Current and Voltage
• CURRENT: The number of electrons
pushed through the circuit is the current
– measured in amperes (amps)
• VOLTAGE: The “pressure” that pushes
these electrons through the circuit is the
voltage – measured in volts
• Power = Current x Voltage
– (1 watt = 1 amp x 1 volt)
AC vs. DC
• AC=alternating current
• DC=direct current
• In DC, the current always flows in one direction
• In AC, the current flows back and forth
• It reverses direction 120 times per second, or 60 full cycles per second (60 Hz)
iClicker Question
• Which of these won the “war of currents”
to become the dominant means of
delivering electricity?
– A) Alternating Current
– B) Direct Current
Why AC?
• It is easy to change the voltage of AC, and we lose less power if we transmit electricity at high voltage
• So we: – Generate electricity at low
voltage
– Step it up for transmission (> 120,000 Volts)
– Step it down for distribution (1,000 Volts)
– Step it down before it gets to our home (120 V)
Transformers (like pictured)
“step up” or “step down”
voltage using induction
Transmission and Distribution AC Issues
• All generators are synchronized at 60 Hz
– When wide area blackouts occur, systems
must go through BLACK START: the
process of restoring a power plant to
operation without synchronizing from the
external transmission network
• Once a “black start” generator is operating,
others must synchronize with it
• At same time, demand must be brought back
online (requires tight coordination)
7/15/2014
8
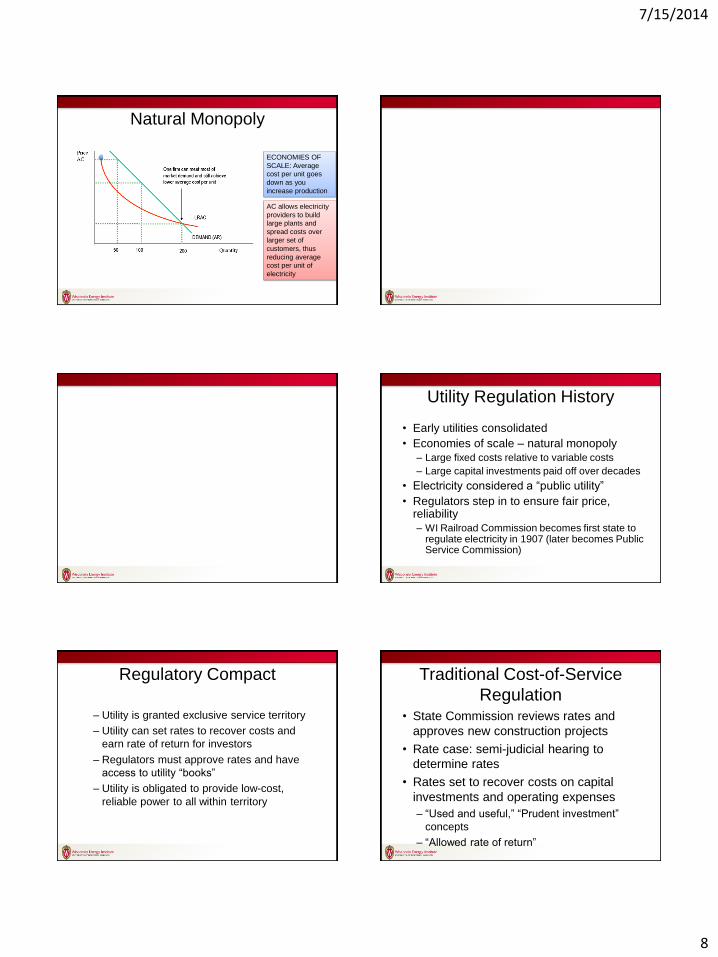
Natural Monopoly
ECONOMIES OF
SCALE: Average
cost per unit goes
down as you
increase production
AC allows electricity
providers to build
large plants and
spread costs over
larger set of
customers, thus
reducing average
cost per unit of
electricity
Utility Regulation History
• Early utilities consolidated
• Economies of scale – natural monopoly
– Large fixed costs relative to variable costs
– Large capital investments paid off over decades
• Electricity considered a “public utility”
• Regulators step in to ensure fair price, reliability
– WI Railroad Commission becomes first state to regulate electricity in 1907 (later becomes Public Service Commission)
Regulatory Compact
– Utility is granted exclusive service territory
– Utility can set rates to recover costs and
earn rate of return for investors
– Regulators must approve rates and have
access to utility “books”
– Utility is obligated to provide low-cost,
reliable power to all within territory
Traditional Cost-of-Service
Regulation • State Commission reviews rates and
approves new construction projects
• Rate case: semi-judicial hearing to
determine rates
• Rates set to recover costs on capital
investments and operating expenses
– “Used and useful,” “Prudent investment”
concepts
– “Allowed rate of return”

7/15/2014
9
Electricity Prices/Demand
(Statistical Yearbook of the
Electric Utility Industry 1971
Edison Electric Institute )
Golden Era for
Electricity:
Increasing
use,
decreasing
prices
What’s changed?
• Thermal efficiency of plants reaching practical limit given current technology
• Small natural gas turbines could compete
• Demand for electricity has slowed
• Concerns about pollution/climate – costs being recognized
• Averch-Johnson effect: rate regulation incentivizes “gold plating”
Slowing Electricity Demand Moves toward
Deregulation/Restructuring • Traditional vertically integrated utility
(generation, transmission, distribution,
retail) no longer considered a monopoly
in all areas
– Greater interconnection along transmission
lines
– Generation and retail opened up to
competition
• Opened up in high-priced states
– Transmission and distribution (“wires”) still
considered monopoly
– Utilities take different forms (“wires only,”
“retail only,” etc.)
Changes in Regulation
• Public Utilities Regulatory Policies Act
(PURPA) – 1978
– Encouraged independent power producers
(IPPs) and combined heat and power to sell
to utilities
• Energy Policy Act of 1992
– Encouraged wholesale power competition
• State-by-state restructuring/deregulation
– Opens retail up to competition
State Restructuring
7/15/2014
10
FERC Orders – Wholesale
Market Competition • Orders 888 and 889
– Required transmission owners to provide
nondiscriminatory access to transmission
lines
• Order 2000
– Established framework for regional
transmission organizations (RTOs)
RTOs/ISOs
• Ensure non-discriminatory access to the
grid
• Monitors operation of grid (but does not
own it)
• Administers wholesale markets (dispatch
and scheduling)
• Engages in long-term transmission
planning
• Voluntary
RTO/ISO Regions MISO & PJM
• MISO: Midcontinent Independent
System Operator
– Covers much of Midwest (including
Wisconsin)
– Some states restructured
• PJM Interconnection
– East Atlantic states (OH, PA, NJ, MD, VA,
WV, DE)
– Many states restructured
• Both operate wholesale markets, slightly
different rules
Wholesale Markets
• Long-term contracts
• Day ahead market (when most
generation is scheduled)
• Real-time market (5 minute)
• Financial Transmission Rights (FTRs)
• Ancillary services
• Capacity market (PJM)
Power System Decision Time
Scales

7/15/2014
11
Day-Ahead Market Operation
• RTO forecasts generation needed for
next day
• Generators bid into market
– Provide X number of MWh at $X
• Once capacity reached, the last
generator that bids (marginal)
determines the “clearing price”
• All generators paid clearing price


![Pillars of Power Energy Power[1]](https://img.pdfslide.net/doc/110x75/577dac9c1a28ab223f8e1954/pillars-of-power-energy-power1.jpg)