Embed Size (px)
Citation preview
Wildfire hazard
Climatic regime:seasonal drought
Current weather:rainfall, lightning,
atmospheric humidity
Fuel type
Fuel amount
FlammabilityVegetation
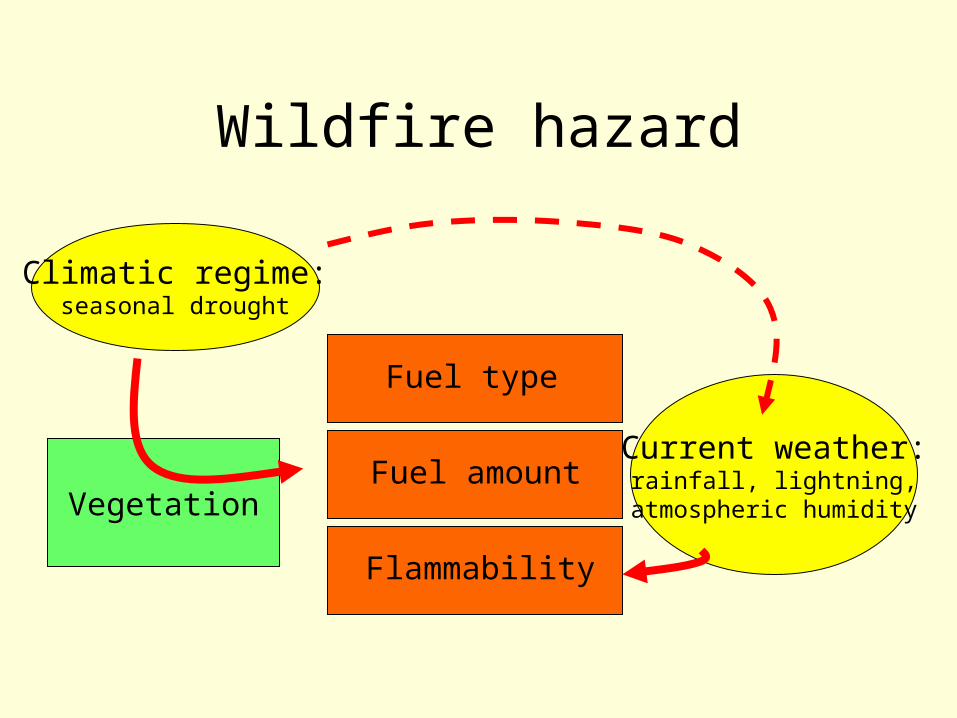
Assessing the wildfire hazard in Canada
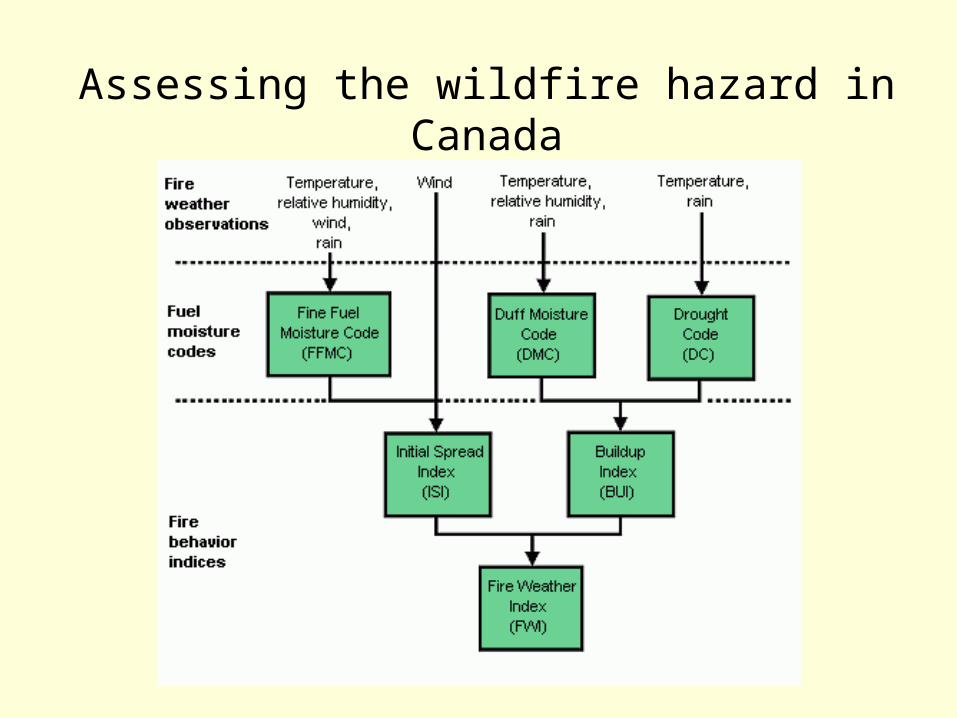
Drought Code (fuel
flamma-bility)
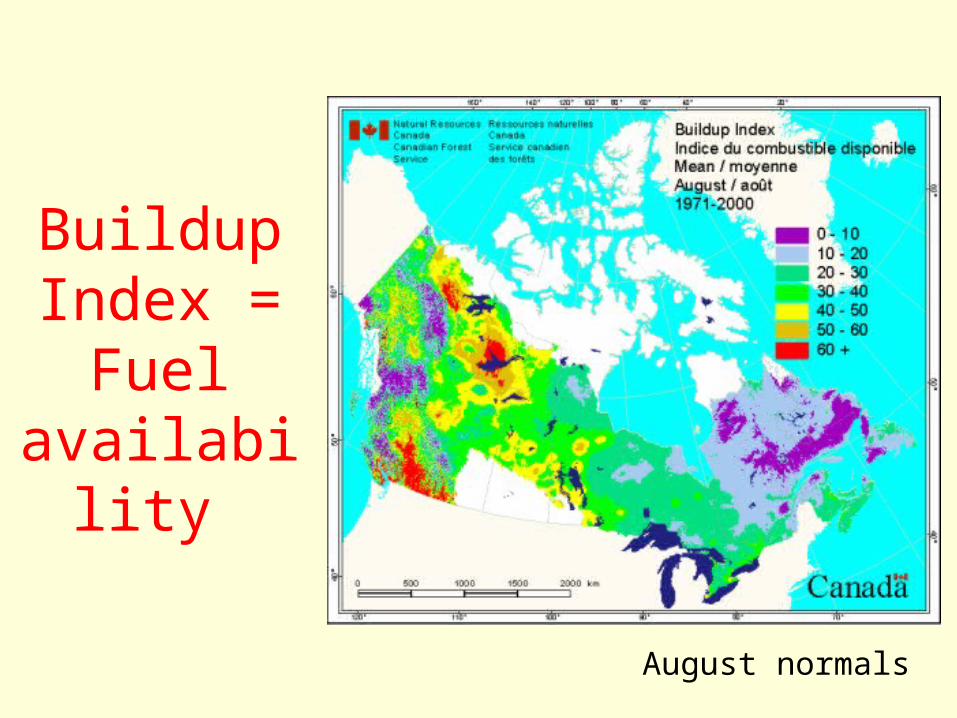
Buildup Index =
Fuel availabilit
y
August normals
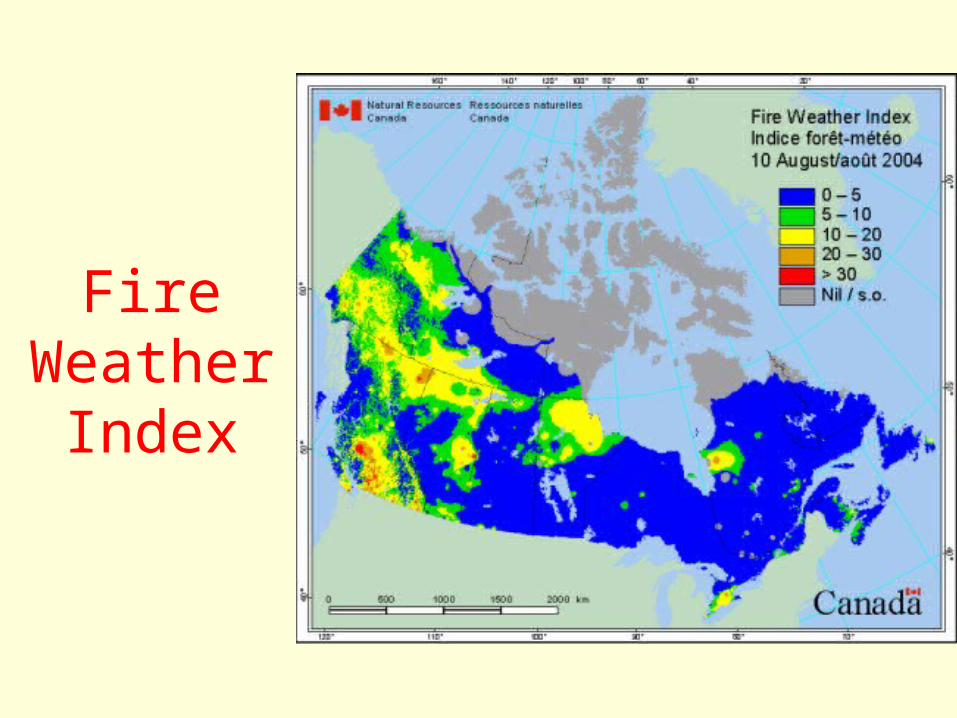
Fire Weather
Index
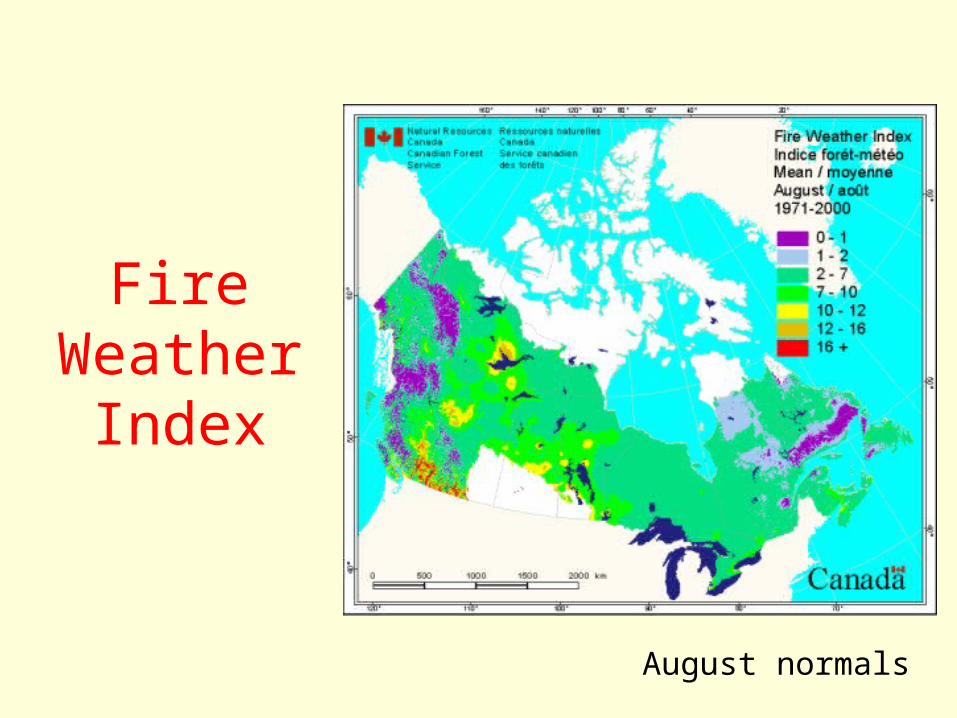
Fire Weather
Index
August normals
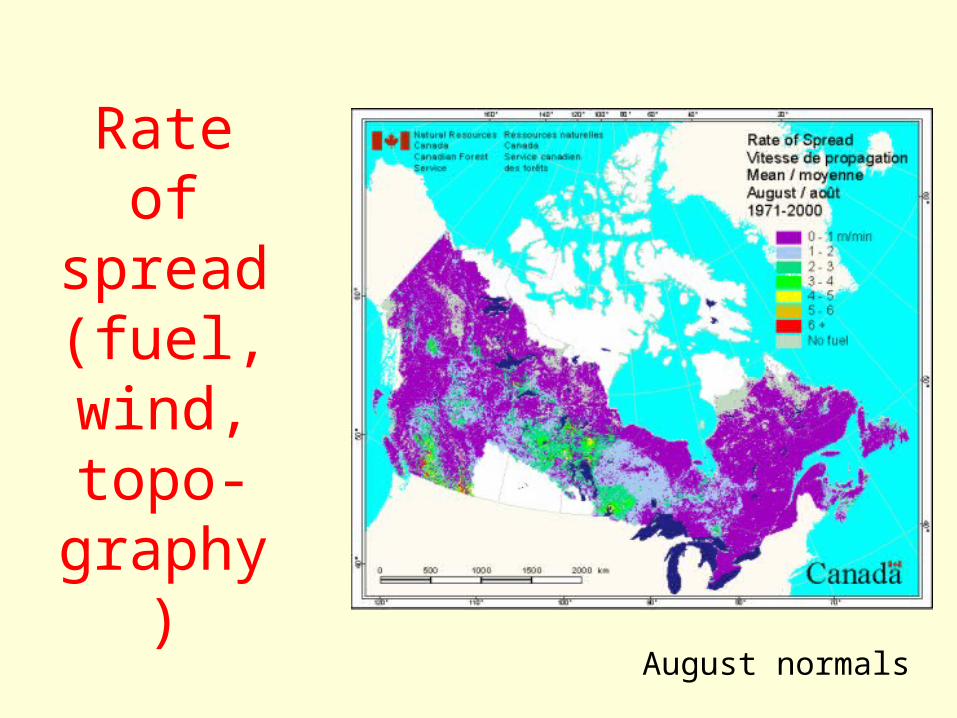
Rate of spread (fuel, wind, topo-
graphy)August normals
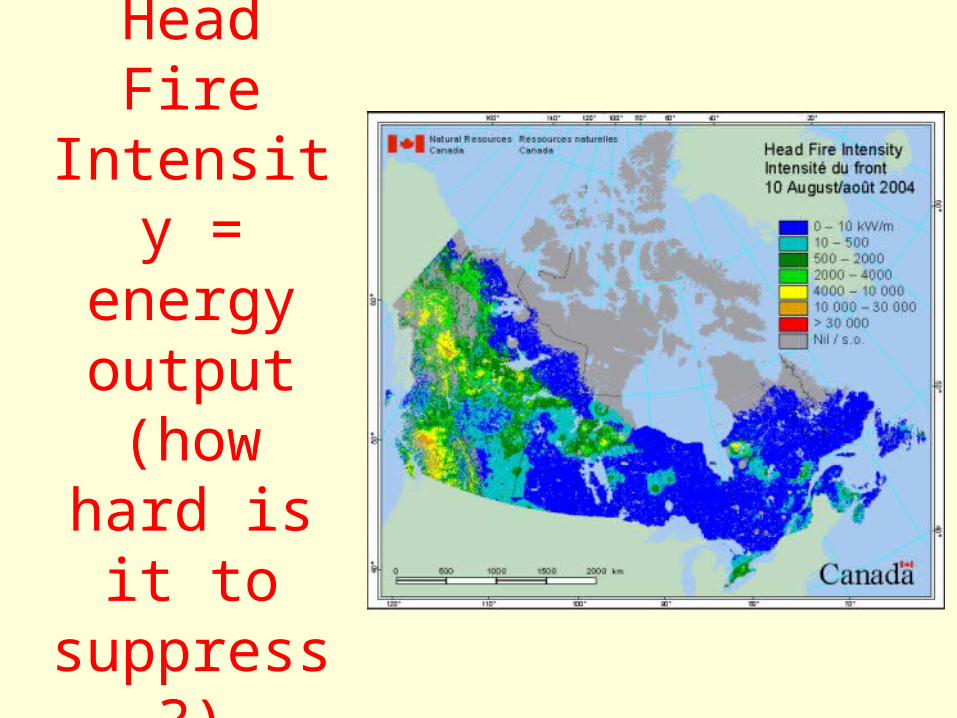
Head Fire Intensity = energy
output (how hard
is it to suppress?
)
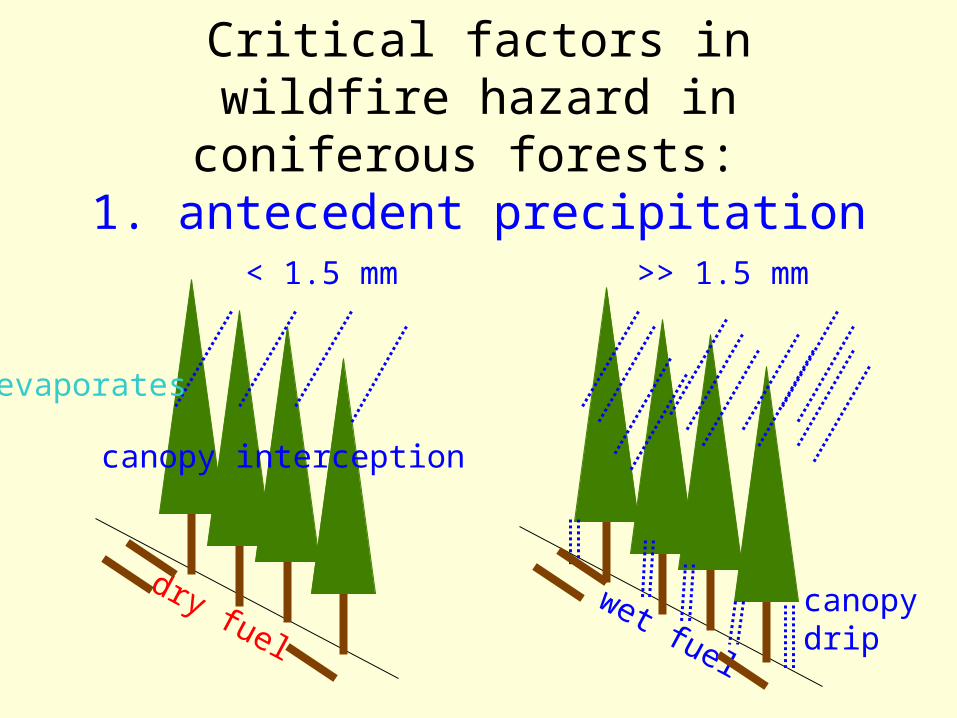
Critical factors in wildfire hazard in coniferous forests:
1. antecedent precipitation
dry fuel
< 1.5 mm
canopy interception
wet fuel
>> 1.5 mm
canopy drip
evaporates
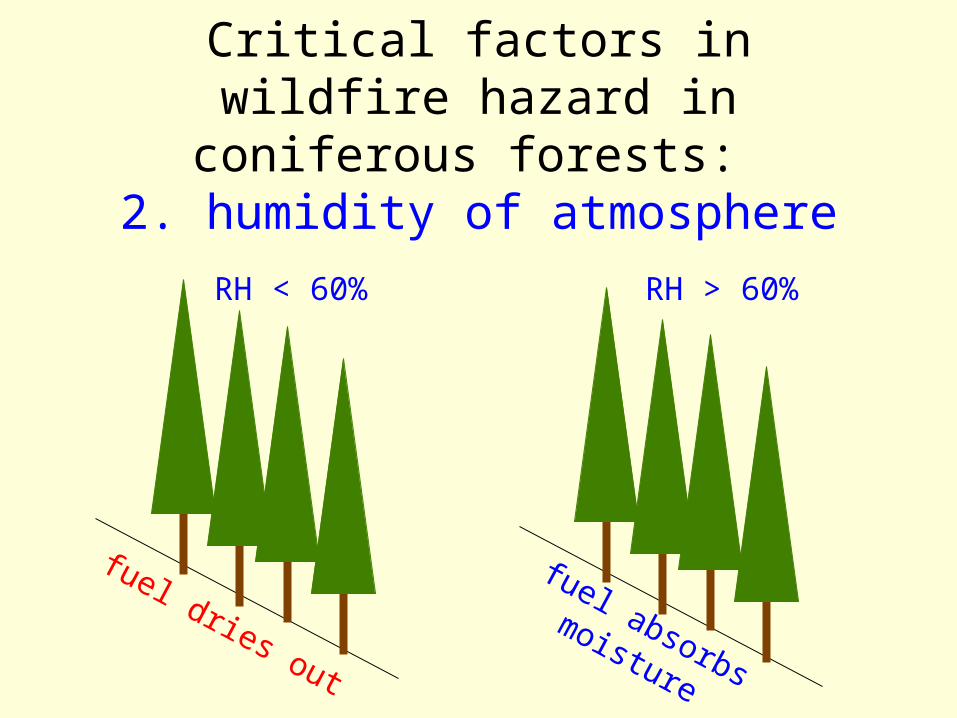
Critical factors in wildfire hazard in coniferous forests:
2. humidity of atmosphere
fuel dries out
RH < 60%
fuel absorbs moisture
RH > 60%
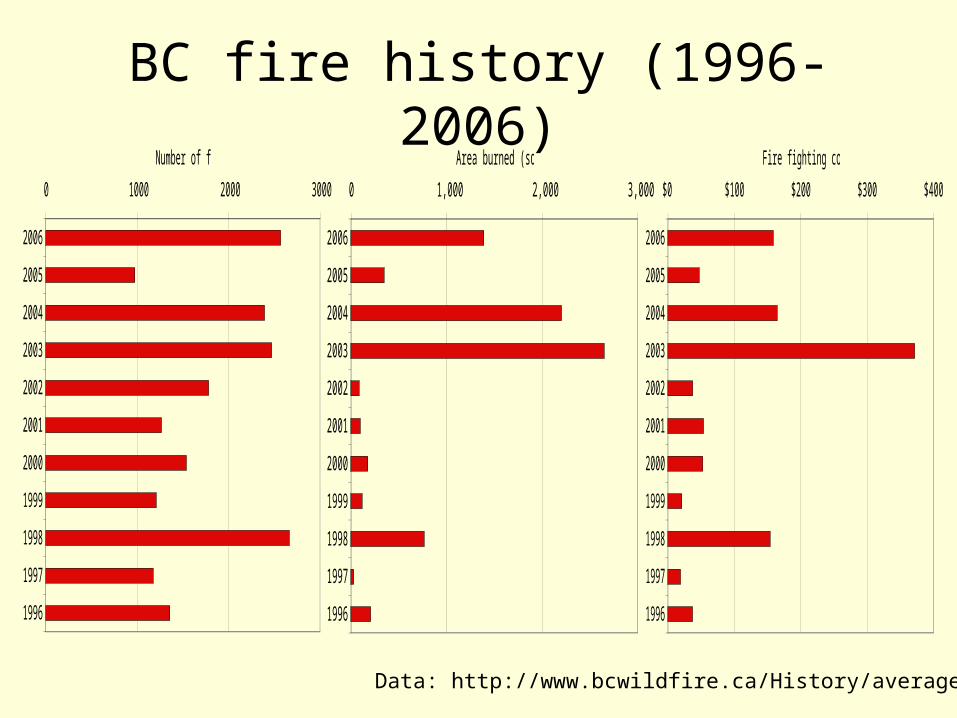
BC fire history (1996-2006)0 1000 2000 3000
19961997199819992000200120022003200420052006
Number of fires0 1,000 2,000 3,000
19961997199819992000200120022003200420052006
Area burned (sq. km)$0 $100 $200 $300 $400
19961997199819992000200120022003200420052006
Fire fighting costs ($M)
Data: http://www.bcwildfire.ca/History/average.htm
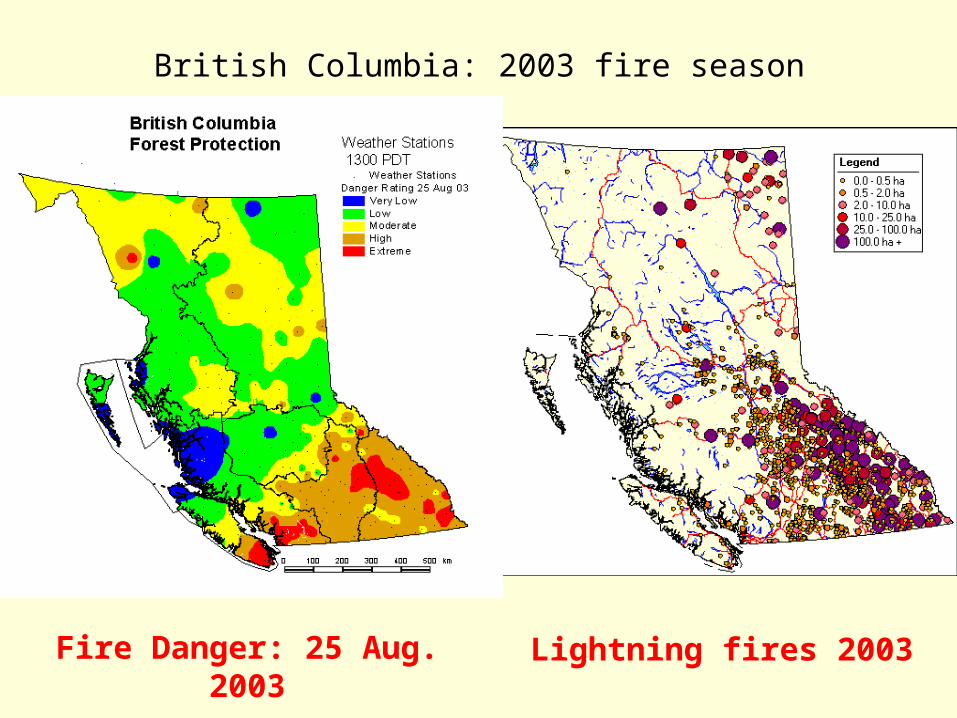
Lightning fires 2003
British Columbia: 2003 fire season
Fire Danger: 25 Aug. 2003
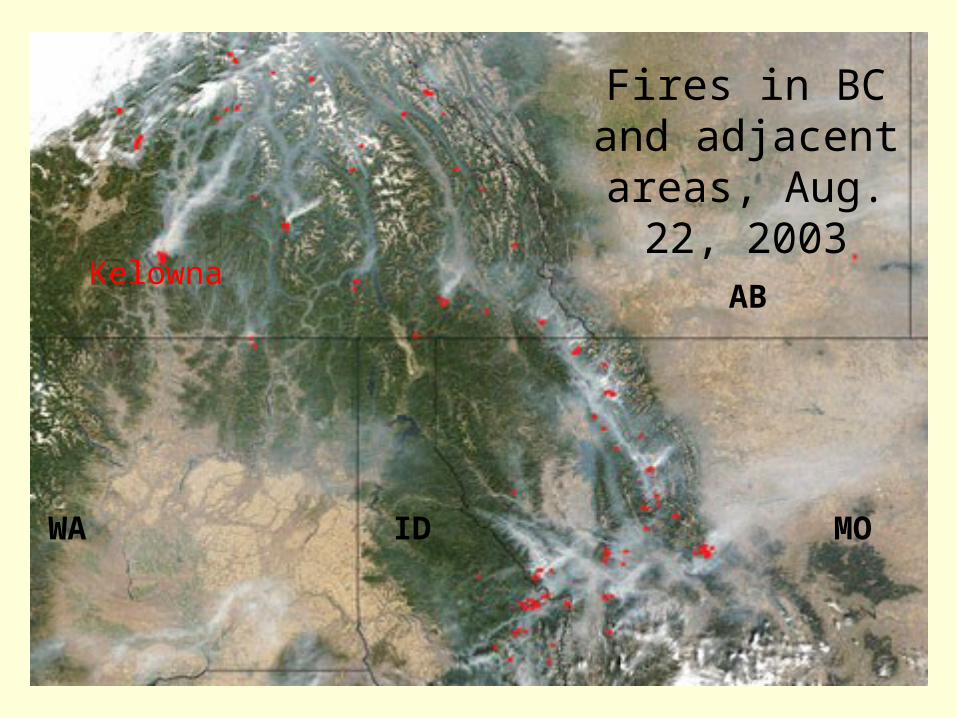
Fires in BC and adjacent areas, Aug. 22, 2003
WA ID MO
Kelowna AB
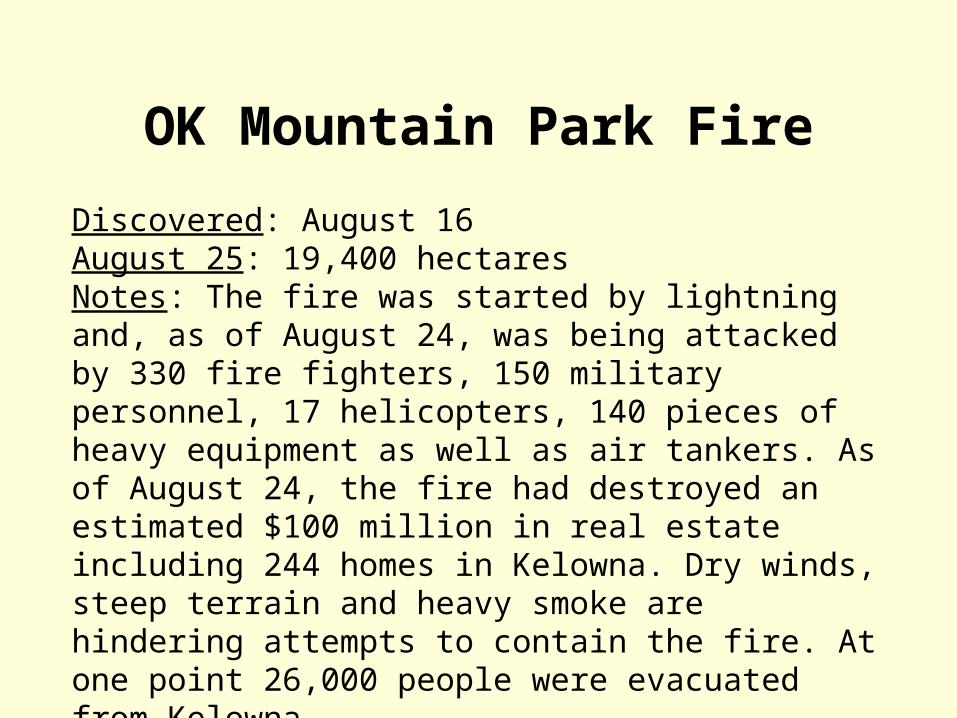
OK Mountain Park FireDiscovered: August 16 August 25: 19,400 hectares Notes: The fire was started by lightning and, as of August 24, was being attacked by 330 fire fighters, 150 military personnel, 17 helicopters, 140 pieces of heavy equipment as well as air tankers. As of August 24, the fire had destroyed an estimated $100 million in real estate including 244 homes in Kelowna. Dry winds, steep terrain and heavy smoke are hindering attempts to contain the fire. At one point 26,000 people were evacuated from Kelowna.
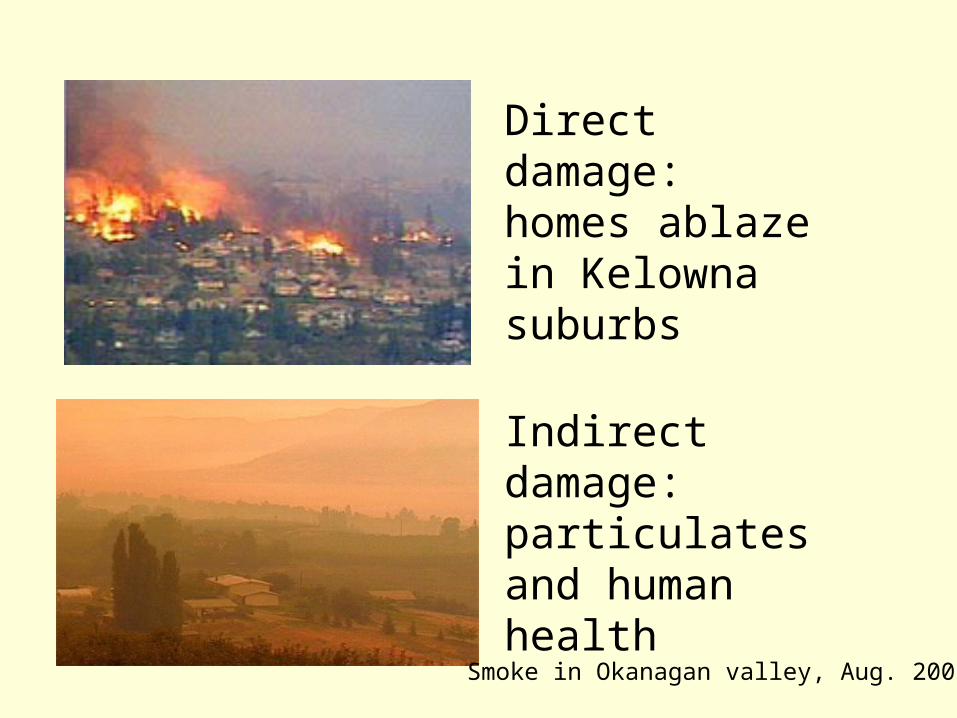
Direct damage: homes ablaze in Kelowna suburbs
Indirect damage: particulates and human health
Smoke in Okanagan valley, Aug. 2003
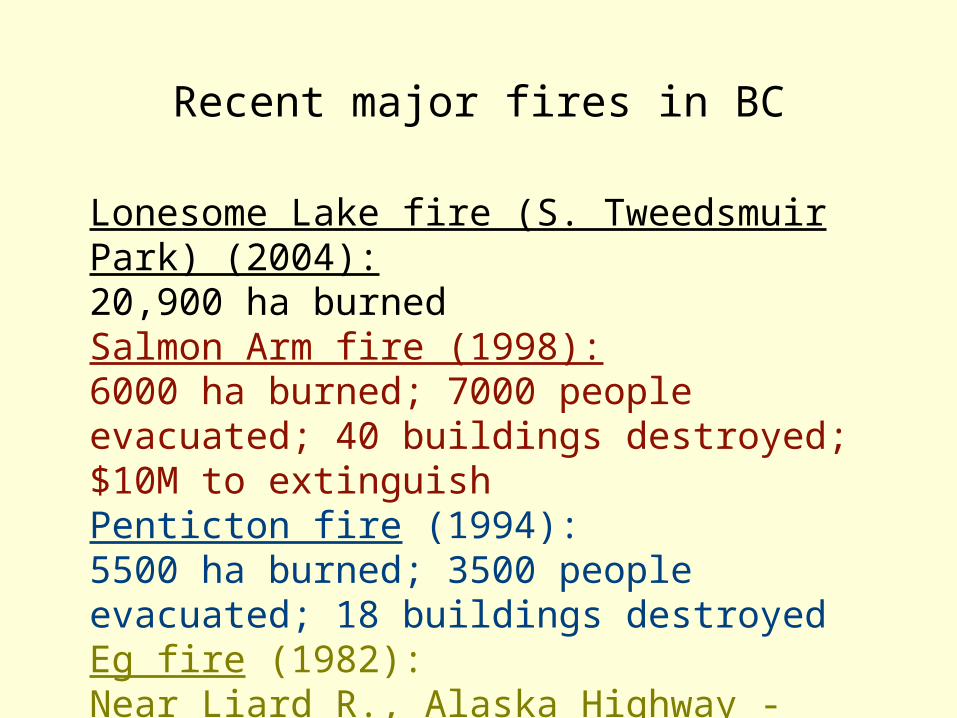
Recent major fires in BC
Lonesome Lake fire (S. Tweedsmuir Park) (2004):20,900 ha burnedSalmon Arm fire (1998): 6000 ha burned; 7000 people evacuated; 40 buildings destroyed; $10M to extinguishPenticton fire (1994): 5500 ha burned; 3500 people evacuated; 18 buildings destroyedEg fire (1982):Near Liard R., Alaska Highway - 180,000 ha burned
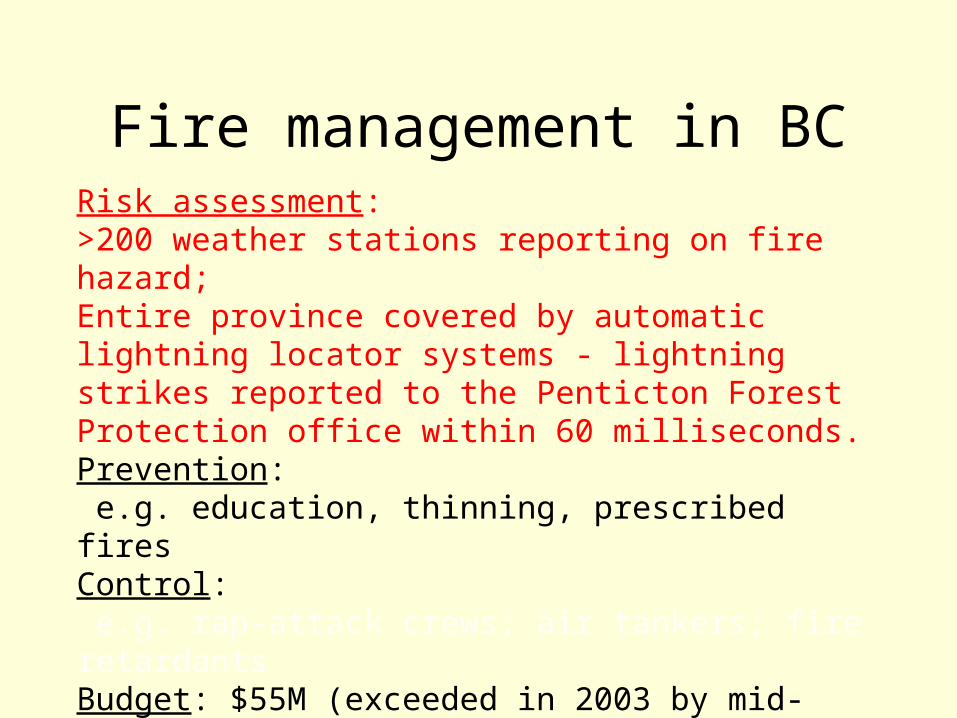
Fire management in BCRisk assessment:>200 weather stations reporting on fire hazard;Entire province covered by automatic lightning locator systems - lightning strikes reported to the Penticton Forest Protection office within 60 milliseconds.Prevention: e.g. education, thinning, prescribed firesControl: e.g. rap-attack crews; air tankers; fire retardantsBudget: $55M (exceeded in 2003 by mid-August)
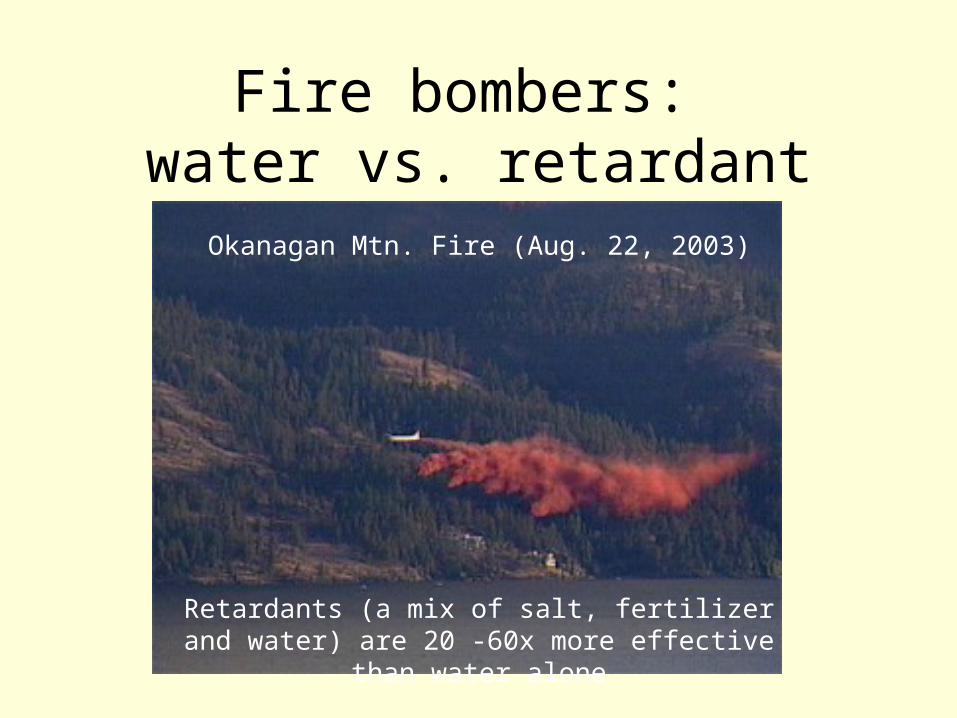
Fire bombers: water vs. retardant
Okanagan Mtn. Fire (Aug. 22, 2003)
Retardants (a mix of salt, fertilizer and water) are 20 -60x more effective than
water alone
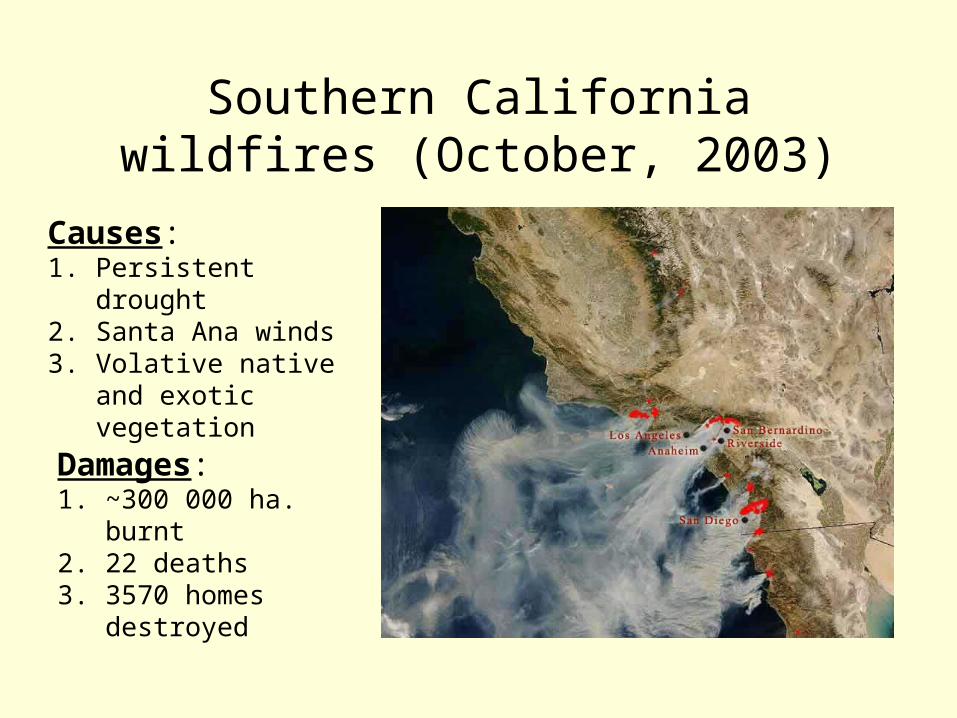
Southern California wildfires (October, 2003)
Causes:1. Persistent drought2. Santa Ana winds3. Volative native and
exotic vegetation
Damages:1. ~300 000 ha. burnt2. 22 deaths3. 3570 homes
destroyed
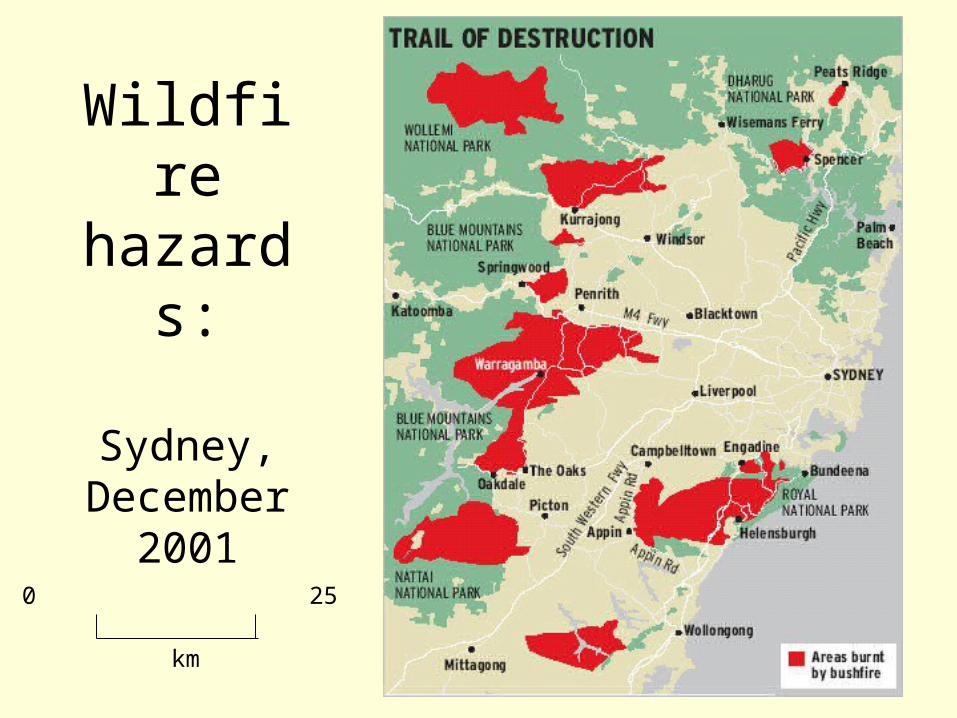
Wildfire hazards
:
Sydney, December
2001
km
0 25
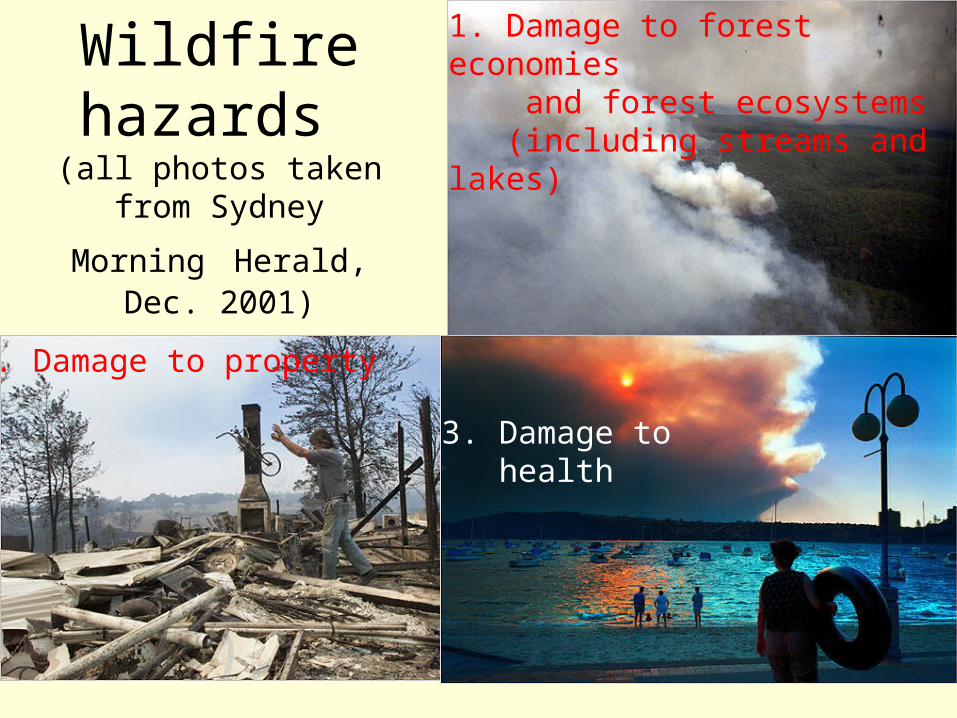
Wildfire hazards (all photos taken
from Sydney Morning Herald,
Dec. 2001)
1. Damage to forest economies and forest ecosystems (including streams and lakes)
2. Damage to property
3. Damage to health
Homes in fire-prone areas
• building a fire-resistant home, and• developing “defensible space” around the
house
There is increasing residential sprawl into the “wildland-urban interface” and federal, provincial and state forest services in affected areas are reconsidering forest fire-fighting tactics in these WUI areas. Homeowners in these areas are urged to adopt “firesmart” practices. These include:
A defensible site Slope: Flames traveling up a 30% slope are commonly twice as high, and travel 150% faster than flames on a flat area.
Aspect: S and SW-facing slopes are drier, and therefore more fire-prone than N and NE slopes (in N. hemisphere).
Forest type: Tall forest with dense underbrush and thick fuel accumulations on the forest floor are more hazardous than open forest with grassland.
Ease of access and egress: roads and fire-proof bridges.
A defensible house•Roofs may be ignited by firebrands; use fire-resistant materials and remove debris from gutters.•Walls may be ignited by heat from flames; use fire-resistant siding and deck supports; keep windows and vents small, and block in event of forest fire.•Clear trees and shrubs from 10m zone around house. Create a fire break by irrigating this area. •Build pond for emergency water supply.
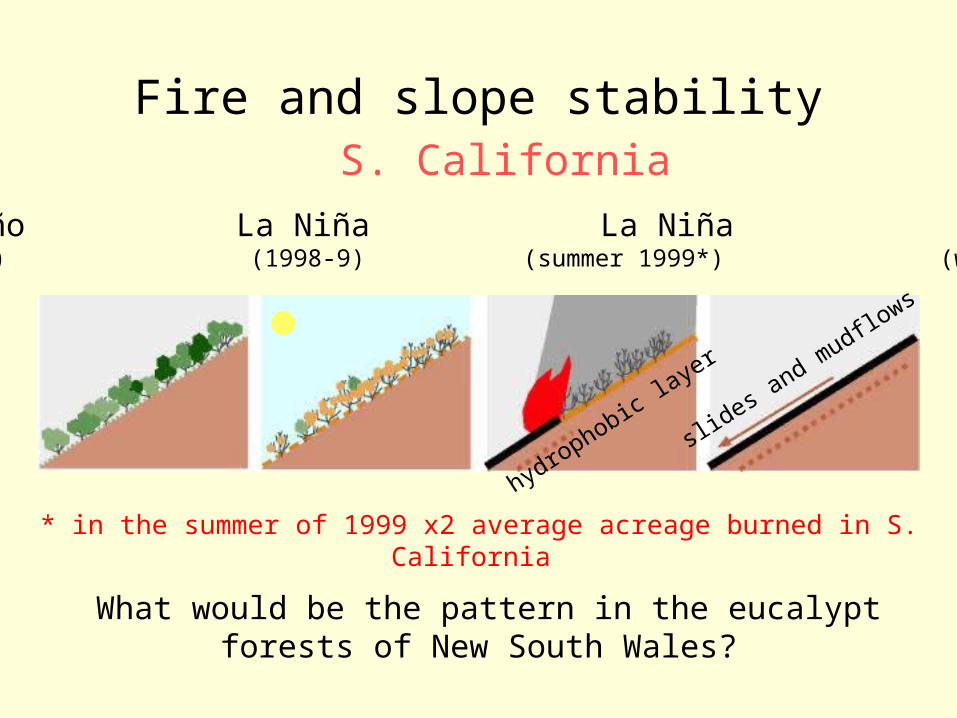
Fire and slope stability
El Niño La Niña La Niña normal (1997-8) (1998-9) (summer 1999*) (winter ‘99)
* in the summer of 1999 x2 average acreage burned in S. California
slides and mudflows
hydrophobic layer
S. California
What would be the pattern in the eucalypt forests of New South Wales?
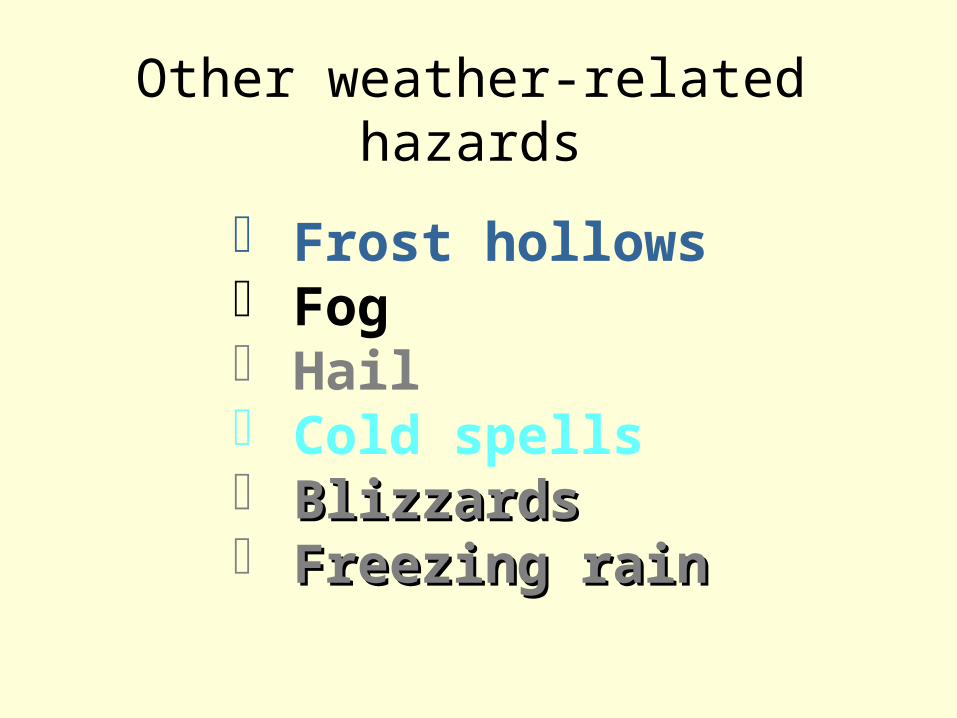
Other weather-related hazards
Frost hollows Fog Hail Cold spells BlizzardsBlizzards Freezing rainFreezing rain
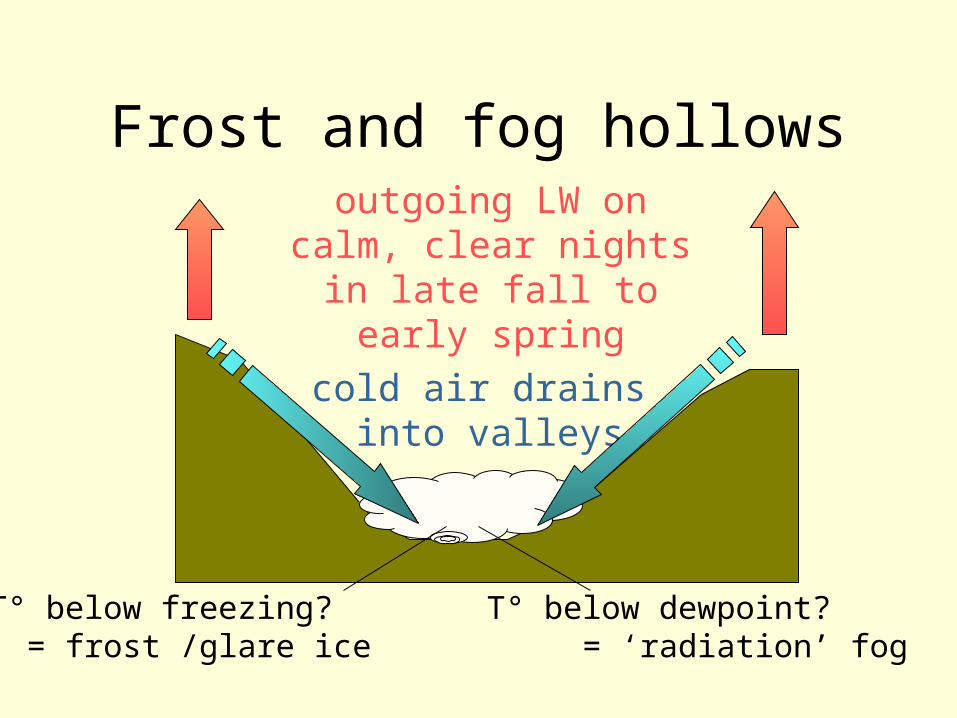
Frost and fog hollowsoutgoing LW on calm, clear nights in late fall
to early spring
cold air drains into valleys
T° below freezing? T° below dewpoint? = frost /glare ice = ‘radiation’ fog
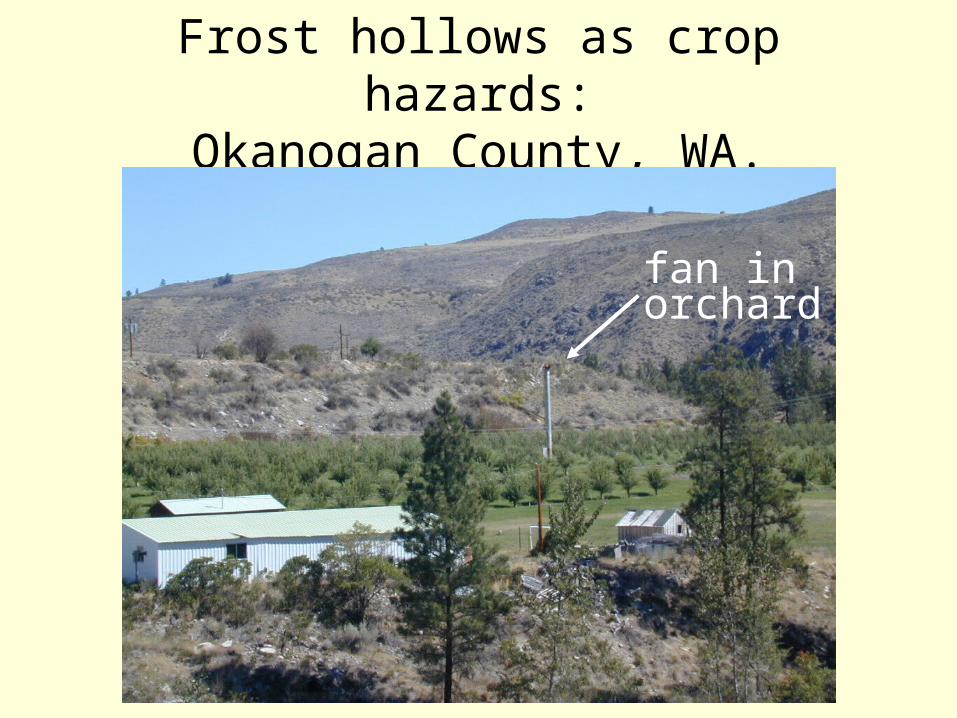
Frost hollows as crop hazards:Okanogan County, WA.
fan in orchard
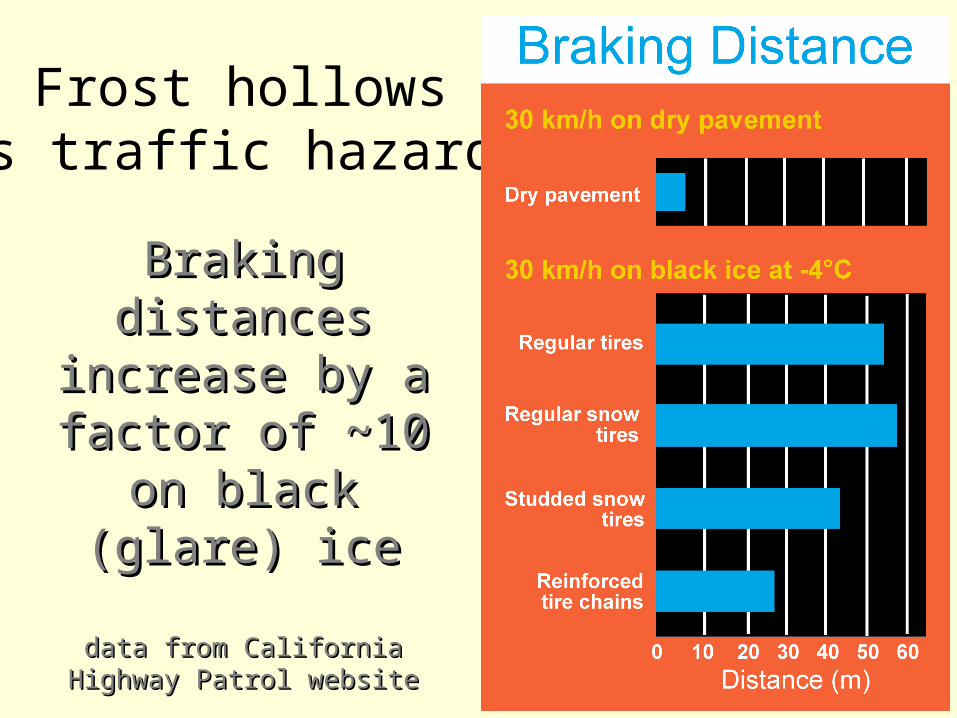
Braking Braking distances distances
increase by a increase by a factor of ~10 factor of ~10
on black (glare) on black (glare) iceice
data from California data from California Highway Patrol websiteHighway Patrol website
Frost hollowsas traffic hazards
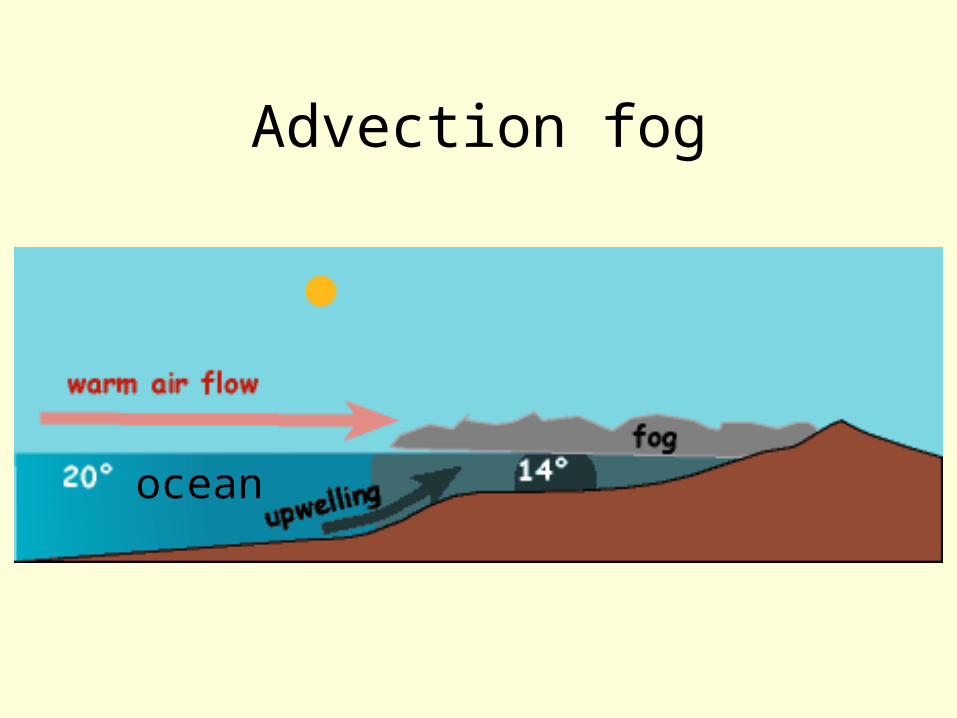
Advection fog
ocean
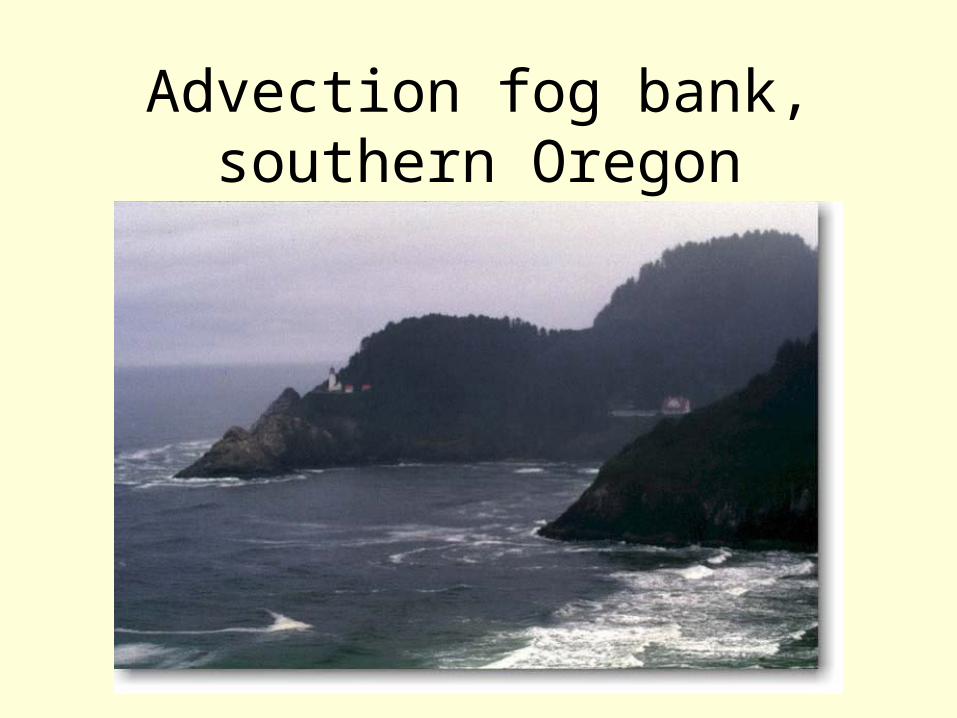
Advection fog bank, southern Oregon
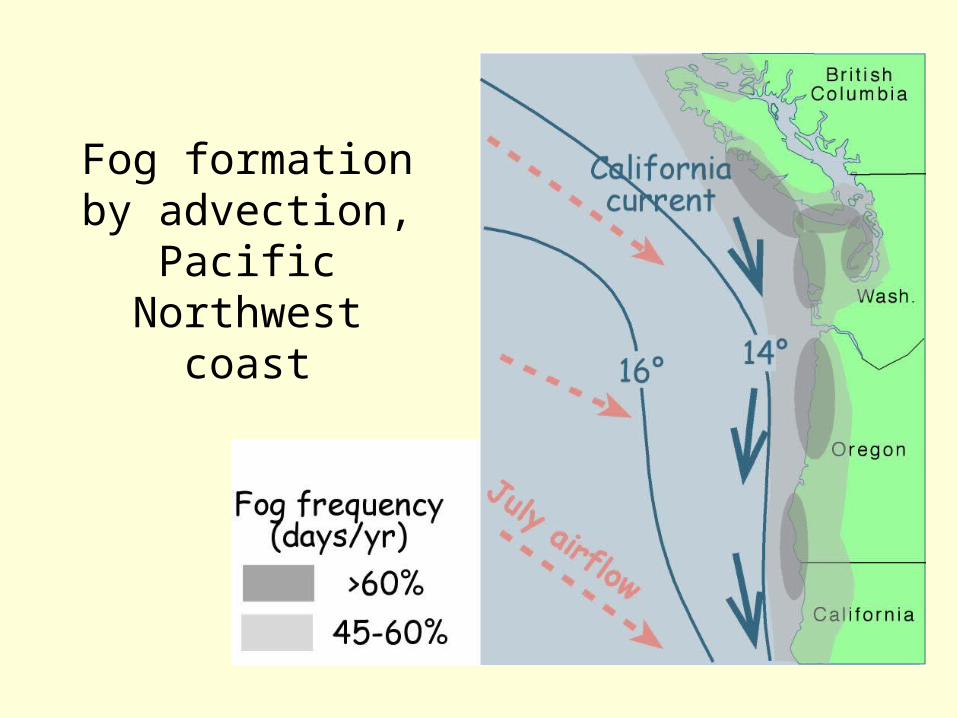
Fog formation by advection,
Pacific Northwest
coast
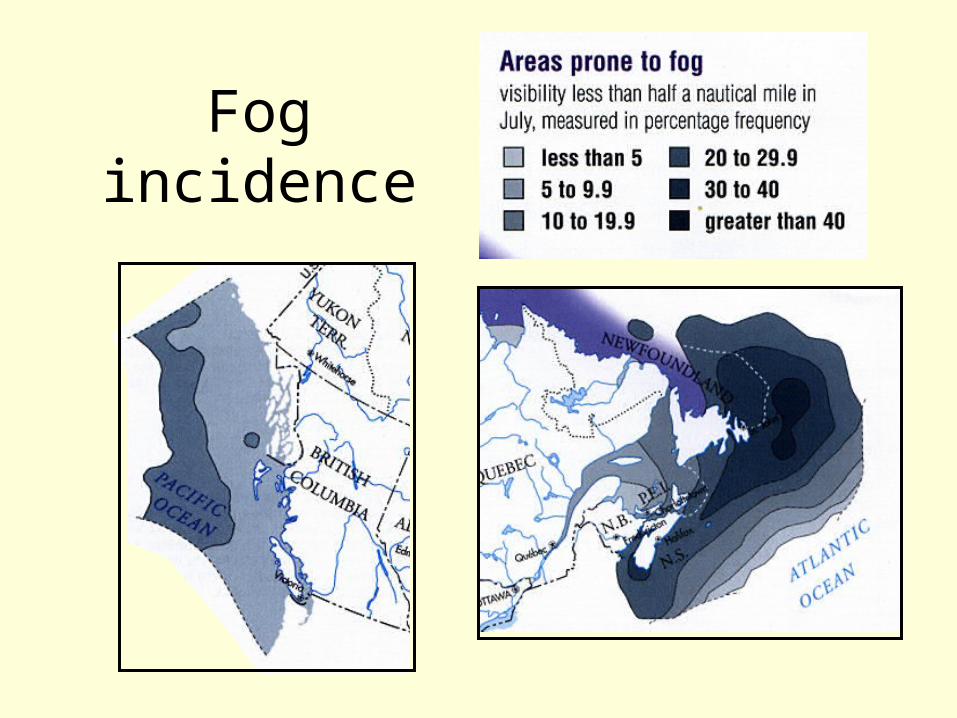
Fog incidence
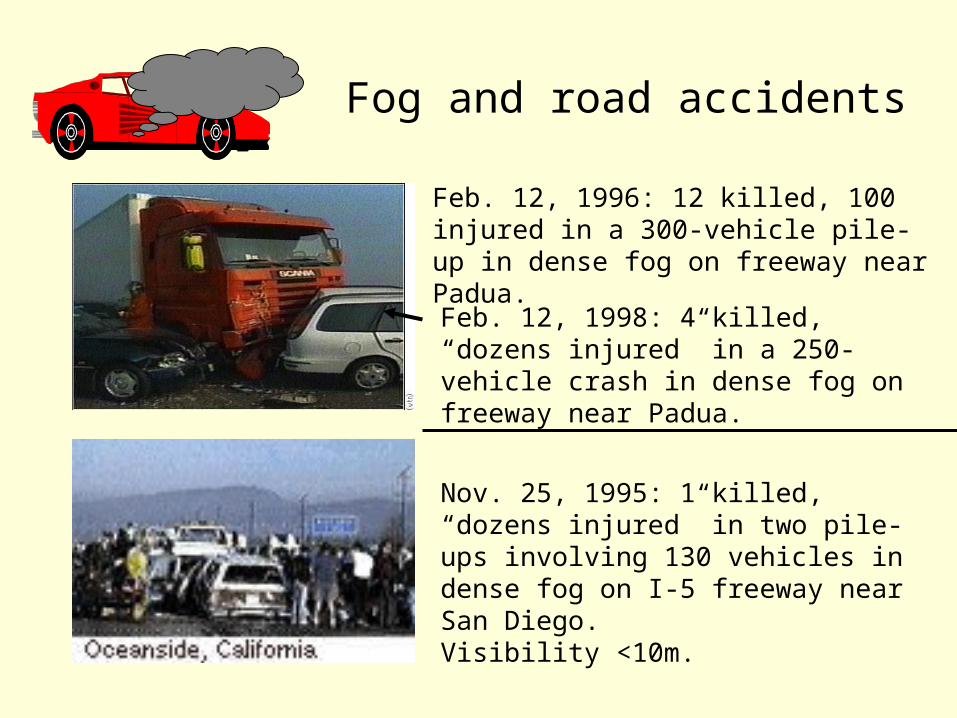
Fog and road accidents
Feb. 12, 1996: 12 killed, 100 injured in a 300-vehicle pile-up in dense fog on freeway near Padua.Feb. 12, 1998: 4 killed, “dozens injured” in a 250-vehicle crash in dense fog on freeway near Padua.
Nov. 25, 1995: 1 killed, “dozens injured” in two pile-ups involving 130 vehicles in dense fog on I-5 freeway near San Diego.Visibility <10m.
Fog and aircraft safety
• Fog can cause flight delays, cancellations, and accidents.
• Some airports (e.g. SFO) and airlines (e.g. Alaska) especially hard-hit. Latter used to lose US $5M/yr as a result of fog-caused problems.
• New technology (“Fog Buster”) allows pilots to takeoff in <100m visibility, and land in <200m visibility.
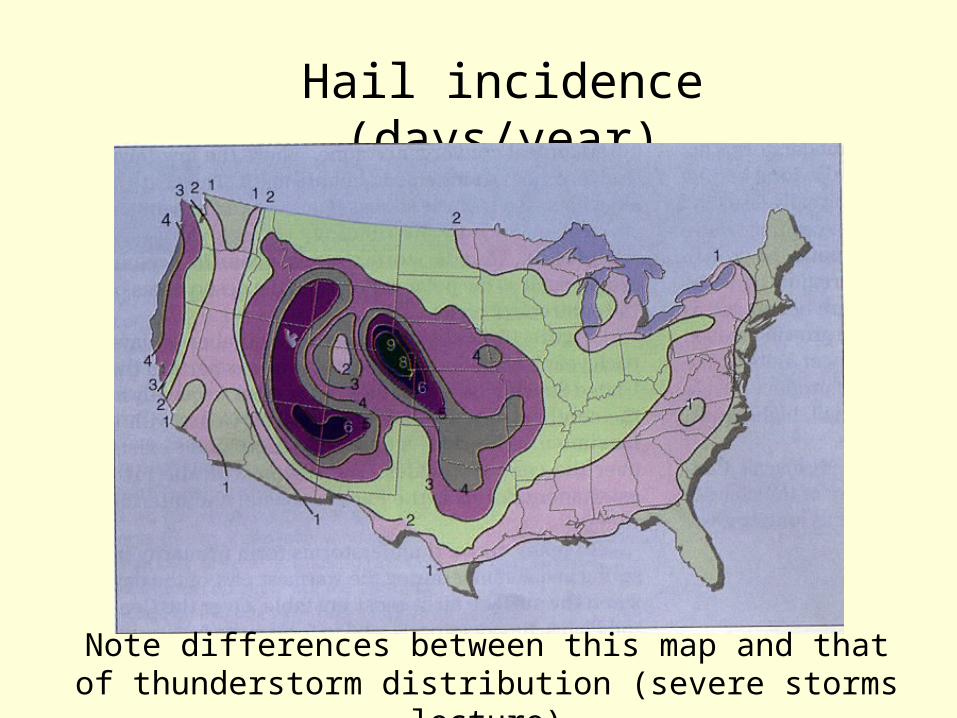
Hail incidence (days/year)
Note differences between this map and that of thunderstorm distribution (severe storms lecture)
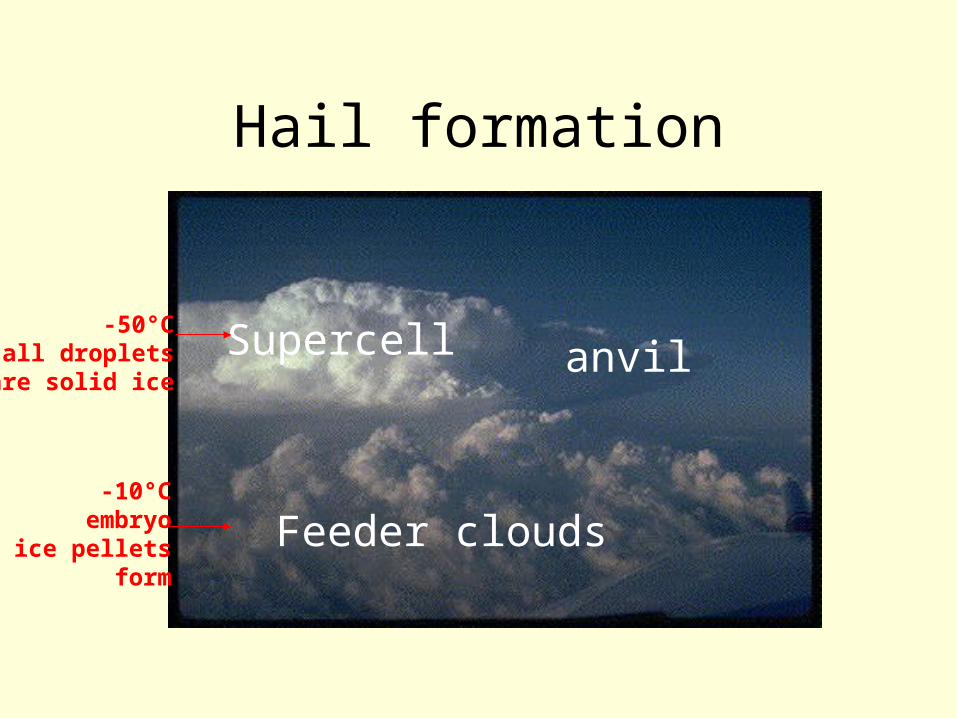
Hail formation
Feeder clouds
Supercell anvil
-10°Cembryo
ice pelletsform
-50°Call droplets
are solid ice
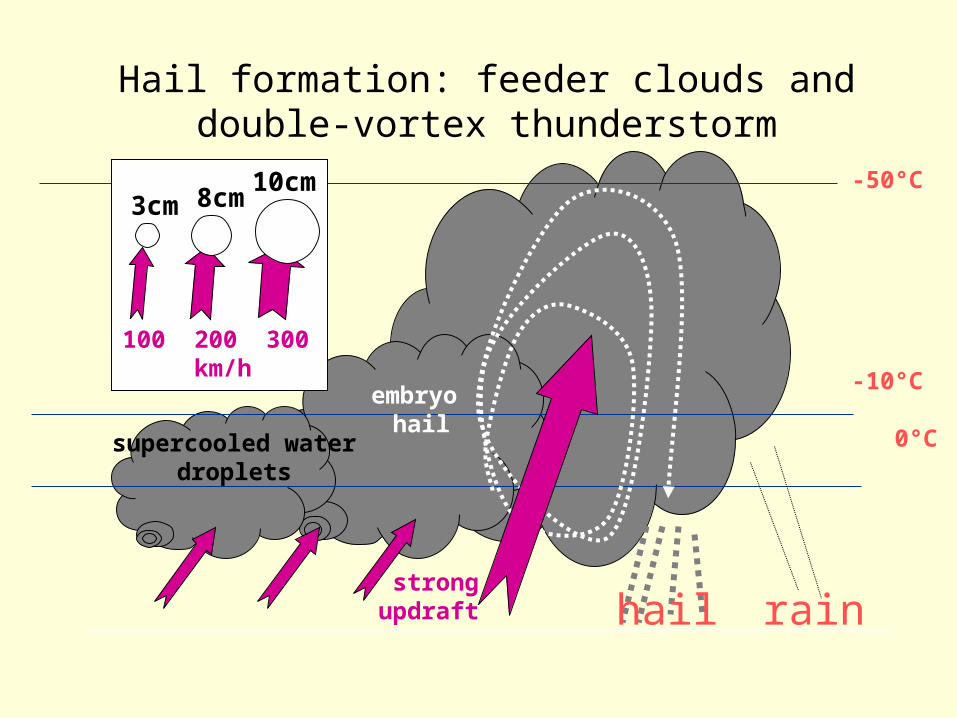
Hail formation: feeder clouds and double-vortex thunderstorm
-50°C
-10°C
0°Csupercooled waterdroplets
embryo hail
rainhailstrongupdraft
100 200 300 km/h
10cm8cm3cm
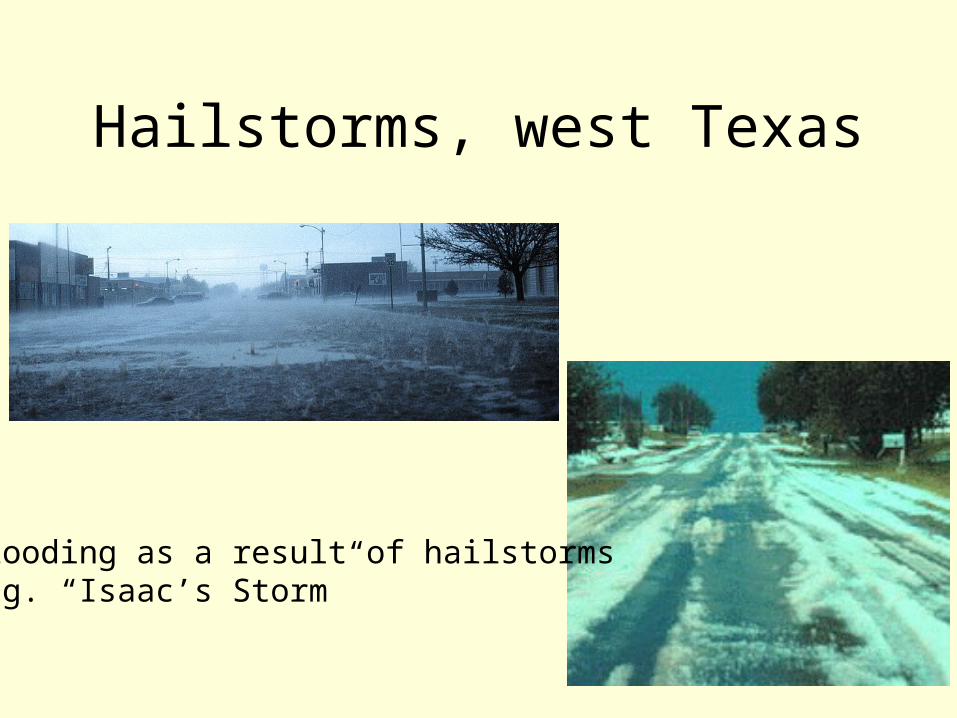
Hailstorms, west Texas
Flooding as a result of hailstormse.g. “Isaac’s Storm”
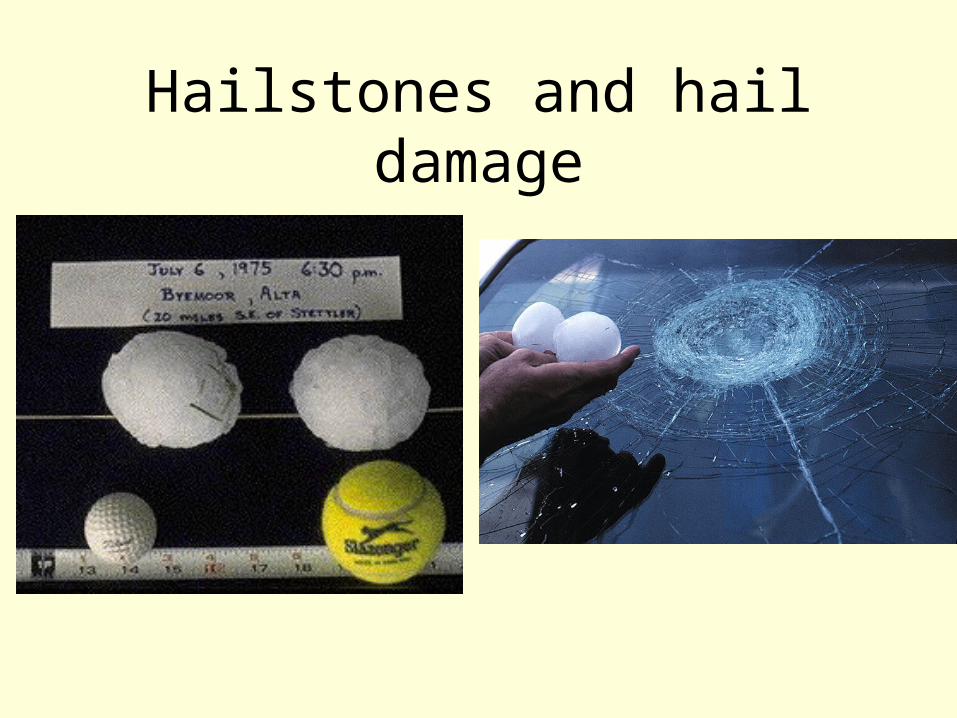
Hailstones and hail damage
Hail damageSevere incidents•Denver, COL -- US$625M insurance costs for damage from large hail (July 11, 1990)
•Calgary, AL --US$400M (Sept., 7, 1991)
Annual costs of hail damage (mainly to crops) in Alberta in early 1980’s ~US$100M. Urban damage now commonly exceeds agricultural damage.
Hail suppressionBased on the concept that there are insufficient ice nuclei in a cloud producing large hail. Seeding the cloud with artificial nuclei (AgI) produces competition for the supercooled water in the cloud, so the hailstones that are produced will be smaller and therefore produce less damage. If enough nuclei are introduced into the growth region, then the hailstones may be small enough to melt before reaching the ground.
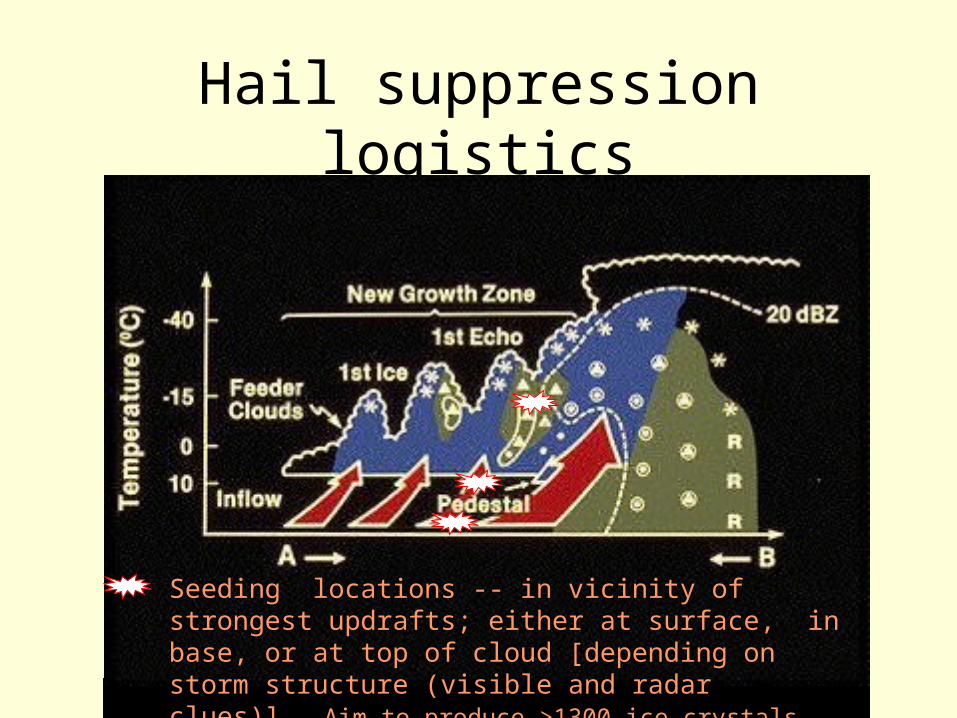
Hail suppression logistics
Seeding locations -- in vicinity of strongest updrafts; either at surface, in base, or at top of cloud [depending on storm structure (visible and radar clues)]. Aim to produce >1300 ice crystals per litre of air.
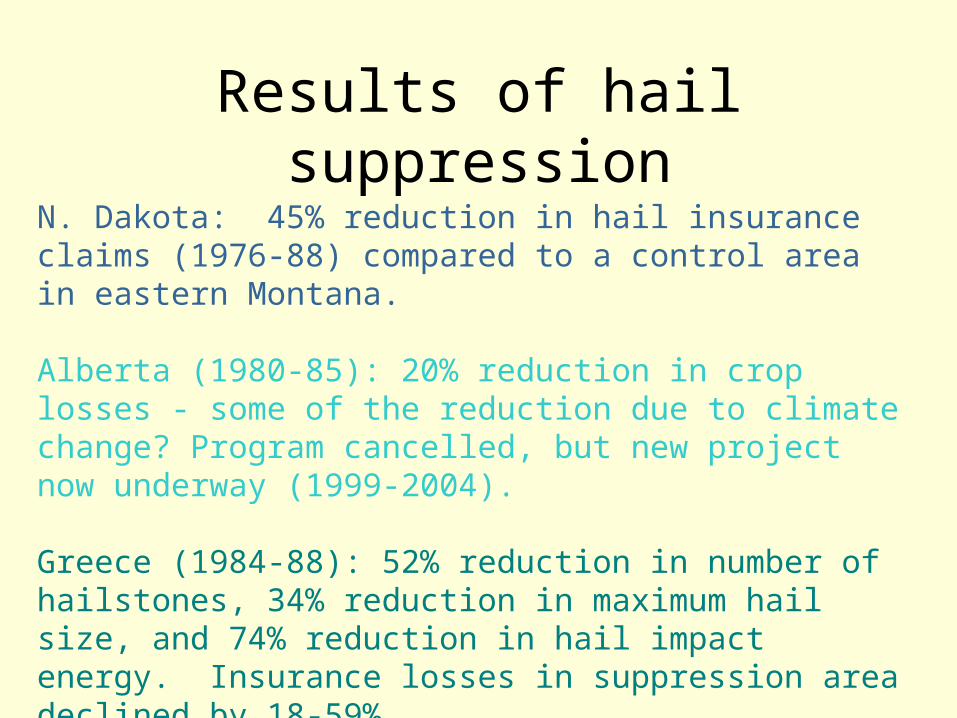
Results of hail suppressionN. Dakota: 45% reduction in hail insurance claims (1976-88) compared to a control area in eastern Montana.
Alberta (1980-85): 20% reduction in crop losses - some of the reduction due to climate change? Program cancelled, but new project now underway (1999-2004).
Greece (1984-88): 52% reduction in number of hailstones, 34% reduction in maximum hail size, and 74% reduction in hail impact energy. Insurance losses in suppression area declined by 18-59%.
Winter hazards • Thermal:
human discomfort and diseaseheating costs (10% of Swedish GNP!)damage to crops, buildings, roads, etc.
• Precipitation:blizzards, freezing rain
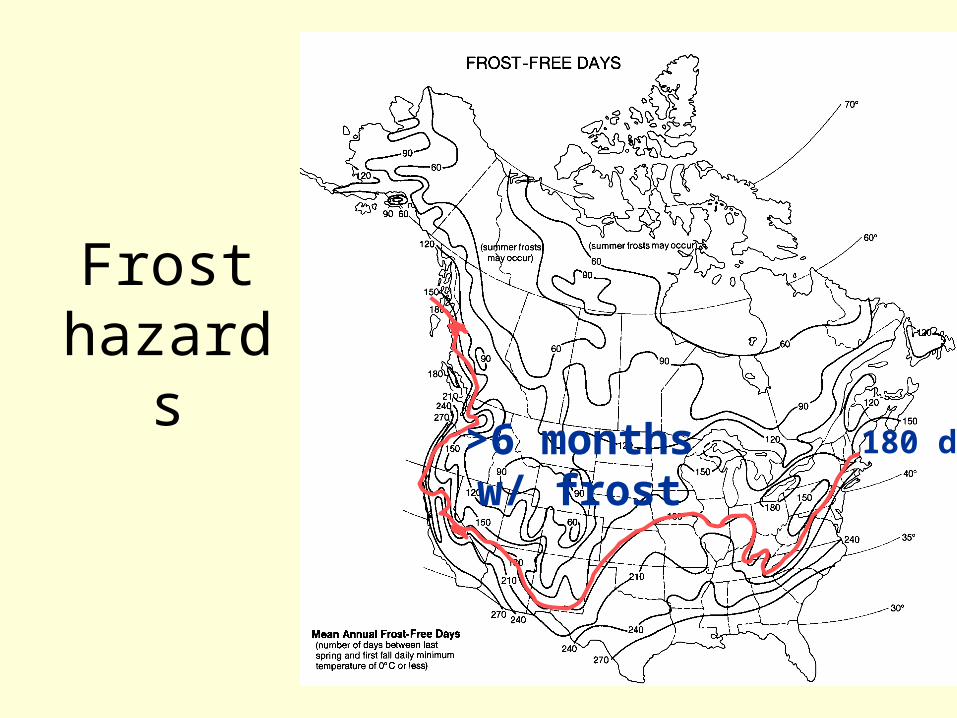
Frosthazard
s180 d>6 months
w/ frost
Hypothermia•Cold exposure results in vascorestriction of blood vessels, restricting flow of blood to skin.
•When deep body temperature falls below 35°C thermal control is lost. Death occurs when deep body temperature falls below 26°C
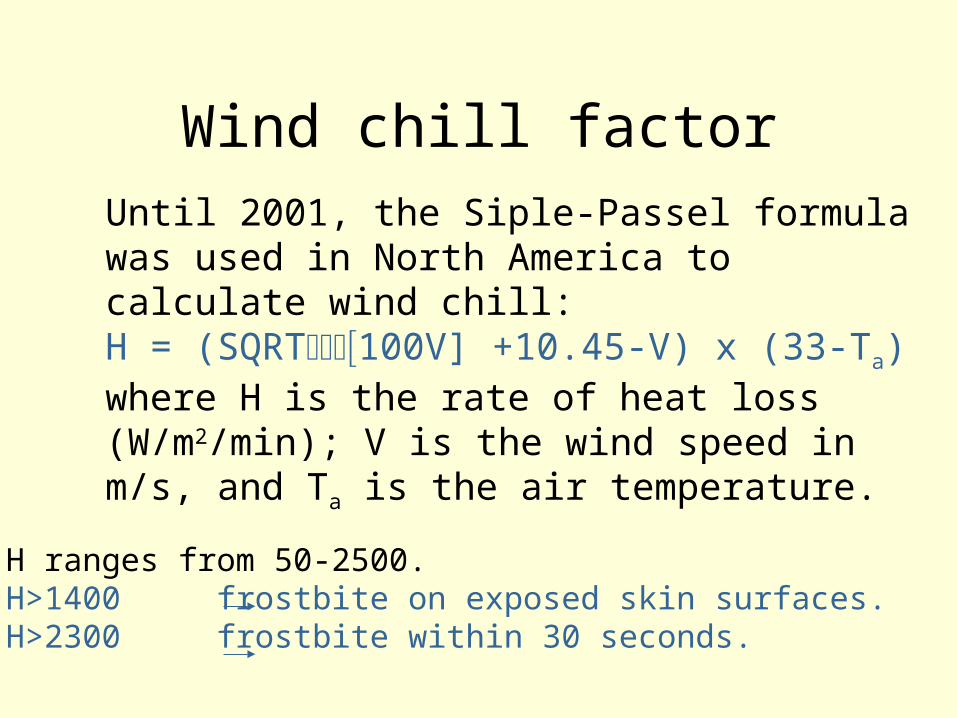
Wind chill factorUntil 2001, the Siple-Passel formula was used in North America to calculate wind chill:H = (SQRT100V] +10.45-V) x (33-Ta)where H is the rate of heat loss (W/m2/min); V is the wind speed in m/s, and Ta is the air temperature.
H ranges from 50-2500. H>1400 frostbite on exposed skin surfaces.H>2300 frostbite within 30 seconds.
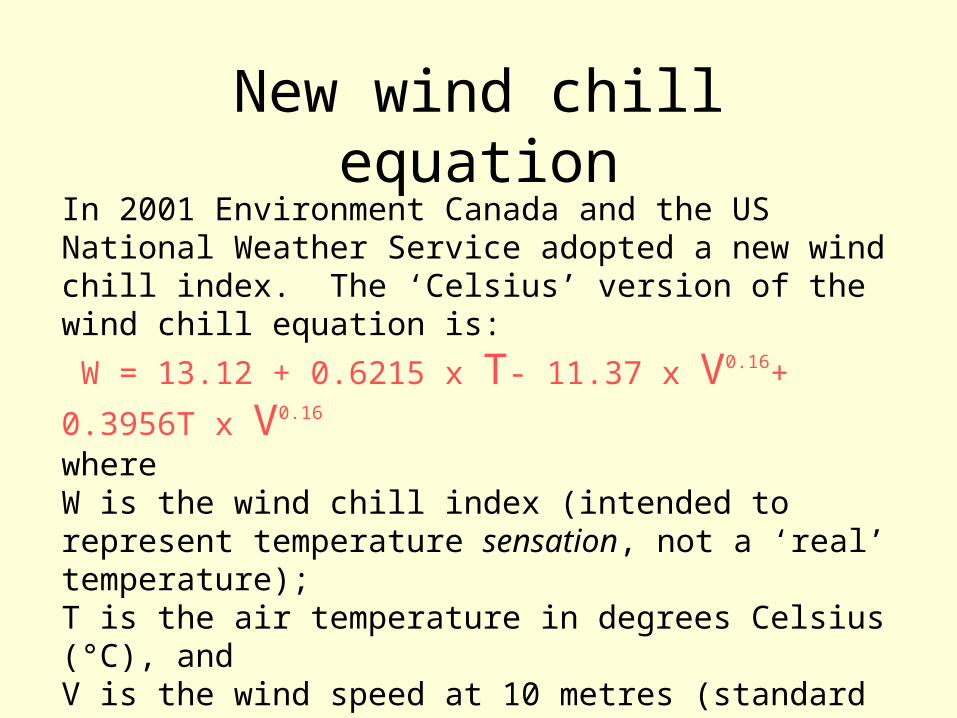
New wind chill equationIn 2001 Environment Canada and the US National Weather Service adopted a new wind chill index. The ‘Celsius’ version of the wind chill equation is: W = 13.12 + 0.6215 x T- 11.37 x V0.16+ 0.3956T x V0.16
where W is the wind chill index (intended to represent temperature sensation, not a ‘real’ temperature);T is the air temperature in degrees Celsius (°C), and V is the wind speed at 10 metres (standard anemometer height), in kilometres per hour (km/h).
Winter hazards:property damage
e.g. State Farm Insurance paid out $4M in house freeze-up claims for week of January 16-23, 1994 in Ontario.
•Freeze-thaw damage to roads, bridges,buildings*, etc.
•Salt damage to vehicles/ environment
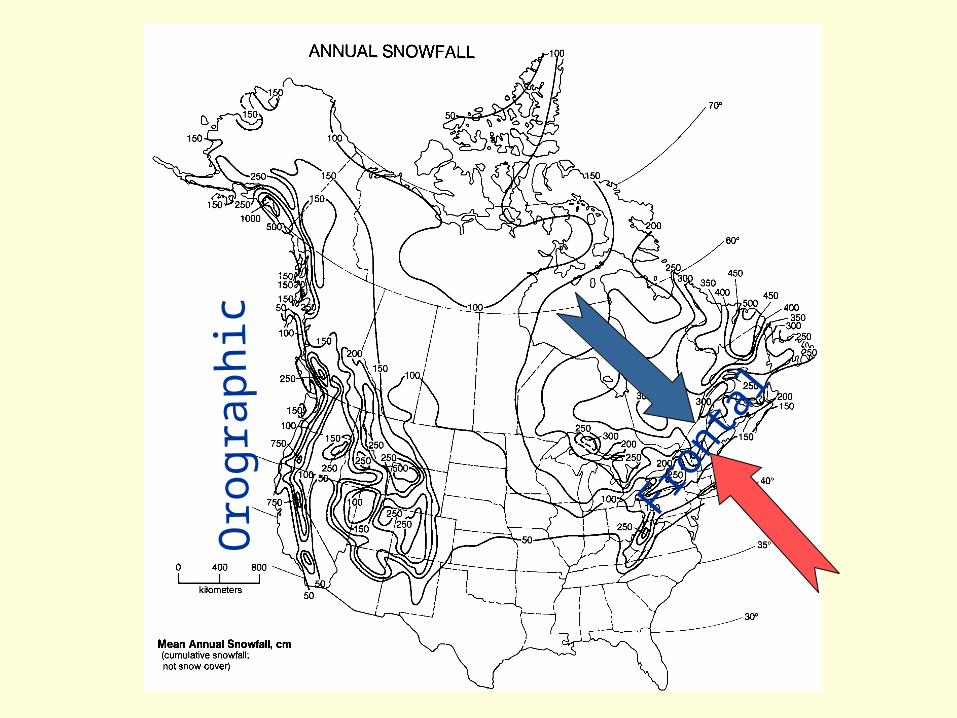
Orog
raph
ic
Fronta
l
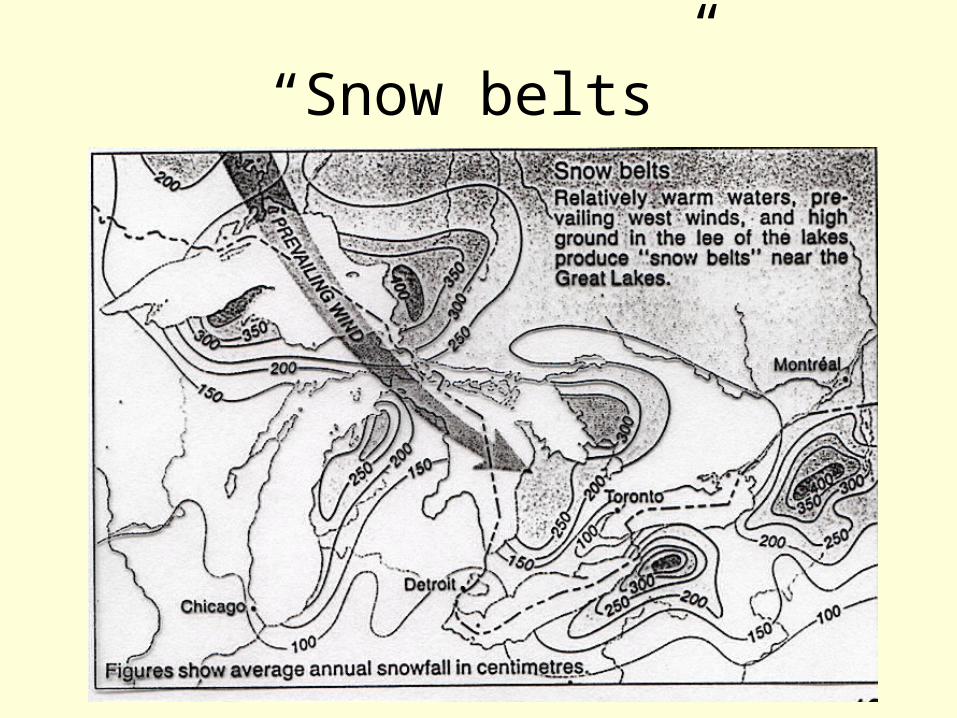
“Snow belts”
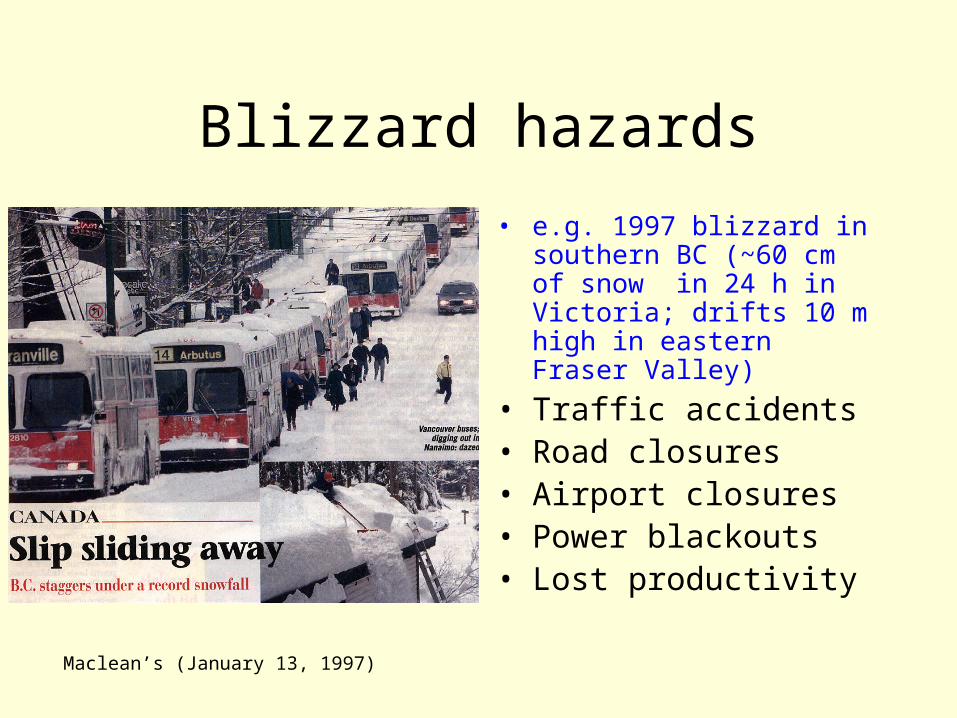
Blizzard hazards• e.g. 1997 blizzard in
southern BC (~60 cm of snow in 24 h in Victoria; drifts 10 m high in eastern Fraser Valley)
• Traffic accidents• Road closures• Airport closures• Power blackouts• Lost productivity
Maclean’s (January 13, 1997)
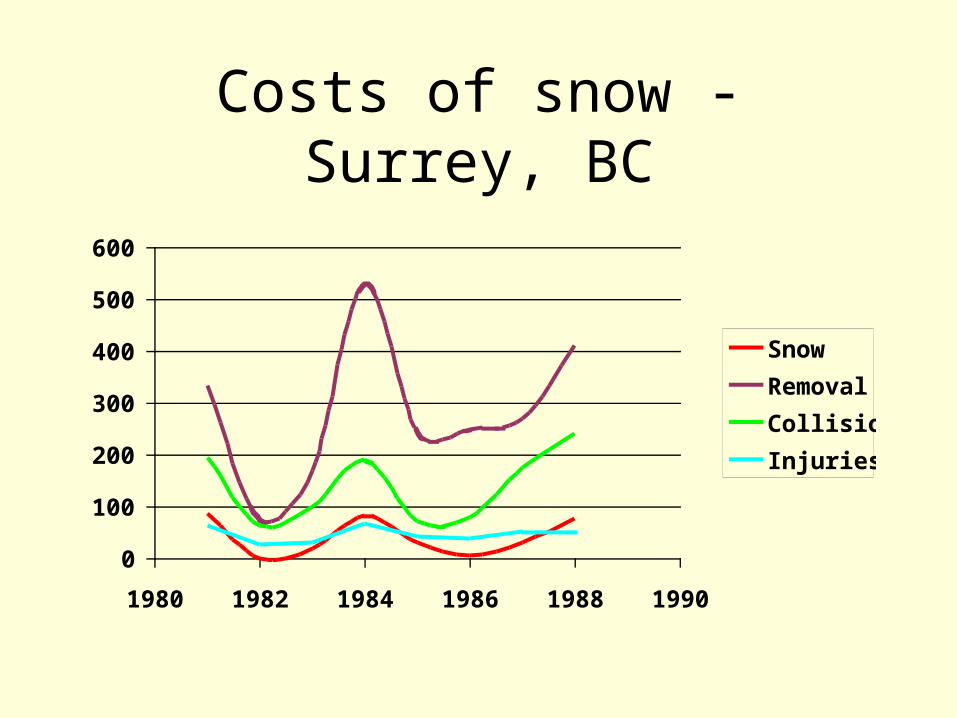
Costs of snow - Surrey, BC
0
100
200
300
400
500
600
1980 1982 1984 1986 1988 1990
SnowRemovalCollisionsInjuries
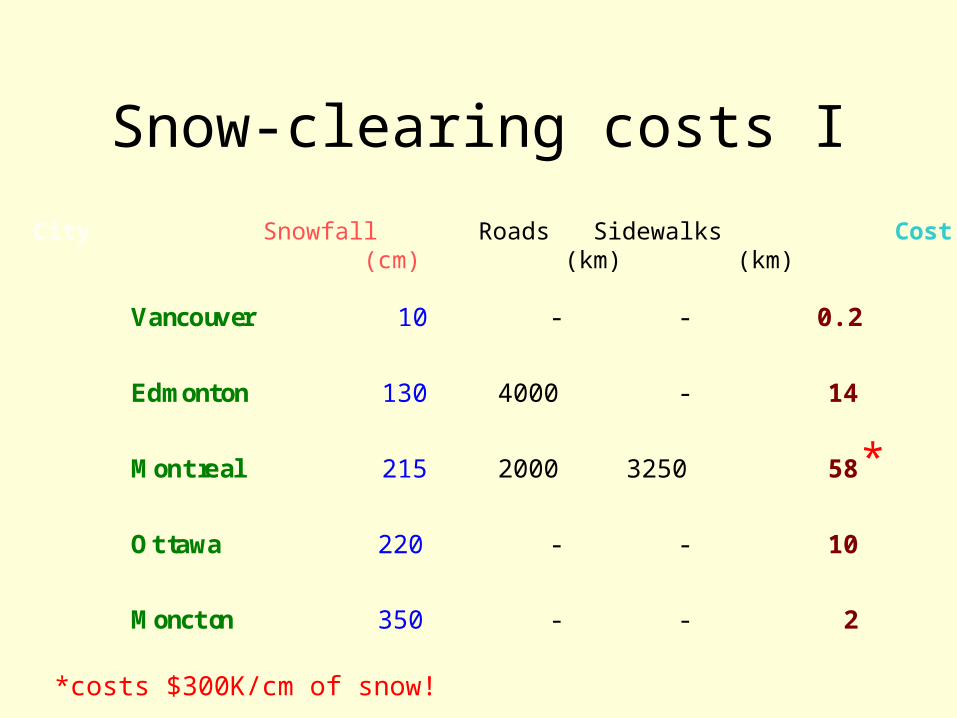
Snow-clearing costs ICity Snowfall Roads Sidewalks Cost ($M) (cm) (km) (km) 1993
*costs $300K/cm of snow!
Vancouver 10 - - 0.2
Edmonton 130 4000 - 14
Montreal 215 2000 3250 58
Ottawa 220 - - 10
Moncton 350 - - 2
*
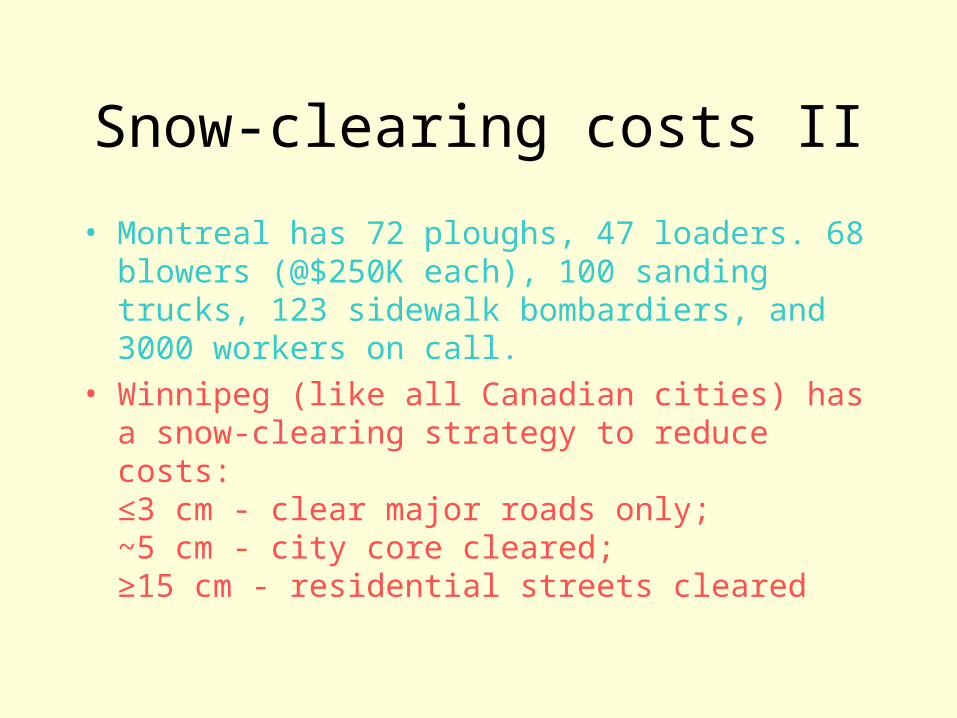
Snow-clearing costs II• Montreal has 72 ploughs, 47 loaders. 68
blowers (@$250K each), 100 sanding trucks, 123 sidewalk bombardiers, and 3000 workers on call.
• Winnipeg (like all Canadian cities) has a snow-clearing strategy to reduce costs:≤3 cm - clear major roads only;~5 cm - city core cleared;≥15 cm - residential streets cleared
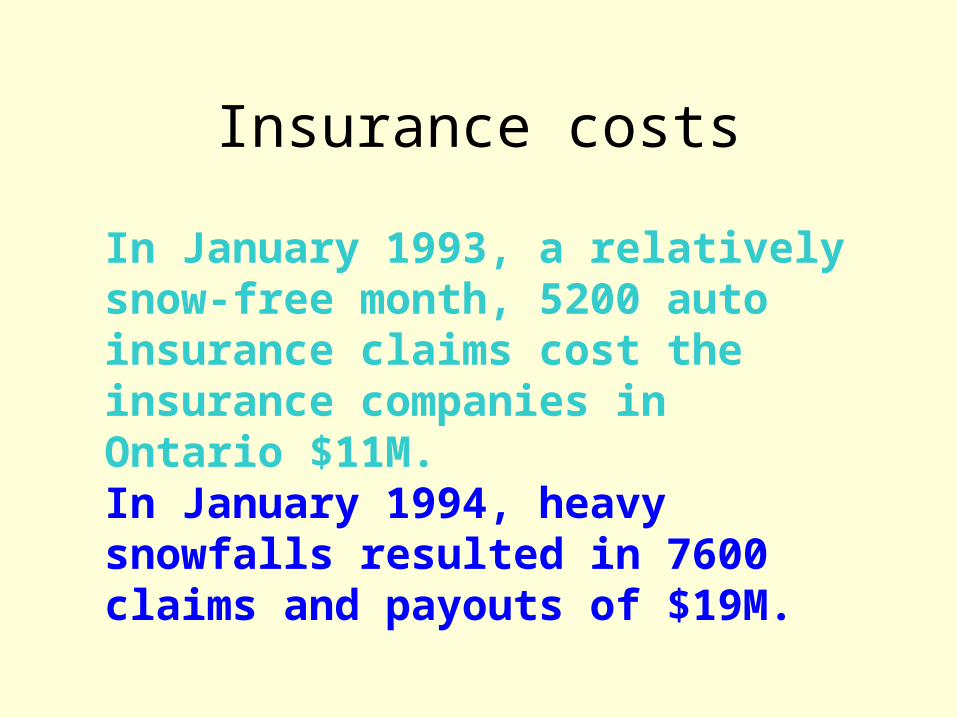
Insurance costsIn January 1993, a relatively snow-free month, 5200 auto insurance claims cost the insurance companies in Ontario $11M.In January 1994, heavy snowfalls resulted in 7600 claims and payouts of $19M.
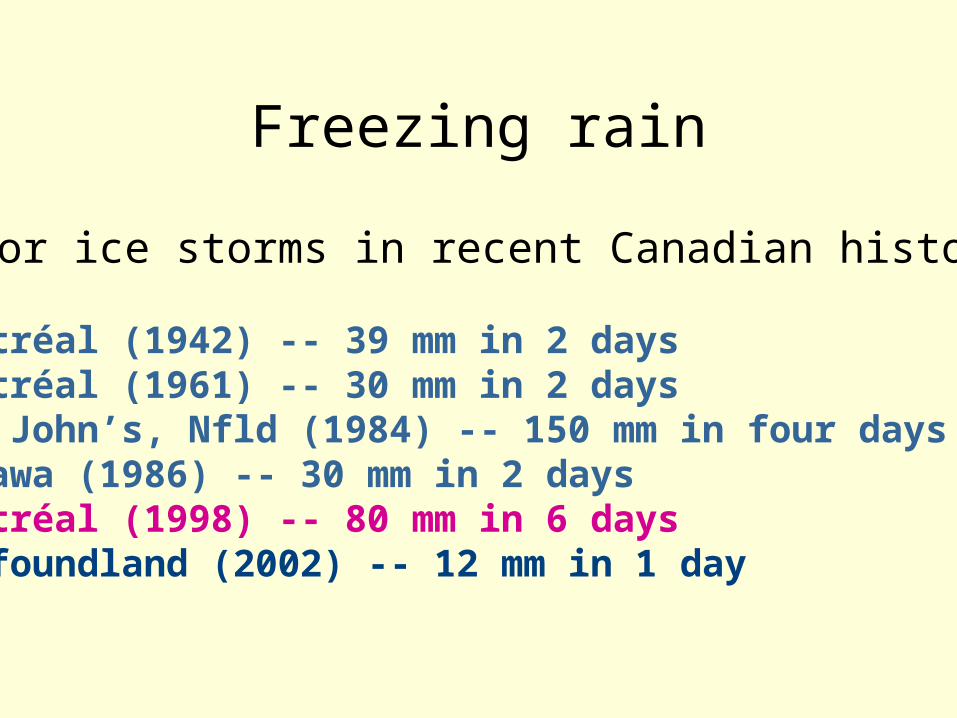
Freezing rainMajor ice storms in recent Canadian history:
Montréal (1942) -- 39 mm in 2 daysMontréal (1961) -- 30 mm in 2 daysSt. John’s, Nfld (1984) -- 150 mm in four daysOttawa (1986) -- 30 mm in 2 daysMontréal (1998) -- 80 mm in 6 daysNewfoundland (2002) -- 12 mm in 1 day
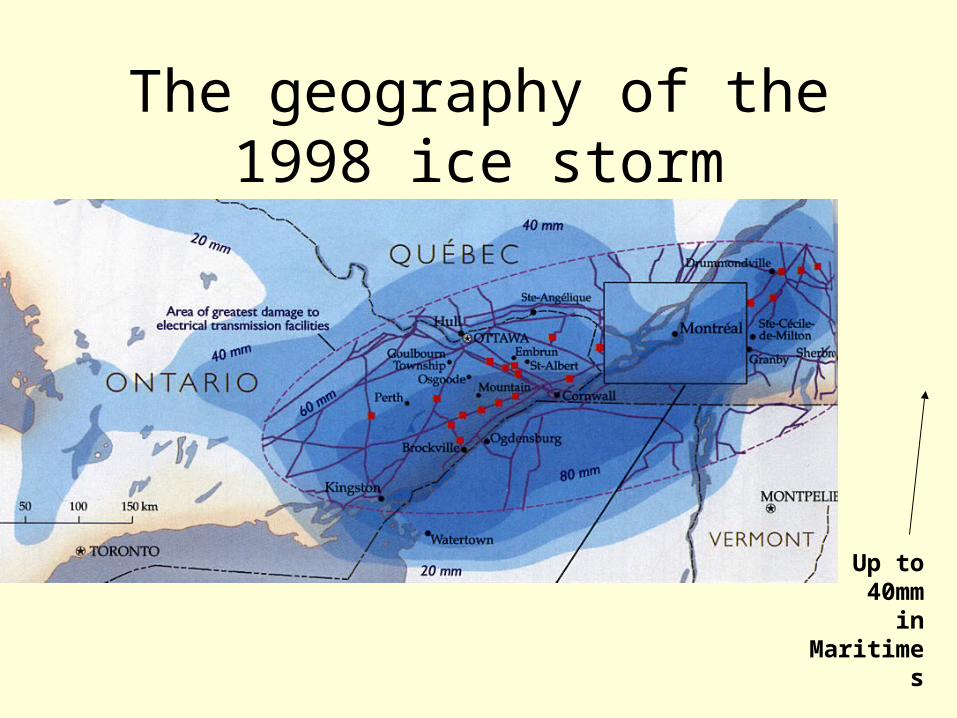
The geography of the 1998 ice storm
Up to 40mm
in Maritim
es
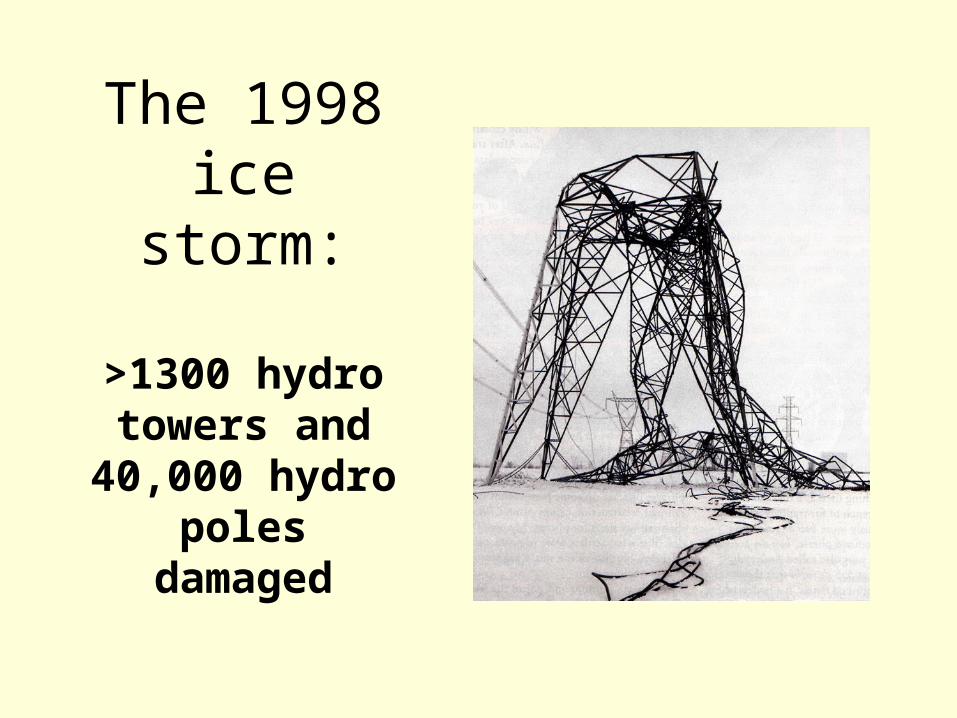
The 1998 ice storm:
>1300 hydro towers and
40,000 hydro poles
damaged
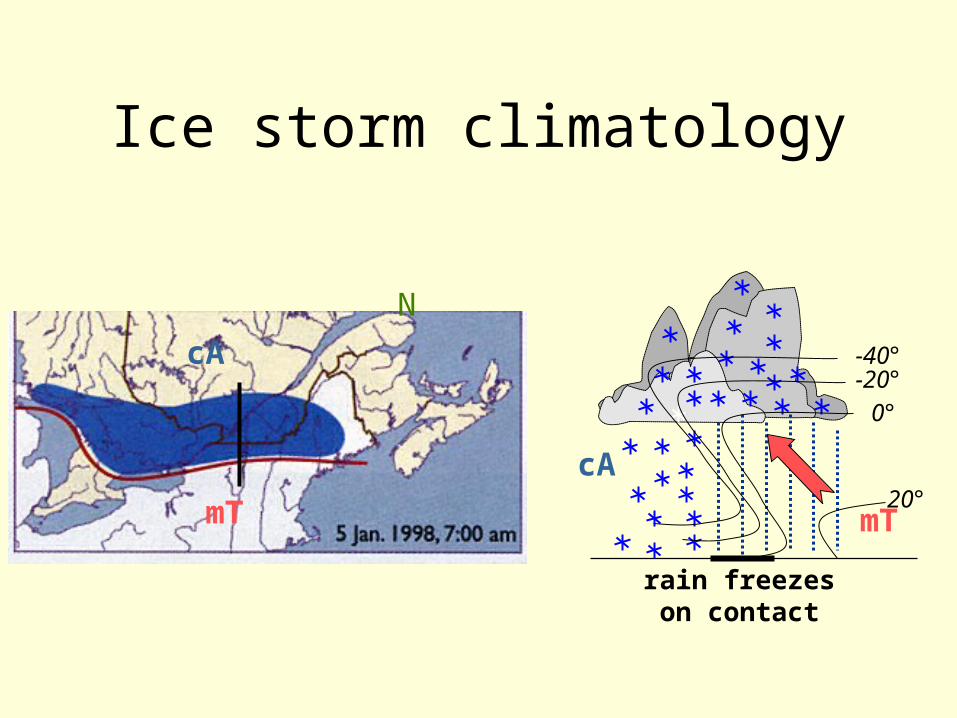
Ice storm climatology
mTcA
rain freezeson contact
N S
-20°0°
20°
-40°
mT
cA
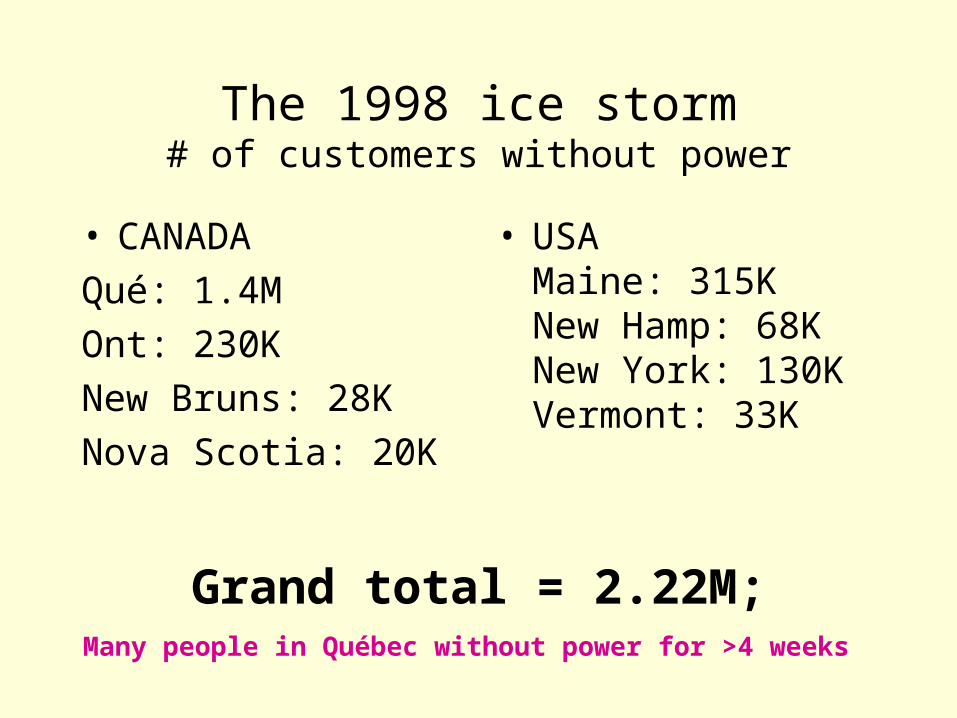
The 1998 ice storm# of customers without power
• CANADAQué: 1.4MOnt: 230K New Bruns: 28KNova Scotia: 20K
• USAMaine: 315KNew Hamp: 68KNew York: 130KVermont: 33K
Grand total = 2.22M;Many people in Québec without power for >4 weeks
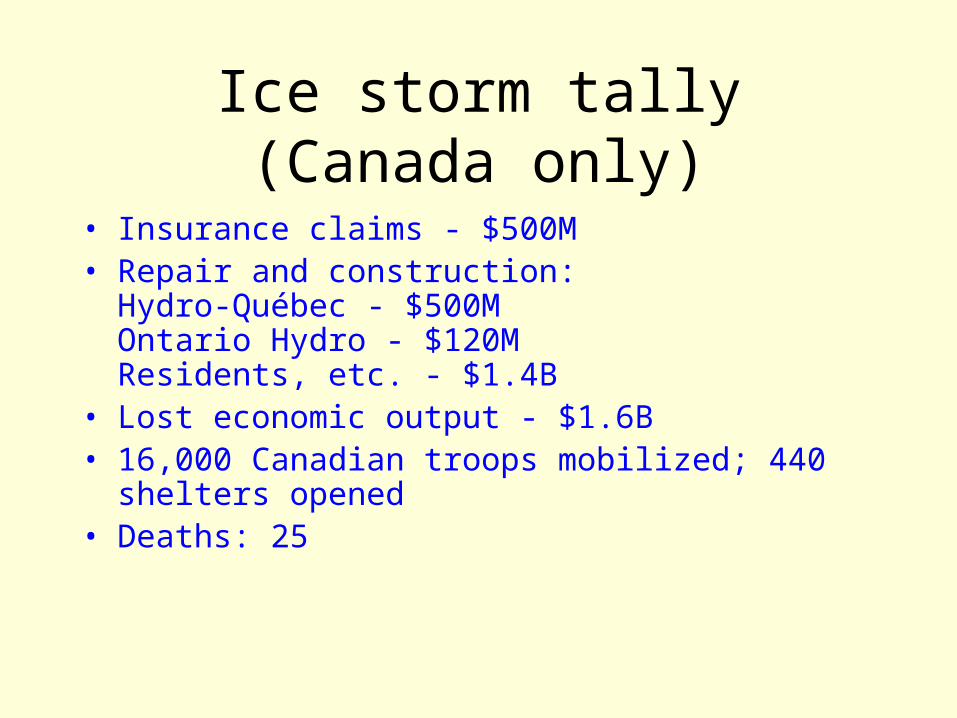
Ice storm tally (Canada only)
• Insurance claims - $500M• Repair and construction:
Hydro-Québec - $500MOntario Hydro - $120MResidents, etc. - $1.4B
• Lost economic output - $1.6B• 16,000 Canadian troops mobilized; 440
shelters opened• Deaths: 25