Embed Size (px)
Citation preview
NADAguidesMarket InsightsPowersports Industry
2016 Q1
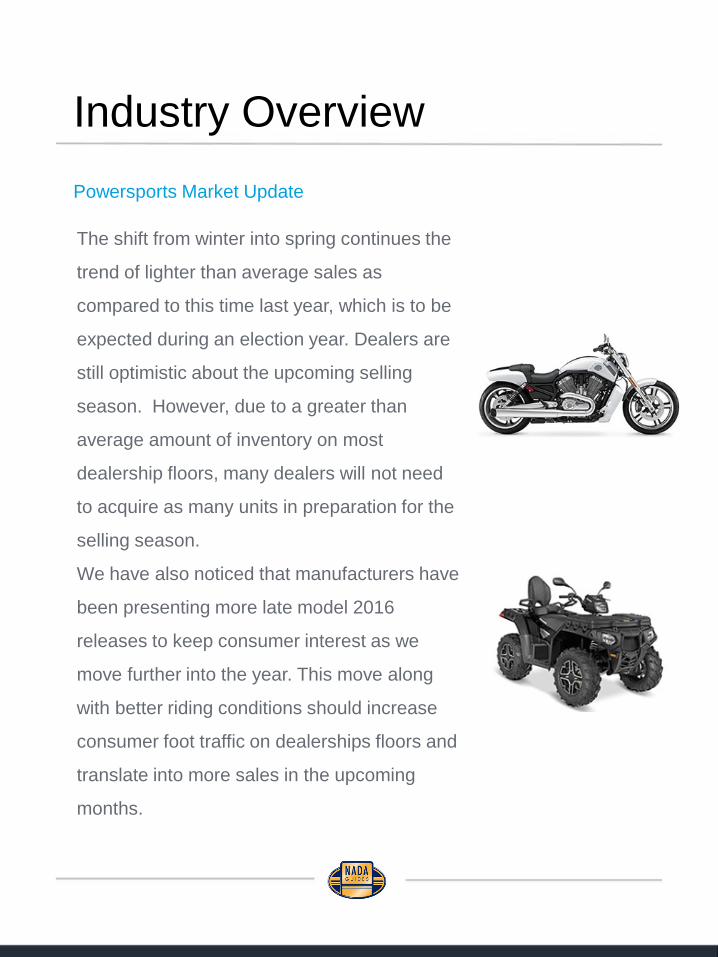
Industry OverviewPowersports Market Update
The shift from winter into spring continues the
trend of lighter than average sales as
compared to this time last year, which is to be
expected during an election year. Dealers are
still optimistic about the upcoming selling
season. However, due to a greater than
average amount of inventory on most
dealership floors, many dealers will not need
to acquire as many units in preparation for the
selling season.
We have also noticed that manufacturers have
been presenting more late model 2016
releases to keep consumer interest as we
move further into the year. This move along
with better riding conditions should increase
consumer foot traffic on dealerships floors and
translate into more sales in the upcoming
months.
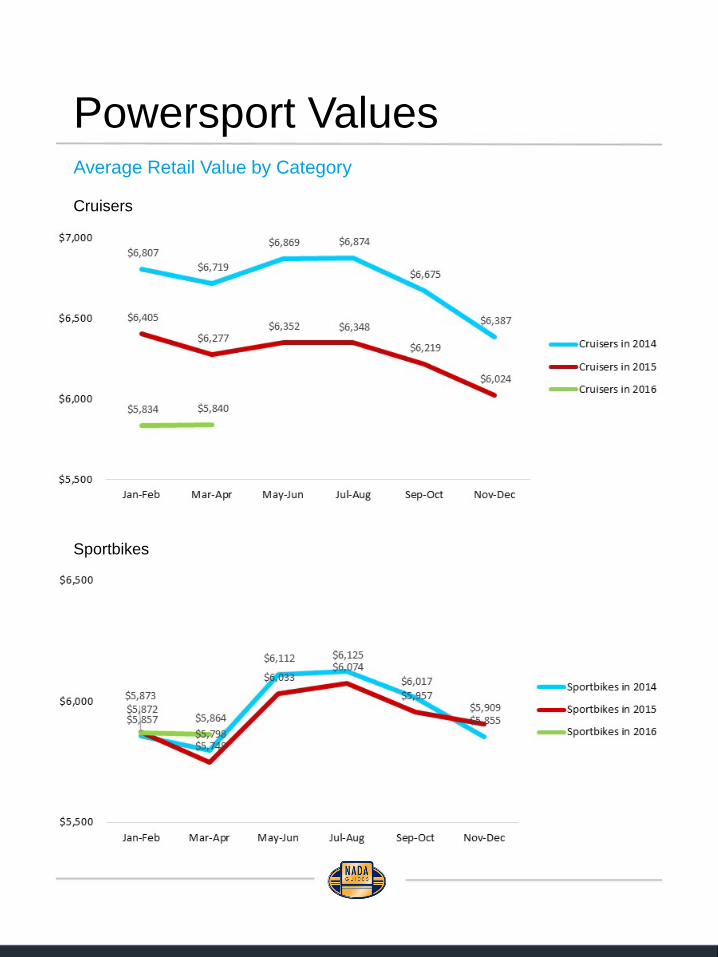
Powersport ValuesAverage Retail Value by Category
Cruisers
Sportbikes
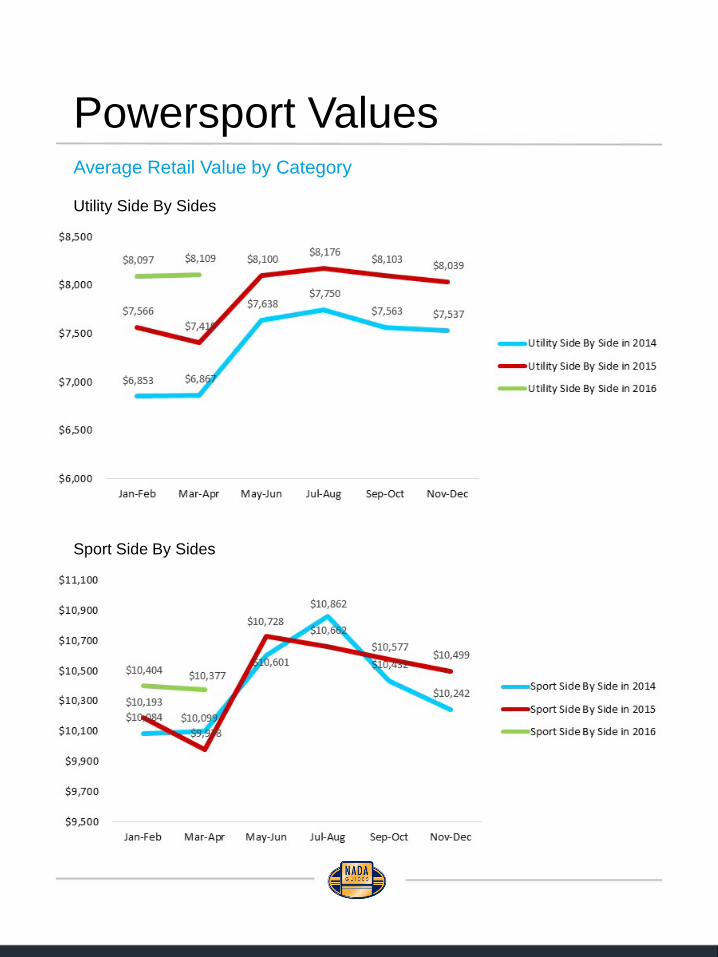
Powersport ValuesAverage Retail Value by Category
Utility Side By Sides
Sport Side By Sides
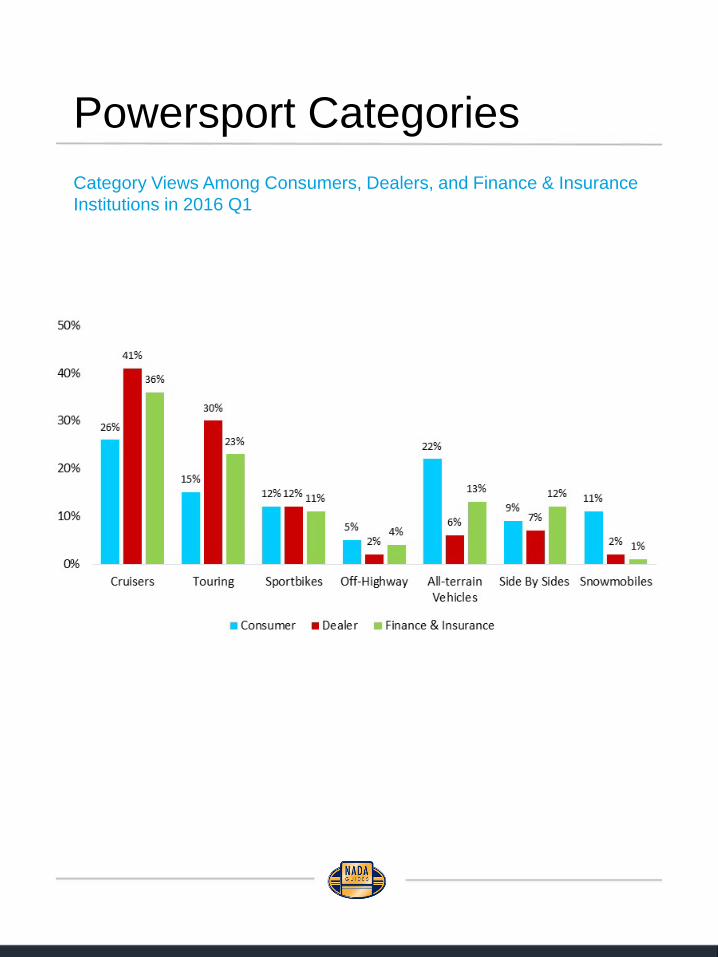
Powersport CategoriesCategory Views Among Consumers, Dealers, and Finance & Insurance Institutions in 2016 Q1
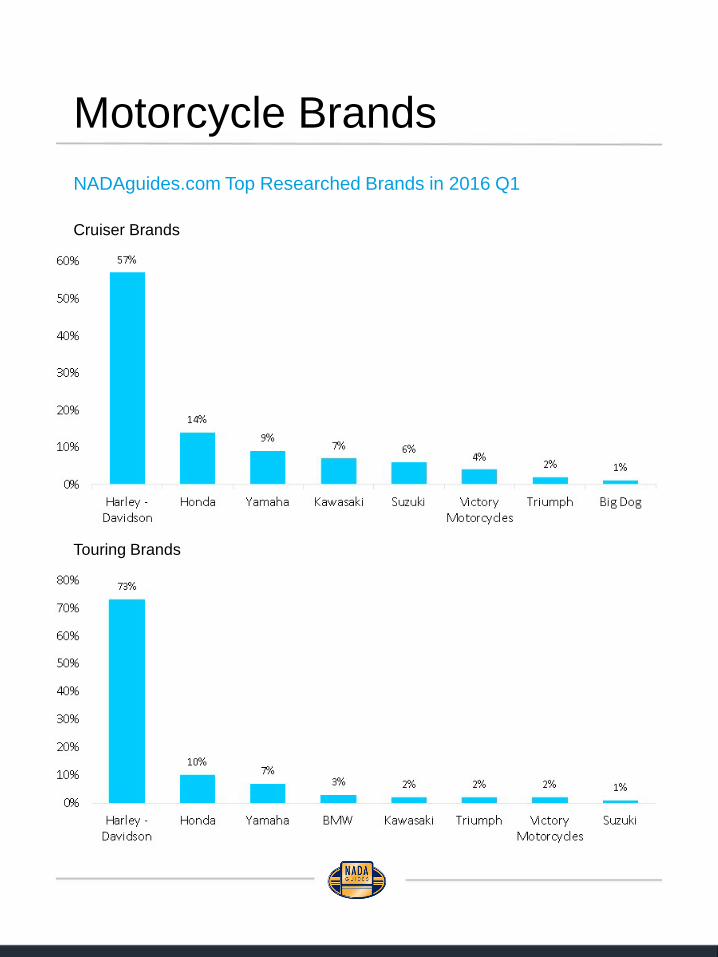
Motorcycle BrandsNADAguides.com Top Researched Brands in 2016 Q1
Cruiser Brands
Touring Brands
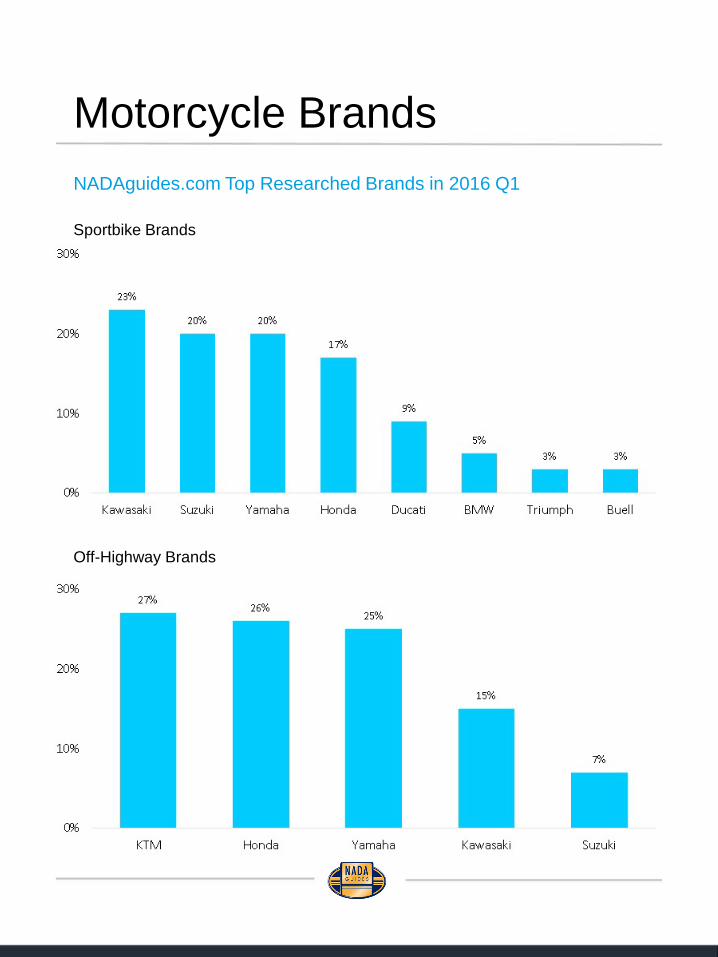
Motorcycle BrandsNADAguides.com Top Researched Brands in 2016 Q1
Sportbike Brands
Off-Highway Brands
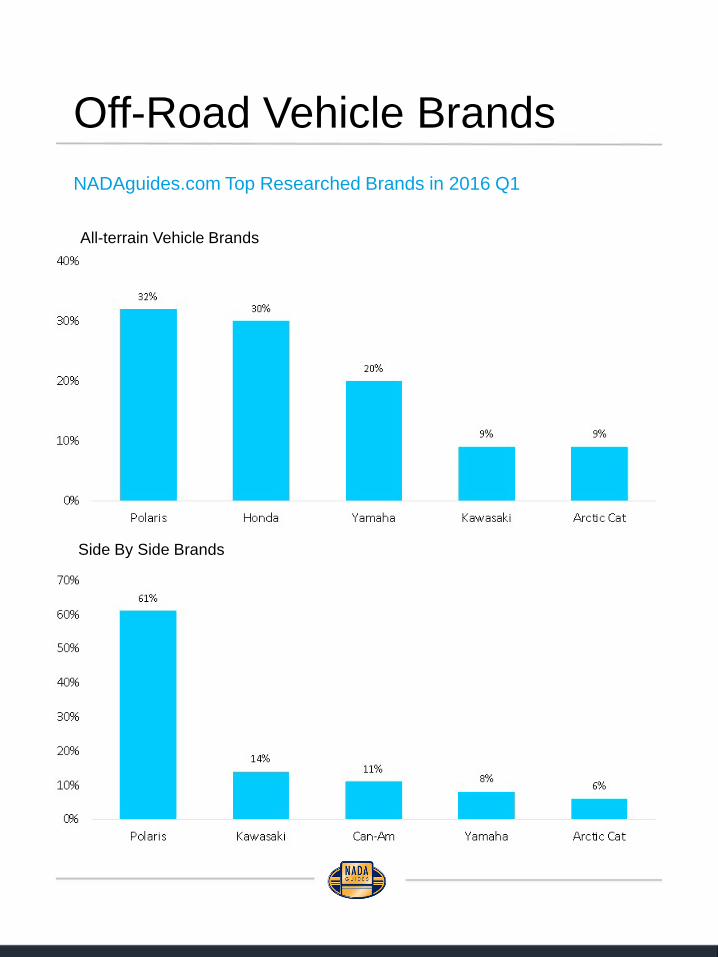
Off-Road Vehicle BrandsNADAguides.com Top Researched Brands in 2016 Q1
All-terrain Vehicle Brands
Side By Side Brands
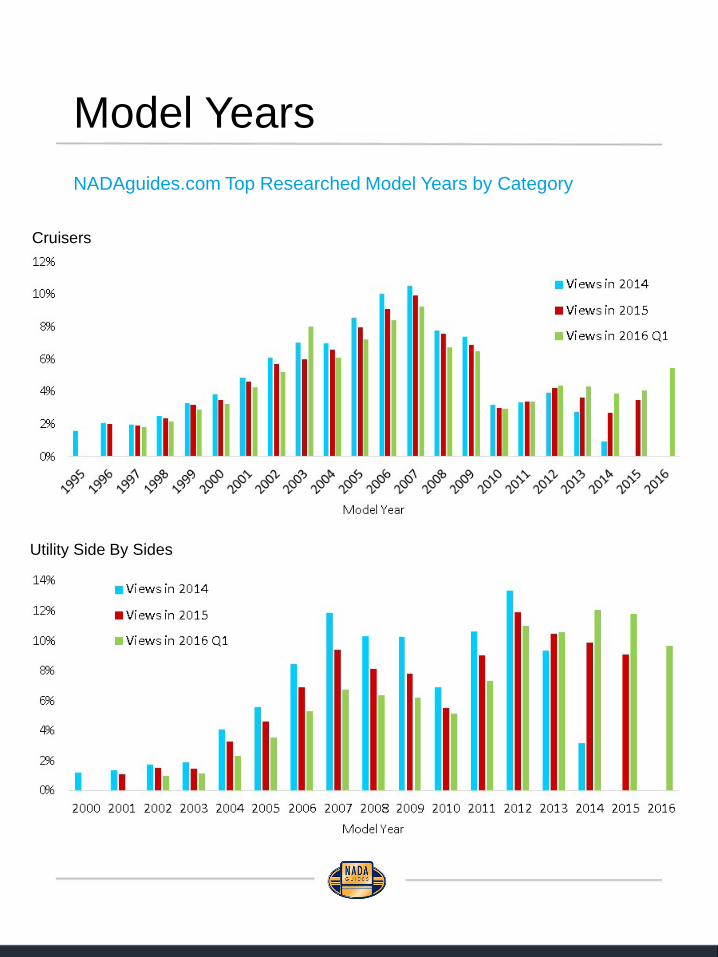
Model YearsNADAguides.com Top Researched Model Years by Category
Cruisers
Utility Side By Sides
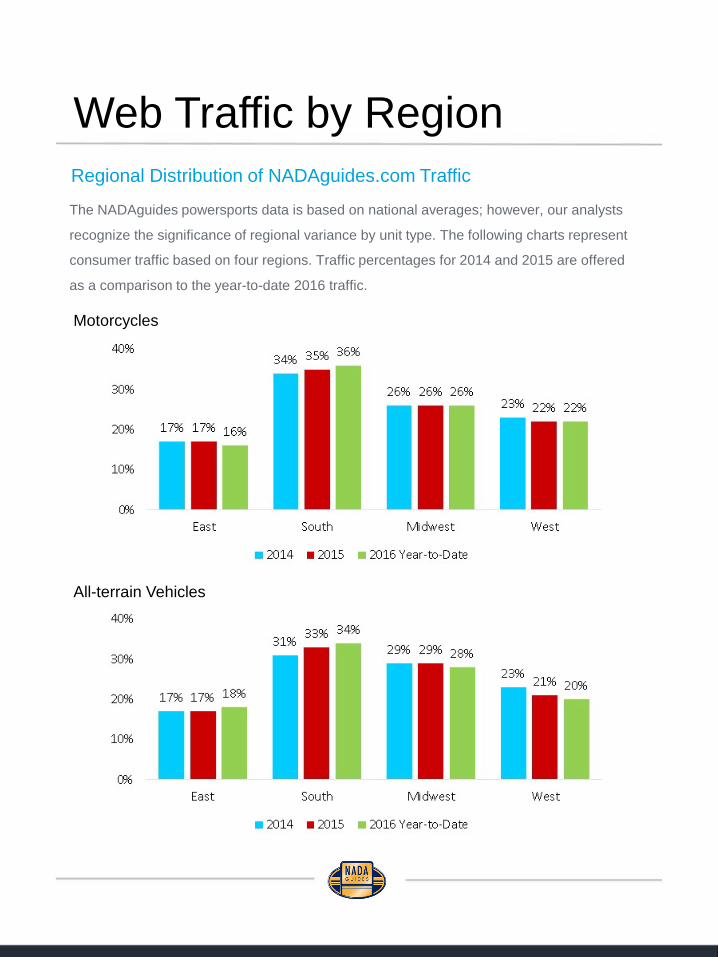
Web Traffic by RegionRegional Distribution of NADAguides.com Traffic
Motorcycles
All-terrain Vehicles
The NADAguides powersports data is based on national averages; however, our analysts
recognize the significance of regional variance by unit type. The following charts represent
consumer traffic based on four regions. Traffic percentages for 2014 and 2015 are offered
as a comparison to the year-to-date 2016 traffic.
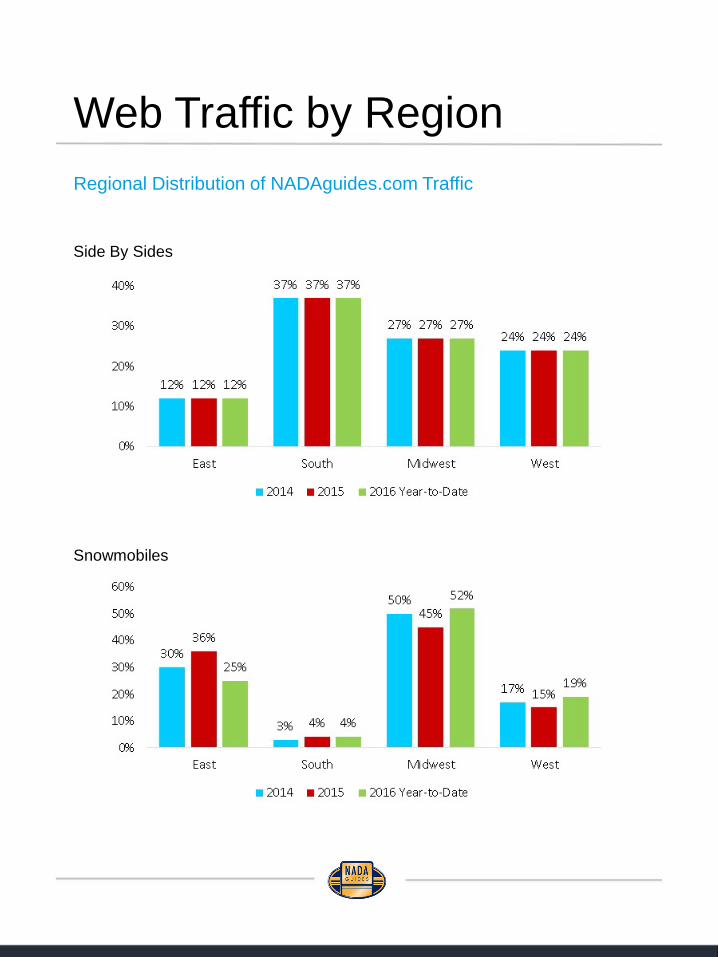
Web Traffic by RegionRegional Distribution of NADAguides.com Traffic
Side By Sides
Snowmobiles
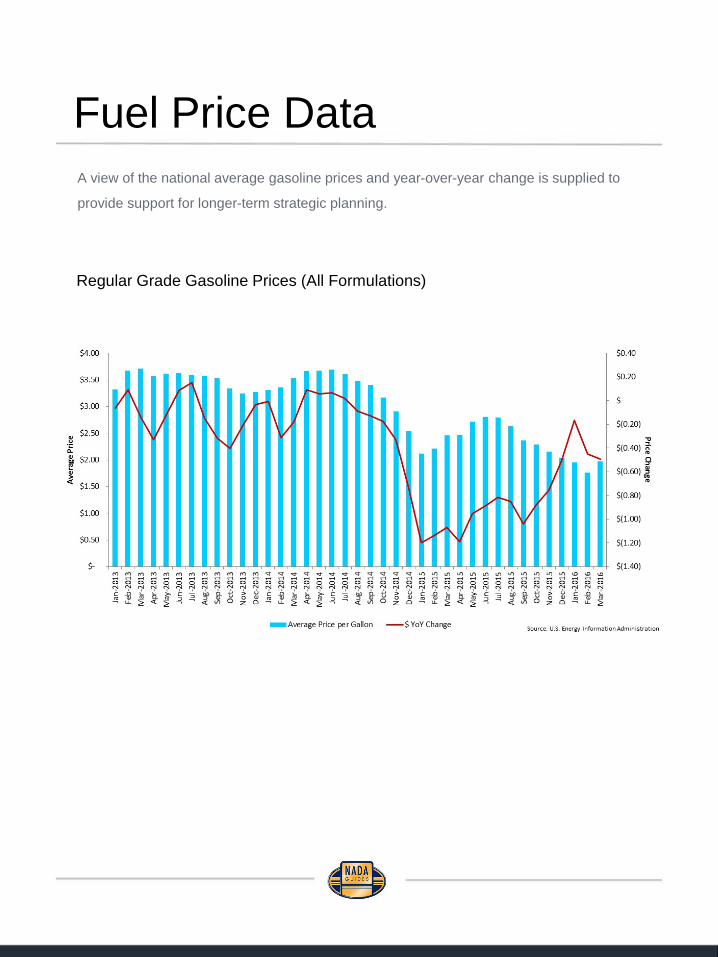
Fuel Price DataA view of the national average gasoline prices and year-over-year change is supplied to
provide support for longer-term strategic planning.
Regular Grade Gasoline Prices (All Formulations)
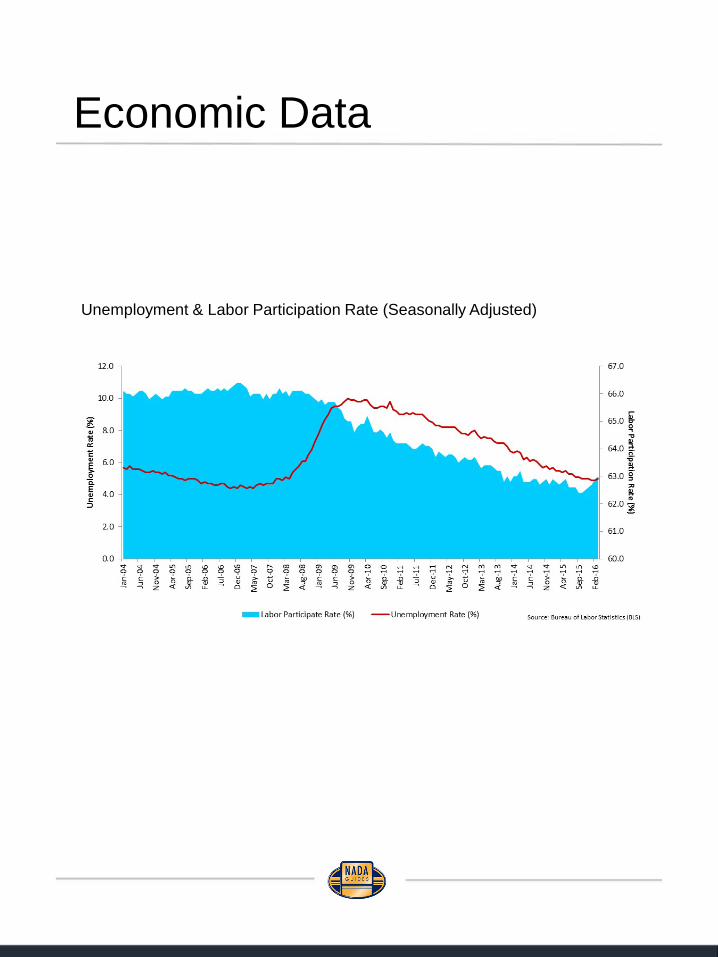
Economic Data
Unemployment & Labor Participation Rate (Seasonally Adjusted)

NADAguides
Disclaimer
About NADAguides.com
National Appraisal Guides, Inc. makes no representations about future performance or
results based on the data and the contents available in this report (“Market Insights”).
Market Insights is provided for informational purposes only and is provided AS IS without
warranty or guarantee of any kind. By accessing Market Insights via email or the
NADAguides website, you agree not to reprint, reproduce, or distribute Market Insights
without the express written permission of National Appraisal Guides, Inc.
NADAguides.com, the largest publisher of the most market-reflective vehicle pricing and
information available for new and used cars, classic cars, motorcycles, boats, RVs and
manufactured homes, offers in-depth shopping and research tools including a broad range
of data, products and service and informational articles as well as tips and advice.
NADAguides.com also produces electronic products, mobile applications, raw data, web
services, web-syndicated products and print guidebooks. NADAguides.com is operated by
National Appraisal Guides, Inc., a strategic ally of J.D. Power and Associates.
National Appraisal Guides, Inc.
PO Box 7800
Costa Mesa, CA 92628
(800) 966-6232 | (714) 556-8511
Fax (714) 556-8715