Embed Size (px)
Citation preview


C h a p t e r 1
L I N K I N G P E O P L E A N D
E C O S Y S T E M S
C h a p t e r 2
T A K I N G S T O C K O F
E C O S Y S T E M S
C h a p t e r 3
L I V I N G I N E C O S Y S T E M S
C h a p t e r 4
A D O P T I N G A N
E C O S Y S T E M A P P R O A C H
WORLD RESOURCES 2000-2001
PA R T IR E T H I N K I N G
T H E L I N K
A s p r i n g f l o w i n g o u t o f t h e
g r o u n d a p p e a r s n e w .
W e c a l l i t a s o u r c e
o f f r e s h w a t e r .
Y e t t h e w a t e r i s a n c i e n t ,
h a v i n g c i r c u l a t e d b e t w e e n
e a r t h a n d s k y f o r e o n s .
W e r e l y o n t h e l a n d
t o p u r i f y t h e w a t e r
a s i t m o v e s
t h r o u g h t h i s c y c l e .

Tr y to imagine Earth without ecosystems.Ecosystems are the productive engines of the planet—communi-ties of species that interact with each other and with the physicalsetting they live in. They surround us as forests, grasslands,rivers, coastal and deep-sea waters, islands, mountains—evencities. Each ecosystem represents a solution to a particular chal-lenge to life, worked out over millennia; each encodes the lessonsof survival and efficiency as countless species scramble for sun-light, water, nutrients, and space. Stripped of its ecosystems,Earth would resemble the stark, lifeless images beamed backfrom Mars by NASA cameras in 1997.
That image also underscores the difficulty of recreating thenatural life-support systems that ecosystems provide, should wedamage them beyond their capacity to rebound. The world’s fer-tile soils, for instance, are a gift of millions of years of organic andinorganic processes. Technology can replicate the nutrients soilsprovide for crops and native flora, but on a global scale the costswould be prohibitive.
WORLD RESOURCES
2000-2001
3
L I N K I N G P E O P L E A N D
E C O S Y S T E M S
C H A P T E R 1

The fact is, we are utterly dependent on ecosystems to sus-tain us. From the water we drink to the food we eat, from thesea that gives up its wealth of products, to the land on whichwe build our homes, ecosystems yield goods and services thatwe can’t do without. Ecosystems make the Earth habitable:purifying air and water, maintaining biodiversity, decom-posing and recycling nutrients, and providing myriad othercritical functions.
Harvesting the bounty of ecosystems roots our econ-omies and provides us employment, particularly in low- andmiddle-income countries. Agriculture, forestry, and fishingare responsible for one of every two jobs worldwide andseven of ten jobs in sub-Saharan Africa, East Asia, and thePacific. In a quarter of the world’s nations, crops, timber,and fish still contribute more to the economy than indus-trial goods (World Bank 1999b:28–31, 192–195). Global agri-culture alone produces US$1.3 trillion in food and fibereach year (Wood et al. [PAGE] 2000).
Ecosystems feed our souls as well, providing places forreligious expression, aesthetic enjoyment, and recreation.In every respect, human development and human securityare closely linked to the productivity of ecosystems. Ourfuture rests squarely on their continued viability.
If our life on Earth is unimaginable without ecosystems,then we need to know how to live better within them. Theworld is large, nature is resilient, and humans have beenaltering the landscape for tens of thousands of years, all ofwhich makes it easy to ignore warning signs that humanactivities might be damaging the capacity of an ecosystem tocontinue to deliver goods and services.
In fact, many nations and societies have completelyaltered the landscape, converting wetlands, prairies, andforests to other uses, and continue to prosper. What wasonce 200 Mha of tallgrass prairie in the heartland of theUnited States has been converted almost entirely to crop-land and urban areas. The once-extensive forests of Europehave suffered much the same fate. These conversions havebrought obvious benefits, such as stable food supplies andindustrial production, that have made the United States andsome European nations economic powerhouses. But theyalso impose costs—eroded topsoil, polluted wells and water-ways, reduced fish yields, and lost wildlands and scenicplaces—that threaten to erode the wealth and quality of lifethese nations enjoy.
We don’t have to look far to see how high the costs ofdegrading ecosystems can be. The rich waters of the BlackSea used to yield more than 700,000 tons of anchovy, stur-geon, bonito, and other valuable fish annually. But over thelast 30 years, human pressures have radically altered theBlack Sea ecology. Beginning in the 1970s, increasing pollu-tion brought on frequent algal blooms. A rapid rise in fish-ing in the 1980s depleted key fish stocks. In 1982, the finalblow came with the accidental introduction of a jellyfish-likecreature, a ctenophore, that soon dominated the aquatic
I n e v e r y r e s p e c t , h u m a n
d e v e l o p m e n t a n d h u m a n
s e c u r i t y a r e c l o s e l y
l i n k e d t o t h e
p r o d u c t i v i t y o f
e c o s y s t e m s .
O u r f u t u r e
r e s t s s q u a r e l y
o n t h e i r c o n t i n u e d
v i a b i l i t y .
4W O R L D R E S O U R C E S 2 0 0 0 – 2 0 0 1

food web, directly competing with native fish for food. By1992, the Black Sea fish catch had collapsed to one-third ofits former volume (Prodanov et al. 1997:1–2). Now most fish-ers from the six nations surrounding the sea bring up nearlyempty nets, and the once prominent fishing industry hem-orrhages jobs and profits (Travis 1993:262–263).
Ecosystem degradation showed a different face to theChinese living alongside the Yangtze River in 1998. Inprior years, loggers had cut forests in the river’s vastwatershed, while farmers and urban developers drainedlakes and wetlands and occupied the river’s f lood plains.In the meantime, little heed to soil conservation allowed2.4 billion metric tons of earth to wash downstream eachyear, silting lakes and further reducing the buffers thatformerly absorbed f loodwaters (Koskela et al. 1999:342).When record rains fell in the Yangtze basin in the summerof 1998, these degrading practices amplified the f looding,which left 3,600 people dead, 14 million homeless, and$36 billion in economic losses (NOAA 1998; World Bank1999a). The Chinese government is now trying to restorethe ecosystem’s natural f lood-control services, but itcould take decades and billions of dollars to reforestdenuded slopes and reclaim wetlands, lakes, and f loodplains.
How V iab l e Are Earth ’ s Ecosystems?
In spite of the costs of degrading ecosystems and ourdependence on their productivity, we know surpris-ingly little about the overall state of Earth’s ecosys-tems or their capacity to provide for the future. We
need to know: How viable are Earth’s ecosystems today?How best can we manage ecosystems so that they remainhealthy and productive in the face of increasing humandemands?
This special millennial edition of the World ResourcesReport, World Resources 2000–2001, tries to answer thesequestions, focusing on ecosystems as the biologicalunderpinning of the global economy and human well-being. It considers both predominantly natural ecosys-tems like forests and grasslands as well as human-con-structed ecosystems like croplands, orchards, or otheragroecosystems. Both ecosystem types are capable of pro-ducing an array of benefits, and both are crucial to humansurvival.
This chapter examines how people rely on ecosystemsand surveys the factors that drive how people use, and oftendegrade, ecosystems. Chapter 2 assesses the current state ofglobal ecosystems, presenting the results of a major newanalysis of ecosystem conditions and pressures undertakenby World Resources Institute, the International Food PolicyResearch Institute, and many other collaborators. In Chap-
ter 3, case studies illustrate trade-offs involved in managingecosystems and ways that some communities responded astheir local ecosystems declined. Chapter 4 considers thegreater challenge of managing ecosystems in the 21st cen-tury to keep them productive and vital, even as our popula-tion and consumption grow.
All these chapters focus on the goods and services thatecosystems yield as fundamental measures of ecosystemhealth. This “goods and services” approach emphasizeshow we depend on ecosystems on a daily basis.
Los ing the L i nk?
It is easy to lose touch with our link to ecosystems,despite their importance. For the millions of uswho depend directly on forests or fisheries for oursurvival, the vital importance of ecosystems is a
fact of daily life. But for the millions of us who live incities or suburbs and have transitioned from working thesoil to working at computer keyboards, our link to ecosys-tems is less direct. We buy our food and clothing in storesand depend on technology to deliver water and energy. Wetake for granted that there will be food in the market, thattransportation and housing will be available, and all atreasonable cost. Too often, we’re only reminded of ourlink to natural systems when a fishery collapses, a reser-voir goes dry, or air pollution begins to make us sick—when the f low of goods and services is disrupted. Then wesuddenly become aware of the real value of theseresources and the potential economic and biological costsof mismanagement.
Unfortunately, mismanagement of ecosystems abounds.Worldwide, human overuse and abuse of major ecosystemsfrom rainforests to coral reefs to prairie grasslands havedegraded or destroyed hectare upon hectare of once-produc-tive habitat. This has harmed wildlife, to be sure, as thenumber of endangered species attests. But it has alsoharmed human interests by depleting the flow of the verygoods and services we depend on.
Decline in the productive capacity of ecosystems canhave devastating human costs. Too often, the poor are firstand most directly affected by the degradation of ecosystems.Impoverished people are generally the most dependent onecosystems for subsistence and cash, but usually exert theleast control over how ecosystems are used or who reaps thebenefits of that use.
In many areas, declining agricultural productivity,diminished supplies of freshwater, reduced timber yields,and declining fish harvests have already taken a significanttoll on local economies.
5C h a p t e r 1 : L i n k i n g P e o p l e a n d E c o s y s t e m s
(continues on p. 10)

6W O R L D R E S O U R C E S 2 0 0 0 – 2 0 0 1
Many of the challenges we face today—defor-estation, soil erosion, desertification, saliniza-tion, and loss of biodiversity—were problems
even in ancient times. What is different now is the scale,speed, and long-term nature of modern civilization’schallenges to Earth’s ecosystems. Before the industrialrevolution, environmental degradation was much more
gradual—occurring over hundreds or thousands ofyears—and relatively localized. The cumulative actionsof rapidly growing and industrializing societies, however,have given rise to more complex problems. Acid rain,greenhouse gas emissions, ozone depletion, toxic waste,and large-scale industrial accidents are examples ofsuch problems with global or regional consequences.
Box 1.1 H i s to r y o f U s e a n d A b u s e
7000 BC–1800 BC
2600 BC–present
2500 BC–900
800 BC–200 BC
200 BC–present
50 BC– 450
Mesopotamia/Sumer
Salinization and water-logging of Sumer’sagroecosystem
Lebanon
Overuse andexploitation ofLebanon’s cedarforest
Mayan Empire
Soil erosion, loss ofagroecosystemviability, and watersiltation in CentralAmerica
Greece
Conversion anddeforestation in theMediterranean
China
Desertification alongthe Silk Road
Roman Empire
Desertification andloss of agroecosystemviability in North Africa
Around 7000 BC, people in this region (now, largely, Iraq) began to modify thenatural environment. Lacking adequate rainfall, land had to be irrigated for cul-tivation, and the demand for food increased as the population grew. The irri-gated land became salinized and waterlogged. Records noting “the earthturned white” with salt date back to 2000 BC. By 1800 BC, the agricultural sys-tem—the foundation of Sumerian civilization—collapsed.
At one time, Mount Lebanon was covered with a forest of cedars that werefamous for their beauty and strength. Solomon’s temple was built of cedarfrom this area as were many Phoenician ships. In the third millennium BC,Byblos grew wealthy from its timber trade. The Egyptians used cedar timber forconstruction and used the resin for mummification. The exploitation continuedthrough the centuries. Only four small groves remain today.
Mayans lived in what are now parts of Mexico, Guatemala, Belize, and Hon-duras. The agriculture techniques they used were creative and intensive—clearing hillsides of jungle, terracing fields to contain soil erosion, drainingswamps by digging ditches and using the soil from the ditches to form raisedfields. Eventually too much was demanded of this system. Soil erosion reducedcrop yields, and higher levels of silt in rivers damaged the raised fields.Decreased food production and competition for the remaining resources mayhave led to that civilization’s demise.
In Homeric times, Greece was still largely covered with mixed evergreen anddeciduous forests. Over time the trees were cleared to provide land for agricul-ture, fuel for cooking and heating, and construction materials. Overgrazingprevented regeneration. The olive tree, favored for its economic value, began toflourish in ancient Greece because it grew well on the degraded land.
The fortification of the Great Wall during the Han dynasty gave rise to inten-sive cultivation of farmland in northern and western China and to the growthof a major travel and trade route that came to be known as the Silk Road.Deserts began irreversibly expanding in this area as a result of the demands ofa growing population and gradual climate changes.
The challenge of providing food for the population of Rome and its large stand-ing armies plagued the empire. The North African provinces, once highly pro-ductive granaries, gradually became degraded as Roman demands for grainpushed cultivation onto marginal lands, prone to erosion. Scrub vegetationspread and some intensively cultivated areas became desertified. The irriga-tion systems the Romans used depended on watersheds that have since beendeforested, and now yield less runoff, reducing the chance of restoringproductivity.

7C h a p t e r 1 : L i n k i n g P e o p l e a n d E c o s y s t e m s
Canary Islands
Human and naturalresource exploitation,degradation andextinctions in manyregions
Australia andNew Zealand
Loss of biodiversityand proliferatinginvasive species inisland ecosystems
North America
Conversion, loss ofhabitat, andunrestrained killingof wildlife in NorthAmerica
Germany and Japan
Industrial chemicalpoisoning offreshwater systems
United Statesand Canada
Soil erosion and lossof biodiversity in theUnited States andCanada
Worldwide
Industrial chemicalsdeplete the world’sprotective ozone layer
Originally from North Africa, the Guanches were a people who inhabited theCanary Islands for more than 1,000 years before the Spanish arrived in the1400s. The Spanish enslaved the Guanches, cleared the forests, and built sugarcane plantations. By 1600 the Guanches were dead, victims of Eurasian dis-eases and plantation conditions. As in the Canary Islands, regions in theAmericas, Africa, and Asia where people were forced to grow and export cashcrops such as sugar, tobacco, cotton, rubber, bananas, or palm oil, continue tosuffer from deforestation, soil damage, biodiversity losses, and economicdependency instituted during colonization.
There were no hoofed animals in Australia and New Zealand before Europeansarrived at the end of the 18th century and began importing them. Within 100years there were millions of sheep and cattle. The huge increase in grazing ani-mals killed off many of the native grasses that were not well adapted to inten-sive grazing. Island biodiversity worldwide suffered some of the most dramaticlosses after nonnative plants and animals were introduced. Island flora andfauna had developed in isolation over millennia and thus lacked natural preda-tors. Many island bird species, for example, were flightless and became easyprey for invaders. It is estimated that 90 percent of all bird extinctions occurredon islands.
As land was cleared for settlement and cultivation around the world, animalhabitats of almost every kind were reduced; animals were killed for food, hides,or recreation as commerce spread. In North America, herds of bison, totalingperhaps as many as 50 million, were hunted to near extinction by the end of the19th century. Aquatic as well as terrestrial species became targets of exploita-tion and extincition. In the 19th century, whales were killed in large numbers tosupport industrializing economies in need of whale oil in great quantity, mainlyfor lighting and lubricants. On the northwest coast of North America, whalepopulations were on the verge of extinction by the 20th century.
The industrial revolution had a profound impact on the waters of the world.Rivers that ran through industrial zones, like the Rhine in Germany, or riversthat ran through mining zones, like the Watarase in Japan, became heavily pol-luted in the 19th century. The German chemical industry poisoned the Rhine sobadly that salmon, which had been plentiful as late as 1765, were rare by 1914.Japan’s most important copper mine in the 1800s dumped mine tailings in theWatarase River, and sulfuric acid from smelters contaminated the water andkilled thousands of hectares of forest trees and vegetation. Fish and fowl diedand local residents became sick. The human birth rate dipped below the deathrate in the nearby town of Ashio in the 1890s.
The Great Plains of the United States and Canada were ploughed in the late19th and early 20th centuries and planted with new forms of drought-resistantwheat. Once the protective original grass cover was destroyed, drought in the1930s enabled high, persistent wind storms to blow away much of the dry soil.Soil conservation methods were subsequently introduced such that when winderosion again affected the area in the 1950s and in the 1970s, the consequenceswere less severe.
Chlorofluorocarbons (CFCs) are a family of volatile compounds invented in1928. Thought to be the world’s first nontoxic, nonflammable refrigerants, theiruse grew rapidly. They also were used as industrial solvents, foaming agents,and aerosol propellants. CFC production peaked in 1974, the same yearresearchers noted that CFC emissions could possibily damage human healthand the ozone layer. In 1985, the discovery of an “ozone hole” over the Antarc-tic coincided with a first-ever coordinated international effort to phase out pro-duction of CFCs and other ozone-depleting substances. Worldwide phase outof CFC production is scheduled for 2010.
1400–1600
1800
1800
1800–1900
1900
1928–present
8W O R L D R E S O U R C E S 2 0 0 0 – 2 0 0 1
E c o s y s t e m s s u s t a i n
u s . T h e y a r e
E a r t h ’ s p r i m a r y
p r o d u c e r s , s o l a r -
p o w e r e d f a c t o r i e s
t h a t y i e l d t h e m o s t
b a s i c n e c e s s i t i e s —
f o o d , f i b e r , w a t e r .
E c o s y s t e m s a l s o
p r o v i d e e s s e n t i a l
s e r v i c e s — a i r a n d
w a t e r p u r i f i c a t i o n ,
c l i m a t e c o n t r o l ,
n u t r i e n t c y c l i n g ,
a n d s o i l
p r o d u c t i o n —
s e r v i c e s w e c a n ’ t
r e p l a c e a t a n y
r e a s o n a b l e p r i c e .
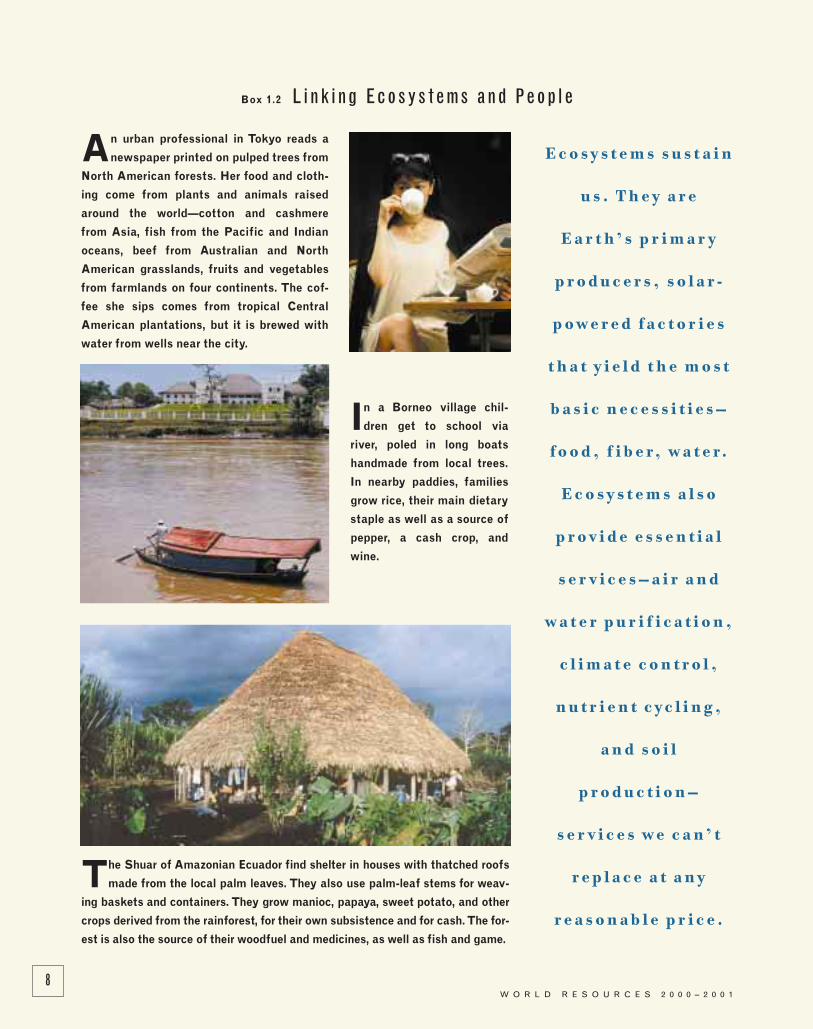
Box 1.2 L i n k i n g E c o s y s te m s a n d Pe o p l e
An urban professional in Tokyo reads a
newspaper printed on pulped trees from
North American forests. Her food and cloth-
ing come from plants and animals raised
around the world—cotton and cashmere
from Asia, fish from the Pacific and Indian
oceans, beef from Australian and North
American grasslands, fruits and vegetables
from farmlands on four continents. The cof-
fee she sips comes from tropical Central
American plantations, but it is brewed with
water from wells near the city.
In a Borneo village chil-
dren get to school via
river, poled in long boats
handmade from local trees.
In nearby paddies, families
grow rice, their main dietary
staple as well as a source of
pepper, a cash crop, and
wine.
The Shuar of Amazonian Ecuador find shelter in houses with thatched roofs
made from the local palm leaves. They also use palm-leaf stems for weav-
ing baskets and containers. They grow manioc, papaya, sweet potato, and other
crops derived from the rainforest, for their own subsistence and for cash. The for-
est is also the source of their woodfuel and medicines, as well as fish and game.
9C h a p t e r 1 : L i n k i n g P e o p l e a n d E c o s y s t e m s
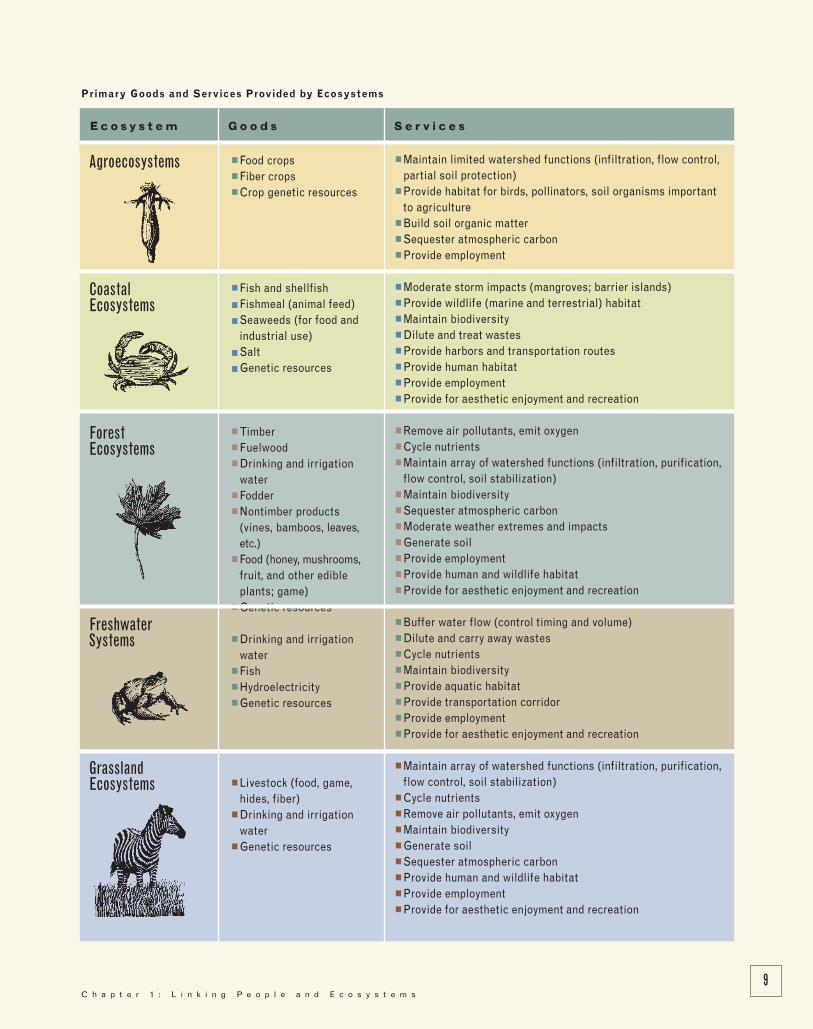
E c o s y s t e m G o o d s S e r v i c e s
■ Food crops■ Fiber crops ■ Crop genetic resources
■ Fish and shellfish■ Fishmeal (animal feed)■ Seaweeds (for food and
industrial use)■ Salt■ Genetic resources
■ Timber■ Fuelwood■ Drinking and irrigation
water■ Fodder■ Nontimber products
(vines, bamboos, leaves,etc.)
■ Food (honey, mushrooms,fruit, and other edibleplants; game)
■ Genetic resources
■ Drinking and irrigationwater
■ Fish■ Hydroelectricity■ Genetic resources
■ Livestock (food, game,hides, fiber)
■ Drinking and irrigationwater
■ Genetic resources
■ Maintain limited watershed functions (infiltration, flow control,partial soil protection)
■ Provide habitat for birds, pollinators, soil organisms importantto agriculture
■ Build soil organic matter■ Sequester atmospheric carbon■ Provide employment
■ Moderate storm impacts (mangroves; barrier islands)■ Provide wildlife (marine and terrestrial) habitat■ Maintain biodiversity■ Dilute and treat wastes■ Provide harbors and transportation routes■ Provide human habitat■ Provide employment■ Provide for aesthetic enjoyment and recreation
■ Remove air pollutants, emit oxygen■ Cycle nutrients■ Maintain array of watershed functions (infiltration, purification,
flow control, soil stabilization)■ Maintain biodiversity■ Sequester atmospheric carbon■ Moderate weather extremes and impacts■ Generate soil■ Provide employment■ Provide human and wildlife habitat■ Provide for aesthetic enjoyment and recreation
■ Buffer water flow (control timing and volume)■ Dilute and carry away wastes■ Cycle nutrients■ Maintain biodiversity■ Provide aquatic habitat■ Provide transportation corridor■ Provide employment ■ Provide for aesthetic enjoyment and recreation
■ Maintain array of watershed functions (infiltration, purification,flow control, soil stabilization)
■ Cycle nutrients■ Remove air pollutants, emit oxygen■ Maintain biodiversity ■ Generate soil■ Sequester atmospheric carbon■ Provide human and wildlife habitat■ Provide employment ■ Provide for aesthetic enjoyment and recreation
Agroecosystems
CoastalEcosystems
ForestEcosystems
FreshwaterSystems
GrasslandEcosystems
Prima ry Goods and Services Provided by Ecosys tems

■ In Canada’s maritime provinces, collapse of the cod fish-ery in the early 1990s left 30,000 fishers dependent ongovernment welfare payments and decimated theeconomies of 700 communities in Newfoundland alone(Milich 1999:628).
■ Urban water shortages in China—greatly aggravated byoverextraction and pollution of nearby rivers andgroundwater sources—cost urban economies an esti-mated US$11.2 billion per year in reduced industrial out-put and afflict nearly half of the nation’s major cities(WRI et al. 1998:120).
■ Commercial cutting of India’s forests and conversion offorests to agriculture have left the traditional system ofvillage management of local forests in shambles. Thishas brought shortages of fuelwood and building materi-als to many of the 275 million rural Indians who draw onlocal forest resources (Gadgil and Guha 1992:113–145,181–214; WCFSD 1999:59).
If this pattern holds, the loss of healthy ecosystems will ulti-mately act as a brake not just on local economies, but onnational and global development as well.
Adopt ing a Human Perspect i ve
A ll organisms have intrinsic value; grasslands,forests, rivers, and other ecosystems do notexist to serve humans alone. Nonetheless,World Resources 2000–2001 deliberately
examines ecosystems, and their management, from ahuman perspective because human use is the primarysource of pressure on ecosystems today, far outstrippingthe natural processes of ecosystem change. In the mod-ern world, virtually every human use of the products andservices of ecosystems translates into an impact on thoseecosystems. Thus, every use becomes either an opportu-nity for enlightened management or an occasion fordegradation.
Responsible use of ecosystems faces fundamental obsta-cles, however. Typically, we don’t even recognize ecosys-tems as cohesive units because they often extend acrosspolitical and management boundaries. We look at them inpieces or concentrate on the specific products they yield.We miss their complexity, the interdependence of theirorganisms—the very qualities that make them productiveand stable.
The challenge for the 21st century, then, is to under-stand the vulnerabilities and resilience of ecosystems, sothat we can find ways to reconcile the demands of humandevelopment with the tolerances of nature. That requires
10W O R L D R E S O U R C E S 2 0 0 0 – 2 0 0 1
A n e c o s y s t e m i s a
c o m m u n i t y o f
i n t e r a c t i n g o r g a n i s m s
a n d t h e p h y s i c a l
e n v i r o n m e n t t h e y l i v e
i n . E v e r y h e c t a r e o f t h e
p l a n e t i s p a r t o f a n
e c o s y s t e m .

learning to look at our activities through the living lens ofecosystems. In the end, it means adopting an ecosystem-oriented approach to managing the environment—anapproach that respects the natural boundaries of ecosys-tems and takes into account their interconnections andfeedbacks.
Sources o f Wea l th and We l l -Be ing
Ecosystems are not just assemblages of species,they are systems combined of organic and inor-ganic matter and natural forces that interactand change. The energy that runs the system
comes from the sun; solar energy is absorbed and turnedinto food by plants and other photosynthesizing organ-isms at the base of food chains. Water is the crucial ele-ment f lowing through the system. The amount of wateravailable, along with the temperature extremes and thesunlight the site receives, largely determine what types ofplants, insects, and animals live there, and how theecosystem is categorized.
Ecosystems are dynamic, constantly remaking them-selves, reacting to natural disturbances and the competitionamong and between species. It is the complex, local interac-tion of the physical environment and the biological commu-nity that gives rise to the particular package of services andproducts that each ecosystem yields; it also is what makeseach ecosystem unique and vulnerable.
Scale also is important. A small bog, a single sand dune, ora tiny patch of forest may be viewed as an ecosystem, uniquein its mix of species and microclimate—a microenvironment.On a much larger scale, an ecosystem refers to more extensivecommunities—a 100 or 1,000 km2 forest, or a major river sys-tem, each having many such microenvironments.
This edition of the World Resources Report examinesecosystems on an even larger scale. It considers five maintypes or categories of ecosystems: grasslands, forests, agroe-cosystems, freshwater systems, and coastal ecosystems.Together, these five major ecosystem types cover most of theEarth’s surface and render the bulk of the goods and ser-vices people derive from ecosystems. Dividing ecosystemsin this way allows us to examine them on a global scale andthink in broad terms about the challenges of managingthem sustainably.
Divisions between ecosystems are less important, how-ever, than the linkages between them. Grasslands give wayto savannas that segue into forests. Freshwater becomesbrackish as it approaches a coastal area. Polar, island,mountain, and even urban ecosystems blend into and add tothe mix. All these systems are tightly knit into a global con-tinuum of energy and nutrients and organisms—the bios-phere in which we live.
D irec t and I nd i rec t Bene f i t s
The benefits that humans derive from ecosystemscan be direct or indirect (Daily 1997:1–10; ESA1997a:1–13). Direct benefits are harvested largelyfrom the plants and animals in an ecosystem in
the form of food and raw materials. These are the mostfamiliar “products” an ecosystem yields—crops, livestock,fish, game, lumber, fuelwood, and fodder. Genetic resourcesthat flow from the biodiversity of the world’s ecosystemsalso provide direct benefits by contributing genes forimproving the yield and disease resistance of crops, and fordeveloping medicines and other products.
Indirect benefits arise from interactions and feedbackamong the organisms living in an ecosystem. Many ofthem take the form of services, like the erosion control andwater purification and storage that plants and soilmicroorganisms provide in a watershed, or the pollinationand seed dispersal that many insects, birds, and mammalsprovide. Other benefits are less tangible, but nonethelesshighly valued: the scenic enjoyment of a sunset, for exam-ple, or the spiritual significance of a sacred mountain orforest grove (Kellert and Wilson 1993). Every year, mil-lions of people make pilgrimages to outdoor holy places,vacation in scenic regions, or simply pause in a park ortheir gardens to ref lect or relax. As the manifestation ofnature, ecosystems are the psychological and spiritualbackdrop for our lives.
Some benefits are global in nature, such as biodiversityor the storage of atmospheric carbon in plants and soils.Others are regional; watershed protection that preventsflooding far downstream is an example. But many ecosys-tem benefits are local, and these are often the most impor-tant, affecting people directly in many aspects of their dailylives. Homes, industries, and farms usually get their watersupplies from local sources, for instance. Jobs associatedwith agriculture and tourism are local benefits as well.Urban and suburban parks, scenic vistas, and the enjoy-ments of backyard trees and wildlife are all local productsthat define our sense of place.
Because so many ecosystem goods and services areenjoyed locally, it follows that local inhabitants often suffermost when these benefits are lost. By the same token, it islocal inhabitants who usually have the greatest incentive topreserve the ecosystems they depend on. In fact, local peo-ple hold enormous potential both for managing ecosystemssustainably and for damaging them through careless use.But local communities rarely exert full control over theecosystems they inhabit; with the market for ecosystemgoods becoming increasingly global, outside economicforces and government policies can overwhelm the bestlocal intentions.
11C h a p t e r 1 : L i n k i n g P e o p l e a n d E c o s y s t e m s
(continues on p. 16)

12W O R L D R E S O U R C E S 2 0 0 0 – 2 0 0 1
Box 1.3 Wate r Fi l t rat i o n a n d P u r i f i c at i o n
At every stage of its journey between earth and sky,water can pick up pollutants and wastes—as itflows from a spring into streams, rivers, and the
sea; as it pools into ponds and lakes; when it returns from theatmosphere as rain; when it soaks back into the soil after useon croplands or as effluent from sewage systems.
Fortunately, ecosystems can cleanse the water for us.
■ Soils are inhabited by microorganisms that consume and recy-cle organic material, human and animal feces, and other poten-tial toxins and pathogens. Deeper rocky layers of an aquifermay continue the cleansing process as water seeps through.
■ Plants and trees hold soil in place as the water filtersthrough. The vegetation interacts with fungi and soil micro-organisms to generate many of soil’s filtering capabilities.
■ Freshwater bodies dilute pollutants where large quantitiesof municipal, agricultural, and industrial waters are drainedor released.
■ Wetlands intercept surface runoff, trap sediments fromfloodwaters, sequester metals, and excel at removing nitro-gen and minerals from the water. A hectare of cattail marshcan consume three times as many nutrients as a hectare ofgrassland or forest (Trust for Public Land 1997:16).
In many places, however, we are straining nature’s abilityto filter and purify water. Where land is stripped of vegetationor overcultivated, rainwater flows downstream—unfiltered—over compacted and crusted soils. We have drained and con-verted half of all wetlands worldwide (Revenga et al. [PAGE]2000), and we add levels of pollutants to watersheds thatoverwhelm their natural purification and dilution capacities.
To an extent, we can replace ecosystems’ natural clean-ing service with wastewater treatment plants, chlorinationand other disinfectant processes, and artificial wetlands.But these options typically are expensive and do not pro-vide the many other benefits supplied by forests and nat-ural wetlands, such as wildlife habitat, open space, andflood protection.
Here are some global and local indicators of our depen-dence on the water filtration and purification services thatecosystems provide. The human and economic costs of try-ing to replace them can be high.
■ Percentage of the world’s population that lacks accessto clean drinking water:28 percent, or as many as 1.7 billion people (UNICEF 2000)
■ Number of people who die each year because of pol-luted drinking water, poor sanitation, and domestichygiene: 5 million. Additionally, waterborne diseases such as diar-rhea, ascariasis, dracunculiasis, hookworm, schistosomia-sis, and trachoma cause illness in perhaps half the popula-tion of the developing world each year (WHO 1996).
■ Percentage of urban sewage in the developing worldthat is discharged into rivers, lakes, and coastalwaters without any treatment:90 percent (WRI et al. 1996:21)
■ Amount spent on bottled water worldwide in 1997:$42 billion (Beverage Industry 1999)
■ Amount U.S. consumers spent on home water filtra-tion systems in 1996:$1.4 billion (Trust for Public Land 1997:24)
■ Cost incurred by households in Jakarta that must buykerosene to boil the city’s public water before use:Rp 96 billion or US$52 million a year (1987 prices) (Bhatiaand Falkenmark 1993:9)
■ Replacement cost of the water that would be lost if thir-teen of Venezuela’s National Parks that provide criticalprotection for urban water supplies were deforested:$103 million to $206 million (net present value) (Reidforthcoming:6)
■ Typical cost to desalinize seawater:$1.00–$1.50 per cubic meter (UNEP 1999:166)
■ Amount of open space and critical recharge areapaved over every day in the United States:11.7 km2 (TPL 1997:3)
■ Estimated annual value of water quality improvementprovided by wetlands along a 5.5-km stretch of theAlchovy River in Georgia, USA$3 million (Lerner and Poole 1999:41)
■ Cost to construct wetlands to help process and recy-cle sewage produced by the 15,000 residents ofArcata, California:$514,600 for a 40-ha system (Marinelli 1990). The city’s alter-native was to build a larger wastewater treatment plant at acost of $25 million (Neander n.d.).
The Costs of C lean Water

13C h a p t e r 1 : L i n k i n g P e o p l e a n d E c o s y s t e m s
To many people, bees are known simply as prodigioushoney makers and bats as cohorts of vampires anddarkness. Rarely do we recognize that thousands of
species of plants could not reproduce without their help. Windpollinates some plants, but 90 percent of all floweringplants—including the great majority of the world’s foodcrops—would not exist without animals and insects transport-ing pollen from one plant to another. Of the world’s 100 mostimportant crops, bees alone pollinate more than 70 percent(Nabhan and Buchmann 1997:136, 138). Besides food, pollina-tors help produce other agricultural products that enhanceour lives, including dyes, fuelwood, tropical timbers, and tex-tile fibers such as cotton and flax. The diets of many birdsand mammals also are based on seeds and fruits produced bypollination.
No wonder, then, that agricultural specialists consider the cur-rent worldwide decline in pollinators a cause for alarm. Losses of pollinators have been reported on every continent except
Antarctica. Some are on the verge of extinction; pesticides,mites, invasive species, and habitat loss and fragmentation aremajor killers. The consequences of continued pollinator declinescould include billions of dollars in reduced harvests, cascades ofplant and animal extinctions, and a less stable food supply.
Few studies have calculated the economic contribution ofall pollinators, globally, to agricultural production and bio-diversity, but
■ The FAO recently estimated the 1995 contribution frompollination to the worldwide production of just 30 of themajor fruit, vegetable, and tree crops (not including pastureor animal feeds) to be in the range of $54 billion (interna-tional dollars) per year (Kenmore and Krell 1998).
■ Estimates of the value of pollination just for crop systemsin the United States range from US$20 to $40 billion(Kearns et al. 1998:84).
Box 1.4 Po l l i n at i o n
Pollinators for the World’s Flowering Plants(Angiosperms)
Estimated Total
Number of Percentage of
Pollinators Plant Species Pollinated Plant Species Pollinated*
Wind 20,000 8.30
Water 150 0.63
Bees 40,000 16.60
Hymenoptera 43,295 18.00
Butterflies/Moths 19,310 8.00
Flies 14,126 5.90
Beetles 211,935 88.30
Thrips 500 0.21
Birds 923 0.40
Bats 165 0.07
All Mammals 298 0.10
All Vertebrates 1,221 0.51
351,923
*Total percentage does not equal 100, reflecting pollination bymore than one pollinator.Source: Buchmann and Nabhan 1996:274.
Dependence of Selected U.S. Crops on Honey Bee Pollination
1998 Quantity Percentage of
Produced Crop Loss Without
Crops (metric tons) Honey Bee Pollination*
Temperate Fruits
Almonds 393,000 90
Apples 5,165,000 80
Cherries 190,000 60
Oranges 12,401,000 30
Pears 866,500 50
Strawberries 765,900 30
Vegetables and Seeds
Asparagus 92,800 90
Cabbage 2,108,200 90
Carrots 2,201,000 60
Cottonseed 7,897,000 30
Sunflowers 2,392,000 80
Watermelons 1,673,000 40
*Crop losses are estimates of loss if managed honey bee populationswere eliminated in the United States, with no replacement of theirservices by alternative pollinators.Sources: FAO 2000; Southwick and Southwick 1992.

14W O R L D R E S O U R C E S 2 0 0 0 – 2 0 0 1
With an estimated 13 million species on Earth(UNEP 1995:118), few people take notice of anextinction of a variety of wheat, a breed of sheep,
or an insect. Yet it is the very abundance of species on Earththat helps ecosystems work at their maximum potential. Eachspecies makes a unique contribution to life.
■ Species diversity influences ecosystem stability and under-girds essential ecological services. From water purification tothe cycling of carbon, a variety of plant species is essential toachieving maximum efficiency of these processes. Diversityalso bolsters resilience—an ecosystem’s ability to respond topressures—offering “insurance” against climate change,drought, and other stresses.
■ The genetic diversity of plants, animals, insects, andmicroorganisms determines agroecosystems’ produc-tivity, resistance to pests and disease, and, ultimately,food security for humans. Extractions from thegenetic library are credited with annual increasesin crop productivity worth about $1 billion peryear (WCMC 1992:433); yet the trend in agoe-cosystems is toward the replacement ofpolycultures with monocultures anddiverse plant seed varieties with uni-form seed varieties (Thrupp 1998:23–24). For example, more than 2,000 ricevarieties were found in Sri Lanka in 1959,but just five major varieties in the 1980s(WCMC 1992:427).
■ Genetic diversity is fundamental to human health.From high cholesterol to bacteria fighters, 42 per-cent of the world’s 25 top-selling drugs in 1997were derived from natural sources. The globalmarket value of pharmaceuticals derived fromgenetic resources is estimated at $75–$150 bil-lion. Botanical medicines like ginseng and echi-nacea represent an annual market of another$20–$40 billion, with about 440,000 tons of plantmaterial in trade, much of it originating in thedeveloping world. Not fully captured by this com-mercial data is the value of plant diversity to the 75 percent ofthe world’s population that relies on traditional medicine forprimary health care (ten Kate and Laird 1999:1–2, 34, 101,334–335).
The threat to biodiversity is growing. Among birds andmammals, rates may be 100–1,000 times what they
would be without human-inducedpressures—overexploitation, invasivespecies, pollution, global warming,
habitat loss, fragmentation, and con-version (Reid and Miller 1989).
Regional extinctions, particularly theloss of populations of some species in
tropical forests, may be occurring 3–8times faster than global species extinc-tions (Hughes et al. 1997:691).
Such localized extinctions may bejust as significant as the extinction ofan entire species worldwide. Most of thebenefits and services provided byspecies working together in an ecosys-tem are local and regional. If a keystonespecies is lost in an area, a dramaticreorganization of the ecosystem canoccur. For example, elephants disperseseeds, create water holes, and tramplevegetation through their movementsand foraging. The extinction of ele-phants in a piece of savanna can causethe habitat to become less diverse and
open and cause water holes to silt up, which would have dra-matic repercussions on other species in the region (Goudie2000:67).
Box 1.5 B i o l o g i c a l D i ve r s i t y
Origins of Top 150 Prescription Drugs in the United States of America
Total Number Natural Semi-Origin of Compounds Product synthetic Synthetic Percent
Animal 27 6 21 — 23
Plant 34 9 25 — 18
Fungus 17 4 13 — 11
Bacteria 6 5 1 — 4
Marine 2 2 0 — 1
Synthetic 64 — — 64 43
Totals 150 26 60 64 100
Source: Grifo et al. 1997:137.
Va scula r Plant sThreatened on a Global Scale
Of the estimated250,000–270,000 species ofplants in the world, only 751are known or suspected tobe extinct. But an enormousnumber—33,047, or 12.5 per-cent—are threatened on aglobal scale. Even that grimstatistic may be an under-estimate because muchinformation about plants isincomplete, particularly inthe tropics.
Source: WCMC/IUCN 1998.

Carbon is the basis of life, cycling through the oceans,atmosphere, vegetation, and soils. Through photosyn-thesis, plants take up carbon as carbon dioxide (CO2)
and convert it to sugar for energy; animals consume theplants; and when both plants and animals die, carbon isreturned to the atmosphere as the organisms decay. But ever-increasing emissions of carbon from fossil fuel combustionand deforestation are unbalancing the global carbon cycle;there’s less carbon in the soil and vegetation and more in theatmosphere. Because CO2 in the atmosphere captures thesun’s heat, increasing amounts destabilize the global climate.
It is estimated that prior to the 18th century, increases inatmospheric carbon were less than 0.01 billion metric tons ofcarbon (GtC) per year (Ciaias 1999). The Industrial Revolutionand subequent global development greatly increased fossilfuel emissions, as did the clearing of forests and other land-use changes that release carbon. By 1998, there was approxi-mately 176 GtC more carbon in the atmosphere than in 1850,an increase of nearly 30 percent (IPCC 2000:4). Today, human
activities emit an estimated 7.9GtC to the atmosphere annually(IPCC 2000:5). The oceans absorbslightly less than 30 percent ofthis carbon and terrestrialecosystems absorb slightly more,but that leaves 40 percent ofyearly emissions to accumulate inthe atmosphere (IPCC 2000:5).
Reducing anthropogenic car-bon emissions is one way to miti-gate climate change. Other waysdepend on maintaining the abilityof ecosystems to absorb carbon.Through photosynthesis, plantsprovide the most effective andefficient way to recapture andstore atmospheric carbon.■ Oceans are the major carbon
reservoir or “sink.” Throughchemical and biological pro-cesses, including phytoplank-ton’s growth and decay, oceansstore roughly 50 times morecarbon than is in the atmos-phere, mostly as dissolved inor-ganic carbon (IPCC 2000:30).
■ Soil and its organic layer storeabout 75 percent of total terres-trial carbon (Brown 1998:16).Most of the carbon released tothe atmosphere in the last 2centuries occurred as grass-lands and forests were con-verted to agricultural uses.
■ Forests are the most effectiveterrestrial ecosystem forrecapturing carbon, but not allforests offer the same seques-tration benefits. Faster-grow-ing young trees absorb about 30percent more carbon thanmature wood, but an older for-est stores more carbon overallin the soil and in above- andbelow-ground vegetation thana tree plantation of the samesize. Latitude, climate, species mix, and other biologicaland ecosystem factors also affect carbon fluxes in forests(see Brown 1998:10).
15C h a p t e r 1 : L i n k i n g P e o p l e a n d E c o s y s t e m s
Box 1.6 C a r b o n S to ra g e
Oceans,38,000–40,000
GtC
Land areas,2,100–2,200
GtC
Atmosphere,720–800
GtC
Global Carbon Storage
Soil951—1,555
GtC
Vegetation262—880
GtC
Carbon Stored in Soilversus Vegetation
Agroecosystems263–487 GtC
Forests487–956 GtC
Grasslands412–820 GtC
Other51–170 GtC
Carbon Storage in Terrestrial Ecosystems
Sources: IPCC 1996:63;Matthews et al. [PAGE]2000. Data on carbonstored in soil versus veg-etation and in terrestrialecosystems is derivedfrom the InternationalGeosphere-BiosphereProgramme. Thus esti-mated share of carbon ineach ecosystem variesslightly from PAGEresults in Chapter 2,because PAGE defini-tions of ecosystemsaccommodate some over-lap of transitional areas.
Earth’s Annual Carbon Budget, 1989–98
Gigatons of carbon
Type of emission or uptake per year
Human-induced emissions into the atmosphere
Emissions from consumption and production
(fossil fuel combustion and cement production) 6.3 +– 0.6
Net emissions from land use change
(fires, deforestation, agriculture) 1.6 +– 0.8
Ocean and terrestrial capture from the atmosphere
Net uptake by oceans (photosynthesis
and ocean capture minus ocean release) 2.3 +– 0.8
Net uptake by terrestrial ecosystems
(photosynthesis and terrestrial storage
minus decay and respiration) 2.3 +– 1.3
Carbon added to the atmosphere each year 3.3 +– 0.2
Source: IPCC, 2000:5. Error limits correspond to an estimated 90 per-
cent confidence interval. Emissions from consumption and produc-
tion are calculated with high confidence. Net emissions from land use
change are estimated from observed data and models. Uptake by
oceans is based on models. Carbon added to the atmosphere each
year is measured with high accuracy. Uptake by terrestrial ecosys-
tems is an imputed amount (the difference between total emissions
and estimated uptake by oceans and atmosphere).

Manag ing Ecosystems :Trade-Of fs and Costs
People often modify or manage ecosystems toenhance the production of one or more goods,such as crops or trees or water storage. The degreeof modification varies widely. Some ecosystems
are heavily affected, others remain relatively unaltered, andmanagement ranges through various types of use—fromnondestructive rubber tapping, to clear-cutting, and even tosingle-species tree plantations. Similarly, aquatic ecosys-tems can range from free-flowing rivers to artificial pondsfor raising fish or shrimp.
Sometimes the dividing line between “natural” and“managed” ecosystems is clear. A farm is obviously a highlymanaged ecosystem—an agroecosystem. But often manage-ment is more subtle: a fence dividing a rangeland, a forestaccess road, a seawall protecting a private beach, a moun-tain stream diverted to supply a village with water. In anycase, human influence, even if it is not intensive manage-ment, is pervasive among all ecosystem types.
The decision to manage or alter an ecosystem involvestrade-offs. Not all benefits can be obtained at the same time,and maximizing one benefit may reduce or eliminate others.For example, converting a natural forest to a tree plantationmay increase the production of marketable pulp or lumber,bringing high monetary returns per hectare, but it generallydecreases biodiversity and habitat value compared with anatural forest. Likewise, damming a river may increase thewater available for irrigation or hydroelectric power produc-tion and decrease the danger of floods, but it may also dis-rupt natural breeding cycles of fish and damage aquatichabitats downstream by diverting water or releasing it atinappropriate times.
To a certain extent, we accept these trade-offs as neces-sary to efficiently produce food, power, and the other thingswe need. Historically, we have been hugely successful atselectively increasing those ecosystem goods we value most.It is only recently that we have begun to focus on the dangersof such trade-offs.
The environmental awareness and knowledge we havegained over the last 30 years have taught us that there arelimits to the amount of alteration that ecosystems can toler-ate and still remain productive. The loss of a hectare of for-est habitat or a single plant or insect species in a grasslandmay not affect the functioning of the system drastically orimmediately, but it may push the system toward a thresholdfrom which it cannot recover.
Biological thresholds remind us that it is the cumulativeeffects of human activities that factor most in ecosystemdecline. A series of small changes, each seemingly harmless,can result in cumulative impacts that are irreversible; this issometimes called the “tyranny of small decisions.” The pro-gressive conversion of a mangrove forest is a good example.
Mangroves serve as nurseries for many species of fishand shellfish that then leave the mangrove and are latercaught in surrounding waters. The value of this seafood isoften many times greater than the wood, crabs, and otherfish harvested within the mangrove forest itself. But inregions where mangroves grow, raising shrimp is a prof-itable enterprise. Converting small sections of the man-grove to shrimp ponds may have little impact on the fishharvest in surrounding waters. But if shrimp growers grad-ually convert the entire mangrove to ponds, the local fisherywill collapse at some point.
Determining the threshold between sustainability andcollapse is no easy matter. This is one reason why it is diffi-cult to manage ecosystems responsibly. Ecosystems are nat-urally resilient and can accommodate considerable distur-bance. But how much? Our understanding of ecosystems,although it has increased rapidly, is still too limited toanswer this crucial question. For most ecosystems, we haveyet to master the details of how organisms and environmentinteract and connect, how changes in one element of the sys-tem reverberate through the whole, or what factors moder-ate the speed of change in an ecosystem. At a global level, westill lack even the most basic statistics on ecosystems—howmuch and where they have been modified, for example, orhow their productivity has changed over time. So at both anindividual ecosystem level and at a larger national orregional level, we find it nearly impossible to predict howclose to the edge our management has brought us, or todetermine the extent of the trade-offs we have already made.
How Are Ecosystems Degraded?
Human activities have put global ecosystems under siege:
■ Some 75 percent of the major marine fish stocks areeither depleted from overfishing or are being fished attheir biological limit (Garcia and Deleiva In press).
■ Logging and conversion have shrunk the world’s forestcover by as much as half, and roads, farms, and resi-dences are rapidly fragmenting what remains intosmaller forest islands (Bryant et al. 1997:9).
■ Some 58 percent of coral reefs are potentially threatenedby destructive fishing practices, tourist pressures, andpollution (Bryant et al. 1998:6).
■ Fully 65 percent of the roughly 1.5 billion ha of croplandworldwide have experienced some degree of soil degrada-tion (Wood et al. [PAGE] 2000).
■ Overpumping of groundwater by the world’s farmers
16W O R L D R E S O U R C E S 2 0 0 0 – 2 0 0 1

exceeds natural recharge rates by at least 160 billion m3
per year (Postel 1999:255).
The pressures responsible for these declines continue toincrease in most cases, accelerating ecosystem change(Vitousek et al. 1997:498). (See Chapter 2 for a detailed lookat ecosystem conditions.)
In many instances, the principal pressure on ecosystemsis simple overuse—too much fishing, logging, water diver-sion, or tourist traffic. Overuse not only depletes the plantsand wildlife that inhabit the ecosystem, but also can frag-ment the system and disrupt its integrity—all factors thatdiminish its productive capacity.
Outright conversion of forests, grasslands, and wetlandsto agriculture or other uses is a second principal pressurereshaping global ecosystems and the benefits they give.Invasive species, air and water pollution, and the threat ofclimate change are key ecosystem pressures as well.
AGRICULTURAL CONVERSIONWhen farmers convert a natural ecosystem to agriculture,they change both the composition of the ecosystem and howit functions. In agroecosystems, naturally occurring plantsgive way to a few nonnative crop species. Wildlife is pushed
to the margins of the system. Pesticides may decimate insectpopulations and soil microorganisms. Soil compactioncauses water to infiltrate the soil differently, and runoff anderosion may increase. The cycle of nutrients through thesystem shifts as fertilizers are applied and soil bacteria andvegetation change.
The result is a substantial change in benefits. Food pro-duction—clearly a boon—surges, but most other benefits suf-fer to some degree. Biodiversity and the benefits associatedwith it, such as production of a wide variety of wild plantsand animals and the availability of diverse genetic material,often decline substantially. At the scale of conversion preva-lent today, that can mean huge biodiversity losses in theaggregate. One study estimates that in the species-rich trop-ics, forest conversion commits two to five species of plants,insects, birds, or mammals to extinction each hour (Hugheset al. 1997:691).
Agriculture in converted areas may also increase pres-sures on surrounding ecosystems through the introductionof nonnative species that become invasive and displaceindigenous species. Bioinvasions are second only to habitatloss, usually through conversion, as a threat to global biodi-versity. In South Africa, nonnative tree species originally
17C h a p t e r 1 : L i n k i n g P e o p l e a n d E c o s y s t e m s
(continues on p. 22)
C o n v e r s i o n r e p r e s e n t s t h e u l t i m a t e i n h u m a n i m p a c t o n a n
e c o s y s t e m , a n d t h e m o s t a b r u p t c h a n g e i n t h e g o o d s
a n d s e r v i c e s i t p r o d u c e s .

18W O R L D R E S O U R C E S 2 0 0 0 – 2 0 0 1
Box 1.7 L i n k i n g Pe o p l e a n d E c o s y s te m s : H u m a n - I n d u c e d P re s s u re s
Thousands of used tires
are shipped into the
United States from Asia for
retreading and resale every
year. Some have contained
larvae of the Asian tiger mos-
quito. Already the mosquito
has established itself in 25
states, feeding on mammals
and birds. Some of the mos-
quitos carry the equine
encephalitis virus, often fatal
to horses and people.
Alogging concessionaire in Gabon clear-
cuts areas in its assigned tract, paying
the government a sizable permit fee. Its con-
tract with the government, which owns the
tract, allows it to harvest timber at below
market rates if it replants the area. The con-
cessionaire plants seedlings but does noth-
ing to stop the ensuing erosion of topsoil,
the siltation of nearby streams, and the
migration or loss of wildlife that depended
on the mature forest.
Small-scale, artisanal miners from Venezuela illegally cross the
unmarked border into Brazil deep in the Amazonian rainforest.
Although they have no legal right to mine there for gold, they can eke
out a living for their families if they keep their operation small and move
frequently from place to place. To increase their chances of extracting
gold, they add mercury to the sluice, although the toxic metal is techni-
cally banned. Like thousands of other independents in the area, they let
the mixture run off directly into a tributary where it poisons local fish.
B e h i n d a l l t h e
p r e s s u r e s
i m p i n g i n g o n
e c o s y s t e m s a r e
t w o b a s i c d r i v e r s :
h u m a n
p o p u l a t i o n
g r o w t h a n d
i n c r e a s i n g
c o n s u m p t i o n .

19C h a p t e r 1 : L i n k i n g P e o p l e a n d E c o s y s t e m s
Agroecosystems
CoastalEcosystems
ForestEcosystems
FreshwaterSystems
Grassland Ecosystems
■ Conversion of farmland to urban andindustrial uses
■ Water pollution from nutrient runoff andsiltation
■ Water scarcity from irrigation■ Degradation of soil from erosion, shifting
cultivation, or nutrient depletion■ Changing weather patterns
■ Overexploitation of fisheries■ Conversion of wetlands and coastal habitats■ Water pollution from agricultural and
industrial sources■ Fragmentation or destruction of natural
tidal barriers and reefs■ Invasion of nonnative species■ Potential sea level rise
■ Conversion or fragmentation resultingfrom agricultural or urban uses
■ Deforestation resulting in loss of biodiver-sity, release of stored carbon, air andwater pollution
■ Acid rain from industrial pollution■ Invasion of nonnative species ■ Overextraction of water for agricultural,
urban, and industrial uses
■ Overextraction of water for agricultural,urban, and industrial uses
■ Overexploitation of inland fisheries■ Building dams for irrigation, hydropower,
and flood control■ Water pollution from agricultural, urban,
and industrial uses ■ Invasion of nonnative species
■ Conversion or fragmentation owing toagricultural or urban uses
■ Induced grassland fires resulting in loss ofbiodiversity, release of stored carbon, andair pollution
■ Soil degradation and water pollution fromlivestock herds
■ Overexploitation of game animals
■ Population growth■ Increasing demand for food and industrial goods■ Urbanization■ Government policies subsidizing agricultural
inputs (water, research, transport) and irrigation■ Poverty and insecure tenure■ Climate change
■ Population growth■ Increasing demand for food and coastal tourism■ Urbanization and recreational development, which
is highest in coastal areas■ Government fishing subsidies■ Inadequate information about ecosystem
conditions, especially for fisheries■ Poverty and insecure tenure■ Uncoordinated coastal land-use policies■ Climate change
■ Population growth■ Increasing demand for timber, pulp, and other fiber■ Government subsidies for timber extraction and
logging roads■ Inadequate valuation of costs of industrial air
pollution■ Poverty and insecure tenure
■ Population growth■ Widespread water scarcity and naturally uneven
distribution of water resources■ Government subsidies of water use ■ Inadequate valuation of costs of water pollution■ Poverty and insecure tenure■ Growing demand for hydropower
■ Population growth■ Increasing demand for agricultural products,
especially meat■ Inadequate information about ecosystem condi-tions■ Poverty and insecure tenure ■ Accessibility and ease of conversion of grass-
E c o s y s t e m P r e s s u r e s C a u s e s
Prima ry Human-Induced Pres sures on Ecosys tems

20W O R L D R E S O U R C E S 2 0 0 0 – 2 0 0 1
No ecosystem is immune to the threat of invasive species.They crowd out native plants and animals, degrade habi-tats, and contaminate the gene pools of indigenous
species. Island ecosystems are particularly vulnerable becauseof their high levels of endemism and isolation; many islandspecies evolved without strong defenses against invaders. OnGuam, for example, the brown tree snake from Papua NewGuinea has eaten twelve of the island’s fourteen flightless birdspecies, causing them to become extinct in the wild. In NewZealand, roughly two-thirds of the land surface is covered byexotic plants (Bright 1998:115). Half of Hawaii’s wild species arenonnative (OTA 1993:234).
Invasive species are a costly problem:
■ Leidy’s comb jellyfish, native to the Atlantic coast of theAmericas, was pumped out of a ship’s ballast tank into theBlack Sea in the early 1980s. Its subsequent invasion hasnearly wiped out Black Sea fisheries, with direct costs total-ing $250 million by 1993 (Travis 1993:1366). Meanwhile, thezebra mussel, native to the Caspian Sea, was similarlydumped into the United States’ Great Lakes in the late 1980s.Controlling this invader, which colonizes and clogs watersupply pipes, costs area industries millions of dollars peryear—perhaps $3–$5 billion total to date (Bright 1998:182).
■ The Asian tiger mosquito, now spreading throughout theworld, is a potential transmitter of 18 viral pathogens (Bright1998:169). One of those pathogens is the West Nile virus. In1999, a director with the U.S. Geological Survey noted thatrecent crow die-offs in Wisconsin suggest that the West Nilevirus could be more deadly to North American bird speciesthan to species in Africa, the Middle East, and Europe, wherethe virus is normally found (USGS 1999:1).
■ In South Africa’s Western Cape, invasive trees threaten tocut Cape Town’s water supply by about a third in the next cen-tury. (See Chapter 3, “Working for Water.”)
Regulation and control are complicated by the many modes ofinvasion. Some species find their way to new habitats by accident:
they hitchhike in ships or planes, on traded goods or travelers.Other species are intentionally introduced for hunting, fishing, orpest control. Still other invasives “escape” their intended con-fines, like the seaweed Caulerpa taxifolia, which was originallyintended for aquariums in Europe but now also carpets thou-sands of acres of French and Italian coastlines (MCBI 1998).
Box 1.8 I n va s i ve S p e c i e s
Native vs. Nonnative Plant Species in Selected Regions
Cuba New Zealand Fiji Hawaii0
5,000
10,000
Native Species
Established Nonnative Species
Native Species
Established Nonnative Species
Russian Arctic
Canada Europe Australia Southern Africa
0
5,000
10,000
15,000
20,000
25,000
USA(Continental)
■ ■ ■■
■■
■
■
■
■■
■
■
■
0
400
800
1200
1600
North American Insect Species
■■ ■
■■
■■
■
■■
■
■
■
0
20
40
60
80
U.S. Great Lakes Plants
■ ■
■ ■■ ■ ■
■
■■ ■ ■
■ ■
0
20
40
60
80
San Francisco BayInvertebrates
■ ■■ ■ ■
■ ■■
■■
■■ ■
■■
0
20
40
60
80
U.S. Great Lakes Fauna
■ ■ ■ ■ ■ ■ ■ ■ ■
■
■■ ■
1850 1870 1890 1910 1930 1950 1970 19900
20
40
60
80
U.S. Fish Species
■■ ■ ■ ■
■ ■
■
■ ■■
■ ■ ■
0
10
20
30
40
50
Hawaiian Bird Species
■
Source: Ruesink et al. 1995:466.
Sources: Vitousek et al. 1997; Vitousek et al. 1996.
Cumulative Number of Nonnative Species in U.S.Regions by Decade of Introduction
…but many continental areas are
also plagued by thousands of
invaders.
Islands tend to have the highest proportion of
nonnative species—as much as 50–75% of
total species…

Trade-offs among various ecosystem goods and ser-vices are common in the management of ecosystems,although rarely factored into decision making. For
example, farmers can increase food production by applyingfertilizer or expanding the land they have under cultivation,but these strategies harm other goods and services from theland they farm, like water quality and biodiversity.
In very few cases do resource managers or policy makersfully weigh the various trade-offs among ecosystem goodsand services. Why? In some cases, lack of information is theobstacle. Typically, not much is known about the likely impactof a particular decision on nonmarketed ecosystem servicessuch as water purification or storm protection. Or, if suchinformation does exist, it may not include estimates of theeconomic costs and benefits of the trade-offs. In other casesthe obstacle is institutional. A government’s Ministry of Agri-culture naturally focuses primarily on its mission of food pro-duction and lacks the expertise or mandate to considerimpacts of its actions on water quality, carbon sequestration,or coastal fisheries, for instance.
The example of Africa’s Lake Victoria illustrates how pro-found and unpredictable trade-offs can be when managementdecisions are made without regard to how the ecosystem willreact. Lake Victoria, bounded by Uganda, Tanzania, and Kenya, isthe world’s largest tropical lake and its fish are an importantsource of food and employment for the region’s 30 million people.Before the 1970s, Lake Victoria contained more than 350 speciesof fish from the cichlid family, of which 90 percent were endemic,giving it one of the most diverse and unique assemblages of fishin the world (Kaufman 1992:846–847, 851). Today, more than half ofthese species are either extinct or found only in very small popu-lations (Witte et al. 1992:1, 17).
The collapse in the lake’s biodiversity was caused primarilyby the introduction of two exotic fish species, the Nile perchand Nile tilapia, which fed on and outcompeted the cichlids forfood. But other pressures factored in the collapse as well.Overfishing depleted native fish stocks and provided the origi-nal impulse for introducing the Nile perch and tilapia in theearly 1950s. Land-use changes in the watershed dumped pollu-tion and silt into the lake, increasing its nutrient load andcausing algal blooms and low oxygen levels in deeperwaters—a process called eutrophication. The result of allthese pressures was a major reorganization of the lake’s fish-life. Cichlids once accounted for more than 80 percent of LakeVictoria’s biomass and provided much of the fish catch (Kauf-man 1992:849). By 1983, Nile perch made up almost 70 percentof the catch, with Nile tilapia and a native species of sardinemaking up most of the balance (Achieng 1990:20).
Although the introduced fishes devastated the lake’s biodi-versity, they did not not destroy the commercial fishery. In fact,total fish production and its economic value rose considerably.
Today, the Nile perch fishery produces some 300,000 metrictons of fish (FAO 1999), earning $280–$400 million in the exportmarket—a market that did not exist before the perch was intro-duced (Kaufman 2000). Unfortunately, local communities thathad depended on the native fish for decades did not benefitfrom the success of the Nile perch fishery, primarily becauseNile perch and tilapia are caught with gear that local fisher-men could not afford. And, because most of the Nile perch andtilapia are shipped out of the region, the local availability offish for consumption has declined. In fact, while tons of perchfind their way to diners as far away as Israel and Europe, thereis evidence of protein malnutrition among the people of thelake basin (Kaufman 2000).
The sustainability of the Nile perch fishery is also a con-cern. Overfishing and eutrophication are major threats to thefishery, and the stability of the entire aquatic ecosystem—soradically altered over a 20-year span—is in doubt. The ramifica-tions of the species introductions can even be seen in thewatershed surrounding Lake Victoria. Drying the perch’s oilyflesh to preserve it requires firewood, unlike the cichlids, whichcould be air-dried. This has increased pressure on the area’slimited forests, increasing siltation and eutrophication, which,in turn, has further unbalanced the precarious lake ecosystem(Kaufman 1992:849–851; Kaufman 2000).
In sum, introducing Nile perch and tilapia to Lake Victoriatraded the lake’s biodiversity and an important local foodsource for a significant—although perhaps unsustainable—source of export earnings. When fisheries managers introducedthese species, they unknowingly altered the balance of goodsand services the lake produced and redistributed the economicbenefits flowing from them. Knowing the full dimensions ofthese trade-offs, would they make the same decision today?
Box 1.9 Tra d e - O f f s : L a k e Vi cto r i a ’s E c o s y s te m B a l a n c e S h e et
Trading Biodiversity for Export EarningsPercentage Contribution to Lake Victoria Fish Catch (Kenya Only), 1968–1988
1968 1972 1976 1984 198819800.0
10.0
20.0
30.0
40.0
50.0
60.0
70.0
80.0
Nile Perch
Cichlid Family
21C h a p t e r 1 : L i n k i n g P e o p l e a n d E c o s y s t e m s
Source: Achieng 1990:20, citing Fisheries Department of Kenya, Statistical
Bulletin.

imported for forest plantations have invaded a third of thenation’s mountain watersheds. The invading plants havedepleted freshwater supplies, displaced thousands of nativeplants, and altered animal habitats, precipitating a coun-trywide eradication program (see Chapter 3, Working forWater).
Not all agricultural conversions are equal. Some mayretain or carefully harbor aspects, and services, of the origi-nal ecosystem. In Sumatra, some traditional agroforestry sys-tems (where trees and crops are mixed) contain as much ashalf the species diversity found in the neighboring forest. Tra-ditional Central American coffee plantations raise their cof-fee plants in the shade of native trees that provide essentialbird habitat and a range of secondary products. Even manymodern agricultural systems include careful tillage practicesaimed at preventing erosion and preserving the soil’s water-holding properties and beneficial soil organisms.
URBAN AND INDUSTRIAL CONVERSIONUnfortunately, conversion to urban or industrial uses isusually not so benign. Radical changes in ecosystem bene-fits occur as structures and paved surfaces replace nativeplant and animal communities. As city dwellers cover per-meable soil surfaces with concrete and asphalt, watershedfunctions decline. With few places to sink in, rainfall runsoff quickly and local flooding can ensue. Still, the more sim-plified ecosystems in parks, backyards, and vacant lots doprovide important services—shade, areas for relaxation,removal of air pollutants, and even some wildlife habitat—that city dwellers enjoy.
POLLUTION AND CLIMATE CHANGEThe effects of pollution put indirect pressures on ecosys-tems. Acid rain, smog, wastewater releases, pesticide andfertilizer residues, and urban runoff all have toxic effects onecosystems—sometimes at great distances from the activi-ties that gave rise to the pollution. For example, nitrogenreleases from industry, transportation, and agriculturehave seriously altered the global nitrogen cycle, affectingthe function of both terrestrial and aquatic ecosystems.
Biologically active, or “fixed,” nitrogen is an essentialnutrient for all plants and animals. But nitrogen releasesfrom human sources like fertilizers and fossil fuels nowexceed those from natural sources, leaving ecosystemsawash in fixed nitrogen. The impacts include an overgrowthof algae in waterways, caused by the fertilizing effect ofexcess nutrients; acidification of soils and loss of some soilnutrients; loss of plants adapted to natural low-nitrogenconditions; and more smog and greenhouse warming fromhigher levels of nitrogen oxides in the atmosphere (ESA1997b:1–14).
Climate change from the buildup of greenhouse gasesprovides an even more profound example of the potentialfor pollution to inadvertently disrupt ecosystems on a global
scale. Scientists warn that global ecosystems could undergoa major reorganization as Earth’s vegetation redistributesitself to accommodate rising temperatures, changes in rain-fall patterns, and the potential fertilizing effects of morecarbon dioxide (CO2) in the atmosphere. Computer modelsestimate that doubling atmospheric CO2 levels from prein-dustrial levels, which will likely happen within the next cen-tury, could trigger broad changes in the distribution,species composition, or leaf density of roughly one-third ofglobal forests. Tundra areas could also shrink substantiallyand coastal wetlands shift markedly, among many othereffects. It is not at all clear how present ecosystems wouldweather such significant changes or how these changesmight affect their productivity (Houghton et al. 1997:30).
What Dr i ves Degradat i on?
Behind all the pressures impinging on ecosystemsare two basic drivers: human population growthand increasing consumption. Closely related are asuite of economic and political factors—market
forces, government subsidies, globalization of productionand trade, and government corruption—that influence whatand how much we consume, and where it comes from. Issuesof poverty, land tenure, and armed conflict are also signifi-cant factors in how people treat the ecosystems they live inand extract goods and services from.
DEMOGRAPHICS AND CONSUMPTIONPopulation growth is in many ways the most basic of envi-ronmental pressures because everyone requires at leastsome minimum of water, food, clothing, shelter, andenergy—all ultimately harvested directly from ecosystems orobtained in a way that affects ecosystems. Over the next 50years, demographers expect the world’s population to growfrom the current 6 billion to 9 billion or so, with most of thisgrowth taking place in developing nations (UN PopulationDivision 1998:xv). Simple arithmetic dictates this willincrease the demand for ecosystem products and increasethe pressure on global food and water supplies.
Increasing pressure on ecosystems is not simply a matterof population growth, however. In fact, it is more a matter ofhow much and what we consume. Global increases in con-sumption have greatly outpaced growth in population fordecades. From 1980 to 1997, the global economy nearlytripled to some US$29 trillion, yet the world populationincreased only 35 percent (World Bank 1999b:194; UN Pop-ulation Division 1998:xv). Per capita consumption levelsare rising quickly in many nations as their economiesdevelop; and consumption levels in most industrializednations are already remarkably high. This higher consump-tion of everything from paper to refrigerators to computers
22W O R L D R E S O U R C E S 2 0 0 0 – 2 0 0 1

to oil is the result of greater wealth. Personal-income levelshave climbed steadily in developed nations and a number ofrapidly developing countries such as China, India, andThailand; and consumption has increased accordingly.
At the same time, the world’s economy has become moreintegrated. Trade has made consumer markets more global.Industries have become more international and less tied toa single place or production facility. This “globalization”means that consumers derive goods and services fromecosystems around the world, with the costs of use largelyseparated from the benefits. This tends to hide the environ-mental costs of increased consumption from those doingthe consuming.
For example, a housing contractor in Los Angelesinstalls copper plumbing but has no way of knowingwhether the copper has come from the infamous Ok Tedimine in Papua New Guinea. The giant mine, which is ownedby an international consortium of companies, dumps80,000 tons per day of untreated tailings into the Ok TediRiver, destroying much of the river’s aquatic life and dis-rupting the subsistence lifestyle of the local Wopkaiminpeople. Globalization means the eventual homeowners whobenefit from the copper have no knowledge of their link withthe damaged Ok Tedi watershed and don’t suffer the envi-ronmental costs (Da Rosa and Lyon 1997:223–226).
It’s not surprising that those doing the most consuminglive in developed countries, but the unevenness of con-sumption of ecosystem goods and services worldwide isstriking. It takes roughly 5 ha of productive ecosystem tosupport the average U.S. citizen’s consumption of goodsand services versus less than 0.5 ha to support consumptionlevels of the average citizen in the developing world (GEF1998:84). Annual per capita CO2 emissions are more than11,000 kg in industrial countries, where there are far morecars, industries, and energy-consuming appliances. Thiscompares with less than 3,000 kg in Asia (UNDP 1998:57).On average, someone living in the developed world spendsnearly $16,000 (1995 international dollars) on private con-sumption each year, compared with less than $350 spent bysomeone in South Asia and sub-Saharan Africa (UNDP1998:50).
Of course, greater consumption of nutritious food, safehousing, clean water, and adequate clothing is absolutelynecessary to relieve poverty in many nations, particularly inthe developing world. In the words of the UN’s 1948 Univer-sal Declaration of Human Rights, “Everyone has the rightto a standard of living adequate for the health and well-beingof himself and of his family” (Article 25). Accommodatingsuch basic human development, however, is far from the
23C h a p t e r 1 : L i n k i n g P e o p l e a n d E c o s y s t e m s
I n c r e a s i n g p r e s s u r e o n
e c o s y s t e m s i s n o t s i m p l y a
m a t t e r o f p o p u l a t i o n
g r o w t h , h o w e v e r . I n f a c t ,
i t i s m o r e a m a t t e r o f h o w
m u c h a n d w h a t w e
c o n s u m e .
(continues on p. 30)

24W O R L D R E S O U R C E S 2 0 0 0 – 2 0 0 1
Since the dawn of settled agriculture, humans have beenaltering the landscape to secure food, create settle-ments, and pursue commerce and industry. Croplands,
pastures, urban and suburban areas, industrial zones, and thearea taken up by roads, reservoirs, and other major infrastructureall represent conversion of natural ecosystems.
These transformations of the landscape are the defining markof humans on Earth’s ecosystems, yielding most of the food,energy, water, and wealth we enjoy, but they also represent amajor source of ecosystem pressure.
Conversion alters the structure of natural ecosystems, andhow they function, by modifying their basic physical properties—their hydrology, soil structure, and topography—and their pre-dominant vegetation. This basic restructuring changes the com-plement of species that inhabits the ecosystem and disrupts thecomplex interactions that typified the original ecosystem. Inmany cases, the converted ecosystem is simpler in structure andless biologically diverse. In fact, habitat loss from conversion ofnatural ecosystems represents the primary driving force in theloss of biological diversity worldwide (Vitousek et al. 1997:495).
Historically, expansion of agriculture into forests, grasslands,and wetlands has been the greatest source of ecosystem conver-sion. Within the last century, however, expansion of urban areaswith their associated roads, power grids, and other infrastruc-ture, has also become a potent source of land transformation.
■ Worldwide, humans have converted approximately 29 percentof the land area—almost 3.8 billion ha—to agriculture andurban or built-up areas (WRR calculations).
■ Agricultural conversion to croplands and managed pastureshas affected some 3.3 billion ha—roughly 26 percent of theland area. All totaled, agriculture has displaced one-third oftemperate and tropical forests and one-quarter of naturalgrasslands. Agricultural conversion is still an importantpressure on natural ecosystems in many developing nations;however, in some developed nations agricultural lands them-selves are being converted to urban and industrial uses(WRR calculations).
■ Urban and built-up areas now occupy more than 471 millionha—about 4 percent of land area. Almost half the world’spopulation—some 3 billion people—live in cities. Urban pop-ulations increase by another 160,000 people daily, addingpressure to expand urban boundaries (UNEP 1999:47). Sub-urban sprawl magnifies the effect of urban populationgrowth, particularly in North America and Europe. In theUnited States, the percentage of people living in urban areasincreased from 65 percent of the nation’s population in 1950to 75 percent in 1990, but the area covered by cities roughlydoubled in size during the same period (PRB 1998).
■ Future trends in land conversion are difficult to predict, butprojections based on the United Nations’ intermediate-range population growth model suggest that an additionalone-third of the existing global land cover could be con-verted over the next 100 years (Walker et al. 1999:369).
Box 1.10 D o m e s t i c at i n g t h e Wo r l d : C o n ve r s i o n o f N atu ra l E c o s y s te m s
Asia(excluding
Middle East)
Europeand Russia
Sub-SaharanAfrica
South America North America Middle East and North Africa
CentralAmerica and
the Caribbean
Oceania0
100,000
200,000
300,000
400,000
500,000
600,000
700,000
800,000
900,000
Area
(000
ha)
ForestGrasslandOther
Area Converted by Region
Percentage
Region of Land Converted
Asia (excl. Middle East) 44
Central America & Caribbean 28
Europe & Russia 35
Middle East & North Africa 12
North America 27
Oceania 9
South America 33
Sub-Saharan Africa 25
Source: WRR calculations.

25C h a p t e r 1 : L i n k i n g P e o p l e a n d E c o s y s t e m s
Glo
bal M
ap o
f Con
vert
ed A
reas
Sou
rce:
Cre
ated
for
thi
s pu
blic
atio
n b
y S
. Mur
ray
[PA
GE
] ba
sed
on
dat
a fr
om G
loba
l Lan
d C
over
Cha
ract
eris
tics
Dat
abas
e V
ersi
on 1
.2 (
Lov
elan
d e
t al.
2000
); N
OA
A-N
GD
C (
1998
); W
WF
(19
99).

26W O R L D R E S O U R C E S 2 0 0 0 – 2 0 0 1
Humans consume goods and services for manyreasons: to nourish, clothe, and house ourselves,certainly. But we also consume as part of a
social compact, since each community or social grouphas standards of dress, food, shelter, education, andentertainment that influence its patterns of consumptionbeyond physical survival (UNDP 1998:38–45).
Consumption is a tool for human development—onethat opens opportunities for a healthy and satisfying life,with adequate nutrition, employment, mobility, and edu-cation. Poverty is marked by a lack of consumption, andthus a lack of these opportunities. At the other extreme,wealth can—and often does—lead to excessive levels ofmaterial and nonmaterial consumption.
In spite of its human benefits, consumption can leadto serious pressure on ecosystems. Consumption harmsecosystems directly through overharvesting of animalsor plants, mining of soil nutrients, or other forms of bio-logical depletion. Ecosystems suffer indirectly throughpollution and wastes from agriculture, industry, andenergy use, and also through fragmentation by roadsand other infrastructure that are part of the productionand transportation networks that feed consumers.
Consumption of the major commodities ecosystemsproduce directly—grains, meat, fish, and wood—increased substantially in the last 4 decades and will con-tinue to do so as the global economy expands and worldpopulation grows. Plausible projections of consumerdemand in the next few decades suggest a marked esca-lation of impacts on ecosystems (Matthews and Ham-mond 1999:5).
■ Global wood consumption has increased 64 percentsince 1961. More than half of the 3.4 billion m3 of woodconsumed annually is burned for fuel; the rest is usedin construction and for paper and a variety of otherwood products. Demand for lumber and pulp is ex-pected to rise between 20 and 40 percent by 2010. For-est plantations produce 22 percent of all lumber, pulp,and other industrial wood; old-growth and secondary-growth forests provide the rest (Matthews and Ham-mond 1999:8, 31; Brown 1999:41).
■ World cereal consumption has more than doubled in thelast 30 years, and meat consumption has tripled since1961 (Matthews and Hammond 1999:7). Some 34 percentof the world’s grain crop is used to feed livestock raisedfor meat (USDA 2000). A crucial factor in the rise in grainproduction has been the more than fourfold increase infertilizer use since 1961 (Matthews and Hammond1999:14). By 2020, demand for cereals is expected to
increase nearly 40 percent, and meat demand will surgenearly 60 percent (Pinstrup-Andersen et al. 1999:11).
■ The global fish catch has grown more than sixfoldsince 1950 to 122 million metric tons in 1997. Three-fourths of the global catch is consumed directly byhumans as fresh, frozen, dried, or canned fish and
Box 1.11 H o w M u c h D o We C o n s u m e ?
1961 1965 1969 1973 1977 1981 1985 1989 1993 19970
500
1000
1500
2000
2500
3000
3500
Mill
ion
met
ric to
ns
World Wood Production
1960 1964 1968 1972 1976 1980 1984 1988 1992 1996
0
50
100
150
200
250
Mill
ion
met
ric to
ns World Meat Consumption
1960 1964 1968 1972 1976 1980 1984 1988 1992 1996
0
500
1000
1500
2000
2500
Mill
ion
met
ric to
ns World Grain Production
1984 1986 1988 1990 1992 1994 1996
0
20
40
60
80
100
120
140
Mill
ion
met
ric to
ns
Capture
Aquaculture
World Capture Fisheries and Aquaculture Production
Sources: FAO 1999; FAO 2000.

27C h a p t e r 1 : L i n k i n g P e o p l e a n d E c o s y s t e m s
shellfish. The remaining 25 percent is reduced to fishmeal and oil, which is used for both livestock feed andfish feed in aquaculture. Demand for fish for directconsumption is expected to grow some 20 percent by2010 (FAO 1999:7, 82; Matthews and Hammond 1999:61).
T h e U n e q u a l G e o g ra p h y o f C o n s u m p t i o nWhile consumption has risen steadily worldwide, thereremains a profound disparity between consumption lev-els in wealthy nations and those in middle- and low-income nations.
■ On average, someone living in a developed nation con-sumes twice as much grain, twice as much fish, threetimes as much meat, nine times as much paper, andeleven times as much gasoline as someone living in adeveloping nation (Data Table ERC.3; Laureti 1999:50,55).
■ Consumers in high-income countries—about 16 per-cent of the world’s population—accounted for 80 per-cent of the money spent on private consumption in1997—$14.5 trillion of the $18 trillion total. By contrast,purchases by consumers in low-income nations—the
poorest 35 percent of theworld’s population—repre-sented less than 2 percentof all private consumption.The money spent on privateconsumption worldwide (all
goods and services con-sumed by individualsexcept real estate)nearly tripled between
1980 and 1997 (WorldBank 1999:44, 226).
Disparities in Consumption: Annual per Capita Consumption in Selected High-, Medium-, and Low-Income Nations
Total Value of Fish Meat Cereals Paper Fossil Fuels Passenger CarsPrivate Consumption* (kg) (kg) (kg) (kg) (kg of oil equivalent) (per 1,000 people)
Country (1997) (1997) (1998) (1997) (1998) (1997) (1996)
United States $21,680 21.0 122.0 975.0 293.0 6,902 489.0
Singapore $16,340 34.0 77.0 159.0 168.0 7,825 120.0
Japan $15,554 66.0 42.0 334.0 239.0 3,277 373.0
Germany $15,229 13.0 87.0 496.0 205.0 3,625 500.0
Poland $5,087 12.0 73.0 696.0 54.0 2,585 209.0
Trinidad/Tobago $4,864 12.0 28.0 237.0 41.0 6,394 94.0
Turkey $4,377 7.2 19.0 502.0 32.0 952 55.0
Indonesia $1,808 18.0 9.0 311.0 17.0 450 12.2
China $1,410 26.0 47.0 360.0 30.0 700 3.2
India $1,166 4.7 4.3 234.0 3.7 268 4.4
Bangladesh $780 11.0 3.4 250.0 1.3 67 0.5
Nigeria $692 5.8 12.0 228.0 1.9 186 6.7
Zambia $625 8.2 12.0 144.0 1.6 77 17.0
*Adjusted to reflect actual purchasing power, accounting for currency and cost of living differences (the “purchasing power parity” approach).
Sources:Total Private Consumption (except China and India): World Bank 1999: Table 4.11; (fish) Laureti 1999: 48–55; (meat) WRI et al. 2000a: Agriculture
and Food Electronic Database; (paper) WRI et al. 2000b: Data Table ERC.5; (fossil fuels) WRI et al. 2000b: Data Table ERC.2; (passenger cars) WRI et al.
2000b: Data Table ERC.5.
Low-IncomeCountries $257
Middle-IncomeCountries
$3,288
High-IncomeCountries $14,575
Global Share of Private Consumption, 1997
(in billlions)

28W O R L D R E S O U R C E S 2 0 0 0 – 2 0 0 1
Population growth stresses ecosystems because itcontributes to increases in both consumption andconversion. Each year, the human population grows by
approximately 80 million. Although global fertility ratesdecreased since the 1950s from 5.0 to 2.7 births per woman(UN Population Division 1998b:514–515), the population willcontinue to grow. Past high fertility rates created today’s poolof more than 1.5 billion people at the prime reproductive age—between 15 and 29 years old; another 1.9 billion are youngerthan 15 (UN Population Division 1998a). An adjunct to popula-tion growth is the significant decrease in mortality. Since the1950s the global mortality rate has dropped from about 20 tofewer than 10 deaths per year per 1,000 people (UNFPA 1999).In contrast, the seven African countries hardest hit by theAIDS epidemic have actually experienced a decrease in lifeexpectancy because of the high number of deaths caused bythe disease (UN Population Division 1998a).
■ Growth is fastest in less developed nations, among popula-tions most dependent on ecosystems for a subsistence living.Demographers expect 97 percent of all population growth inthe next 5 decades to occur in developing countries.
■ In both more and less developed nations, cities are drawingpeople into ever greater concentrations. Urban regions tendto offer more opportunities for economic development aswell as better education and health resources. Althoughurban areas occupy only about 4 percent of the Earth’s landarea, they are home to nearly half the world’s population(UNEP 1999:47; Wood et al. [PAGE] 2000). Currently cities areexpansive consumers of ecosystem goods and services andprolific generators of ecosystem-damaging wastes—essen-
tially concentrated centers of ecosystem pressures. By 2030,more than 60 percent of all people are likely to be living inurban areas. In industrial countries and Latin America, theshare is expected to exceed 80 percent (UN Population Divi-sion 1998a).
■ As the population grows in the next quarter century, pres-sures will increase, especially in countries where arable landis in short supply. In 14 countries, arable land per capita isexpected to be less than 0.07 ha—equivalent to an area about0.25 km2—to sustain each human life (WHO 1997:59). Richercountries may supplement their food resources with imports,but poorer countries will have a more difficult time followingsuch a strategy to feed their hungry populations.
Box 1.12 T h e H u m a n Po p u l at i o n
World Population Growth
Source: UN Population Division (1998a).
Available Arable Land per Capita in 2025 for SelectedCountries
Source: WHO 1997:59.
0
0.02
0.04
0.06
0.08
0.1
0.12
0.14
0.16
Arab
le h
ecta
res p
er c
apita
1990
2025
Japa
nEg
ypt
China
Bang
lades
hIsr
ael
Viet
nam
Keny
aSo
malia
Tanz
ania
Nepa
l
Yeme
nJo
rdan
Haiti
Saud
ia Ar
abia
1950 1970 1990 2010 2030 2050 2070 2090 2110 2130 21500
2
4
6
8
10
12
Billi
ons
Developing Countries
Developed Countries
Trends in Urbanization
Source: UN Population Division 1998a.
1950
1990
2030
Africa Asia World Latin American and
Caribbean
More-Developed Countries
0
10
20
30
40
50
60
70
80
90
Perc
ent o
f the
Pop
ulat
ion
Livi
ng in
Urb
an

In the last century, a growing and rapidly industrializingworld has produced greater quantities of common pollu-tants like household garbage and sewage, and more toxic
and persistent contaminants like pesticides, polychlorinated-biphenyls (PCBs), dioxins, heavy metals, and radioactivewastes. The environmental costs of contemporary society’spollutant load are difficult to quantify, both because there islittle comprehensive data on pollution emissions on a globalscale and because the effects of pollutants on ecosystemsare often hard to measure. But the problem is surely growing.
Pollutants affect ecosystems in a variety of ways. Pesti-cides and heavy metals may harm exposed orgnisms by beingacutely toxic or by accumulating in plant and animal tissuethrough repeated exposures. Pollutants like acid rain can actat a system-wide level, disrupting soil acidity and waterchemistry—both critical environmental factors that affect thenutrition and physical development of plants and aquatic life.Multiple pollutants can create a toxic synergy that weakensorganisms and gradually reduces an ecosystem’s productivityand resilience. All of these effects on ecosystems are muchin evidence.
■ Although there is greater awareness today of the dangersassociated with toxic materials, toxic emissions continueto be significant. For example, the US$37 billion global pes-ticide market dispenses 2.6 billion kg of active ingredients(pesticides excluding solvents and dilutants) on theworld’s farms, forests, and household gardens, with a vari-ety of collateral effects on wildlife and human health(Aspelin and Grube 1999:10).
■ Accidental releases of toxic substances like miningwastes, or of oil or industrial chemicals, occur routinelyand with devastating effect. In January 2000, 99,000 m3 ofcyanide-laden wastes escaped a Romanian gold mine whenan earthen tailings dam collapsed; the toxic plume wipedout virtually all aquatic life along a 400-km stretch of theDanube and its tributaries (D’Esposito and Feiler 2000:1,4).In 1997, more than 167,000 tons of oil spilled from pipelines,storage vessels, tankers, and other carriers and sources tocontaminate the world’s marine and inland environments(Etkin 1998:5)
■ Air pollution from sulfur dioxide (SO2), nitrogen oxides(NOx) and ground-level ozone still exceeds the “criticalload”—the amount an ecosystem can absorb without dam-age—over wide areas of Europe, North America, and Asia,with documented effects on crops, forests, and freshwaterecosystems from acid rain. For example, the fraction ofhealthy Norway spruce, one of the most common conifers inEuropean forests, decreased from 47 percent in 1989 to 39
percent in 1995—an indicator of the continued stress airpollution imposes on Europe’s forest ecosystems (EEA1999:144–145).
■ Fertilizer runoff, human and animal sewage, and inade-quately treated industrial wastes can add nutrients tofreshwater and coastal ecosystems, stimulating algalblooms and depleting the water of oxygen—a processcalled eutrophication. Oxygen-depleted waters can’t sup-port aquatic life. Eutrophication is a growing problemworldwide. A roughly 18,000 km2 “dead zone” of oxygen-depleted waters in the northern Gulf of Mexico stems froma tripling of the nutrient pollution carried to the coast bythe Mississippi River over the last 40 years (Rabalais andScavia 1999; NOAA 2000).
29C h a p t e r 1 : L i n k i n g P e o p l e a n d E c o s y s t e m s
Box 1.13 Po l l ut i o n a n d E c o s y s te m s
Total Waste Volumes Generated by Low-, Middle-, andHigh-Income Countries (per day)
Excess Nutrients Translate to Water PollutionTotal Nitrogen Supply
from Fertilizer Nitrogen Residual
and Manure Uptake by Residual Equivalence per
Country (1,000 tons) Crops Nitrogen Hectare (kg)
Belgium andLuxembourg 580 211 369 240
Denmark 816 287 529 187
Netherlands 1255 285 970 480
Note: Because some nitrogen is lost to the atmosphere, only a part of
the residual nitrogen stays in the soil for possible nitrate leaching.
Source: Matthews and Hammond 1999.
3,000,000
0
500,000
1,000,000
1,500,000
2,000,000
2,500,000Current
2025
Volu
me
(m3 )
Low-Income Middle-Income High-Income
Source: Hoornweg and Thomas 1999:11.

predominant pressure on ecosystems today. Even consider-ing that almost four times as many people live in developingcountries as in developed ones, the greatest burden onecosystems currently originates with affluent consumers indeveloped countries, as well as wealthy elites in developingcountries. It is the pattern of excessive consumption thatoften accompanies wealth that brings a disproportionateimpact on ecosystems.
DISTORTED PRICES, UNDERVALUED SERVICESPeople don’t generally consciously decide to damage ecosys-tems, but many of the things we do have that effect. Giventhat ecosystems provide so many benefits, why do people dothings that jeopardize these benefits?
Economic signals—reflected in prices and governmentpolicies—are one of the prime factors determining how wetreat ecosystems. They are behind our choices of what toconsume and how to manage our lands and our businesses.A farmer deciding what crops to plant and what farm chem-icals to use, or whether to increase the cultivated area byclearing adjacent forests, is guided by calculating commod-ity and pesticide prices as well as many other farm costs.Similarly, a developer’s choice of where to locate a tract ofhousing or a factory, or a fisher’s decision on what type offishing gear to use and how many days to spend at sea aredriven largely by economic factors—the price of land or boat,of labor or fishing licenses, of the finished house or the har-vested fish.
But prices all too frequently send us the wrong signals. Inmost cases, they don’t reflect the real costs to the environ-ment of harvesting ecosystem goods and services. The prob-lem is, many of the less tangible aspects of ecosystems, par-ticularly the services they provide, are not bought or sold inthe marketplace and are therefore harder to assign a value.How much is carbon storage in a forest worth? What pricetag can be put on flood protection provided by the wetlandsalong a river?
The connection between these services and the more tan-gible marketable goods—timber or fish or crops—is notalways obvious to those exploiting these goods and services.The value of biodiversity to the future of food crops is, forexample, of little immediate import to an individual farmertrying to maximize his or her profit. The result is that mostecosystem services have been undervalued in the past andneglected in decisions about whether to exploit or alter anecosystem. The market has failed to register the real worthof these services in its price system—a “market failure.”
Consider the case of deciding whether to clear nativeforests for a new agricultural settlement. The potentialfarmers will take into account the cost of the labor needed toclear land, the fertilizers used to increase yields, and theconstruction materials required to build houses or roads.They may even factor in some reductions in ecosystem ser-vices. For example, they may consider the cost of forgoing
the benefits of using the forest as a source of fuelwood andthe loss of wild animals and plants.
It is, nonetheless, very likely that they won’t take intofull account the many environmental costs of forest clear-ing. Cutting down forests might increase downstream flood-ing and sedimentation, for example, but since these costsare borne by people living far downstream, they will often beignored by the upstream farmers. The result is that more for-est is cleared than would make sense from an overall eco-nomic standpoint, and the forest ecosystem suffers needlessdamage, as may the downstream populations. Extendingthis argument to the global level, a better accounting of allthe costs and benefits of forest conversion would not neces-sarily mean that all forest is preserved, but it would cer-tainly result in a lower rate of deforestation than is occur-ring now.
SUBSIDIES AND OTHER POLICY FAILURESGovernment policies often contribute to ecosystem declinethrough their effect on prices. Fiscal policies affect pricesthrough taxes and subsidies. Tariffs increase the price ofimported goods directly and import quotas increase themindirectly. Exchange-rate policies affect the value of all trad-able commodities. Government agencies also actively buyand sell farm commodities, often at predetermined prices.All of these actions can influence the decisions of farmers,fishers, developers, timber and mining companies, and oth-ers who use the land and sea, harvest from it, or impact itthrough pollution.
Subsidies. Government subsidies contribute importantly tocurrent pressures on ecosystems, often encouraging damag-ing activities—such as overfishing or the liberal use of coalor other fossil fuels—that would not otherwise be economi-cally viable. Generous loans to build fishing boats, agricul-tural price supports, depletion allowances for timber and oilproducers, and outright grants for road construction arejust a few of the ways that governments subsidize activitiesthat can damage ecosystems. One recent analysis reportedthat government expenditures on environmentally damag-ing subsidies in just four sectors—water, agriculture, energy,and road transportation—totaled some $700 billion per yearworldwide (de Moor and Calamai 1997:1).
Subsidies often promote laudable social goals—employ-ment, higher productivity, economic development—whenfirst instituted, but these goals are often subverted overtime through unintended consequences such as environ-mental impacts. For example, governments have subsidizedthe use of various farm inputs, such as pesticides and fertil-izers, partly to boost agricultural production and partly tosupport the industries producing these chemicals. Pesticidesubsidies, in particular, have been common in developingcountries. In the mid-1980s, Indonesia was spending about$150 million annually on pesticide subsidies, mostly to pro-
30W O R L D R E S O U R C E S 2 0 0 0 – 2 0 0 1

tect the rice crop. This led to considerable overuse. Ratherthan reducing crop-damaging insects, however, this liberalpesticide use actually triggered periodic outbreaks by reduc-ing natural predators and prompting pesticide resistanceamong target insects. It also caused substantial downstreampollution and adversely affected the health of farmers.When the government ended its subsidies, pesticide usedropped, the government saved money, and rice productioncontinued to increase (World Bank 1997:26).
Subsidizing irrigation projects is another common prac-tice that has seriously harmed aquatic ecosystems.Throughout the world, government support has typicallyallowed water utilities to sell irrigation water for far lessthan the cost of supplying it, which has inevitably led tooveruse. In arid Tunisia, for example, farmers pay no morethan one-seventh the cost of water they use to irrigate theirfields. Similar practices of underpricing irrigation water inthe western United States cost U.S. taxpayers an estimatedUS$2–$2.5 billion per year (de Moor and Calamai1997:14–15). With water costs low, farmers have little incen-tive to use water efficiently or to restrict its use to high-valuecrops. Direct water diversions and overpumping from irri-gation wells often rob streams of much of their normal flow.Too often pesticide and fertilizer runoff pollutes what flowremains.
Regulations. Beyond their effect on prices, governmentpolicies can also impact ecosystems more directly, throughsuch mechanisms as zoning ordinances, pollution stan-dards, or other regulations that affect land use and businesspractices. Programs to promote economic developmentmay foster “grow now, clean up later” policies that encour-age industrialization no matter what the environmentalcosts. China’s dramatic industrialization after economicreforms in 1978 followed this pattern, and by the early1990s, the nation was estimating that economic costs asso-ciated with ecological destruction and pollution hadreached as high as 14 percent of its gross national product(WRI et al. 1998:115–116). Hoping to reverse its environ-mental losses and reduce the health impacts of polluted airand water, China has recently begun a costly effort totighten and enforce its environmental regulations.
Sectoral Divisions. Other government-related factors alsoaffect the use of ecosystems. Government institutions, forexample, are routinely divided along sectoral lines—theMinistry of Agriculture, the Forest Department, the Envi-ronment Agency, and so on. This works against adoptingany integrated view of ecosystems or their management.The Ministry of Agriculture’s prime concern, for instance,will be farm production. Like an individual farmer, the Min-istry will likely see preserving biodiversity or minimizingforest conversion as peripheral to its mission. It may even
31C h a p t e r 1 : L i n k i n g P e o p l e a n d E c o s y s t e m s
(continues on p. 33)
E c o n o m i c s i g n a l s —
r e f l e c t e d i n p r i c e s a n d
g o v e r n m e n t p o l i c i e s — a r e
o n e o f t h e p r i m e f a c t o r s
d e t e r m i n i n g h o w w e t r e a t
e c o s y s t e m s . S u b s i d i e s
o f t e n e n c o u r a g e d a m a g i n g
a c t i v i t i e s t h a t w o u l d n o t
o t h e r w i s e b e e c o n o m i c a l l y
v i a b l e .

32W O R L D R E S O U R C E S 2 0 0 0 – 2 0 0 1
Box 1.14 Va l u i n g t h e I n va l u a b l e
The economic values we assign to our work andthe fruits of our labor are important factors in ourbehavior and the decisions we make about our
assets. Similarly, the values we assign to ecosystemassets—goods and services like pollination, water purifi-cation, nitrogen fixation, and carbon storage—are animportant factor in how we treat ecosystems. Yet becausethese services are not routinely bought and sold in mar-kets, there’s no easy way to calculate their worth. Toooften, decision makers and traditional economists simplyignore their value, essentially treating ecosystem goodsand services as though they will always be in profusesupply. A result is that loggers may harvest a patch offorest for the value of its timber alone, ignoring the valuethe forest provides in terms of flood control, water purifi-cation, or habitat for migratory songbirds.
How does one assign a monetary value to all the eco-logical amenities of an ecosystem? As the state of theart of economic analysis has improved, economists haveidentified a variety of tools to quantify direct—and evensome indirect and intangible—ecosystem services.
Where possible, actual market values are used. Forexample, the price of fish and shellfish harvested in anestuary provides one value for direct goods provided bythat ecosystem. Another way to estimate value is to cal-culate the cost of replacing an ecosystem service. ForNew York City, natural habitats in its upstate watershedwere shown to provide the same water purification ser-vices as a new water filtration plant. The $3–$8 billionprice tag (Ryan 1998) for the proposed filtration plant is agood base estimate of the value of the water purificationservice that the intact ecosystem provides—although itdoes not capture the value of the other watershed ser-vices including carbon sequestration, recreational op-portunities, and support for biodiversity.
Similarly, the price difference between two compara-ble houses, one near a shoreline and one inland, isthought to capture the aesthetic value of the shore. Stillanother market-based method of calculating a lake’s or apark’s or a wilderness area’s value, both as a scenic anda recreational site, is to calculate how much money andtime visitors spend to travel there.
When market data are not available, or to supplementthem, researchers resort to other means. They ask peo-ple what they’d pay, for example, to keep a wetland frombeing filled and developed or to prevent a wilderness
area from being mined. Properly done, such “contingentvaluation” surveys can go beyond measuring the practi-cal benefits humans extract from nature to encompassthe ethical and spiritual values they attach. But surveyscan be unreliable and subject to bias, especially whenpeople are queried about paying to minimize the effectsof something as complex as climate change.
Valuation exercises can be a useful policy tool in edu-cating audiences about the many ways we depend on andprofit from ecosystem services. Ultimately, however, cre-ating financial incentives for ecosystem conservation ismore important than finding an accurate market value forany or all ecosystem services. Incentives for conservationmay come from creating markets for ecosystem serviceswhere none exist, or finding other ways for landowners togain financially from the services their land provides.Auctioning permits to emit carbon or compensating coun-tries or companies that reforest land to sequester carbonare examples of ways to create such markets.
Ecotourism, where the beauty and unspoiled quality ofan ecosystem is marketed directly, may be another incen-tive to conserve. In South Africa, a private enterprisecalled Conservation Corporation negotiated with farm-ers to return 168 km2 of their land to its original habitatand stock it with big-game animals. Open for business asa safari destination, the land is now yielding $200–$300per hectare annually from visitor fees instead of $21–$68from ranching or farming, and providing a biologicallydiverse resource base to support the large game (Ander-son 1996:207; Honey 1999:374). In the Maldives, a govern-ment study determined that a single live shark yieldsapproximately US$33,500 annually in tourist revenue,compared to US$32 when caught and sold by a fisher-man. This and other studies supplied the incentive for theMaldives to make sharks, turtles, and dolphins protectedspecies (Sweeting et al. 1999:66, citing WTO 1997).
In some ways, “priceless” may be the most accuratevalue that we can ever place on intangible ecosystemgoods and services such as a coastal area’s beauty or amountain range’s spiritual importance. But used as oneof many measures of an ecosystem’s worth, and withrecognition of its limitations, environmental economicsoffers a powerful ecosystem management tool in a polit-ical world. Until we fully understand ecosystem values,we are handicapped in deciding what to use and what tosave.

see the Forest or Environment Departments as competitorsfor budget and administrative control, reducing the chancesof cooperation between agencies that manage ecosystems.This limited focus makes it unlikely that agencies as nowconfigured will recognize or account for the environmentaltrade-offs that their policies promote.
Corruption. Government corruption is another commoninstitutional failure that allows unchecked exploitation ofecosystems—often by a small elite. Even when laws and man-agement policies are sound, they may be undermined bygovernment officials who turn a blind eye to illegal harvest-ing or themselves take part in the plunder through sweet-heart deals or insider investments. The scale of corruptionin the forest sector, for example, is staggering. In Indone-sia, illegal logging accounts for more than half of thenation’s timber production, with timber smuggling takingplace in some national parks in full view of park authorities(EIA and Telepak 1999:4). As a result, the government losesan estimated US$1–$3 billion per year in timber royalties,and the forests suffer from haphazard cutting (WCFSD1999:36). Similarly, the Russian government collected onlya fraction—estimated at 3–20 percent—of the timber rev-enues it was due in 1994 (WCFSD 1999:36). The rest was lostto theft and fraud.
Who Owns Ecosystems?
Ownership is a crucial factor in how we manageecosystems. The question of who owns the landor has the right to use its resources is key indetermining what services or products are
reaped from an ecosystem, how they are harvested, and whogains the benefits. Some patterns of ownership can workagainst good management of ecosystems, as when propertyrights are concentrated in the hands of those whose eco-nomic interests may favor unsustainable harvest levels orextensive development.
PROPERTY RIGHTSIn 1985, Maxxam Corporation acquired the locally basedPacific Lumber Company in Northern California, owner ofthe state’s largest remaining tract of mature redwood forest.For years, Pacific Lumber had managed its forests to main-tain their long-term productivity, emphasizing moderateharvest levels that could continue to feed its lumber millsindefinitely. Maxxam quickly abandoned Pacific Lumber’smodest but sustainable harvest practices, more than dou-bling the harvest rate to help pay off its large corporate debt.Maxxam stockholders reaped the benefits of this short-termapproach, with little regard for its long-term effects on the
33C h a p t e r 1 : L i n k i n g P e o p l e a n d E c o s y s t e m s
(continues on p. 40)
T h e c h a l l e n g e f o r t h e 2 1 s t
c e n t u r y i s t o u n d e r s t a n d
t h e v u l n e r a b i l i t i e s a n d
r e s i l i e n c e o f e c o s y s t e m s ,
s o t h a t w e c a n f i n d w a y s t o
r e c o n c i l e t h e d e m a n d s o f
h u m a n d e v e l o p m e n t w i t h
t h e t o l e r a n c e s o f n a t u r e .

34W O R L D R E S O U R C E S 2 0 0 0 – 2 0 0 1
From African wildlife safaris, to diving tours in theCaribbean’s emerald waters and coral reefs, to guidedtreks in Brazil’s rainforests, nature-based tourism is
booming. The value of international tourism exceeds US$444billion (World Bank 1999:368); nature-based tourism maycomprise 40–60 percent of these expenditures and is increas-ing at 10–30 percent annually (Ecotourism Society 1998).
This burgeoning interest in traveling to wild or untram-meled places may be good news, especially for developingcountries. It offers a way to finance preservation of uniqueecosystems with tourist and private-sector dollars and toprovide economic opportunities for communities living nearparks and protected areas. For Costa Rica, tourism gener-ated $654 million in 1996, and for Kenya $502 million in 1997,much of it from nature and wildlife tourism (Honey 1999:133,296). Tourism has been influential in helping to protectRwanda’s mountain gorillas and their habitat in VolcanoesNational Park. Prior to the outbreak of civil war, tourist visitsprovided $1.02 million in direct annual revenues, enablingthe government to create antipoaching patrols and employlocal residents (Gossling 1999:310).
But the reality of nature-based travel is that it can bothsustain ecosystems and degrade them. Much nature-basedtourism falls short of the social responsibility ideals of “eco-tourism,” defined by the Ecotourism Society as “travel to nat-ural areas that conserves the environment and sustains thewell-being of local people” (Ecotourism Society 1998). Desti-nations and trips marketed as ecotourism opportunities mayfocus more on environmentally friendly lodge design thanlocal community development, conservation, or tourist educa-tion. Even some ecosystems that are managed carefully withecotourism principles are showing signs of degradation.
E c oto u r i s m ’s C o s t s a n d B e n ef i t sAt first glance, Ecuador’s Galápagos Islands epitomize thepromise of ecotourism. Each year the archipelago draws
more than 62,000 people who pay to dive, tour, and cruiseamidst the 120 volcanic islands and the ecosystem’s raretropical birds, iguanas, penguins, and tortoises. Tourismraises as much as $60 million annually, and provides incomefor an estimated 80 percent of the islands’ residents. Thetenfold increase in visitors since 1970 has expanded theresources for Ecuador’s park service. Tour operators, natu-ralist guides, park officials, and scientists have workedtogether to create a model for low-impact, high-quality eco-tourism (Honey 1999:101, 104, 107).
But closer examination reveals trade-offs: a flood ofmigrants seeking jobs in the islands’ new tourist economynearly tripled the area’s permanent population over a 15-yearperiod, turned the towns into sources of pollution, and addedpressure to fishery resources (Honey 1999:115, 117). Only 15percent of tourist income directly enters the Galápagoseconomy; most of the profits go to foreign-owned airlinesand luxury tour boats or floating hotels—accommodationsthat may lessen tourists’ environmental impacts, but providelittle benefit to local residents (Honey 1999:108, citing Epler1997). The hordes of tourists and immigrants have broughtnew animals and insect species that threaten the island’sbiodiversity (Honey 1999:54).
The Galápagos Islands well illustrate the complexities ofecotourism, including the potential to realize financial bene-fits nationally, even as problems become evident at the localor park scale. For example, to a government that is promot-ing ecotourism, more visitors means more income. But morevisitors can translate into damage to fragile areas. Park offi-cials often complain of habitat fragmentation, air pollutionfrom vehicle traffic, stressed water supplies, litter, and otherproblems. In Kenya’s Maasai Mara National reserve, illegalbut virtually unregulated off-road driving by tour operatorshas scarred the landscape (Wells 1997:40).
These impacts can be minimized with investments inpark management, protection, and planning. However, devel-
Box 1.15 E c oto u r i s m a n d C o n s e r vat i o n : A re T h ey C o m p at i b l e ?

35C h a p t e r 1 : L i n k i n g P e o p l e a n d E c o s y s t e m s
oping countries often lack the resources to monitor, evalu-ate, and prevent visitor impacts, and infrastructure and facil-ities may be rudimentary or nonexistent.
Low entrance fees are part of the problem; they oftenamount to just 0.01-1 percent of the total costs of a visitor’strip (Gossling 1999:309). Setting an appropriate park entryfee—one that covers the park’s capital costs and operatingcosts, and ideally even the indirect costs of ecological dam-age—is one way that management agencies can capture alarger share of the economic value of tourism in parks andprotected areas. Most parks have found that visitors arewilling to pay more if they know their money will be used toenhance their experience or conserve the special area. Toensure broad affordable access to parks, Peru, Ecuador,Kenya, Jordan, Costa Rica, and several other countries haveraised fees for foreigners while maintaining lower fees forresidents.
Unfortunately, tourism revenues are not always rein-vested in conservation. Of the US$3 million that GalápagosNational Park generates each year, for example, only about20 percent goes to the national park system. The rest goes togeneral government revenues (Sweeting et al. 1999:65). Thisis typical treatment of park income in many countries, but itundermines visitors’ support for the fees and destroys theincentive for managers to develop parks as viable eco-tourism destinations. Fortunately, some countries are usingspecial fees and tourism-based trust funds to explicitlychannel tourist dollars to conservation. Belize, for example,raises funds for conservation through a US$3.75 tourist taxlevied on every foreign visitor as they depart the country,generating about US$750,000 per year (Sweeting et al.1999:69).
Well-planned and -managed ecotourism offers greaterpotential to bolster local and rural economic development
than traditional tourism, in which most of the economic ben-efits linked to tourist expenditures “leak” back to commer-cial tour operators in the richer countries (where mosttourists originate) or are captured by large cities of the hostcountries (Wells 1997:iv). But increasing prices for land,food, and other products can coincide with the growing pop-ularity of a tourist or ecotourist haven, to the detriment oflocal residents. In Zanzibar, villagers and townspeople havebeen enticed into selling their property to tourism investorswho do not guarantee any profit sharing, joint ownership, orother form of sustained benefit (Honey 1999:287). In Tonga,tourism-driven inflation has caused shortages of arable land(Sweeting et al. 1999:29).
Some countries have introduced policies that help reim-burse local residents for the direct and indirect costs ofestablishing a protected area. Kenya, for example, aims toshare 25 percent of revenue from entrance fees with commu-nities bordering protected areas (Lindberg and Huber1993:106). Ecotourism planners also advocate sales of localhandicrafts in gift stores, patronage of local lodges, use oflocally grown food in restaurants and lodges, and trainingprograms to enable residents to fill positions as tour guides,hotel managers, and park rangers. Both tour operators andvisitors have a role to play by screening trips carefully andcommitting to ecotourist principles. Developers can choosesites based on environmental conditions and local support,and use sustainable design principles in building and resortconstruction.
Poorly planned, unregulated ecotourism can bring mar-ginal financial benefits and major social and environmentalcosts. But with well-established guidelines, involvement oflocal communities, and a long-term vision for ecosystemprotection rather than short-term profit by developers, eco-tourism may yet live up to its promise.

36W O R L D R E S O U R C E S 2 0 0 0 – 2 0 0 1
Many communities on the outer islands of Indonesia,and elsewhere in the developing world, use traditionalsystems of community-based, group tenure rights to
manage forest resources. Many of these management systemsare generations old and meet local economic needs whilemaintaining vital ecosystem functions, including protection ofbiodiversity (Lynch and Alcorn 1994:374, 381). Unfortunately,most of these systems are threatened by legal and develop-ment pressures.
In Indonesia, traditional community-based property rightsare called adat rights. Across the Indonesian archipelago, com-munities adapt adat rights to their specific economic and envi-ronmental needs. Agroforests in Sumatra and Kalimantan, forexample, are managed for rubber, durian fruits, illepe nuts,resins, and rattan.
Between 12 and 60 million people depend on Indonesia’sforests, with a substantial proportion practicing traditionalagroforestry (Poffenberger et al. 1997:22). Detailed informationis lacking, but research suggests much of this land is managedunder adat rights.
T h re at s to G r o u p Te n u reAdat rights in Indonesia face four significant threats:
■ Adat rights are not meaningfully recognized by the state,despite their widespread importance. The Indonesian Min-istry of Forestry manages and claims exclusive ownership of131 Mha of forest land—68 percent of Indonesia’s land area,including 90 percent of the Outer Islands. Even though gov-ernment planners admit knowledge of adat tracts is impor-tant in formulating sustainable resource management plans,the government does not know how much of this land is alsoclaimed under traditional group tenure regimes (Fox andAtok 1997:32; Peluso 1995:390–391).
■ State-sponsored development activities constantly overrideadat rights. Where 20-year timber concessions have beengranted, forest-based communities find their traditionalrights of use and access usurped (Lynch and Talbott1995:52–54). Government-directed development plans—including mining, transmigration settlements, and conver-
Box 1.16 U p r o ot i n g C o m m u n a l Te n u re i n I n d o n e s i a n Fo re s t s

37C h a p t e r 1 : L i n k i n g P e o p l e a n d E c o s y s t e m s
sion of forests to timber or oil palm plantations—degrade ordestroy these ecosystems (Michon and de Foresta1995:103–104). In East Kalimantan province, 30 percent ofLong Uli village land was lost to a government naturereserve, and 20 percent (including half of the village’s culti-vated land) was included in a timber concession, all withoutthe consent of or consultation with the villagers (Sirait et al.1994:416). Over the protests of villagers in eastern Malukuprovince, local government officials signed agreements withtimber companies granting them access to the village’sresin-producing agroforests, which were then destroyedwithout adequate compensation, thus undermining environ-mental sustainability and local economic stability (Zerner1992:31–33).
■ The imminent nature of state-sponsored development pro-jects provokes communities to overexploit their resourcebase. Faced with irretrievably losing control of their landsand resources, some forest-dependent communities willincautiously reap maximum harvests and, in the process,destroy the resource base (Lynch and Talbott 1995:98; Siraitet al. 1994:416).
■ Government policies that disproportionately reward agricul-tural production can also promote forest degradation. Morefavorable prices for agricultural commodities, relative tonontimber forest products, encourage farmers to pursue lesssustainable forms of agriculture than those used by tradi-tional agroforestry systems (Padoch and Pinedo-Vasquez1996:113).
N e w Ap p r o a c h e sMany conflicts would be mitigated if adat rights were legallyrecognized and granted political legitimacy. In 1998, before thefall of the Suharto government, the Indonesian Ministry ofForestry issued a decree that created a new land-use category,the kawasan dengan tujuan istemewa, or “area of special/extra-ordinary objective,” for 60 resin-producing agroforest villagesin the vicinity of Krui, Sumatra. The decree established aprocess for granting official use and management rights tolocal villages covering 29,000 ha of forest. The regulation wasthe first ever to grant legally recognized management rights tocommunity agroforesters.
Other important political and legal changes include Presi-dent Habibie’s emphasizing the importance of civil society andgovernmental accountability. The Basic Forest Law of 1999acknowledges that local people have a key role in sustainableforest management; however, it fails to recognize adat rights.Within the Forestry Ministry, a new regulation currently beingconsidered would authorize the demarcation of indigenous ter-ritories within areas designated as state forestland. The Min-
istry of Agrarian Affairs, in a related vein, has issued a decreeproviding for delineation and registration of community-basedadat rights in some forested areas (Lynch 2000).
Wider legal recognition of traditional community rights ofaccess to and management of forests in Indonesia could followthese important developments (Campbell 1998). Still needed,however, are clearer policies on adat rights that also definelocal and state rights and responsibilities (Bromley andCernea 1989:52; Lynch and Alcorn 1994:376–377).
Current progress toward wider legal recognition of localtenure by the Indonesian government, however, is fragile inlight of the country’s recent economic and political turmoil.Similar efforts to promote legal recognition of group tenure inThailand and the Philippines are also at precarious stages.
At current population growth rates, tensions betweendevelopment and sustainability are sure to continue. An addi-tional 15–33 Mha of forest in Indonesia is expected to sufferdeforestation by 2020 (Lynch 2000). Plans are already under wayto create more pulp, paper, and oil palm plantations, all ofwhich replace natural forests (Barber 1997:74).
Logged-over areas of natural forest currently provide for-est-dependent communities space for agriculture, grazing, andcollection of forest products such as timber, rattan, and rubber.Converting these areas to intensively managed pulp and oilpalm plantations will permanently exclude local populations;their claims to resources, which had tenuous legitimacy before,will be made irrelevant (Barber 1997:75). Securing the commu-nity-based property rights of Indonesia’s forest-dependentcommunities would help to both protect the interests ofIndonesia’s rural inhabitants and promote environmentalsustainability.

38W O R L D R E S O U R C E S 2 0 0 0 – 2 0 0 1
Near a rural Bengali village, peasant families search-ing for firewood pick a local forest patch clean. Arefugee from war-torn Rwanda flees to Tanzania
where he poaches game in a national park to feed his family.A poor Kenyan family continues to cultivate their small farmplot in spite of severe erosion and exhausted soil. These arethe typical images of the rural poor—people hugely depen-dent on ecosystems, unable to afford sound managementpractices, and caught in a vicious cycle of overusing alreadyfragile and degraded resources.
A more nuanced view has emerged, however, that recog-nizes that the poor may have limited resources and greatdependence on the environment, but they also have consider-able ability to protect their ecosystems, when given theopportunity. Research is bringing to light abundant examplesof adaptation—strategies that the poor use to lessen theimpacts of environmental, economic, or social change on theirresources. Adaptive measures include innovative land-usepractices, the adoption of new technologies, economic diver-sification, and changes in social organization (Batterbury andForsyth 1999:8).
W h o A re t h e Po o r ?Approximately 1.3 billion people, one-quarter of the world’spopulation, live on about $1 a day (World Bank 1999:117). Inaddition to encompassing insufficient financial assets,poverty often means a lack of education, mobility, employ-ment opportunities, or access to basic services such as safewater, and physical isolation in remote villages. Limitedaccess to land is another key aspect of poverty; 52 percent ofthe rural poor have landholdings too small to provide an ade-quate income, and 24 percent are landless (UNCHS 1996:109).
The vulnerability of the poor is often exacerbated by a lackof political power to defend their rights to environmentalresources or defend themselves against outright oppression.In South and Southeast Asian countries, for example, manygovernments consider forest-dependent people to be squat-ters who are illegally using state-owned resources. They canbe arbitrarily displaced, often with state sanction, no matterhow long they have occupied the forest (Lynch and Talbott1995:21). War and civil conflict in Central and Eastern Europe,Somalia, the Congo, Lebanon, and other countries have tornpeople from their land and plunged them into poverty.
Urban poverty is a growing phenomenon, but the largestnumbers of poor people in developing countries still live inrural areas—as much as 80 percent in 1988 (Jazairy et al.1992:1). Many struggle to subsist on lands variously describedas “poverty traps,” “less favored,” or “marginal.” These tendto be areas of high ecological vulnerability (such as subtropi-cal drylands or steep mountain slopes) or low levels of bio-logical or resource productivity combined with high human
demands. There may be almost twice as many poor living onmarginal lands as on favored lands in developing countries—630 million compared to 325 million (CGIAR et al. 1997). If cur-rent trends in poverty and natural resource degradation per-sist, by 2020 more than 800 million people could be living onless favored lands, places like the upper watersheds of theAndes and the Himalayas, the East African highlands, and theSahel (Hazell and Garrett 1996).
P r ote ct i n g T h e i r E c o s y s te m sIt is increasingly evident that the poor can fight back againstenvironmental degradation. In some places, they have beenfighting back for centuries, using adaptive measures when-ever ecosystem changes have demanded them.
One example of adaptation can be found in the highlandsof Papua New Guinea, where the Wola people grow crops onslopes cleared of native forests by means of slash and burntechniques. Instead of accelerating soil exhaustion and fur-thering deforestation, as traditional models would predict, theWola have maintained soil fertility by constructing mounds ofsoil using rotting vegetation as compost. They select strategi-cally what crops to plant, using a variety of crops in the firstyears of cultivation when soils are rich. In later years whensoil fertility declines, the Wola plant only sweet potatoes, acrop that can thrive without many nutrients (Batterbury andForsyth 1999:8, citing Sillitoe 1998 and Sillitoe 1996).
The Mossi people in Burkina Faso offer other examples ofsuccessful adaptation. As rapid population growth and fre-quent droughts have degraded their soils, Mossi farmers haveresponded by creating compost pits and building diguettes—semipermeable lines of stone placed at right angles to theslope to prevent erosion (Batterbury and Forsyth 1999:9–10).The significant number of Mossi who have migrated to citiesor the neighboring country of Cote d’Ivoire for wage employ-ment during the dry season is also an adaptive response thatreduces pressures on the land and food supply, providesremittances for families, and diversifies income sources. Likeall adaptations, however, these local strategies have theirlimitations. Severe drought or a shortage of nonfarm jobopportunities can undermine the Mossi’s successes.
A third adaptation example comes from the forest-savanna zone of Guinea in West Africa. For 200 years,researchers erroneously blamed the Kissi and Kuranko peoplefor the deforestation of a large forest in the Kissidougouprovince. Research into historical land-cover patterns eventu-ally revealed that the Kissi and Kuranko had actually createdpatches of forest on relatively treeless savannas through tar-geted burning to reduce the risk of fire and to increase soilfertility, and by tethering animals and promoting fast-growingtree species (Batterbury and Forsyth 1999:10–11, citing Fair-head and Leach 1996).
Box 1.17 R u ra l Pove r t y a n d A d a p tat i o n

39C h a p t e r 1 : L i n k i n g P e o p l e a n d E c o s y s t e m s
Examples of Indigenous Soil and Water Conservation Techniques in Selected West African Countries
Population Density
Country Rainfall (mm) (per km2) Indigenous Soil and Water Conservation Techniques
Burkina Faso 1,000–1,100 35 Stone bunds in slopes network of earth bunds and drainage channels in lowlands
1,000 35–80 Contour stone bunds on slopes, drainage channels
400–700 29 Stone lines, stone terraces, planting pits
Cameroon 800–1,100 80–250 Bench terraces (0.5–3 m high), stone bunds
Cape Verde 400–1,200 (uplands) >100 Dry stone terraces (walls 1–2 m high), rectangular basins (approx. 2 m x 4 m)
Chad 250–650 5–6 Water harvesting in drier regions: various earth bunding systems with upslope wingwalls and catchment area
Niger 300–500 Stone lines, planting pits
Nigeria 1,000–1,500 110–450 Stepped, level benched stone terraces, rectangular ridges, mound cultivation
Mali 400 20–30 Pitting systems
500–650 13–85 Cone shaped mounds, planting holes, terraces square basins, stone lines, bunds or low walls
Sierra Leone 2,000–2,500 38 Sticks and stone bunding on fields and drainage techniques in gullies
Togo 1,400 80 Bench terraces and contour bunds, (rectangular) mound cultivation
Source: IFAD 2000.
Adaptation is not confined to rural areas. In cities thepoor supplement their diets and income by transformingvacant lots, rooftops, and the lands along roadsides andother rights-of-way into highly productive plots of vegeta-bles, fruits, and trees. As food and fuel are the largesthousehold expenses for low-income urban populations,urban agriculture can be a first line of defense againsthunger and malnutrition. Shantytown dwellers who mobilizeto secure access to water and sanitation and improve theirenvironments are engaging in another form of adaptation.But adaptation can be more difficult in cities, where a com-munity’s response may be more dependent on access to andsupport from local and state governments, corporations, orinternational agencies. In addition, many environmental risksare relatively new or beyond the experience of the urbanpoor, or difficult to detect, such as solvent or lead poisoning(Forsyth and Leach 1998:26).
How a community adapts to ecosystem decline dependson the knowledge that individuals have and the local biophysi-cal environment, such as rainfall and soil conditions. Eco-nomic and political factors such as the availability of laborand access to markets also are crucial.
Governments, NGOs, and development agencies can helpthe poor respond positively to natural resource managementchallenges by working with local residents—supportinglocally designed adaptations and community-based institu-tions, creating employment opportunities, and providing newknowledge, technical and marketing assistance, training, and
credit. Those institutions also can hinder adaptations andprogress against poverty. Limiting the voice of the poor inresource management decisions or denying local peoplesecurity of tenure and rights of access to resources areamong the most detrimental factors. Without recognition oftraditional tenure rights and grants of control over resources,the poor have less incentive and capacity to adapt.
Experiences of the people of Sukhomajri, India, illustratethe difference that stable tenure systems can make in thehealth of an ecosystem. Twenty years ago, the forest depart-ment granted villagers the right to harvest the grass in thewatershed for a nominal fee, rather than auctioning the grassto a contractor who, in turn, would charge the villagers highrates for the grass (Agarwal and Narain 1999:16). With theassurance that they would reap the benefits of increased bio-mass production, villagers identified ways to protect thewatershed—regulating livestock grazing, investing in the con-struction of water tanks for increased crop production, andsustainably harvesting wood from the forest that lies withinthe catchment. By the mid-1980s, Sukhomajri was no longerimporting food but exporting it. Between 1979 and 1984,household income increased from Rs 10,000 to Rs 15,000. Thevillage also earns about Rs 350,000 annually from the sale ofmilk, and another Rs 100,000 from the sale of bhabhar—afibrous grass that can be used as fodder and sold to papermills (Agarwal and Narain 1999:16). The result—a oncedegraded watershed is today a wetter, greener, more produc-tive and prosperous area.

local economy or the health and productivity of the forest(Harris 1996:130–135, 170–171; LOE 1996:12–18).
Lack of ownership can also be a problem. Many of theworld’s poor lack legal property rights—tenure—over thelands they live on. A poor farmer without secure land tenuremay not feel much incentive to consider long-term produc-tivity because he or she has no assurance of being able tostay and capitalize on any investments in good soil or watermanagement. In fact, lack of legal title tends to discouragesome land uses, like agroforestry, that are relatively benignto ecosystems but require long periods to reach peak pro-ductivity (Scherr 1999). In addition, landless immigrants,often fleeing unemployment and poverty or civil strife inmore populated regions, have been important contributorsto deforestation in frontier areas as they clear forest plots forsubsistence farming. In some instances, clearing forestareas is actually a means to gain land title, since it convertsthe land to agriculture—a legally recognized land use.
Sometimes, modern systems of private or state owner-ship can conflict with more traditional forms of group orcommunity ownership, with the environment suffering as aconsequence. Cultures around the world have developed sys-tems of communal management of shared resources to con-trol overharvesting. Forests in Indonesia, rangelands inMongolia, and coastal fishing areas in the Philippines areall current examples. An extensive literature documentsthat these traditional systems of property rights and com-munal management can be very effective at preservingecosystems over the long term even as they are routinely har-vested. Nonetheless, governments often ignore these tradi-tional forms of ownership, denying them legal recognition.
POVERTYThe question of who owns ecosystems and their benefitsultimately becomes a question of equity. Those with prop-erty rights or with the money to buy consumer items aremost likely to control the goods and services that ecosys-tems produce and to influence how ecosystems are man-aged. Yet it is the poor who are most directly dependent onecosystems for their immediate survival and therefore mostvulnerable when ecosystems decline. Subsistence farmersand others who cannot afford fertilizers depend on naturalsoil fertility; and subsistence fishers depend on the contin-ued productivity of lakes, rivers, estuaries, and coastal wet-lands. When these systems are depleted, impoverished peo-ple can’t insulate themselves from the effects as the wealthycan. They must bear the costs of lost ecosystem servicesdirectly.
The connection between poverty and the environment iscomplex. In many instances, poverty contributes to pres-sures on ecosystems. Roughly half of the world’s poorestpeople live on marginal lands—arid areas, steep slopes, andthe like—that are prone to degradation (UNDP 1998:66).Even when the slope erodes, or the fish harvest tapers off,
the poor often have no choice but to keep depleting theresource or to convert other vulnerable areas for use.
But this isn’t always the case. In fact, the poor can be asource of conservation and environmental protection aswell (Scherr 1999). Many people around the world havelearned to extract goods from marginal systems without fur-ther degradation. For instance, the Mien people of thenorthern highlands of Thailand center their cultivation onthe least erosive slopes, allowing local forests to remainintact and even expand (Batterbury and Forsyth 1999:8).Similar successes, as a result of diversifying both crops andincome-generating activities, are taking place in theMachakos region of Kenya (see Chapter 3, Regaining theHigh Ground: Reviving the Hillsides of Machakos), the dry-lands and forests of West Africa, and other areas.
Manag ing for Ecosystem Hea l th
W ell-managed ecosystems can provide a rangeof benefits over the long term. We canchoose to emphasize one or a few benefitsover others—timber production over
scenery, more food over unbroken forests, hydropower overfish harvests—but each choice has a consequence. Poor man-agement choices in the past have often needlessly degradedecosystems, yielding fewer goods and services today whendemand is rising quickly. Retaining the productive capacityof ecosystems in the face of the trade-offs we make marks thedifference between good and poor management.
But what does it take to manage ecosystems so that theyremain resilient and productive, so that they retain—orrecover—their health? We are still struggling to find out.There is no standard measure of ecosystem health orresilience. How much productivity should we expect fromecosystems, and how much degradation can we tolerate?How much can we repair what we have broken, and howmuch will it cost?
Certainly, answering these questions requires a funda-mental knowledge of ecosystem processes and the relation-ship between various goods and services. Yet these are not sci-entific questions alone. They are also matters of societaljudgment, of economics, and even of ethics. We may chooseto forgo harvesting a tract of old-growth forest simply becauseit is a beautiful and rare habitat, or we may deem it more ben-eficial used as lumber for housing and left to regenerate assecond growth. In either case, the forest may persist in a vitalstate, but deliver a very different complement of benefits.
Whatever we decide, our opportunities to improve ourmanagement of ecosystems are substantial. Our under-standing of how ecosystems function, of the links betweenthem and their biological limits, and of their total value hasimproved significantly in just a few short decades. Satellites
40W O R L D R E S O U R C E S 2 0 0 0 – 2 0 0 1

and improved measurement techniques have heightenedour ability to monitor ecosystems and measure the results ofour management. Ecosystem restoration techniques havealso advanced, giving the hope that some recovery of pro-ductivity is possible (Parrotta and Turnbull 1997). And,more and more, governments and communities have begunto understand the link between ecosystem health and theirown economic prosperity and quality of life. Many havealready started to define for themselves what sustainableecosystem management might be—a regional approach towatershed management, perhaps, or land-use restrictionsthat seek to cluster suburban development rather thanencourage sprawl.
The very process of global development, although itplaces greater pressures on ecosystems, can also be a posi-tive force, changing the way we look at and manage ecosys-tems. As personal incomes rise and education and environ-mental awareness expand, the value we place on intactecosystems will surely grow as well (Panayotou 1999). Thisis already in evidence in wealthier nations. The demand fornature-based tourism, for example, has started to increasesharply. Initiatives to preserve farmland and curb suburbansprawl have begun in many urban areas. Ambitious projectsto restore threatened ecosystems such as the Rhine River orthe Florida Everglades have garnered political and financialbacking. These projects are evidence of a growing desire toexperience and conserve ecosystems, and a willingness topay for it.
Despite these positive signs, the challenge of definingequitable and sustainable ecosystem management at aglobal level should not be minimized. It includes asking our-selves such difficult questions as:
■ How can we manage watersheds and water resources inthe face of potential increases in demand of up to 50 per-cent for irrigation water and up to 100 percent for indus-trial water by 2025 (WMO 1997:19–20)?
■ Even if irrigation water can be found, how can we inten-sify our agriculture enough to feed future populationswithout increasing the damage from nutrient and pesti-cide runoff or without continuing to convert forests andother ecosystems to croplands?
■ How can we continue to supply the roughly 1 m3 of woodproducts per year that the average person consumeswithout decimating existing forests? And what if wooddemand doubles in the next 50 years, as some project(Watson et al. 1998:18)?
■ How can we lessen the impact of climate change onecosystems given that CO2 emissions will likely increaseas the global economy grows, at least in the short term?
■ How can we reduce the impacts of urban areas—fromsprawl to water use to air pollution and solid waste gen-eration—on surrounding ecosystems as urban popula-tions rise to an estimated 5 billion by 2025 (UNPD1997)?
We have no option but to confront these and similar ques-tions. Our dependence on ecosystems is growing, not dimin-ishing. The productivity of ecosystems, once it is lostthrough poor management, is difficult and costly to replace.
Tackling these issues will require new strategies thatreach across political boundaries without losing criticallocal support. These, in turn, will rely on an ever clearerunderstanding of the real state of global ecosystems—howmuch we have and how much we stand to lose without bettermanagement. As a first step, Chapter 2 presents the resultsof a comprehensive, albeit preliminary, assessment of theworld’s major ecosystems. The hope is that such back-ground knowledge can help to reveal the trade-offs we havealready made and crystallize the management choices thatremain to us.
41C h a p t e r 1 : L i n k i n g P e o p l e a n d E c o s y s t e m s