Embed Size (px)
Citation preview
PRACTICAL APPLICATION OF THE UKOOA IGNITION MODEL
Brian Bain, Matthew Celnik and Geir Korneliussen
Det Norske Veritas Limited, UK
The UKOOA ignition model [Ignition Probability Review, Model Development and Look-up Cor-
relations; The Energy Institute, London; 2006] is the UK offshore industry standard for determining
the ignition probability of flammable releases on offshore installations. As the model is dependent
on a large number of parameters, several look-up correlations were developed for typical onshore
and offshore modules, to reduce the model to a limited set of parameters. There remains some
debate about how these look-up correlations can best be applied in order to describe all conditions
satisfactorily.
A number of enhancements and clarification to the existing look-up correlations for offshore
installations are proposed. The hot-work hours for a typical offshore module was defined in the
original model as 15 hours/year, however, this may be considered very low if substantial works
are undertaken. Therefore, an enhancement to the look-up correlations is proposed to account
for increased hot-work hours. A change to the model to allow users to specify different splits
between immediate and delayed ignition is also proposed.
INTRODUCTIONIn the field of QRA there are many areas where both themethodology and specific data to be applied to a problemhave a degree of uncertainty. Of these various areas, thetopic of ignition probability perhaps has the greatest levelof uncertainty. Various formulations have been proposedand practitioners have been aware that these can lead to awide range of calculated probabilities for the same situation.This is significant since a large proportion of the risks toboth onshore and offshore installations and personsworking in them come from ignited hydrocarbon and chemi-cal releases, and the ignition probability is a direct multi-plier for these. Consequently, the accuracy of the ignitionprobability has a large effect on the overall calculated riskfigures and therefore on the assessment of measures whichmay be deemed necessary to reduce these risks.
In the UK an attempt to address this situation was madein a project undertaken by ESR Technology, co-sponsored bythe United Kingdom Offshore Operators Association(UKOOA) (now Oil & Gas UK), the Health and SafetyExecutive (HSE) and the Energy Institute (EI) and with con-tributions from operators and other technical consultancies.The work culminated in the issue of the report published bythe Energy Institute entitled “Ignition Probability Review,Model Development and Look-Up Correlations” in January2006 [1]. The review element of the work concluded thatthe commonly applied approach, up to that point, of adoptinggeneric correlation based on mass release rates was overlysimplistic and lead to overly conservative estimates in somesituations. A new model was developed which drew largelyon the work of DNV [2], WS Atkins [3] and the “GasBuild-up JIP Workbook” [4]. The new model wasimplemented within an Excel workbook distributed withthe EI report [1].
It was recognised that the work involved in collectinga large amount of data for the full model may be too onerousfor some risk assessments. Consequently, the EI report [1]also describes a second phase of the work in which the
full model was used to develop a series of correlationsbased on the mass release rate. Although it was intendedthat the look-up correlation version be used in certain cir-cumstances, such as concept studies or where there wasinsufficient data to populate the full model, it has becomecommon practice to use the correlations in all QRA workbecause of the relative ease of implementation.
The model has become generally referred to as the“UKOOA Ignition Model” despite the fact that the UnitedKingdom Offshore Operators Association “UKOOA” effec-tively became Oil and Gas UK in 2007. This name is givento both the full model and the simplified look-up correlationversion. However, the predominant use of the latter meansthat it is this version which practitioners normally meanwhen referring to the “UKOOA ignition Model”. Thecurves are illustrated in the OGP Risk Assessment dataDirectory [5].
This paper looks at five topics associated with the useof the model which may improve its ease of use or its accu-racy. These are presented in summarised form to provide anoverview.
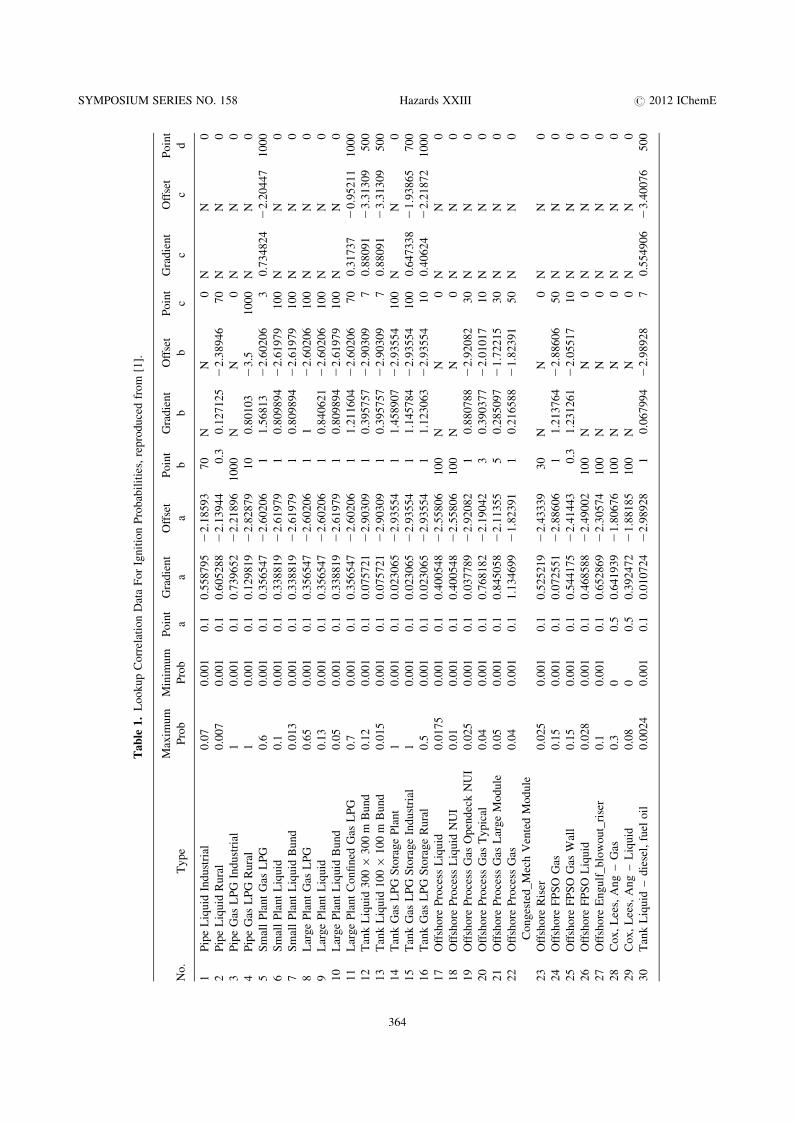
CHANGED TABULATIONThe data underlying the lookup correlations is presented in atable within the report [1] and replicated in Table 1.
In essence the data describes a number of releaserate/ignition probability pairs between which the ignitionprobability for the required release rate can be obtained bylogarithmic interpolation but subject to remaining withindefined limits, that is the “Maximum Prob” and “MinimumProb” columns in Table 1. However, in this format the shapeof the correlation is difficult to visualise and the equationsfor calculating the ignition probability for a given releaserate is more complex than it needs to be.
An alternative tabulation is presented below in whichthe co-ordinates of the points between which logarithmicinterpolation can take place are given explicitly. This is pre-sented in Table 2.
SYMPOSIUM SERIES NO. 158 Hazards XXIII # 2012 IChemE
363
Tab
le1.
Lookup
Corr
elat
ion
Dat
aF
or
Ignit
ion
Pro
bab
ilit
ies,
rep
roduce
dfr
om
[1].
No.
Type
Max
imum
Pro
b
Min
imum
Pro
b
Poin
t
a
Gra
die
nt
a
Off
set
a
Poin
t
b
Gra
die
nt
b
Off
set
b
Poin
t
c
Gra
die
nt
c
Off
set
c
Poin
t
d
1P
ipe
Liq
uid
Indust
rial
0.0
70.0
01
0.1
0.5
58795
22.1
8593
70
NN
0N
N0
2P
ipe
Liq
uid
Rura
l0.0
07
0.0
01
0.1
0.6
05288
22.1
3944
0.3
0.1
27125
22.3
8946
70
NN
0
3P
ipe
Gas
LP
GIn
dust
rial
10.0
01
0.1
0.7
39652
22.2
1896
1000
NN
0N
N0
4P
ipe
Gas
LP
GR
ura
l1
0.0
01
0.1
0.1
29819
22.8
2879
10
0.8
0103
23.5
1000
NN
0
5S
mal
lP
lant
Gas
LP
G0.6
0.0
01
0.1
0.3
56547
22.6
0206
11.5
6813
22.6
0206
30.7
34824
22.2
0447
1000
6S
mal
lP
lant
Liq
uid
0.1
0.0
01
0.1
0.3
38819
22.6
1979
10.8
09894
22.6
1979
100
NN
0
7S
mal
lP
lant
Liq
uid
Bund
0.0
13
0.0
01
0.1
0.3
38819
22.6
1979
10.8
09894
22.6
1979
100
NN
0
8L
arge
Pla
nt
Gas
LP
G0.6
50.0
01
0.1
0.3
56547
22.6
0206
11
22.6
0206
100
NN
0
9L
arge
Pla
nt
Liq
uid
0.1
30.0
01
0.1
0.3
56547
22.6
0206
10.8
40621
22.6
0206
100
NN
0
10
Lar
ge
Pla
nt
Liq
uid
Bund
0.0
50.0
01
0.1
0.3
38819
22.6
1979
10.8
09894
22.6
1979
100
NN
0
11
Lar
ge
Pla
nt
Confi
ned
Gas
LP
G0.7
0.0
01
0.1
0.3
56547
22.6
0206
11.2
11604
22.6
0206
70
0.3
1737
20.9
5211
1000
12
Tan
kL
iquid
300×
300
mB
und
0.1
20.0
01
0.1
0.0
75721
22.9
0309
10.3
95757
22.9
0309
70.8
8091
23.3
1309
500
13
Tan
kL
iquid
100×
100
mB
und
0.0
15
0.0
01
0.1
0.0
75721
22.9
0309
10.3
95757
22.9
0309
70.8
8091
23.3
1309
500
14
Tan
kG
asL
PG
Sto
rage
Pla
nt
10.0
01
0.1
0.0
23065
22.9
3554
11.4
58907
22.9
3554
100
NN
0
15
Tan
kG
asL
PG
Sto
rage
Indust
rial
10.0
01
0.1
0.0
23065
22.9
3554
11.1
45784
22.9
3554
100
0.6
47338
21.9
3865
700
16
Tan
kG
asL
PG
Sto
rage
Rura
l0.5
0.0
01
0.1
0.0
23065
22.9
3554
11.1
23063
22.9
3554
10
0.4
0624
22.2
1872
1000
17
Off
shore
Pro
cess
Liq
uid
0.0
175
0.0
01
0.1
0.4
00548
22.5
5806
100
NN
0N
N0
18
Off
shore
Pro
cess
Liq
uid
NU
I0.0
10.0
01
0.1
0.4
00548
22.5
5806
100
NN
0N
N0
19
Off
shore
Pro
cess
Gas
Open
dec
kN
UI
0.0
25
0.0
01
0.1
0.0
37789
22.9
2082
10.8
80788
22.9
2082
30
NN
0
20
Off
shore
Pro
cess
Gas
Typic
al0.0
40.0
01
0.1
0.7
68182
22.1
9042
30.3
90377
22.0
1017
10
NN
0
21
Off
shore
Pro
cess
Gas
Lar
ge
Module
0.0
50.0
01
0.1
0.8
45058
22.1
1355
50.2
85097
21.7
2215
30
NN
0
22
Off
shore
Pro
cess
Gas
Conges
ted_M
ech
Ven
ted
Module
0.0
40.0
01
0.1
1.1
34699
21.8
2391
10.2
16588
21.8
2391
50
NN
0
23
Off
shore
Ris
er0.0
25
0.0
01
0.1
0.5
25219
22.4
3339
30
NN
0N
N0
24
Off
shore
FP
SO
Gas
0.1
50.0
01
0.1
0.0
72551
22.8
8606
11.2
13764
22.8
8606
50
NN
0
25
Off
shore
FP
SO
Gas
Wal
l0.1
50.0
01
0.1
0.5
44175
22.4
1443
0.3
1.2
31261
22.0
5517
10
NN
0
26
Off
shore
FP
SO
Liq
uid
0.0
28
0.0
01
0.1
0.4
68588
22.4
9002
100
NN
0N
N0
27
Off
shore
Engulf
_blo
wout_
rise
r0.1
0.0
01
0.1
0.6
52869
22.3
0574
100
NN
0N
N0
28
Cox,
Lee
s,A
ng
–G
as0.3
00.5
0.6
41939
21.8
0676
100
NN
0N
N0
29
Cox,
Lee
s,A
ng
–L
iquid
0.0
80
0.5
0.3
92472
21.8
8185
100
NN
0N
N0
30
Tan
kL
iquid
–die
sel,
fuel
oil
0.0
024
0.0
01
0.1
0.0
10724
22.9
8928
10.0
67994
22.9
8928
70.5
54906
23.4
0076
500
SYMPOSIUM SERIES NO. 158 Hazards XXIII # 2012 IChemE
364
Tab
le2.
Lookup
Corr
elat
ion
Dat
aP
rese
nte
din
Alt
ernat
ive
Form
Poin
t1
Poin
t2
Poin
t3
Poin
t4
Poin
t5
Poin
t6
Poin
t7
Cas
e
No.
Cas
eD
escr
ipti
on
Q(k
g/s
)P
ign
Q(k
g/s
)P
ign
Q(k
g/s
)P
ign
Q(k
g/
s)P
ign
Q(k
g/s
)P
ign
Q(k
g/s
)P
ign
Q(k
g/
s)P
ign
1P
ipe
Liq
uid
Indust
rial
0.0
10.0
0100
0.0
3493
0.0
0100
0.1
00
0.0
0180
70.0
00
0.0
7000
100000
0.0
7000
2P
ipe
Liq
uid
Rura
l0.0
10.0
0100
0.0
3787
0.0
0100
0.1
00
0.0
0180
0.3
00
0.0
0350
70.0
00
0.0
0700
70.0
00
0.0
0700
100000
0.0
0700
3P
ipe
Gas
LP
GIn
dust
rial
0.0
10.0
0100
0.0
8791
0.0
0100
0.1
00
0.0
0110
1000
1.0
0000
100000
1.0
0000
4P
ipe
Gas
LP
GR
ura
l0.0
10.0
0100
0.0
4799
0.0
0100
0.1
00
0.0
0110
10.0
00
0.0
0200
1000.0
00
0.0
8000
23408.5
47
1.0
0000
100000
1.0
0000
5S
mal
lP
lant
Gas
LP
G0.0
10.0
0100
0.0
7654
0.0
0100
0.1
00
0.0
0110
1.0
00
0.0
0250
3.0
00
0.0
1400
498.9
91
0.6
0000
100000
0.6
0000
6S
mal
lP
lant
Liq
uid
0.0
10.0
0100
0.0
7548
0.0
0100
0.1
00
0.0
0110
1.0
00
0.0
0240
100.0
00
0.1
0000
100000
0.1
0000
7S
mal
lP
lant
Liq
uid
Bund
0.0
10.0
0100
0.0
7548
0.0
0100
0.1
00
0.0
0110
1.0
00
0.0
0240
8.0
53
0.0
1300
100.0
00
0.0
1300
100000
0.0
1300
8L
arge
Pla
nt
Gas
LP
G0.0
10.0
0100
0.0
7654
0.0
0100
0.1
00
0.0
0110
1.0
00
0.0
0250
100.0
00
0.2
5000
260.0
00
0.6
5000
100000
0.6
5000
9L
arge
Pla
nt
Liq
uid
0.0
10.0
0100
0.0
7654
0.0
0100
0.1
00
0.0
0110
1.0
00
0.0
0250
100.0
00
0.1
2000
109.9
90
0.1
3000
100000
0.1
3000
10
Lar
ge
Pla
nt
Liq
uid
Bund
0.0
10.0
0100
0.0
7548
0.0
0100
0.1
00
0.0
0110
1.0
00
0.0
0240
42.4
92
0.0
5000
100.0
00
0.0
5000
100000
0.0
5000
11
Lar
ge
Pla
nt
Confi
ned
Gas
LP
G0.0
10.0
0100
0.0
7654
0.0
0100
0.1
00
0.0
0110
1.0
00
0.0
0250
70.0
00
0.4
3000
325.0
28
0.7
0000
100000
0.7
0000
12
Tan
kL
iquid
300×
300
mB
und
0.0
10.0
0100
0.0
5250
0.0
0100
0.1
00
0.0
0105
1.0
00
0.0
0125
7.0
00
0.0
0270
519.6
17
0.1
2000
100000
0.1
2000
13
Tan
kL
iquid
100×
100
mB
und
0.0
10.0
0100
0.0
5250
0.0
0100
0.1
00
0.0
0105
1.0
00
0.0
0125
7.0
00
0.0
0270
49.0
35
0.0
1500
100000
0.0
1500
14
Tan
kG
asL
PG
Sto
rage
Pla
nt
0.0
10.0
0104
0.0
0160
0.0
0100
0.1
00
0.0
0110
1.0
00
0.0
0116
100.0
00
0.9
6000
102.8
38
1.0
0000
100000
1.0
0000
15
Tan
kG
asL
PG
Sto
rage
Indust
rial
0.0
10.0
0104
0.0
0160
0.0
0100
0.1
00
0.0
0110
1.0
00
0.0
0116
100.0
00
0.2
2700
988.1
06
1.0
0000
100000
1.0
0000
16
Tan
kG
asL
PG
Sto
rage
Rura
l0.0
10.0
0104
0.0
0160
0.0
0100
0.1
00
0.0
0110
1.0
00
0.0
0116
10.0
00
0.0
1540
52551.5
38
0.5
0000
100000
0.5
0000
17
Off
shore
Pro
cess
Liq
uid
0.0
10.0
0100
0.0
7882
0.0
0100
0.1
00
0.0
0110
100.0
00
0.0
1750
100000
0.0
1750
18
Off
shore
Pro
cess
Liq
uid
NU
I0.0
10.0
0100
0.0
7882
0.0
0100
0.1
00
0.0
0110
24.7
31
0.0
1000
100.0
00
0.0
1000
100000
0.0
1000
19
Off
shore
Pro
cess
Gas
Open
dec
kN
UI
0.0
10.0
0101
0.0
0803
0.0
0100
0.1
00
0.0
0110
1.0
00
0.0
0120
30.0
00
0.0
2400
31.4
23
0.0
2500
100000
0.0
2500
20
Off
shore
Pro
cess
Gas
Typic
al0.0
10.0
0100
0.0
8833
0.0
0100
0.1
00
0.0
0110
3.0
00
0.0
1500
10.0
00
0.0
2400
37.0
08
0.0
4000
100000
0.0
4000
21
Off
shore
Pro
cess
Gas
Lar
ge
Module
0.0
10.0
0100
0.0
8933
0.0
0100
0.1
00
0.0
0110
5.0
00
0.0
3000
30.0
00
0.0
5000
100000
0.0
5000
22
Off
shore
Pro
cess
Gas
Conges
ted_M
ech
Ven
ted
Module
0.0
10.0
0100
0.0
9194
0.0
0100
0.1
00
0.0
0110
1.0
00
0.0
1500
50.0
00
0.0
3500
92.6
24
0.0
4000
100000
0.0
4000
23
Off
shore
Ris
er0.0
10.0
0100
0.0
8340
0.0
0100
0.1
00
0.0
0110
30.0
00
0.0
2200
38.2
67
0.0
2500
100000
0.0
2500
24
Off
shore
FP
SO
Gas
0.0
10.0
0100
0.0
2688
0.0
0100
0.1
00
0.0
0110
1.0
00
0.0
0130
50.0
00
0.1
5000
100000
0.1
5000
25
Off
shore
FP
SO
Gas
Wal
l0.0
10.0
0100
0.0
8393
0.0
0100
0.1
00
0.0
0110
0.3
00
0.0
0200
10.0
00
0.1
5000
100000
0.1
5000
26
Off
shore
FP
SO
Liq
uid
0.0
10.0
0100
0.0
8160
0.0
0100
0.1
00
0.0
0110
100.0
00
0.0
2800
100000
0.0
2800
27
Off
shore
Engulf
_blo
wout_
rise
r0.0
10.0
0100
0.0
8642
0.0
0100
0.1
00
0.0
0110
100.0
00
0.1
0000
100000
0.1
0000
28
Cox,
Lee
s,A
ng
–G
as0.0
10.0
0081
0.5
0000
0.0
1000
100.0
00
0.3
0000
100000
0.3
0000
29
Cox,
Lee
s,A
ng
–L
iquid
0.0
10.0
0215
0.5
0000
0.0
1000
100.0
00
0.0
8000
100000
0.0
8000
30
Tan
kL
iquid
–die
sel,
fuel
oil
0.0
10.0
0100
0.1
0000
0.0
0100
1.0
00
0.0
0103
7.0
00
0.0
0117
25.5
51
0.0
0240
100000
0.0
0240
SYMPOSIUM SERIES NO. 158 Hazards XXIII # 2012 IChemE
365
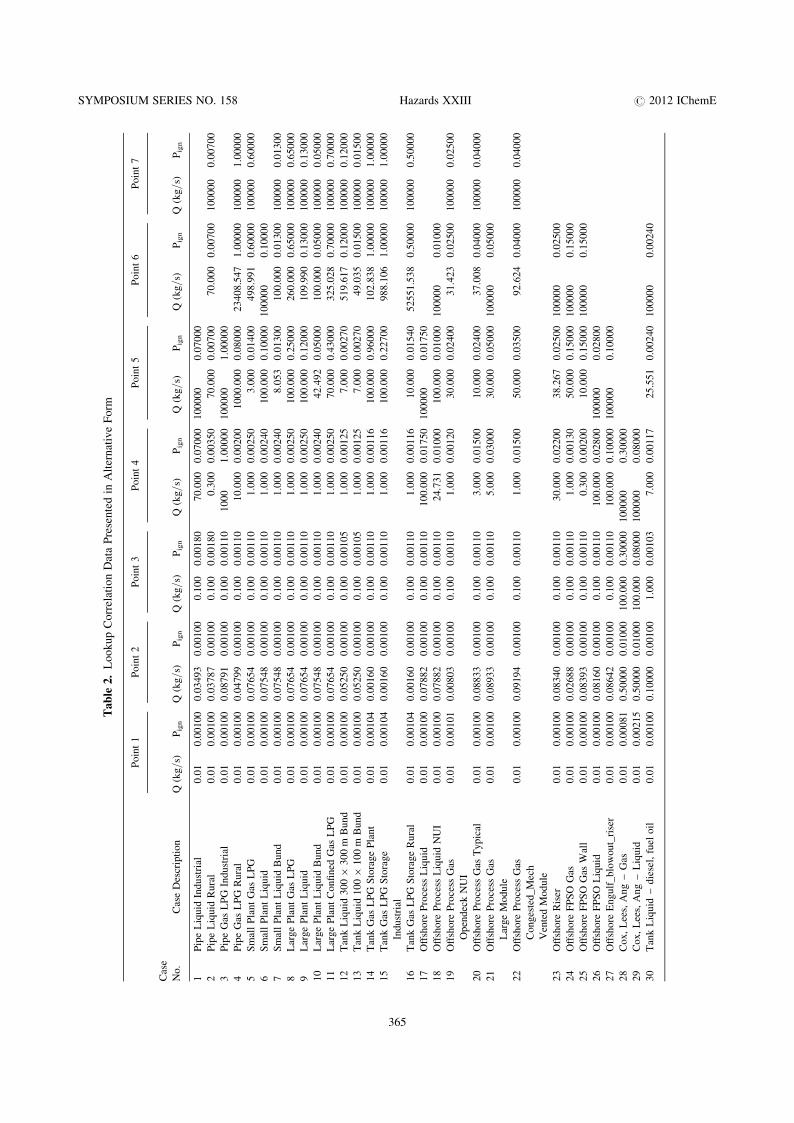
This table defines each of the curves using between 4and 7 points. As an example, the curve for “OffshoreProcess Gas Typical” is shown in Figure 1.
A specific ignition probability is then obtained fromthe equation.
Pign = elog pn+
(logQ−logQn )(logPn+1−logPn )
logQn+1−logQn
WherePign is the Ignition probability at release rate QPn is the ignition probability at release rate Qn, andPn+1 is the ignition probability at release rate Qn+1
and where the points (Qn, Pn) and (Qn+1, Pn+1) areadjacent points in Table 2 between which the value ofQ lies.
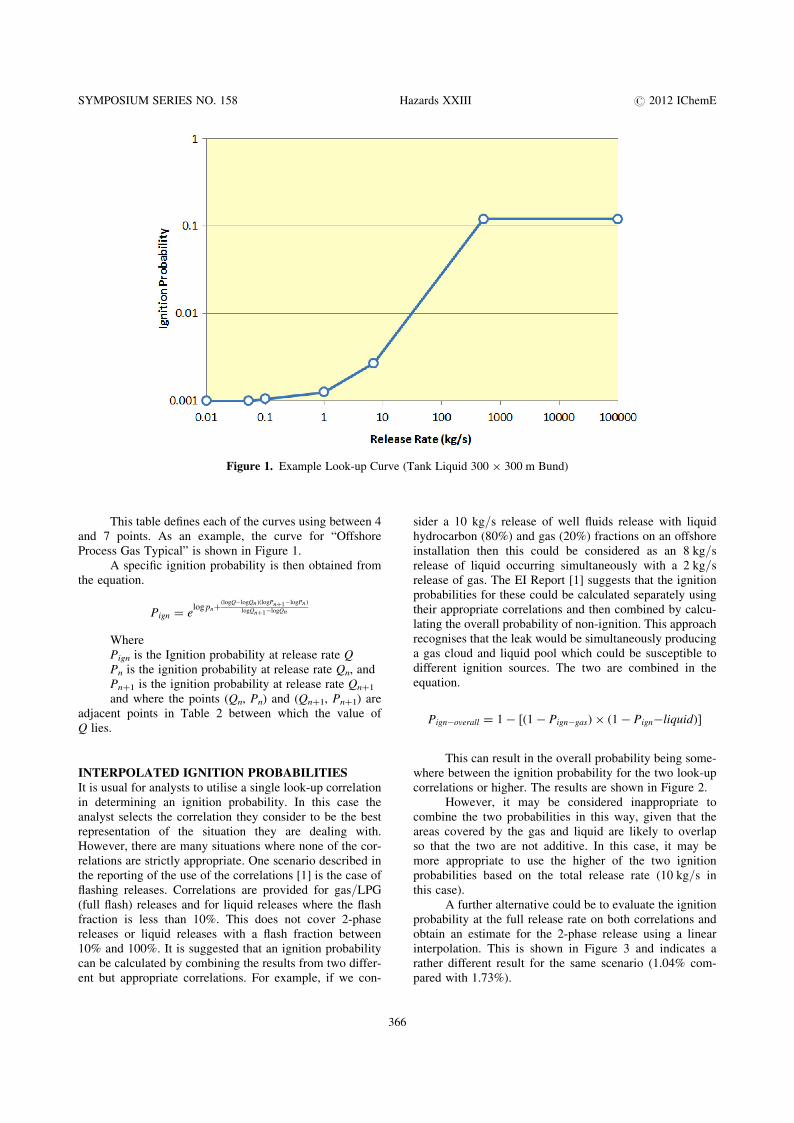
INTERPOLATED IGNITION PROBABILITIESIt is usual for analysts to utilise a single look-up correlationin determining an ignition probability. In this case theanalyst selects the correlation they consider to be the bestrepresentation of the situation they are dealing with.However, there are many situations where none of the cor-relations are strictly appropriate. One scenario described inthe reporting of the use of the correlations [1] is the case offlashing releases. Correlations are provided for gas/LPG(full flash) releases and for liquid releases where the flashfraction is less than 10%. This does not cover 2-phasereleases or liquid releases with a flash fraction between10% and 100%. It is suggested that an ignition probabilitycan be calculated by combining the results from two differ-ent but appropriate correlations. For example, if we con-
sider a 10 kg/s release of well fluids release with liquidhydrocarbon (80%) and gas (20%) fractions on an offshoreinstallation then this could be considered as an 8 kg/srelease of liquid occurring simultaneously with a 2 kg/srelease of gas. The EI Report [1] suggests that the ignitionprobabilities for these could be calculated separately usingtheir appropriate correlations and then combined by calcu-lating the overall probability of non-ignition. This approachrecognises that the leak would be simultaneously producinga gas cloud and liquid pool which could be susceptible todifferent ignition sources. The two are combined in theequation.
Pign−overall = 1 − [(1 − Pign−gas) × (1 − Pign−liquid)]
This can result in the overall probability being some-where between the ignition probability for the two look-upcorrelations or higher. The results are shown in Figure 2.
However, it may be considered inappropriate tocombine the two probabilities in this way, given that theareas covered by the gas and liquid are likely to overlapso that the two are not additive. In this case, it may bemore appropriate to use the higher of the two ignitionprobabilities based on the total release rate (10 kg/s inthis case).
A further alternative could be to evaluate the ignitionprobability at the full release rate on both correlations andobtain an estimate for the 2-phase release using a linearinterpolation. This is shown in Figure 3 and indicates arather different result for the same scenario (1.04% com-pared with 1.73%).
Figure 1. Example Look-up Curve (Tank Liquid 300 × 300 m Bund)
SYMPOSIUM SERIES NO. 158 Hazards XXIII # 2012 IChemE
366
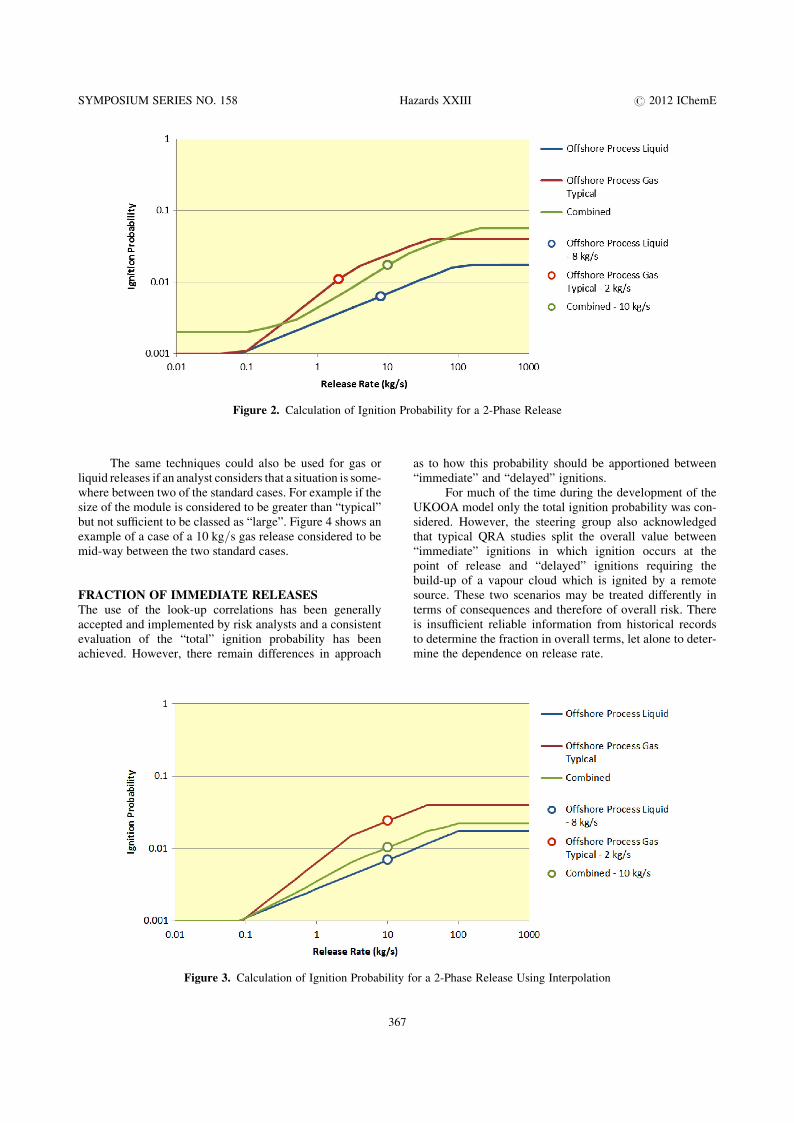
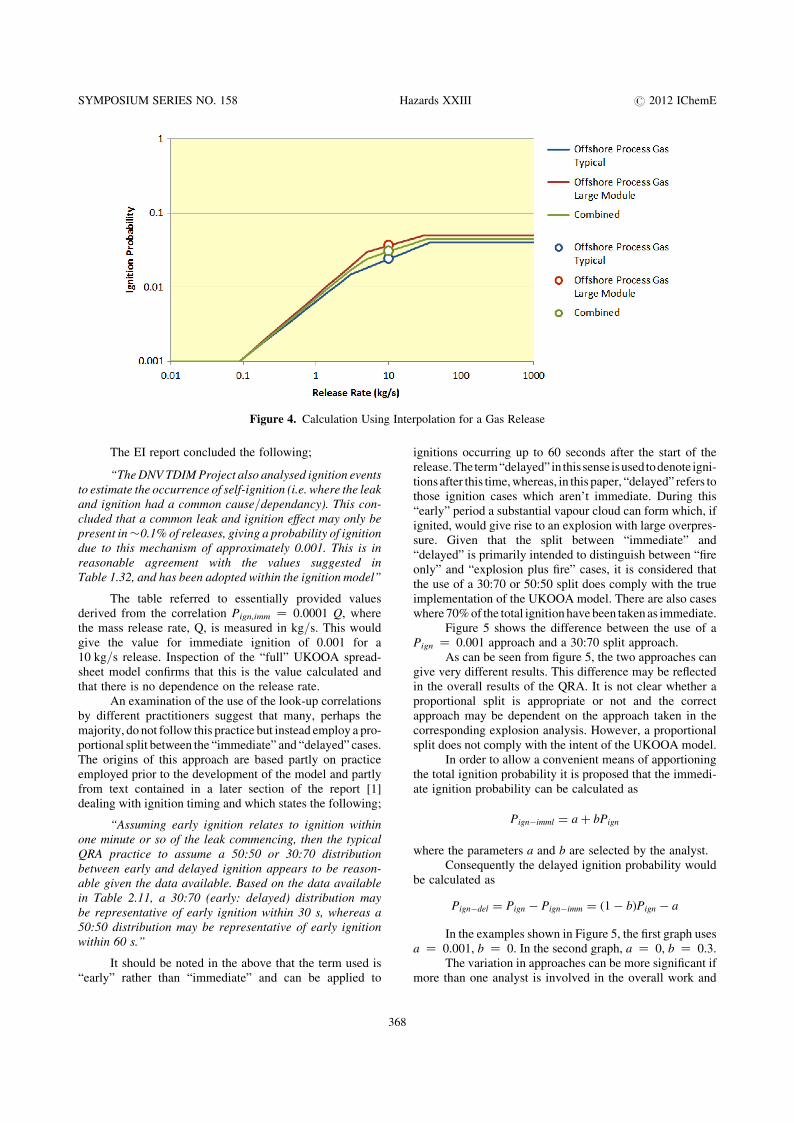
The same techniques could also be used for gas orliquid releases if an analyst considers that a situation is some-where between two of the standard cases. For example if thesize of the module is considered to be greater than “typical”but not sufficient to be classed as “large”. Figure 4 shows anexample of a case of a 10 kg/s gas release considered to bemid-way between the two standard cases.
FRACTION OF IMMEDIATE RELEASESThe use of the look-up correlations has been generallyaccepted and implemented by risk analysts and a consistentevaluation of the “total” ignition probability has beenachieved. However, there remain differences in approach
as to how this probability should be apportioned between“immediate” and “delayed” ignitions.
For much of the time during the development of theUKOOA model only the total ignition probability was con-sidered. However, the steering group also acknowledgedthat typical QRA studies split the overall value between“immediate” ignitions in which ignition occurs at thepoint of release and “delayed” ignitions requiring thebuild-up of a vapour cloud which is ignited by a remotesource. These two scenarios may be treated differently interms of consequences and therefore of overall risk. Thereis insufficient reliable information from historical recordsto determine the fraction in overall terms, let alone to deter-mine the dependence on release rate.
Figure 2. Calculation of Ignition Probability for a 2-Phase Release
Figure 3. Calculation of Ignition Probability for a 2-Phase Release Using Interpolation
SYMPOSIUM SERIES NO. 158 Hazards XXIII # 2012 IChemE
367
The EI report concluded the following;
“The DNV TDIM Project also analysed ignition eventsto estimate the occurrence of self-ignition (i.e. where the leakand ignition had a common cause/dependancy). This con-cluded that a common leak and ignition effect may only bepresent in�0.1% of releases, giving a probability of ignitiondue to this mechanism of approximately 0.001. This is inreasonable agreement with the values suggested inTable 1.32, and has been adopted within the ignition model”
The table referred to essentially provided valuesderived from the correlation Pign,imm ¼ 0.0001 Q, wherethe mass release rate, Q, is measured in kg/s. This wouldgive the value for immediate ignition of 0.001 for a10 kg/s release. Inspection of the “full” UKOOA spread-sheet model confirms that this is the value calculated andthat there is no dependence on the release rate.
An examination of the use of the look-up correlationsby different practitioners suggest that many, perhaps themajority, do not follow this practice but instead employ a pro-portional split between the “immediate” and “delayed” cases.The origins of this approach are based partly on practiceemployed prior to the development of the model and partlyfrom text contained in a later section of the report [1]dealing with ignition timing and which states the following;
“Assuming early ignition relates to ignition withinone minute or so of the leak commencing, then the typicalQRA practice to assume a 50:50 or 30:70 distributionbetween early and delayed ignition appears to be reason-able given the data available. Based on the data availablein Table 2.11, a 30:70 (early: delayed) distribution maybe representative of early ignition within 30 s, whereas a50:50 distribution may be representative of early ignitionwithin 60 s.”
It should be noted in the above that the term used is“early” rather than “immediate” and can be applied to
ignitions occurring up to 60 seconds after the start of therelease.The term“delayed” in this sense isused todenote igni-tions after this time, whereas, in this paper, “delayed” refers tothose ignition cases which aren’t immediate. During this“early” period a substantial vapour cloud can form which, ifignited, would give rise to an explosion with large overpres-sure. Given that the split between “immediate” and“delayed” is primarily intended to distinguish between “fireonly” and “explosion plus fire” cases, it is considered thatthe use of a 30:70 or 50:50 split does comply with the trueimplementation of the UKOOA model. There are also caseswhere 70% of the total ignition have been taken as immediate.
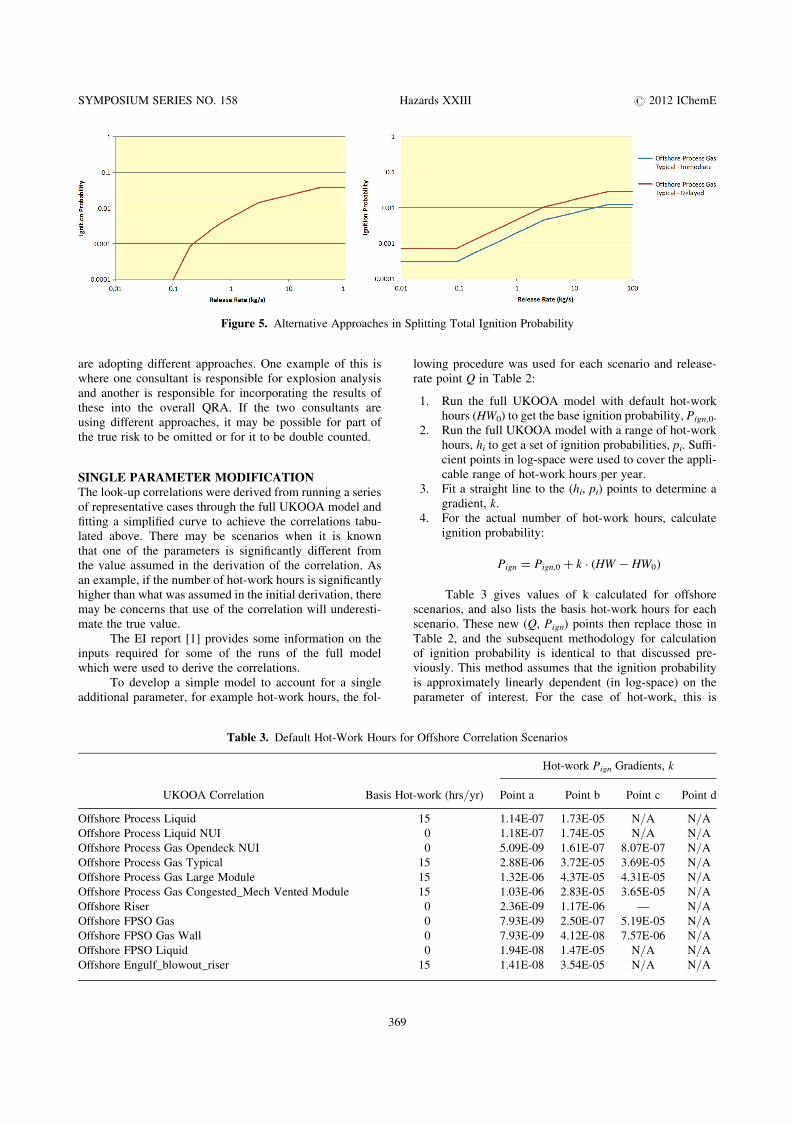
Figure 5 shows the difference between the use of aPign ¼ 0.001 approach and a 30:70 split approach.
As can be seen from figure 5, the two approaches cangive very different results. This difference may be reflectedin the overall results of the QRA. It is not clear whether aproportional split is appropriate or not and the correctapproach may be dependent on the approach taken in thecorresponding explosion analysis. However, a proportionalsplit does not comply with the intent of the UKOOA model.
In order to allow a convenient means of apportioningthe total ignition probability it is proposed that the immedi-ate ignition probability can be calculated as
Pign−imml = a + bPign
where the parameters a and b are selected by the analyst.Consequently the delayed ignition probability would
be calculated as
Pign−del = Pign − Pign−imm = (1 − b)Pign − a
In the examples shown in Figure 5, the first graph usesa ¼ 0.001, b ¼ 0. In the second graph, a ¼ 0, b ¼ 0.3.
The variation in approaches can be more significant ifmore than one analyst is involved in the overall work and
Figure 4. Calculation Using Interpolation for a Gas Release
SYMPOSIUM SERIES NO. 158 Hazards XXIII # 2012 IChemE
368
are adopting different approaches. One example of this iswhere one consultant is responsible for explosion analysisand another is responsible for incorporating the results ofthese into the overall QRA. If the two consultants areusing different approaches, it may be possible for part ofthe true risk to be omitted or for it to be double counted.
SINGLE PARAMETER MODIFICATIONThe look-up correlations were derived from running a seriesof representative cases through the full UKOOA model andfitting a simplified curve to achieve the correlations tabu-lated above. There may be scenarios when it is knownthat one of the parameters is significantly different fromthe value assumed in the derivation of the correlation. Asan example, if the number of hot-work hours is significantlyhigher than what was assumed in the initial derivation, theremay be concerns that use of the correlation will underesti-mate the true value.
The EI report [1] provides some information on theinputs required for some of the runs of the full modelwhich were used to derive the correlations.
To develop a simple model to account for a singleadditional parameter, for example hot-work hours, the fol-
lowing procedure was used for each scenario and release-rate point Q in Table 2:
1. Run the full UKOOA model with default hot-workhours (HW0) to get the base ignition probability, Pign,0.
2. Run the full UKOOA model with a range of hot-workhours, hi to get a set of ignition probabilities, pi. Suffi-cient points in log-space were used to cover the appli-cable range of hot-work hours per year.
3. Fit a straight line to the (hi, pi) points to determine agradient, k.
4. For the actual number of hot-work hours, calculateignition probability:
Pign = Pign,0 + k · (HW − HW0)
Table 3 gives values of k calculated for offshorescenarios, and also lists the basis hot-work hours for eachscenario. These new (Q, Pign) points then replace those inTable 2, and the subsequent methodology for calculationof ignition probability is identical to that discussed pre-viously. This method assumes that the ignition probabilityis approximately linearly dependent (in log-space) on theparameter of interest. For the case of hot-work, this is
Figure 5. Alternative Approaches in Splitting Total Ignition Probability
Table 3. Default Hot-Work Hours for Offshore Correlation Scenarios
UKOOA Correlation Basis Hot-work (hrs/yr)
Hot-work Pign Gradients, k
Point a Point b Point c Point d
Offshore Process Liquid 15 1.14E-07 1.73E-05 N/A N/A
Offshore Process Liquid NUI 0 1.18E-07 1.74E-05 N/A N/A
Offshore Process Gas Opendeck NUI 0 5.09E-09 1.61E-07 8.07E-07 N/A
Offshore Process Gas Typical 15 2.88E-06 3.72E-05 3.69E-05 N/A
Offshore Process Gas Large Module 15 1.32E-06 4.37E-05 4.31E-05 N/A
Offshore Process Gas Congested_Mech Vented Module 15 1.03E-06 2.83E-05 3.65E-05 N/A
Offshore Riser 0 2.36E-09 1.17E-06 — N/A
Offshore FPSO Gas 0 7.93E-09 2.50E-07 5.19E-05 N/A
Offshore FPSO Gas Wall 0 7.93E-09 4.12E-08 7.57E-06 N/A
Offshore FPSO Liquid 0 1.94E-08 1.47E-05 N/A N/A
Offshore Engulf_blowout_riser 15 1.41E-08 3.54E-05 N/A N/A
SYMPOSIUM SERIES NO. 158 Hazards XXIII # 2012 IChemE
369
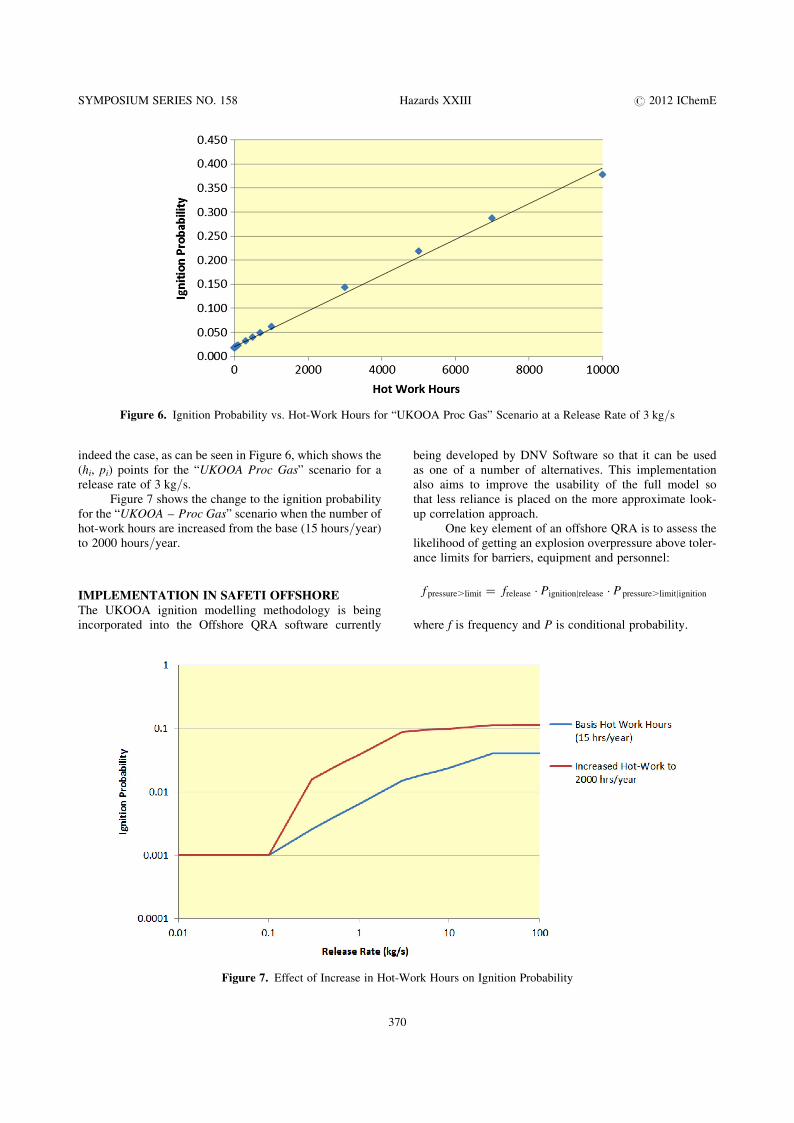
indeed the case, as can be seen in Figure 6, which shows the(hi, pi) points for the “UKOOA Proc Gas” scenario for arelease rate of 3 kg/s.
Figure 7 shows the change to the ignition probabilityfor the “UKOOA – Proc Gas” scenario when the number ofhot-work hours are increased from the base (15 hours/year)to 2000 hours/year.
IMPLEMENTATION IN SAFETI OFFSHOREThe UKOOA ignition modelling methodology is beingincorporated into the Offshore QRA software currently
being developed by DNV Software so that it can be usedas one of a number of alternatives. This implementationalso aims to improve the usability of the full model sothat less reliance is placed on the more approximate look-up correlation approach.
One key element of an offshore QRA is to assess thelikelihood of getting an explosion overpressure above toler-ance limits for barriers, equipment and personnel:
f pressure.limit = frelease · Pignition|release · P pressure.limit|ignition
where f is frequency and P is conditional probability.
Figure 6. Ignition Probability vs. Hot-Work Hours for “UKOOA Proc Gas” Scenario at a Release Rate of 3 kg/s
Figure 7. Effect of Increase in Hot-Work Hours on Ignition Probability
SYMPOSIUM SERIES NO. 158 Hazards XXIII # 2012 IChemE
370
Whereas, it is generally more convenient to modular-ise a QRA study in models dealing with aspects of theoverall problem, it is found that the interaction of theignition timing and the explosion analysis is such that itnecessary to treat the two methodologies together in thesame piece of analysis.
The worst case overpressure is typically higher thanwhat is possible to design barriers to withstand. Sincethe overpressure is sensitive to the size of the ignited flam-mable cloud it is important to be able to model the prob-ability of ignition vs. time and not only the total ignitionprobability. Safeti Offshore models the uncertainty inrelease rate, cloud build up, detection, ignition, etc. Thereliability of safety systems such as automatic (andmanual) detection, isolation & blowdown and shutdown ofignition sources are included.
The full UKOOA model has a built in dispersionmodel and can predict the probability of ignition versustime. It also allows site specific parameters such as releasedmaterial, process conditions, hotwork, module dimensions,weather/ventilation, etc. to be incorporated. This can alsobe applied to the look–up correlation approach.
Both the full UKOOA ignition model and the look-upcorrelations are implemented in Safeti Offshore. Defaultdata is provided in accordance with the values provided inthe full spreadsheet model to overcome the complexity of
having to enter all the detailed information that the fullmodel needs.
In the ignition modelling part of Safeti Offshore theanalyst can select from the following options:
. Use the full UKOOA cloud build up and ignition model
. Use the UKOOA look-up correlation with UKOOAcloud build up model
. Use the UKOOA look-up correlation with the moredetailed cloud build up model available in Safeti Off-shore
. Use TDIIM [2]
. Use an Expert correlation (total ignition probability vs.release rate).
CONCLUSIONSThe “UKOOA Ignition Model” has become the standardapproach for calculating the ignition probability of offshorehydrocarbon releases for offshore platforms in the UnitedKingdom continental shelf. If is also used for QRAstudies of offshore installations in other parts of the worldand in onshore studies. Typically, the look-up correlationform of the method has been adopted and this has broughtbenefits in terms of ease of use and consistency amongpractitioners.
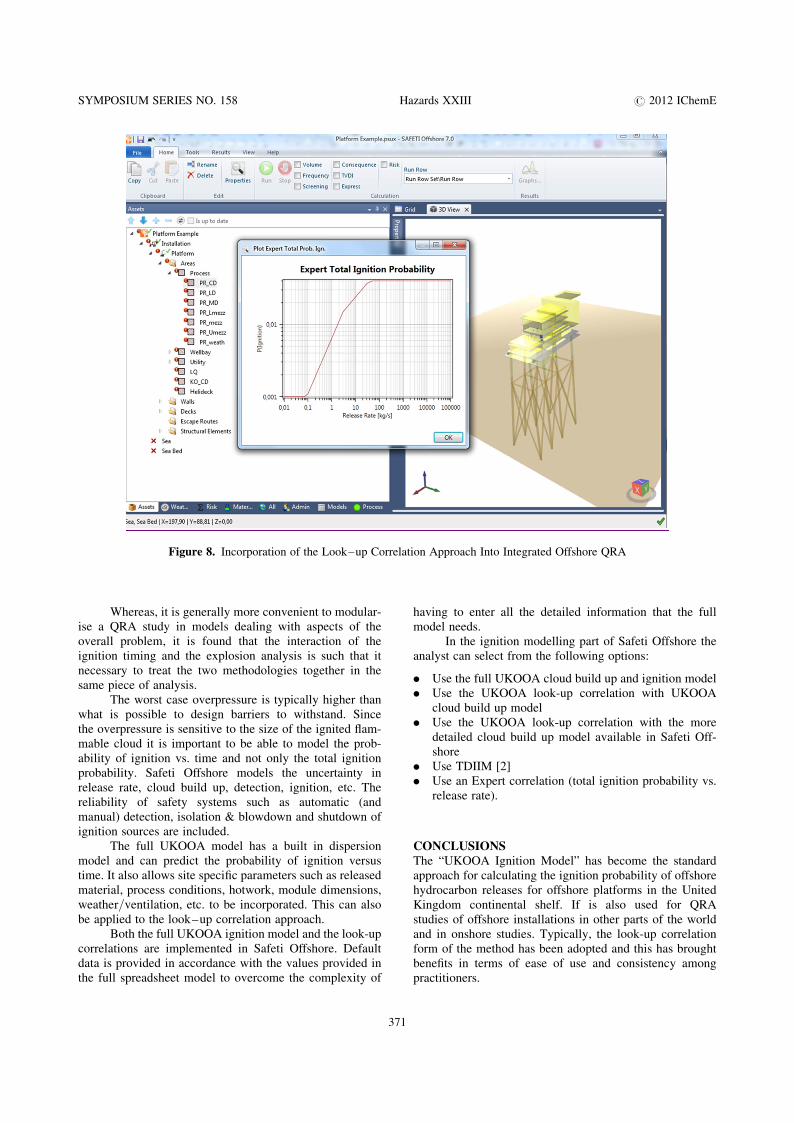
Figure 8. Incorporation of the Look–up Correlation Approach Into Integrated Offshore QRA
SYMPOSIUM SERIES NO. 158 Hazards XXIII # 2012 IChemE
371
Despite this, there are some areas where the approachcould be amended to make it easier to use or adapted it toallow for the effects of variation of some key parameters.These include;
. Retabulation of the data defining the curves in order tomake its meaning more obvious.
. Interpolation of new look-up correlations to addresssituations which are intermediate between the standardcurves.
. A consistent treatment of the division of the overallignition probability into its “immediate” and “delayed”constituents.
. A means of incorporating changes in a single parameterto produce a more accurate result or to examine the sen-sitivity of the results to that parameter.
. Incorporation of the methodology into QRA studies andin particular its integration with explosion overpressureexceedence analysis where the distribution of ignitiontimes are important.
WORKS CITED
1. Energy Institute. Ignition Probability Review, ModelDevelopment and Look-up Correlations. IP ResearchReport. London: Energy Institute; 2006 IP, EnergyInstitute, HSE, UKOOA. ISBN 978 0 85293 454 8.
2. DNV. Ignition Modelling Time Dependent IgnitionProbability Model. Technical Report. Det NorskeVeritas; 1998. 96-3629.
3. WS Atkins. Development of a Method for the Deter-mination of On-site Ignition Probabilities. HSEResearch Report. HSE Books; 1998. ISBN 0 71761657 6.
4. BP Amoco, CERN, BG Technology. Gas Build-upfrom High Pressure Natural Gas Releases in NaturallyVentiliated Offshore Modules, JIP Workbook on GasAccumulation in a Confined Area. JIP Workbook.BP Amoco, CERN, BG Technology; 2000.
5. International Association of Oil and Gas Producers.Ignition Probabilities. Risk Assessment Data Direc-tory. OGP Publications; 2010. 431-6.1.
SYMPOSIUM SERIES NO. 158 Hazards XXIII # 2012 IChemE
372