Embed Size (px)
Citation preview
Pre-Emptive camera activation forVideo-Surveillance HCI
Niki Martinel, Christian Micheloni, and Claudio Piciarelli
Universita degli Studi di Udine
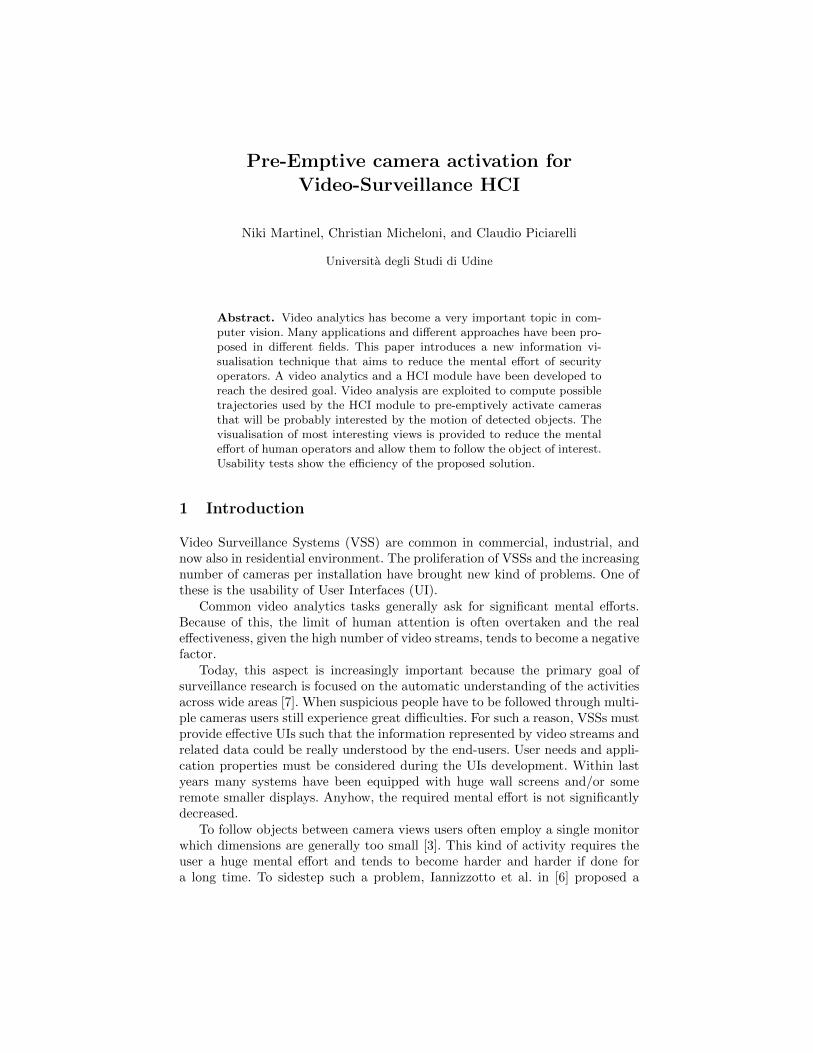
Abstract. Video analytics has become a very important topic in com-puter vision. Many applications and different approaches have been pro-posed in different fields. This paper introduces a new information vi-sualisation technique that aims to reduce the mental effort of securityoperators. A video analytics and a HCI module have been developed toreach the desired goal. Video analysis are exploited to compute possibletrajectories used by the HCI module to pre-emptively activate camerasthat will be probably interested by the motion of detected objects. Thevisualisation of most interesting views is provided to reduce the mentaleffort of human operators and allow them to follow the object of interest.Usability tests show the efficiency of the proposed solution.
1 Introduction
Video Surveillance Systems (VSS) are common in commercial, industrial, andnow also in residential environment. The proliferation of VSSs and the increasingnumber of cameras per installation have brought new kind of problems. One ofthese is the usability of User Interfaces (UI).
Common video analytics tasks generally ask for significant mental efforts.Because of this, the limit of human attention is often overtaken and the realeffectiveness, given the high number of video streams, tends to become a negativefactor.
Today, this aspect is increasingly important because the primary goal ofsurveillance research is focused on the automatic understanding of the activitiesacross wide areas [7]. When suspicious people have to be followed through multi-ple cameras users still experience great difficulties. For such a reason, VSSs mustprovide effective UIs such that the information represented by video streams andrelated data could be really understood by the end-users. User needs and appli-cation properties must be considered during the UIs development. Within lastyears many systems have been equipped with huge wall screens and/or someremote smaller displays. Anyhow, the required mental effort is not significantlydecreased.
To follow objects between camera views users often employ a single monitorwhich dimensions are generally too small [3]. This kind of activity requires theuser a huge mental effort and tends to become harder and harder if done fora long time. To sidestep such a problem, Iannizzotto et al. in [6] proposed a
perceptual user interface that allows users interaction by means of gestures.In [5], Girgensohn et al. developed a Dynamic Object Tracking Systems thatprovides geographical cues [13] about the monitored environment. Morris andTrivedi in [9] and Bottoni et al. in [1] described similar solutions. According tothese works new VSSs still have to strongly reduce the required mental effort.
The development of an effective and powerful information visualisation tech-nique is the main goal of this work. The novel aspect of the paper is representedby the selection of proper video streams, their organisation and alternation. Forsuch purposes, objects, i.e. camera views, are chosen and activated with a signif-icantly difference: rather than displaying all available camera views, only mostprobable streams, i.e. those that will be interested by the object motion, arepresented to the user. To determine most probable streams, the system mustforesee the object trajectories and the cameras that best acquire such possiblepaths.
In [12], Qureshi and Terzopoulos describe how it is possible to activate differ-ent camera views in order to track a single object among different fields-of-view(FOV) that are geographically adjacent. Thus, merging gained knowledge abouttrajectory prediction and camera view selection and activation, the proposedwork introduces a new way of showing visual information. The user interfacedeveloped is the result of an accurate process of camera view planning and se-lection. The main algorithm, according to space properties and a trajectory pre-diction tool, builds an activation plan to represent only those views that followthe predicted path of the object of interest.
Another novel aspect of this paper is related to the visualisation of geograph-ical information about the monitored environment. Common desktop solutions,that made use of topographic maps, propose only a single topological represen-tation of the environment. In addition, the proposed UI advantages from infor-mation visualisation studies conducted among mobile devices[2]. These exploitthe introduction of the detail plus overview representation technique [14].
2 System description
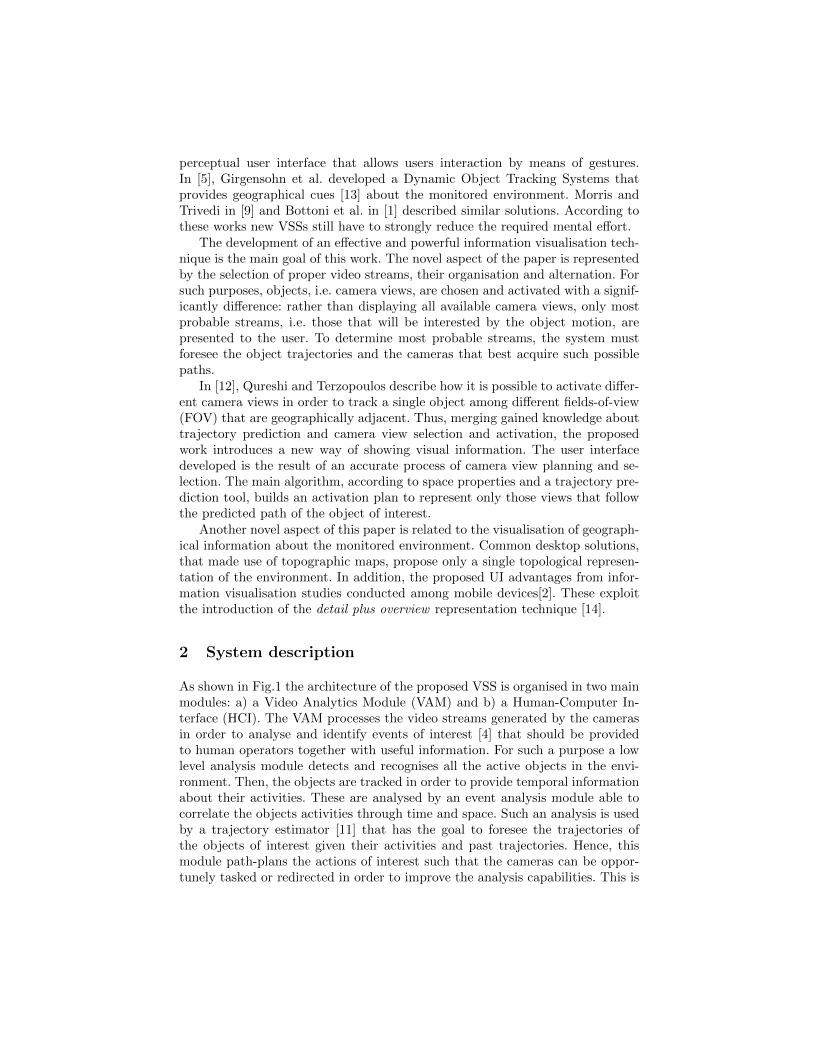
As shown in Fig.1 the architecture of the proposed VSS is organised in two mainmodules: a) a Video Analytics Module (VAM) and b) a Human-Computer In-terface (HCI). The VAM processes the video streams generated by the camerasin order to analyse and identify events of interest [4] that should be providedto human operators together with useful information. For such a purpose a lowlevel analysis module detects and recognises all the active objects in the envi-ronment. Then, the objects are tracked in order to provide temporal informationabout their activities. These are analysed by an event analysis module able tocorrelate the objects activities through time and space. Such an analysis is usedby a trajectory estimator [11] that has the goal to foresee the trajectories ofthe objects of interest given their activities and past trajectories. Hence, thismodule path-plans the actions of interest such that the cameras can be oppor-tunely tasked or redirected in order to improve the analysis capabilities. This is
Video Surveillance Application Video Analytics Module
Human-Computer Interface
Low Level Analysis
Object Tracking
Trajectory Estimation
Event Analysis
Network Reconfiguration
Stream Activation
Stream Organisation
Data Display
Fig. 1. Video Surveillance System
achieved by the network reconfiguration module [8]. The estimated trajectoriesand the new camera network configuration are given to the HCI module that hasto optimise the cognitive capabilities of the operator. In this way, a first decisionis taken about the most meaningful streams that have to be provided. This isdone by considering the foreseen evolution of the environment. Once the mostimportant streams have been decided a second module is in charge to determinehow they must be organised on the user interface. Finally the streams are prop-erly visualised on the UI together with useful information provided by the videoanalytics module.
3 Trajectory analysis
The trajectory analysis module is fundamental to estimate the path that theobject of interest most probably will take in the near feature. This module isbased on Piciarelli and Foresti work [11]. Let Tr = {(x1, y1), . . . , (xtn, y
tn)}, where
(xtj , ytj) is the position of the object expressed along the xt and yt axis of the
map at time instant j, be the i-th trajectory detected by the trajectory ex-traction algorithm. The trajectories are grouped in clusters C = {(xc1, y
c1, σ
21),
. . . , (xcm, ycm, σ
2m)} where σ2
j is the local variance of the cluster at time j thatstatistically represent the most probable trajectories inside the monitored envi-ronment. In order to associate the current trajectory T to an available clusterC the following distance measure is adopted
D(T,C) =1
n
n∑i=1
minj
(dist((xti, y
ti), (x
cj , y
cj))
σj
)(1)
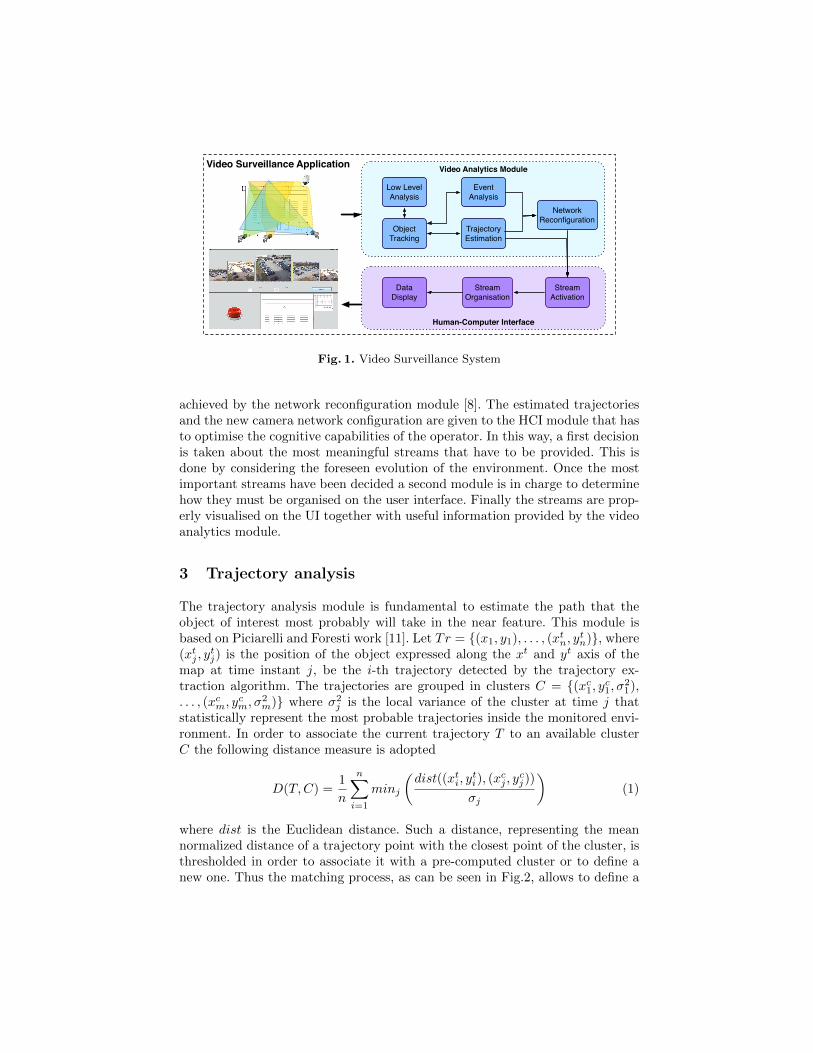
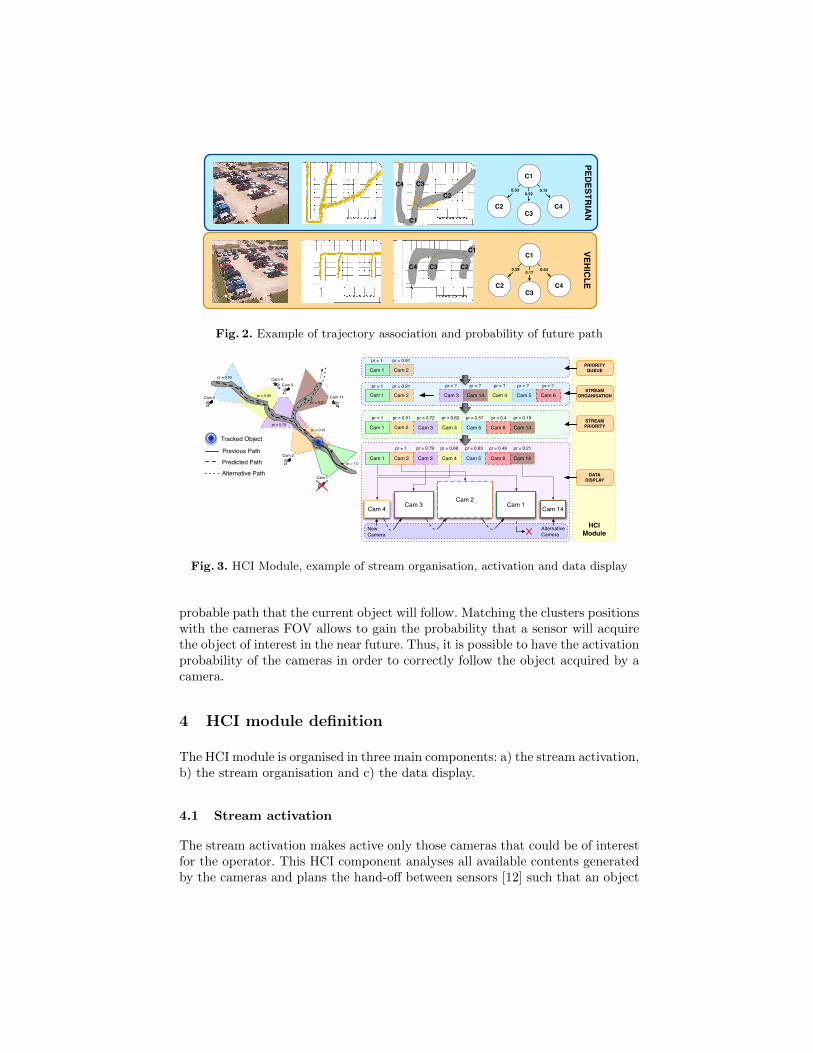
where dist is the Euclidean distance. Such a distance, representing the meannormalized distance of a trajectory point with the closest point of the cluster, isthresholded in order to associate it with a pre-computed cluster or to define anew one. Thus the matching process, as can be seen in Fig.2, allows to define a
C3C2
C1
C4C1
C2C3
C4
0.330.52
0.15
PEDESTR
IAN
C3 C2
C1
C4
VEHICLE
C1
C2C3
C4
0.290.17
0.54
Fig. 2. Example of trajectory association and probability of future path
HCIModule
Cam 1 Cam 2
pr = 1 pr = 0.91
Cam 1 Cam 2 Cam 3 Cam 14 Cam 4 Cam 5 Cam 6
pr = 1 pr = 0.91 pr = ? pr = ? pr = ? pr = ? pr = ?
Cam 1 Cam 2
pr = 1 pr = 0.91 pr = 0.72 pr = 0.62 pr = 0.57 pr = 0.4 pr = 0.19
Cam 3 Cam 4 Cam 5 Cam 6 Cam 14
Cam 1 Cam 2
pr = 1 pr = 0.79 pr = 0.68 pr = 0.63 pr = 0.49 pr = 0.21
Cam 3 Cam 4 Cam 5 Cam 6 Cam 14
PRIORITYQUEUE
STREAM ORGANISATION
STREAM PRIORITY
DATADISPLAY
Cam 2Cam 1Cam 3Cam 4 Cam 14
AlternativeCamera
NewCamera
Tracked Object
Previous Path
Predicted Path
Alternative Path
Cam 2
Cam 14
Cam 3Cam 4
Cam 5
Cam 1
pr = 1.0
pr = 0.91
pr = 0.21
pr = 0.79
pr = 0.86
pr = 0.93
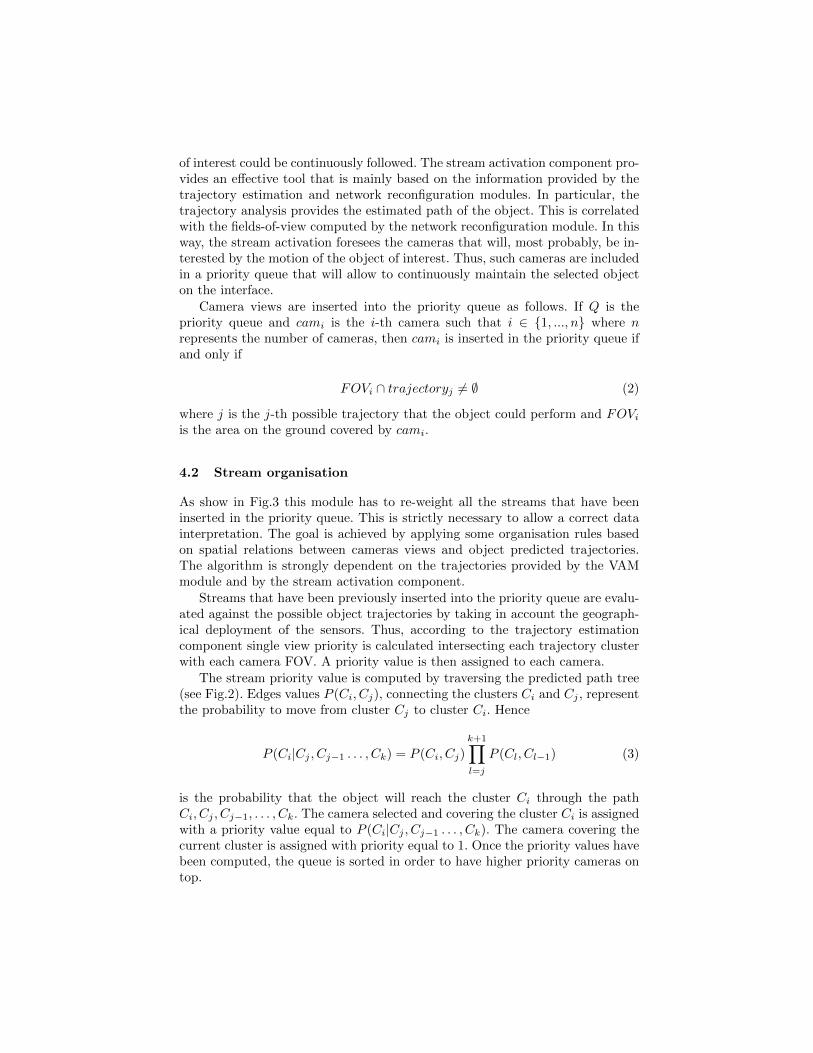
Fig. 3. HCI Module, example of stream organisation, activation and data display
probable path that the current object will follow. Matching the clusters positionswith the cameras FOV allows to gain the probability that a sensor will acquirethe object of interest in the near future. Thus, it is possible to have the activationprobability of the cameras in order to correctly follow the object acquired by acamera.
4 HCI module definition
The HCI module is organised in three main components: a) the stream activation,b) the stream organisation and c) the data display.
4.1 Stream activation
The stream activation makes active only those cameras that could be of interestfor the operator. This HCI component analyses all available contents generatedby the cameras and plans the hand-off between sensors [12] such that an object
of interest could be continuously followed. The stream activation component pro-vides an effective tool that is mainly based on the information provided by thetrajectory estimation and network reconfiguration modules. In particular, thetrajectory analysis provides the estimated path of the object. This is correlatedwith the fields-of-view computed by the network reconfiguration module. In thisway, the stream activation foresees the cameras that will, most probably, be in-terested by the motion of the object of interest. Thus, such cameras are includedin a priority queue that will allow to continuously maintain the selected objecton the interface.
Camera views are inserted into the priority queue as follows. If Q is thepriority queue and cami is the i-th camera such that i ∈ {1, ..., n} where nrepresents the number of cameras, then cami is inserted in the priority queue ifand only if
FOVi ∩ trajectoryj 6= ∅ (2)
where j is the j-th possible trajectory that the object could perform and FOViis the area on the ground covered by cami.
4.2 Stream organisation
As show in Fig.3 this module has to re-weight all the streams that have beeninserted in the priority queue. This is strictly necessary to allow a correct datainterpretation. The goal is achieved by applying some organisation rules basedon spatial relations between cameras views and object predicted trajectories.The algorithm is strongly dependent on the trajectories provided by the VAMmodule and by the stream activation component.
Streams that have been previously inserted into the priority queue are evalu-ated against the possible object trajectories by taking in account the geograph-ical deployment of the sensors. Thus, according to the trajectory estimationcomponent single view priority is calculated intersecting each trajectory clusterwith each camera FOV. A priority value is then assigned to each camera.
The stream priority value is computed by traversing the predicted path tree(see Fig.2). Edges values P (Ci, Cj), connecting the clusters Ci and Cj , representthe probability to move from cluster Cj to cluster Ci. Hence
P (Ci|Cj , Cj−1 . . . , Ck) = P (Ci, Cj)
k+1∏l=j
P (Cl, Cl−1) (3)
is the probability that the object will reach the cluster Ci through the pathCi, Cj , Cj−1, . . . , Ck. The camera selected and covering the cluster Ci is assignedwith a priority value equal to P (Ci|Cj , Cj−1 . . . , Ck). The camera covering thecurrent cluster is assigned with priority equal to 1. Once the priority values havebeen computed, the queue is sorted in order to have higher priority cameras ontop.
4.3 Data display
The described UI introduces a new way of displaying multiple video streams ina single device by using a strictly user-centred development process.
The introduced data display module has two main novelties that have beendeveloped to improve the operator capabilities: a) the video streams area andb) the map area. The main UI component is represented by the video areathat is based on the two previously described components. Such a UI elementis able to display only those cameras that better support the operator activitiesnecessary to monitor the selected object. In addition, to provide an effectiveuser interface the map of the area is also displayed. On such a map, sensors andobjects positions are displayed.
The data display module is object centred since the visualisation is indepen-dent of the number of cameras in the network. It depends only on the objects ofinterest tracked by the system. In this way, when tracking an object, the numberof cameras interested by the task is fixed. If more objects of interest are presentinto the monitored area the operator is able to follow one of these just switching,through a tabbed pan, the active visualisation. The number of objects of interestthat are associated to a single operator is limited.
Video streams area The video streams area represents the most importantUI component of this work. The visualisation techniques adopted have beentailored according to the results obtained from different evaluations conductedamong a set of preselected users. As previously described video streams arearranged inside the priority queue following some basic rules linked to the spatialproperties between cameras and the predicted trajectory of the tracked object(see section 4.2).
Following the priority queue, the most important view, i.e. the stream ofthe sensor whose FOV best shows the object (and has the highest priority), isalways displayed at the centre of the streams area. The streams that came afterthe most important camera will be displayed at the side of the main cameraview according to the movement of the object. The previous camera with thehighest priority will be shown at the other side. So, thanks to this the operatorcan clearly see which is the previous and the next camera view that will beused to follow the object itself. Finally the camera view that has been assignedthe highest priority and is not related to the main predicted path, i.e. the mostprobable alternative path, will be displayed at the extreme side of the maincamera view such that if the tracked object does not follow the main predictedpath the operator can still see it.
Assuming that the object is moving from right to left, the next view will bepresented to the operator at the left of the current main view (see Fig.3). Inthis way, as the main view changes, the next predicted stream will be moved tothe centre of the visualisation area. Adopting this technique the object movingout of the main camera view will appear in the next stream represented in thedirection of the object itself.
The video stream area introduces another visualisation cue that aims tobetter support operator tasks. Such a cue is described by the size of a single videostream representation that has the goal to explain the relative importance of eachcamera view. Adopting the described view selection technique, together with theview size cue, elements importance could decay exponentially over time so thatvideo streams stay in view for some time after they become less important. Insome cases, as the object move along its path, it could be possible that thecamera selection and representation change too quickly inside the UI. This way,the user could get confused. So, to solve this possible problem the user interfaceintroduces content animation. As long as the object follows the predicted path,camera views gradually slide in the opposite direction respect to the movementvector of the object. Old selected views are scaled down and animated out of theUI.
Other important aspects that have been introduced in the UI are representedby colours and by depiction techniques adopted to differentiate camera views.The UI introduces a colour-coded and a drawing style technique to discern cam-era views and to relate them to the represented objects in the map area. These UIfeatures have been adopted to best fit all user needs and to reduce the operatorsmental effort. The main goal has been achieved using a color-coded technique(which complies with colour-blind people) and introducing a different represen-tative style for the main active sensor. Hence, all users could clearly distinguishbetween environment sensors and in particular can immediately recognise mainactive camera.
Although providing only stream information could fit some operator require-ments, in some cases it might be useful to have geographical information aboutthe area and spatial cues about the identified objects that are followed by am-bient sensors. Using a topological representation that cooperates with the pre-viously described techniques is probably the best way that can lead to betterusability results.
Map area In many VSSs personnel is often required to monitor many videostreams and the introduction of a map component could help them and improvetheir ability to follow objects behaviour between different camera views. Usually,the map, that is integrated in this kind of user interfaces, displays the locationof each camera, its FOV and the objects being tracked. Moreover the map cansometimes be panned and zoomed for retrieving more accurate details.
In this work three main novel aspect have been introduced on map visual-isation. The first is represented by the colour-coded technique previously anal-ysed (see section 4.3). The second is given by the use, for each camera, of acolour-coded shaded area representing the sensor FOV. Finally, taking care ofall commonly adopted techniques, the work proposed through this paper alsointroduces a novel interaction paradigm that is usually employed in mobile de-vices applications: the detail plus overview technique. This powerful informationvisualisation technique significantly improve user ability to find and search ob-jects inside the monitored environment. Adding a small representation of the
00.43!
01.01!
01.52!
02.17!
00.00! 00.30! 01.00! 01.30! 02.00! 02.30!
Fourth Prototype!
Third Prototype!
Second Prototype!
First Prototype!
(a)
84,38%!
96,88%!97,92%!
100,00%!
80,00%!
85,00%!
90,00%!
95,00%!
100,00%!
First Prototype!
Second Prototype!
Third Prototype!
Fourth Prototype!
(b)
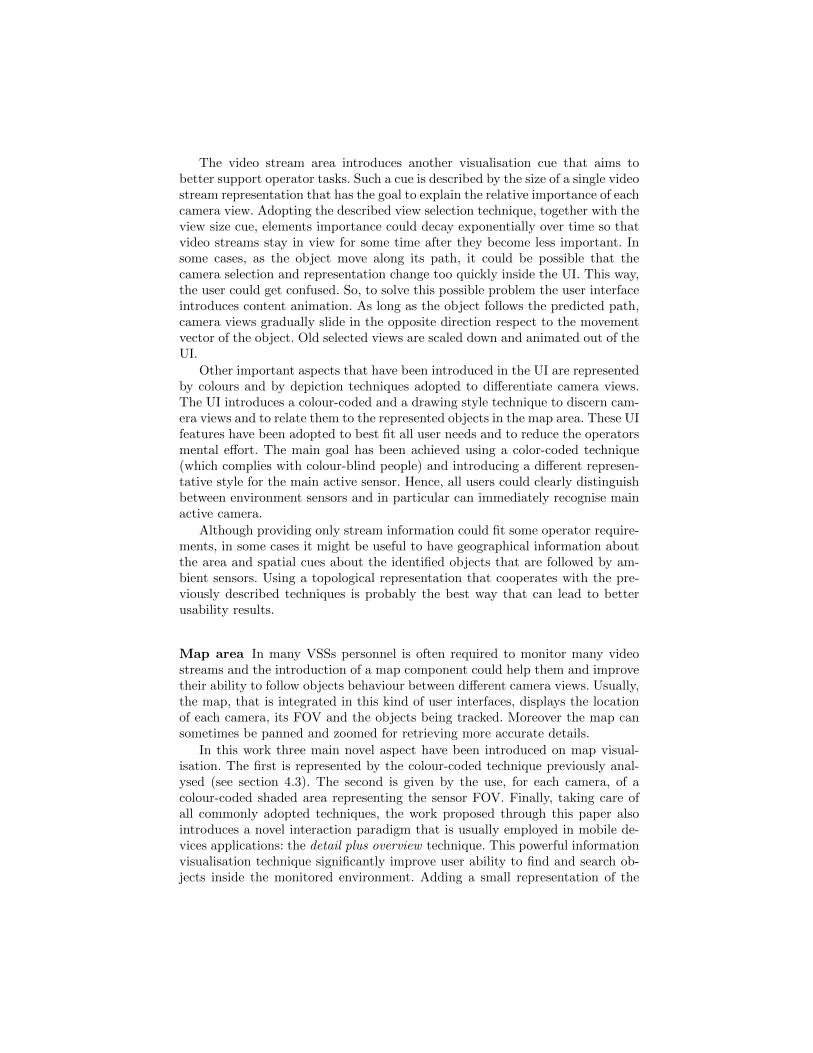
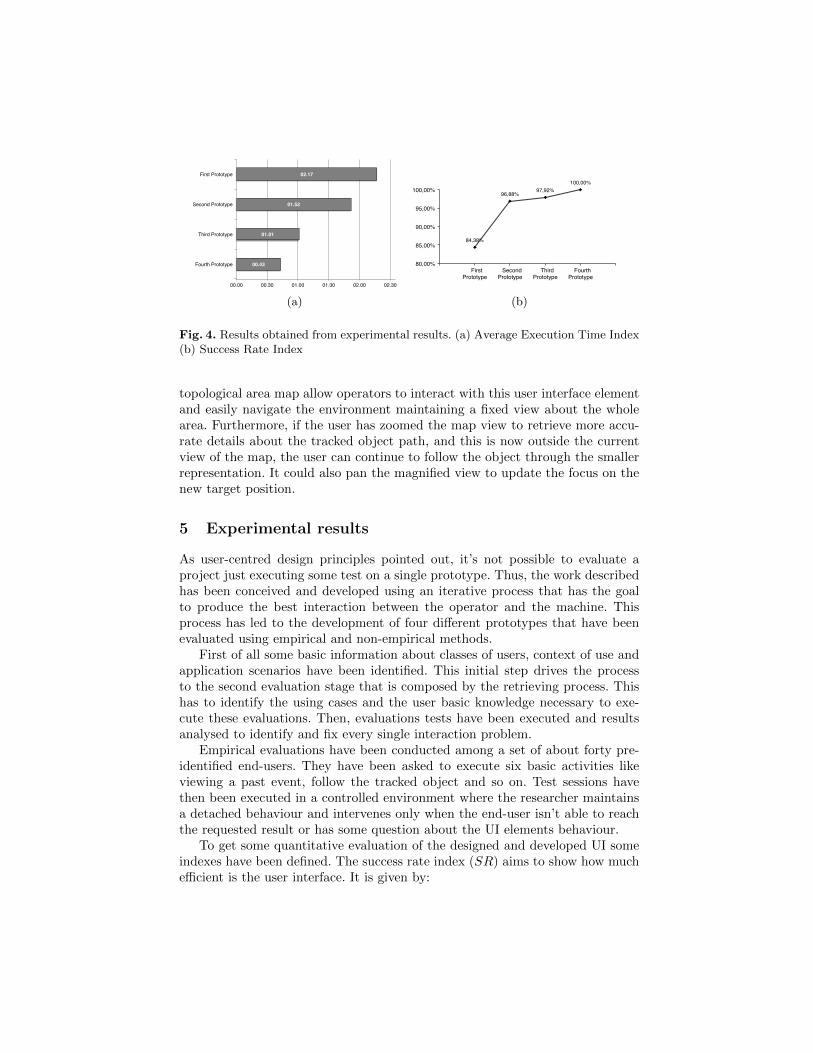
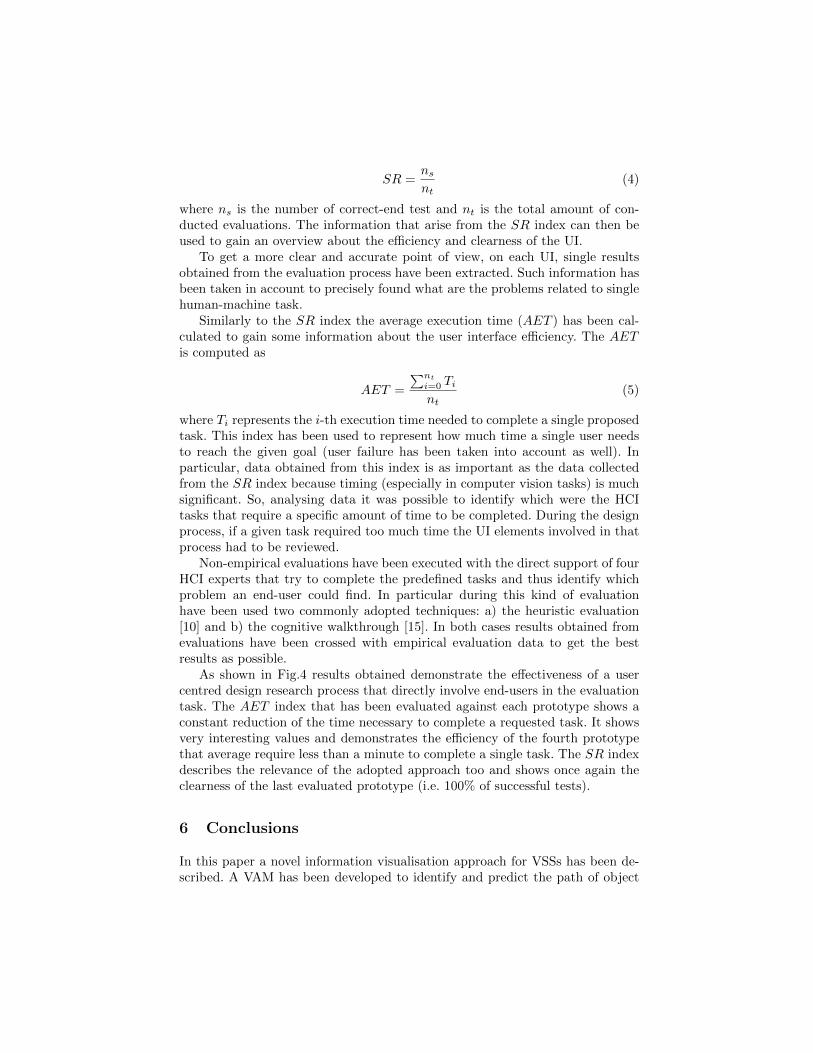
Fig. 4. Results obtained from experimental results. (a) Average Execution Time Index(b) Success Rate Index
topological area map allow operators to interact with this user interface elementand easily navigate the environment maintaining a fixed view about the wholearea. Furthermore, if the user has zoomed the map view to retrieve more accu-rate details about the tracked object path, and this is now outside the currentview of the map, the user can continue to follow the object through the smallerrepresentation. It could also pan the magnified view to update the focus on thenew target position.
5 Experimental results
As user-centred design principles pointed out, it’s not possible to evaluate aproject just executing some test on a single prototype. Thus, the work describedhas been conceived and developed using an iterative process that has the goalto produce the best interaction between the operator and the machine. Thisprocess has led to the development of four different prototypes that have beenevaluated using empirical and non-empirical methods.
First of all some basic information about classes of users, context of use andapplication scenarios have been identified. This initial step drives the processto the second evaluation stage that is composed by the retrieving process. Thishas to identify the using cases and the user basic knowledge necessary to exe-cute these evaluations. Then, evaluations tests have been executed and resultsanalysed to identify and fix every single interaction problem.
Empirical evaluations have been conducted among a set of about forty pre-identified end-users. They have been asked to execute six basic activities likeviewing a past event, follow the tracked object and so on. Test sessions havethen been executed in a controlled environment where the researcher maintainsa detached behaviour and intervenes only when the end-user isn’t able to reachthe requested result or has some question about the UI elements behaviour.
To get some quantitative evaluation of the designed and developed UI someindexes have been defined. The success rate index (SR) aims to show how muchefficient is the user interface. It is given by:
SR =nsnt
(4)
where ns is the number of correct-end test and nt is the total amount of con-ducted evaluations. The information that arise from the SR index can then beused to gain an overview about the efficiency and clearness of the UI.
To get a more clear and accurate point of view, on each UI, single resultsobtained from the evaluation process have been extracted. Such information hasbeen taken in account to precisely found what are the problems related to singlehuman-machine task.
Similarly to the SR index the average execution time (AET ) has been cal-culated to gain some information about the user interface efficiency. The AETis computed as
AET =
∑nt
i=0 Tint
(5)
where Ti represents the i-th execution time needed to complete a single proposedtask. This index has been used to represent how much time a single user needsto reach the given goal (user failure has been taken into account as well). Inparticular, data obtained from this index is as important as the data collectedfrom the SR index because timing (especially in computer vision tasks) is muchsignificant. So, analysing data it was possible to identify which were the HCItasks that require a specific amount of time to be completed. During the designprocess, if a given task required too much time the UI elements involved in thatprocess had to be reviewed.
Non-empirical evaluations have been executed with the direct support of fourHCI experts that try to complete the predefined tasks and thus identify whichproblem an end-user could find. In particular during this kind of evaluationhave been used two commonly adopted techniques: a) the heuristic evaluation[10] and b) the cognitive walkthrough [15]. In both cases results obtained fromevaluations have been crossed with empirical evaluation data to get the bestresults as possible.
As shown in Fig.4 results obtained demonstrate the effectiveness of a usercentred design research process that directly involve end-users in the evaluationtask. The AET index that has been evaluated against each prototype shows aconstant reduction of the time necessary to complete a requested task. It showsvery interesting values and demonstrates the efficiency of the fourth prototypethat average require less than a minute to complete a single task. The SR indexdescribes the relevance of the adopted approach too and shows once again theclearness of the last evaluated prototype (i.e. 100% of successful tests).
6 Conclusions
In this paper a novel information visualisation approach for VSSs has been de-scribed. A VAM has been developed to identify and predict the path of object
of interest. Tracking data is used to evaluate object trajectories and determinecamera configurations. A HCI module has been used to select, organise and showbest streams to keep the object inside the UI. Obtained results have shown thatthe adopted information visualisation technique is very efficient and leads to amental effort reduction for end-users.
References
1. Bottoni, P., Marsico, M.D., Levialdi, S., Ottieri, G., Pierro, M., Quaresima, D.: Adynamic environment for video surveillance. INTERACT (2) pp. 892–895 (2009)
2. Chittaro, L.: Visualizing information on mobile devices. IEEE Computer 39(3),34–39 (March 2006)
3. Colineau, N., Phalip, J., Lampert, A.: The delivery of multimedia presentationsin a graphical user interface environment. In: 11th International Conference onIntelligent User Interface. pp. 279–281. Sydney, Australia (February 2006)
4. Foresti, G., Micheloni, C., Piciarelli, C.: Detecting moving people in video streams.Pattern Recognition Letters 26, 2232–2243 (2005)
5. Girgensohn, A., Kimber, D., Vaughan, J., Yang, T., Shipman, F., Turner, T., Ri-effel, E., Wilcox, L., Chen, F., Dunnigan, T.: Dots: Support for effective videosurveillance. In: in Proceedings of the 15th International Conference on Multime-dia. pp. 423–432. Augsburg, Germany (September 2007)
6. Iannizzotto, G., Costanzo, C., Rosa, F.L., Lanzafame, P.: A multimodal perceptualuser interface for video-surveillance environments. In: 7th International Conferenceon Multimodal Interfaces. pp. 45–52 (October 2005)
7. Lee, L., Romando, R., Stein, G.: Monitoring activities from multiple video streams:Establishing a common coordinate frame. IEEE Transactions on Pattern AnalysisAnd Machine Intelligence 22(8), 758–767 (August 2000)
8. Micheloni, C., Rinner, B., Foresti, G.L.: Video analysis in pan-tilt-zoom cameranetworks. IEEE Signal Processing Magazine 27(5), 78–90 (September 2010)
9. Morris, B.T., Trivedi, M.M.: Contextual activity visualization from long-term videoobservations. IEEE Intelligent Systems 25(3), 50–62 (May-June 2010)
10. Nielsen, J.: Usability inspection methods. In: Conference Companion on HumanFactors in Computing Systems. pp. 413–414. CHI ’94, ACM, New York, NY, USA(1994)
11. Piciarelli, C., Foresti, G.: Online trajectory clustering for anomalous event detec-tion. Pattern Recognition Letters 27, 1835–1842 (2006)
12. Qureshi, F.Z., Terzopoulos, D.: Planning ahead for ptz camera assignment andhandoff. In: Third ACM/IEEE International Conference on Distributed SmartCameras 2009. pp. 1–8. Como, Italy (August-September 2009)
13. Rieffel, E.G., Girgensohn, A., Kimber, D., Chen, T., Liu, Q.: Geometric tools formulticamera surveillance systems. In: First ACM/IEEE International Conferenceon Distributed Smart Cameras. pp. 132–139. ACM/IEEE (September 2007)
14. Spence, R.: Information Visualization. Addison Wesley, Harlow (2000)15. Wharton, C., Rieman, J., Lewis, C., Polson, P.: Usability Inspection Methods,
chap. 5, pp. 105–140. Wiley, 1 edn. (1994)