Embed Size (px)
Citation preview
9/17/2015
1
Chapter 1
Lecture Presentation
Representing Motion
Lecture Presentation
© 2015 Pearson Education, Inc. Slide 1-2
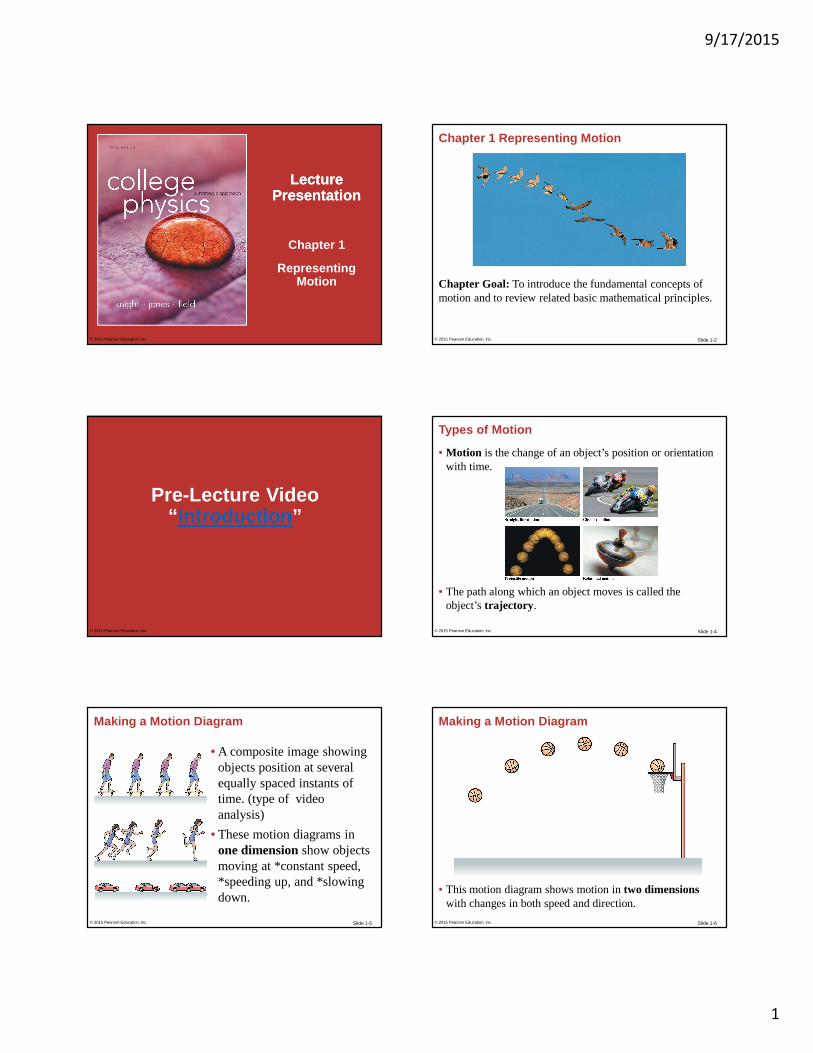
Chapter 1 Representing Motion
Chapter Goal: To introduce the fundamental concepts of motion and to review related basic mathematical principles.
© 2015 Pearson Education, Inc.
Pre-Lecture Video“ Introduction ”
© 2015 Pearson Education, Inc. Slide 1-4
Types of Motion
• Motion is the change of an object’s position or orientation with time.
• The path along which an object moves is called the object’s trajectory .
© 2015 Pearson Education, Inc.
Slide 1-5
Making a Motion Diagram
• A composite image showing objects position at several equally spaced instants of time. (type of video analysis)
• These motion diagrams in one dimension show objects moving at *constant speed, *speeding up, and *slowing down.
© 2015 Pearson Education, Inc. Slide 1-6
Making a Motion Diagram
• This motion diagram shows motion in two dimensions with changes in both speed and direction.
© 2015 Pearson Education, Inc.
9/17/2015
2
Slide 1-7
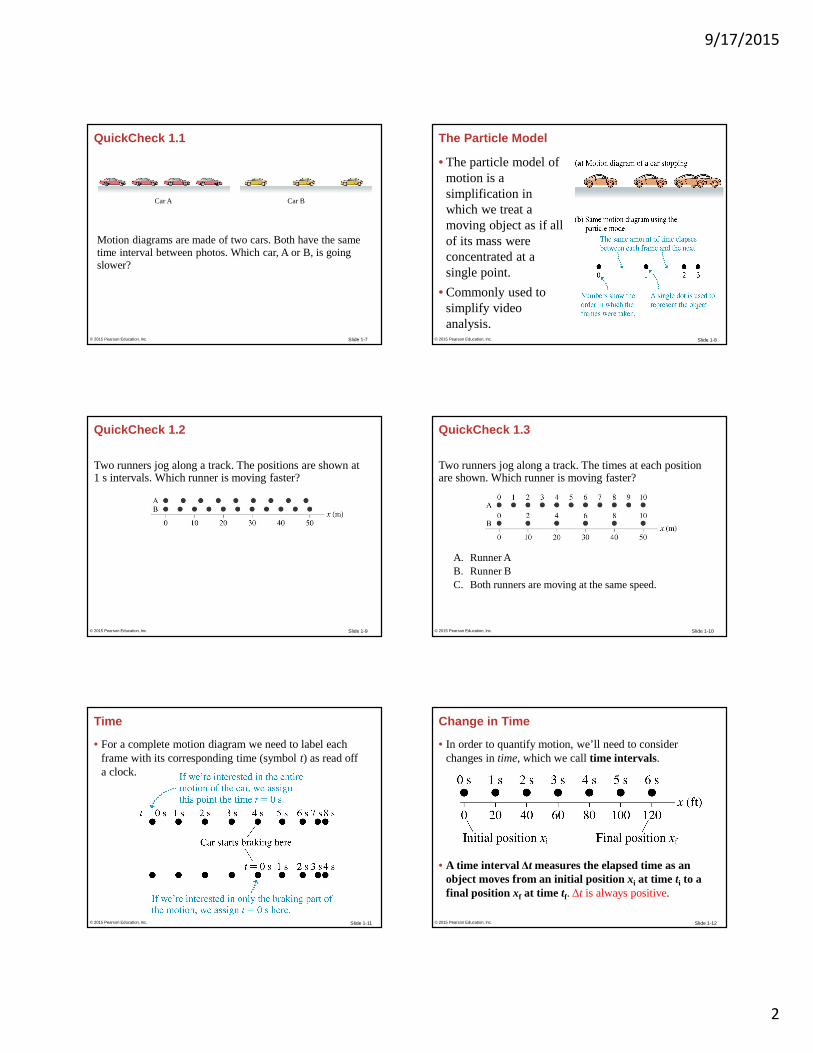
Motion diagrams are made of two cars. Both have the same time interval between photos. Which car, A or B, is going slower?
Car A Car B
QuickCheck 1.1
© 2015 Pearson Education, Inc. Slide 1-8
The Particle Model
• The particle model of motion is a simplification in which we treat a moving object as if all of its mass were concentrated at a single point.
• Commonly used to simplify video analysis.
© 2015 Pearson Education, Inc.
Slide 1-9
QuickCheck 1.2
Two runners jog along a track. The positions are shown at 1 s intervals. Which runner is moving faster?
© 2015 Pearson Education, Inc. Slide 1-10
QuickCheck 1.3
Two runners jog along a track. The times at each position are shown. Which runner is moving faster?
A. Runner AB. Runner BC. Both runners are moving at the same speed.
© 2015 Pearson Education, Inc.
Slide 1-11
Time
• For a complete motion diagram we need to label each frame with its corresponding time (symbol t) as read off a clock.
© 2015 Pearson Education, Inc. Slide 1-12
Change in Time
• In order to quantify motion, we’ll need to consider changes in time, which we call time intervals.
• A time interval ∆t measures the elapsed time as an object moves from an initial position xi at time ti to a final position xf at time tf. ∆t is always positive.
© 2015 Pearson Education, Inc.
9/17/2015
3
Slide 1-13
Position and Coordinate Systems
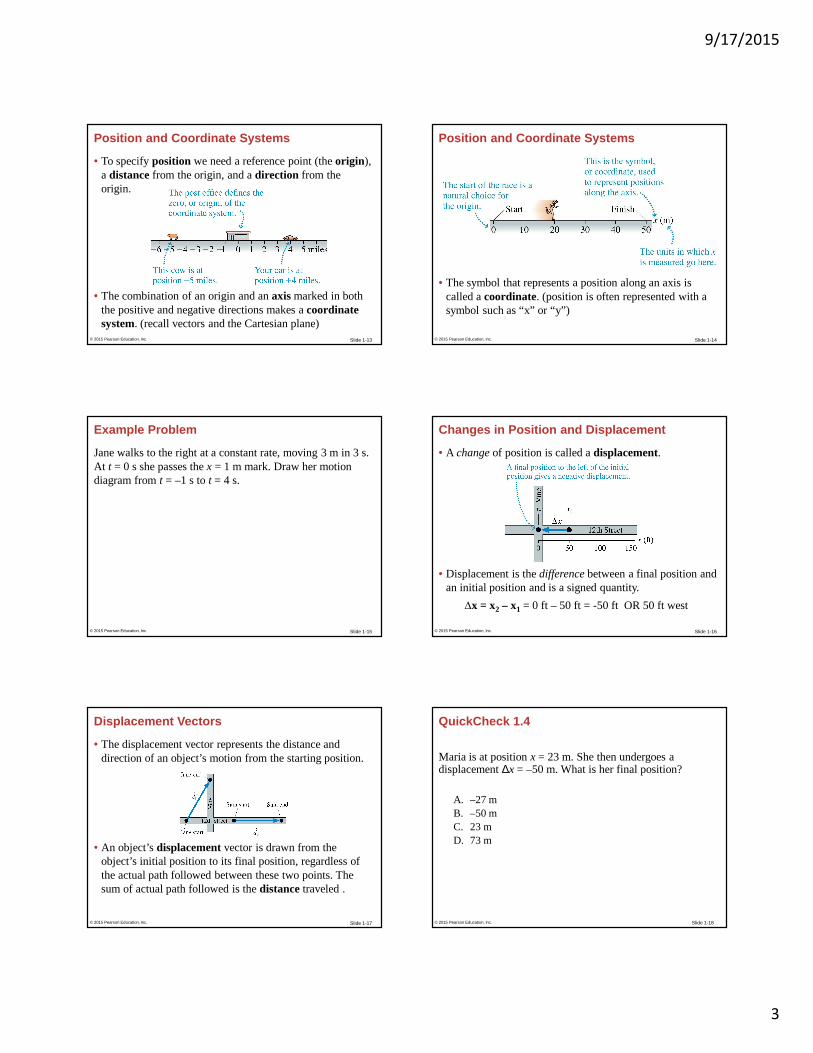
• To specify position we need a reference point (the origin ), a distancefrom the origin, and a direction from the origin.
• The combination of an origin and an axismarked in both the positive and negative directions makes a coordinate system. (recall vectors and the Cartesian plane)
© 2015 Pearson Education, Inc. Slide 1-14
Position and Coordinate Systems
• The symbol that represents a position along an axis is called a coordinate. (position is often represented with a symbol such as “x” or “y”)
© 2015 Pearson Education, Inc.
Slide 1-15
Example Problem
Jane walks to the right at a constant rate, moving 3 m in 3 s. At t = 0 s she passes the x = 1 m mark. Draw her motion diagram from t = –1 s to t = 4 s.
© 2015 Pearson Education, Inc. Slide 1-16
Changes in Position and Displacement
• A change of position is called a displacement.
• Displacement is the difference between a final position and an initial position and is a signed quantity.
∆x = x2 – x1 = 0 ft – 50 ft = -50 ft OR 50 ft west
© 2015 Pearson Education, Inc.
Slide 1-17
Displacement Vectors
• The displacement vector represents the distance and direction of an object’s motion from the starting position.
• An object’s displacement vector is drawn from the object’s initial position to its final position, regardless of the actual path followed between these two points. The sum of actual path followed is the distancetraveled .
© 2015 Pearson Education, Inc. Slide 1-18
QuickCheck 1.4
Maria is at position x = 23 m. She then undergoes a displacement ∆x = –50 m. What is her final position?
A. –27 mB. –50 mC. 23 mD. 73 m
© 2015 Pearson Education, Inc.
9/17/2015
4
Slide 1-19
QuickCheck 1.5
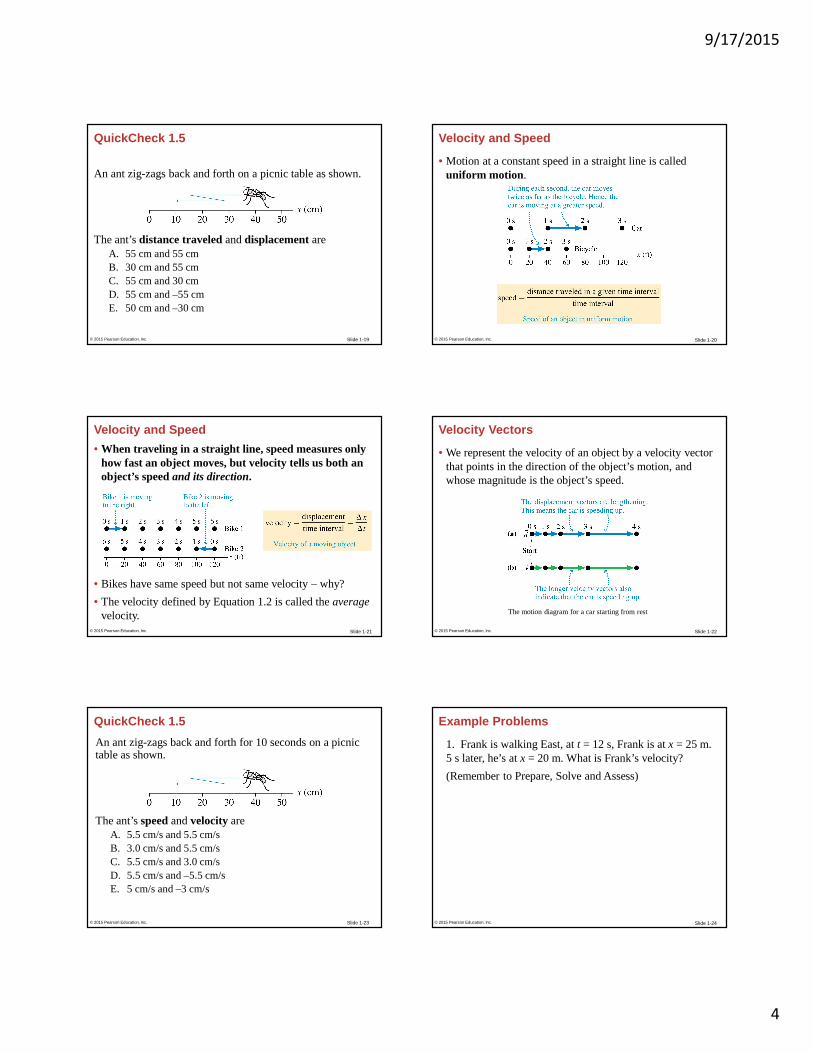
An ant zig-zags back and forth on a picnic table as shown.
The ant’s distance traveledand displacementareA. 55 cm and 55 cmB. 30 cm and 55 cmC. 55 cm and 30 cmD. 55 cm and –55 cmE. 50 cm and –30 cm
© 2015 Pearson Education, Inc. Slide 1-20
Velocity and Speed
• Motion at a constant speed in a straight line is called uniform motion .
© 2015 Pearson Education, Inc.
Slide 1-21
Velocity and Speed
• When traveling in a straight line, speed measures only how fast an object moves, but velocity tells us both an object’s speed and its direction.
• Bikes have same speed but not same velocity – why?
• The velocity defined by Equation 1.2 is called the averagevelocity.
© 2015 Pearson Education, Inc. Slide 1-22
Velocity Vectors
• We represent the velocity of an object by a velocity vector that points in the direction of the object’s motion, and whose magnitude is the object’s speed.
The motion diagram for a car starting from rest
© 2015 Pearson Education, Inc.
Slide 1-23
QuickCheck 1.5
An ant zig-zags back and forth for 10 seconds on a picnic table as shown.
The ant’s speed and velocity areA. 5.5 cm/s and 5.5 cm/sB. 3.0 cm/s and 5.5 cm/sC. 5.5 cm/s and 3.0 cm/sD. 5.5 cm/s and –5.5 cm/sE. 5 cm/s and –3 cm/s
© 2015 Pearson Education, Inc. Slide 1-24
Example Problems
1. Frank is walking East, at t = 12 s, Frank is at x = 25 m. 5 s later, he’s at x = 20 m. What is Frank’s velocity?
(Remember to Prepare, Solve and Assess)
© 2015 Pearson Education, Inc.
9/17/2015
5
Slide 1-25
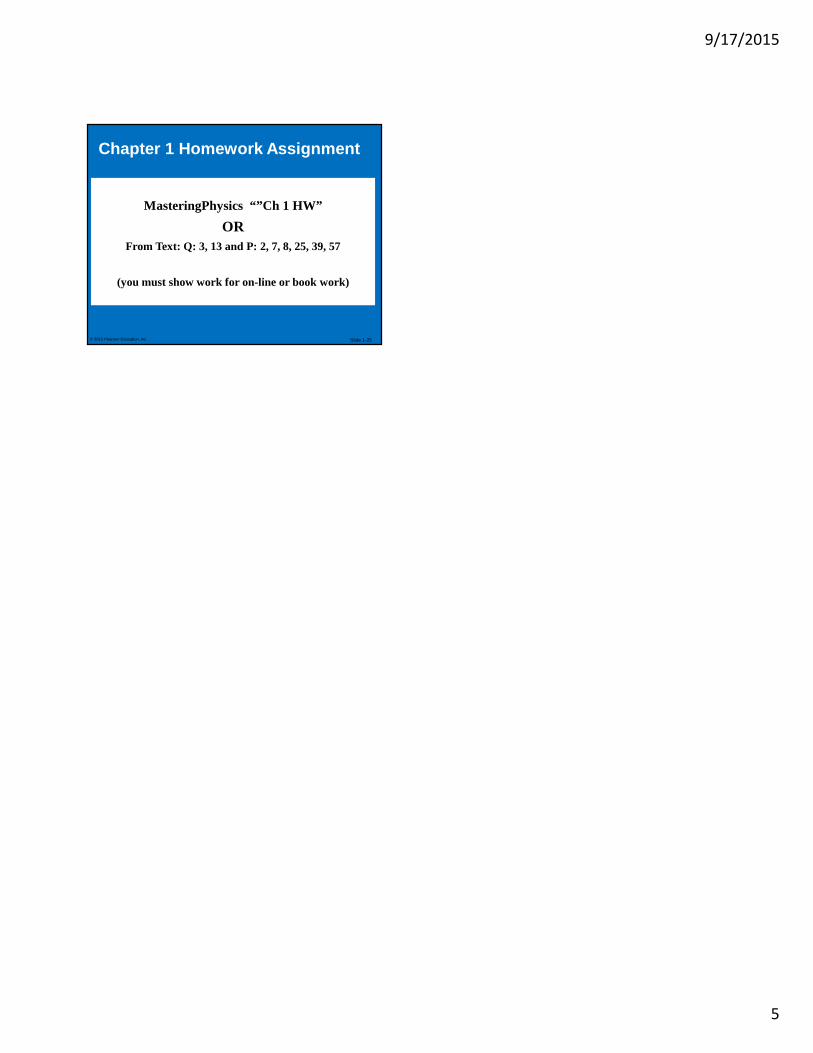
Chapter 1 Homework Assignment
MasteringPhysics “”Ch 1 HW”
ORFrom Text: Q: 3, 13 and P: 2, 7, 8, 25, 39, 57
(you must show work for on-line or book work)
© 2015 Pearson Education, Inc.