Embed Size (px)
Citation preview
Precipitation & Runoff modeling of Savinja catchment
36. Goljevščkov spominski danLjubljana, 23.03.2017Email: [email protected]
1
Hidrološko modeliranje porečja Savinje
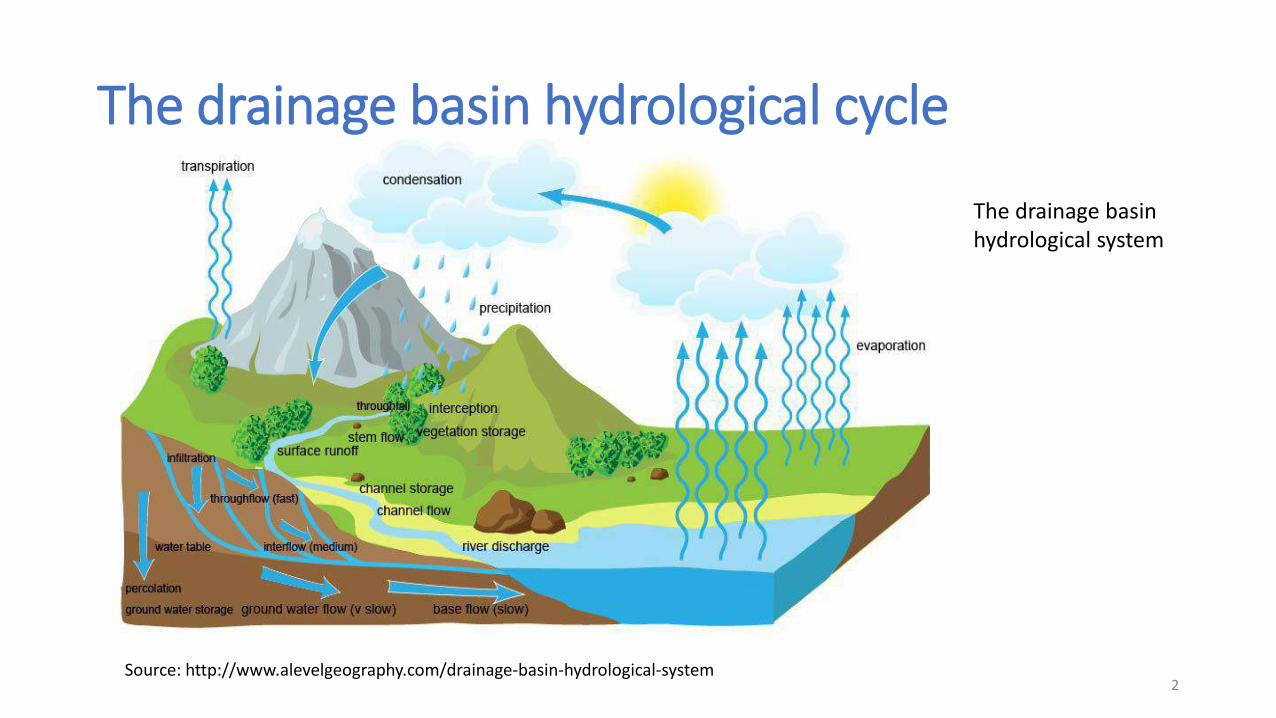
The drainage basin hydrological cycle
Source: http://www.alevelgeography.com/drainage-basin-hydrological-system
The drainage basin hydrological system
2
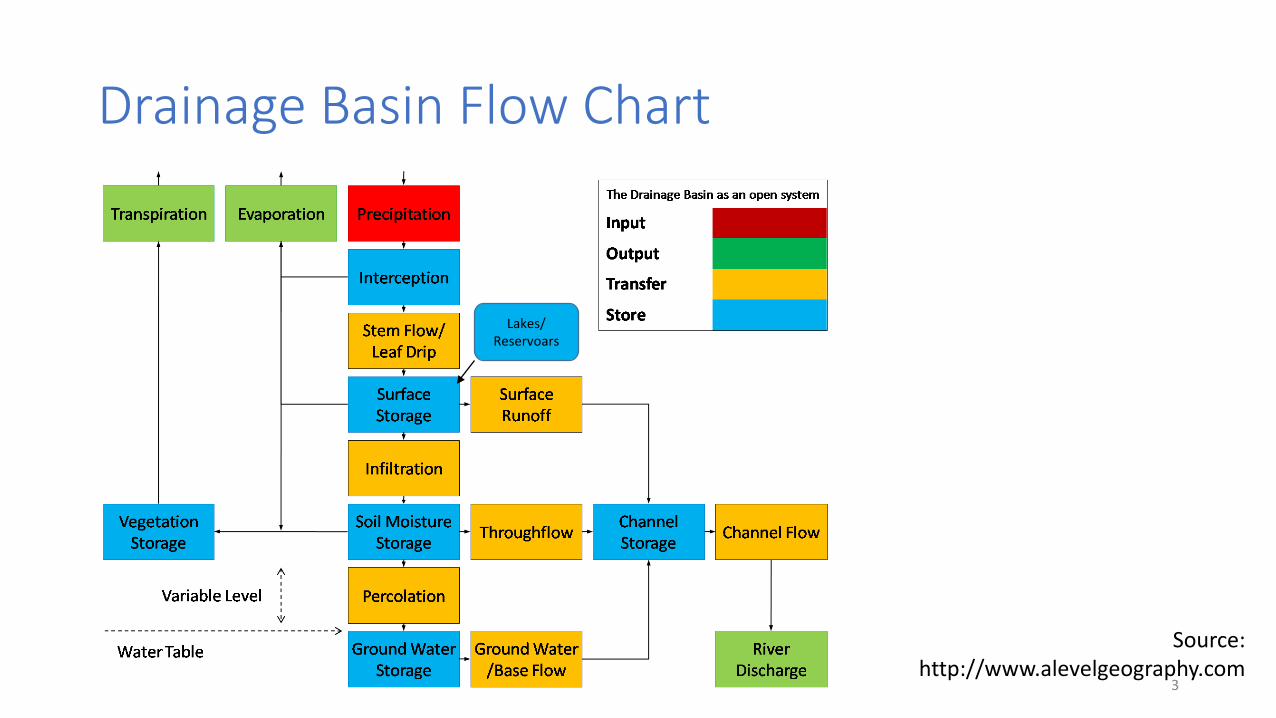
Drainage Basin Flow Chart
Source: http://www.alevelgeography.com
Lakes/ Reservoars
3
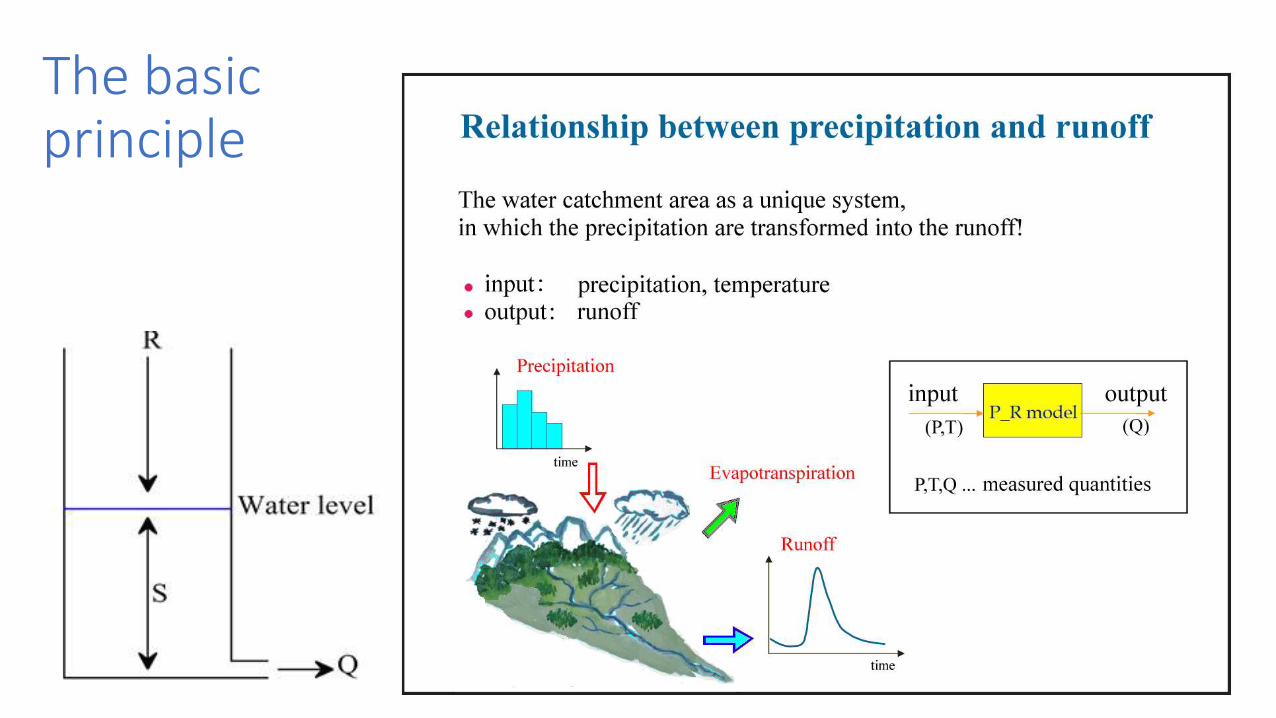
The basicprinciple
4

Which hydrological model?
• various ongoing researches are there on topics like which model will give more compatible results compared to P-R relations
• HSPF, HSPEXP+, TOPMODEL, HBV-96, WFLOW Py(distributed HBV), MIKE-SHE, SWAT, SWMM, RS Minerve…
HBV-light & PEST
HBV-light: http://www.geo.uzh.ch/en/units/h2k/services/hbv-model/PEST: http://www.pesthomepage.org/
5
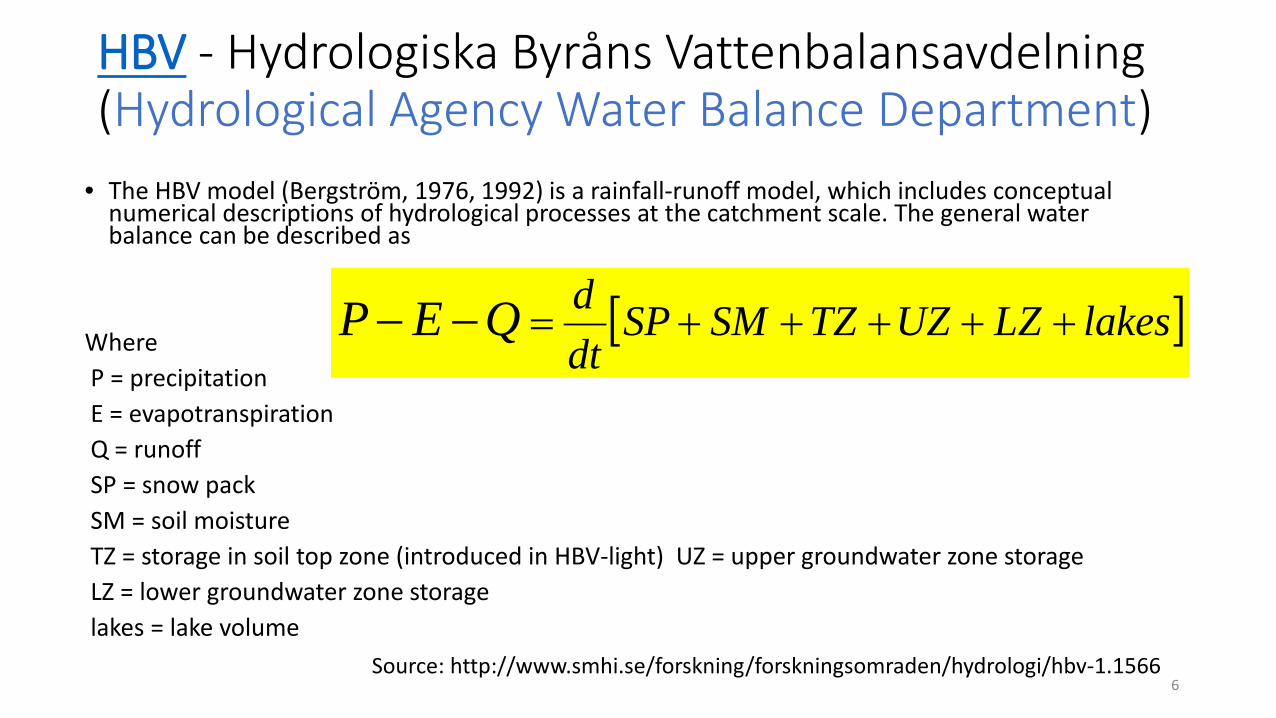
HBV - Hydrologiska Byråns Vattenbalansavdelning(Hydrological Agency Water Balance Department)
• The HBV model (Bergström, 1976, 1992) is a rainfall-runoff model, which includes conceptual numerical descriptions of hydrological processes at the catchment scale. The general water balance can be described as
WhereP = precipitationE = evapotranspirationQ = runoffSP = snow packSM = soil moistureTZ = storage in soil top zone (introduced in HBV-light) UZ = upper groundwater zone storageLZ = lower groundwater zone storagelakes = lake volume
[ ]lakesLZUZTZSMSPdtdQEP +++++=−−
6Source: http://www.smhi.se/forskning/forskningsomraden/hydrologi/hbv-1.1566
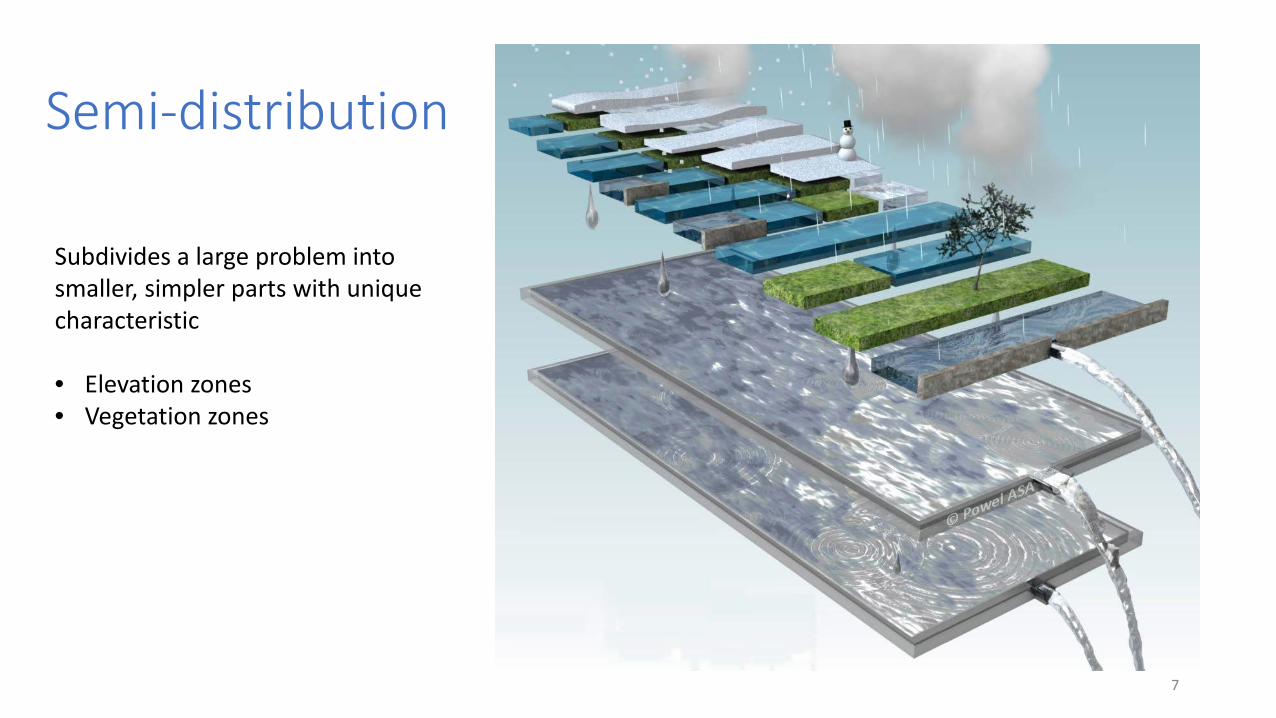
Semi-distribution
7
Subdivides a large problem into smaller, simpler parts with unique characteristic
• Elevation zones• Vegetation zones
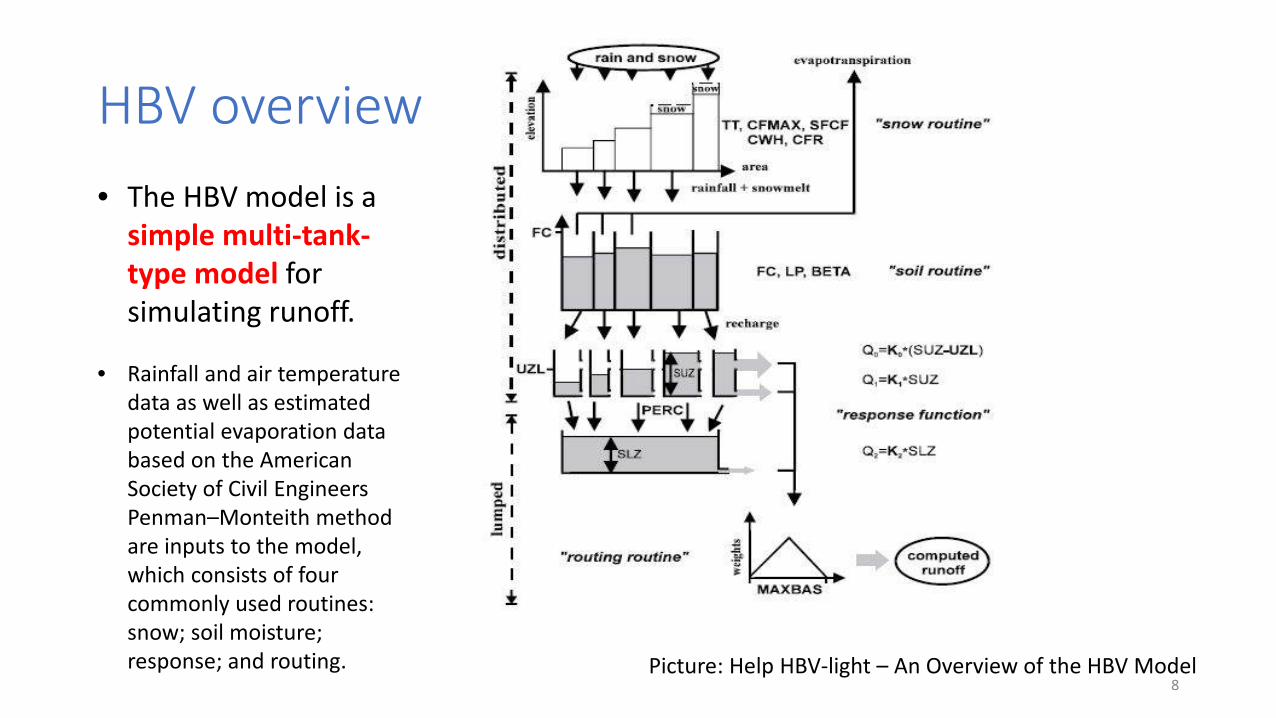
HBV overview
8
• The HBV model is a simple multi-tank-type model for simulating runoff.
• Rainfall and air temperature data as well as estimated potential evaporation data based on the American Society of Civil Engineers Penman–Monteith method are inputs to the model, which consists of four commonly used routines: snow; soil moisture; response; and routing. Picture: Help HBV-light – An Overview of the HBV Model
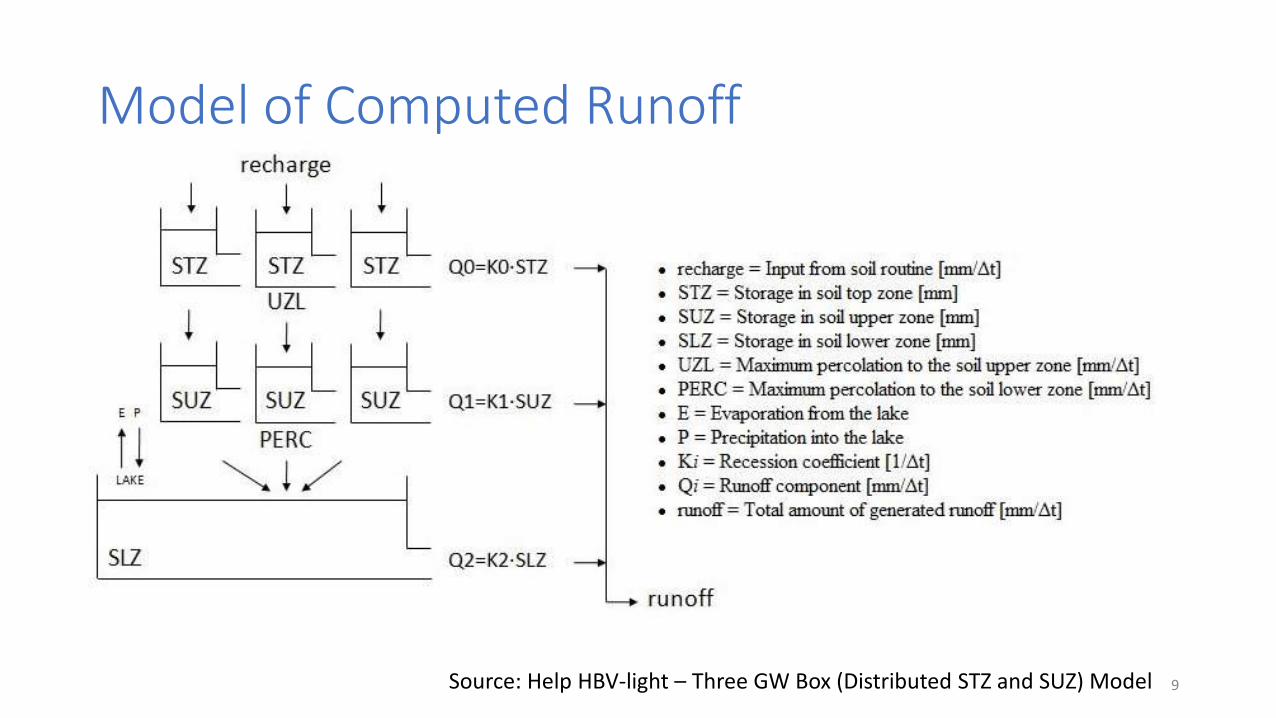
Model of Computed Runoff
9Source: Help HBV-light – Three GW Box (Distributed STZ and SUZ) Model
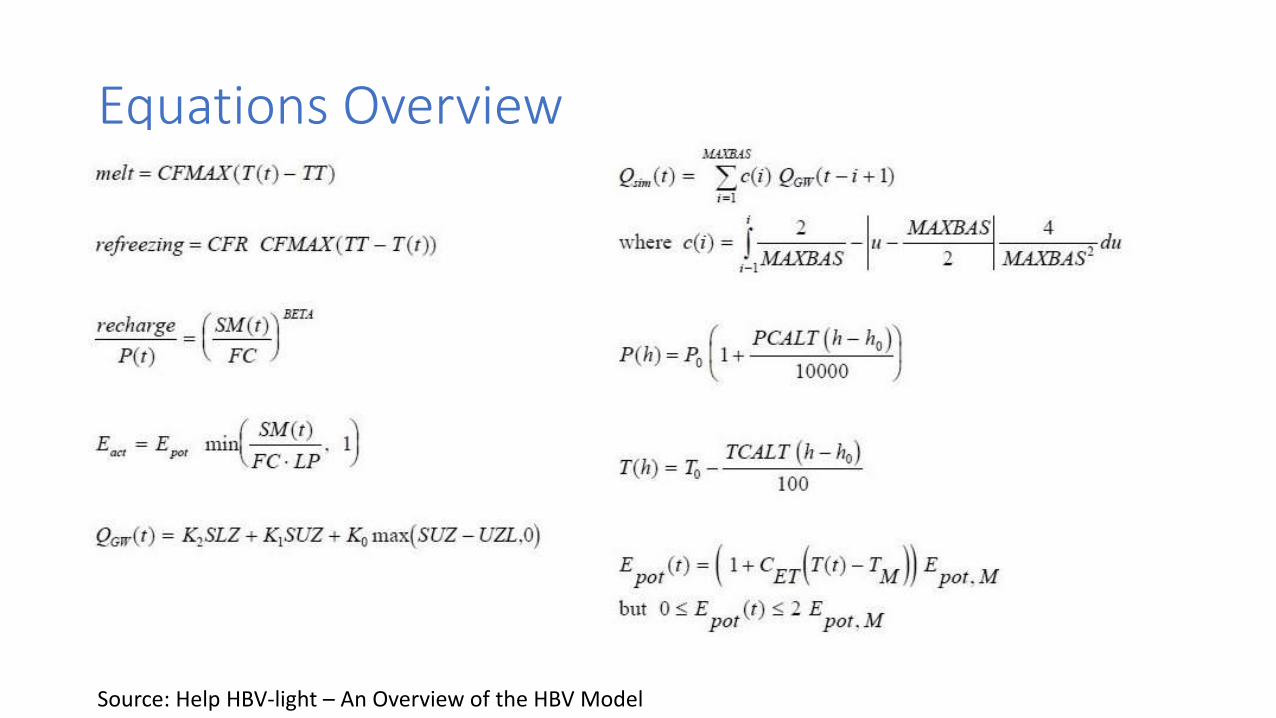
Equations Overview
Source: Help HBV-light – An Overview of the HBV Model
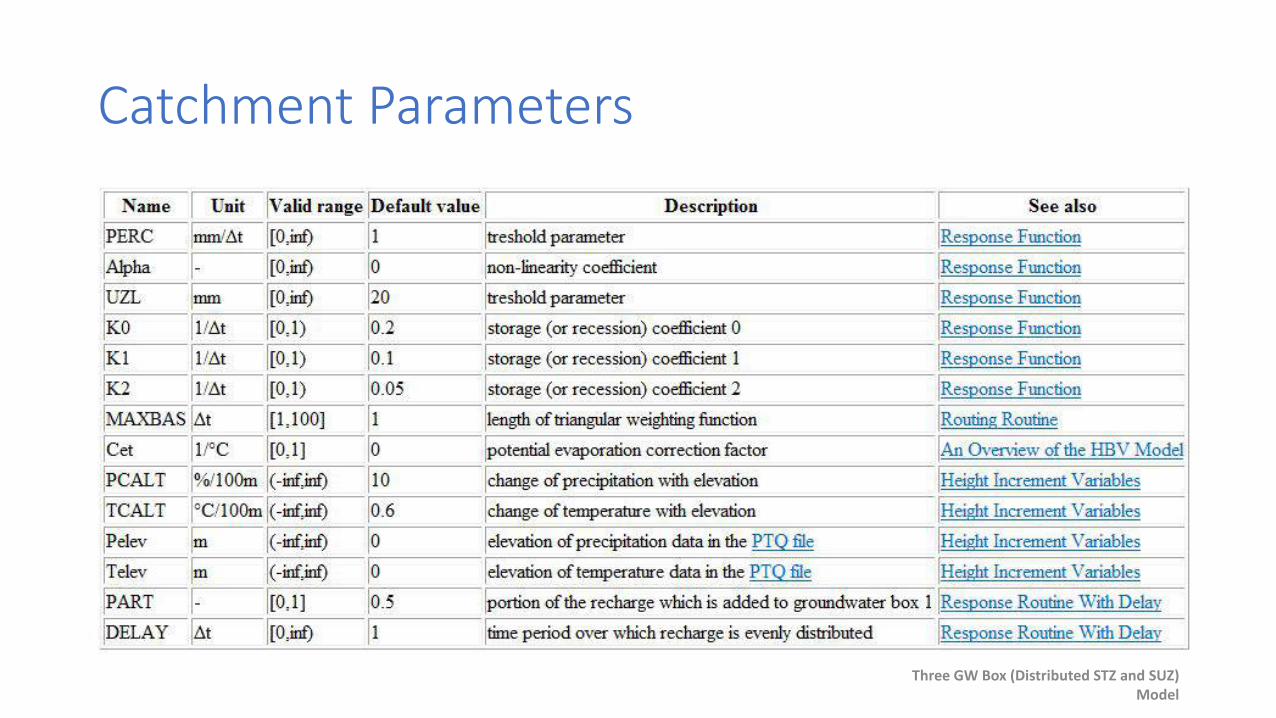
Catchment Parameters
Three GW Box (Distributed STZ and SUZ) Model
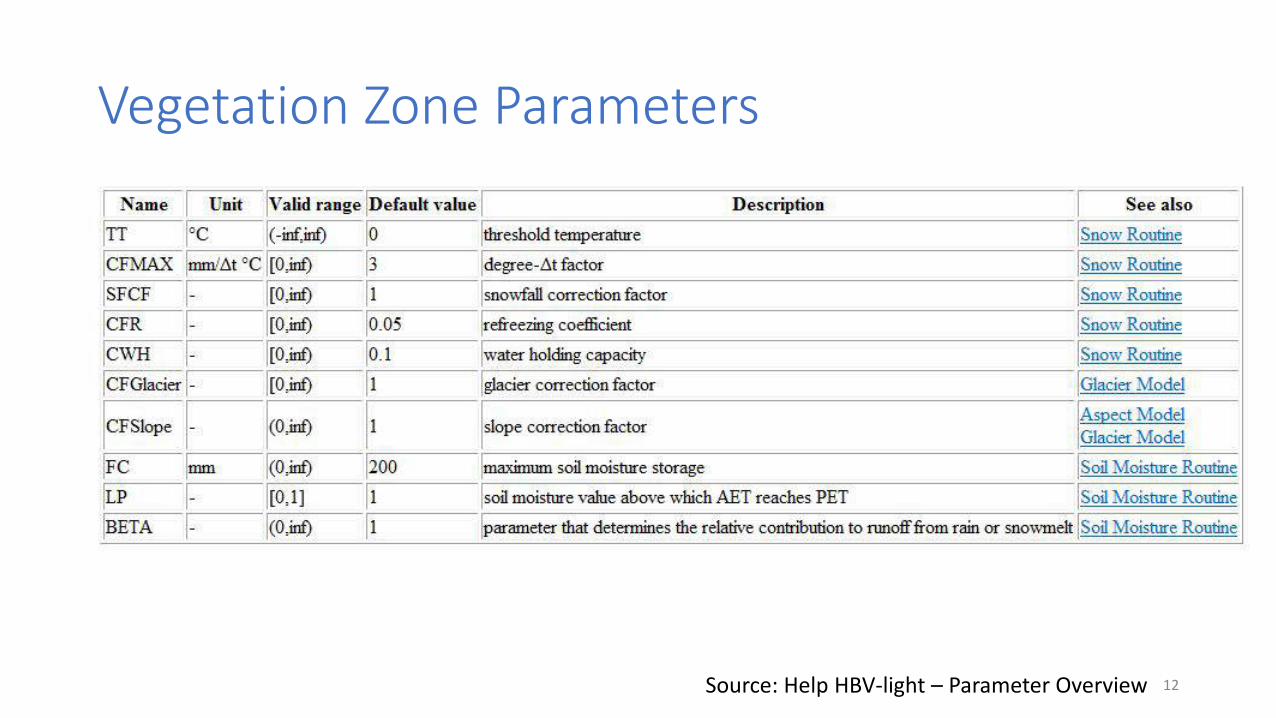
Vegetation Zone Parameters
12Source: Help HBV-light – Parameter Overview
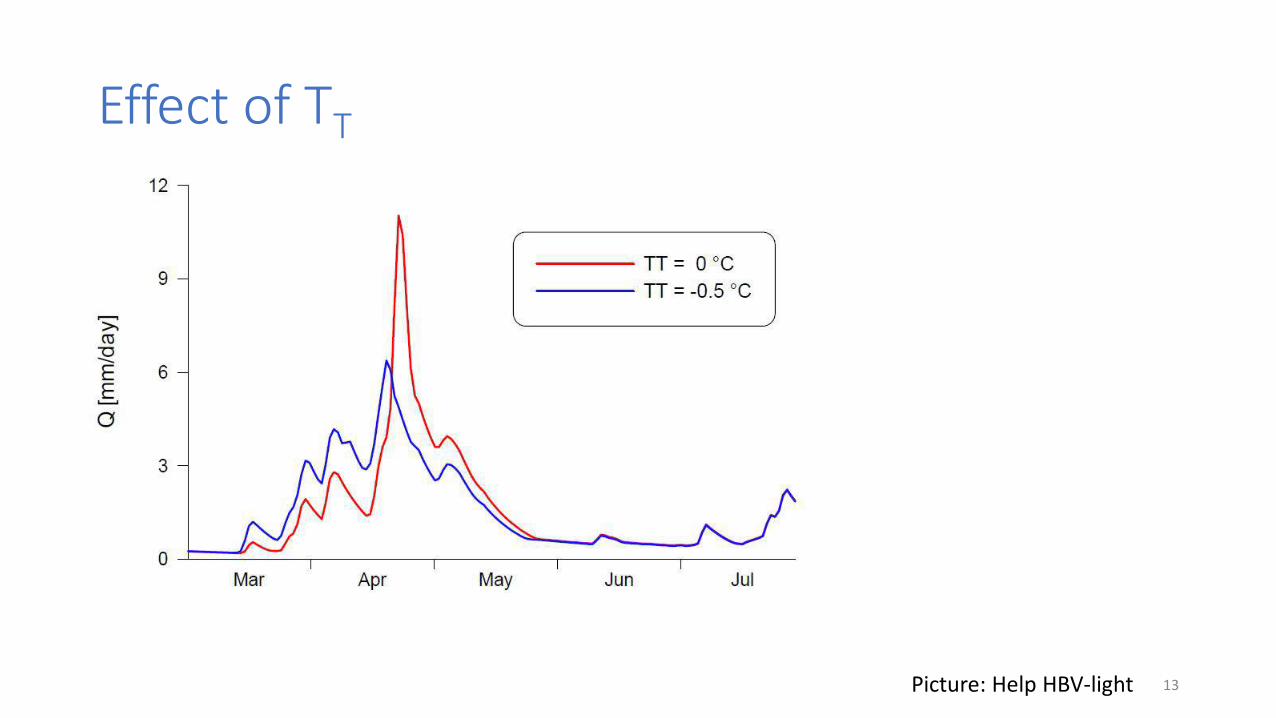
Effect of TT
13Picture: Help HBV-light
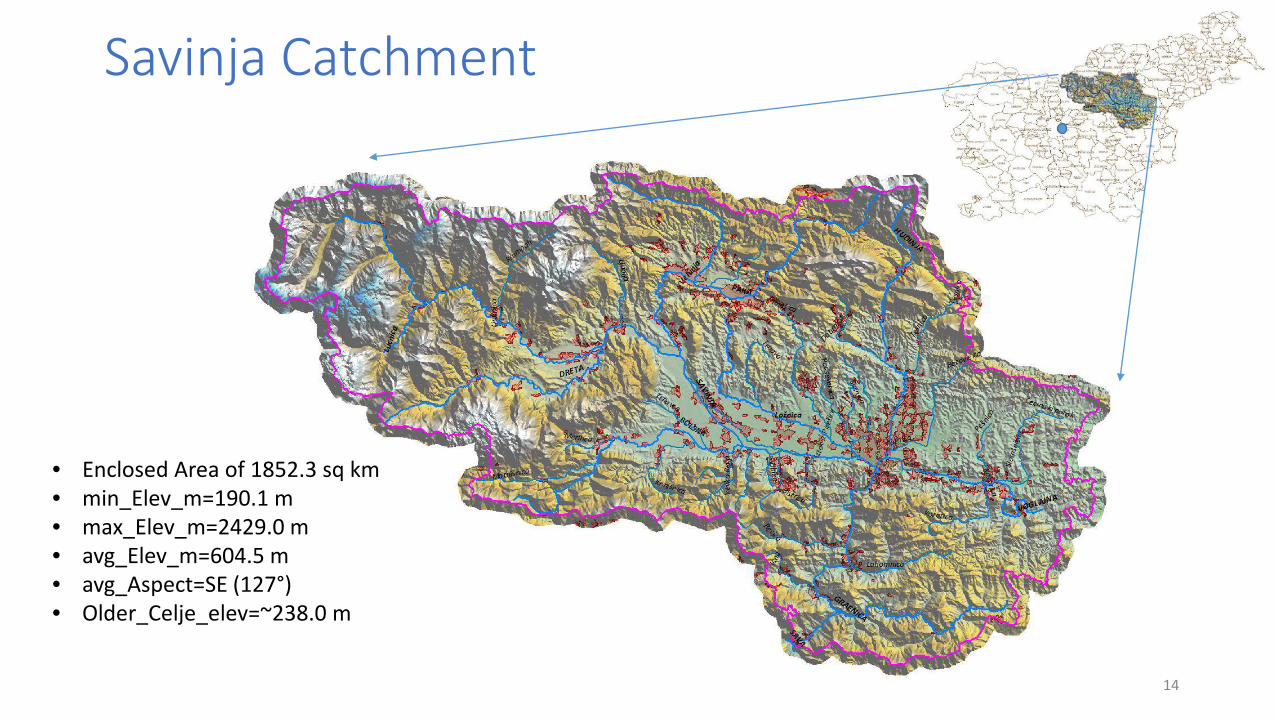
Savinja Catchment
14
• Enclosed Area of 1852.3 sq km• min_Elev_m=190.1 m• max_Elev_m=2429.0 m• avg_Elev_m=604.5 m• avg_Aspect=SE (127°)• Older_Celje_elev=~238.0 m
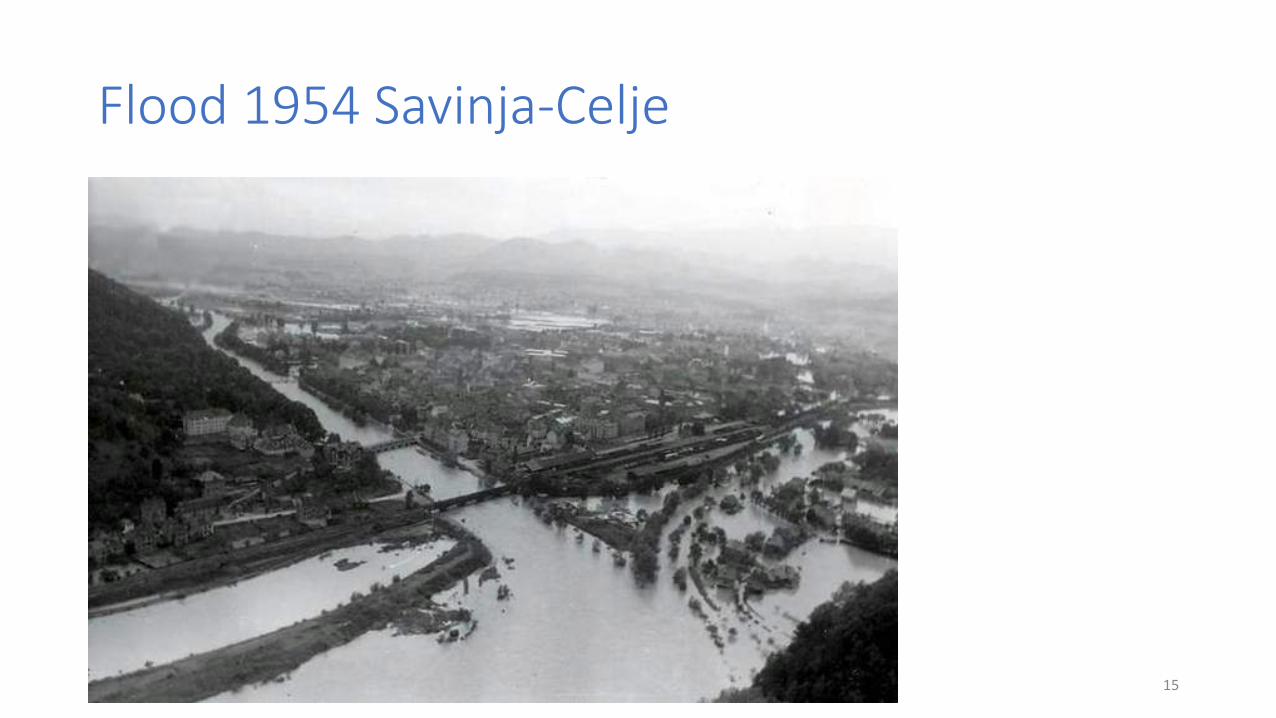
Flood 1954 Savinja-Celje
15
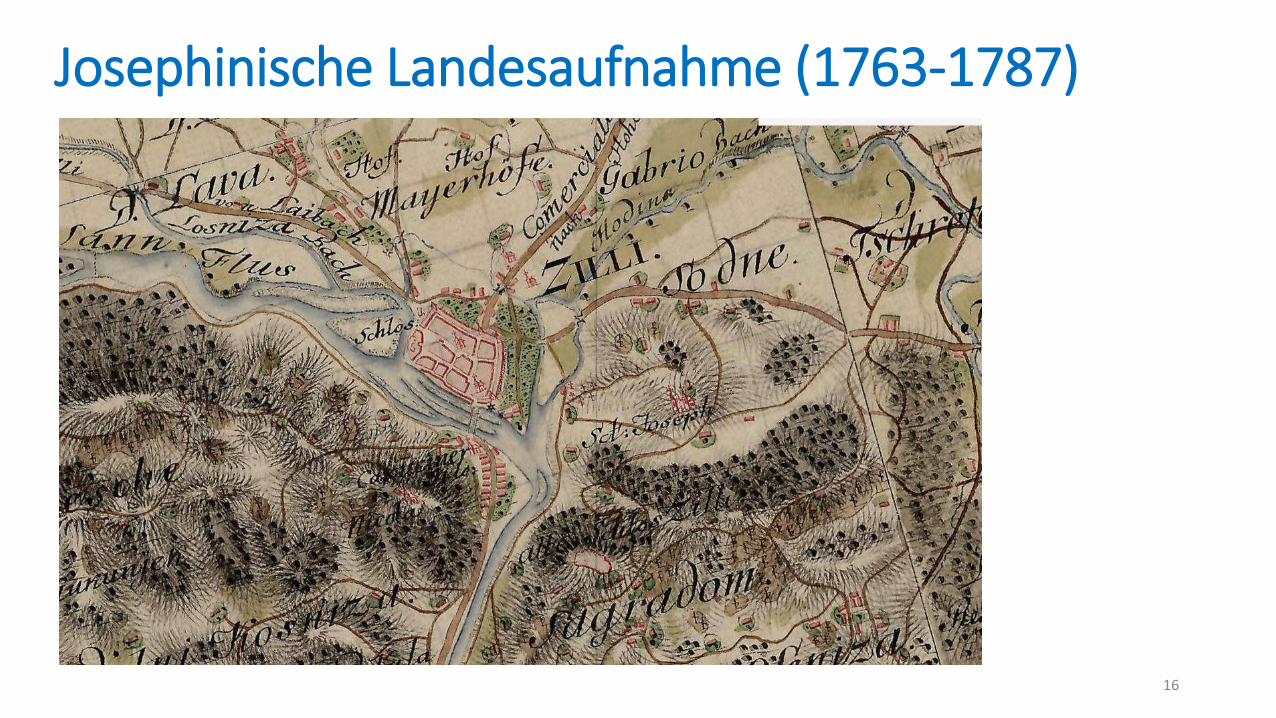
Josephinische Landesaufnahme (1763-1787)
16
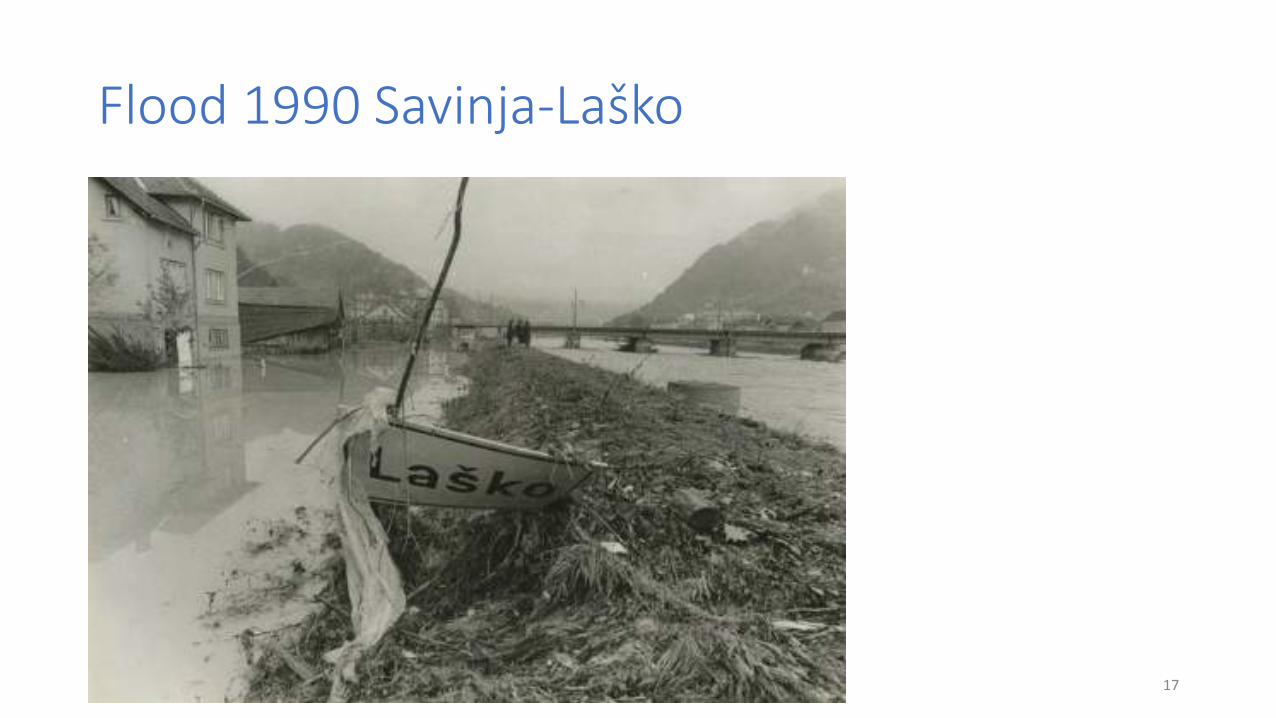
Flood 1990 Savinja-Laško
17
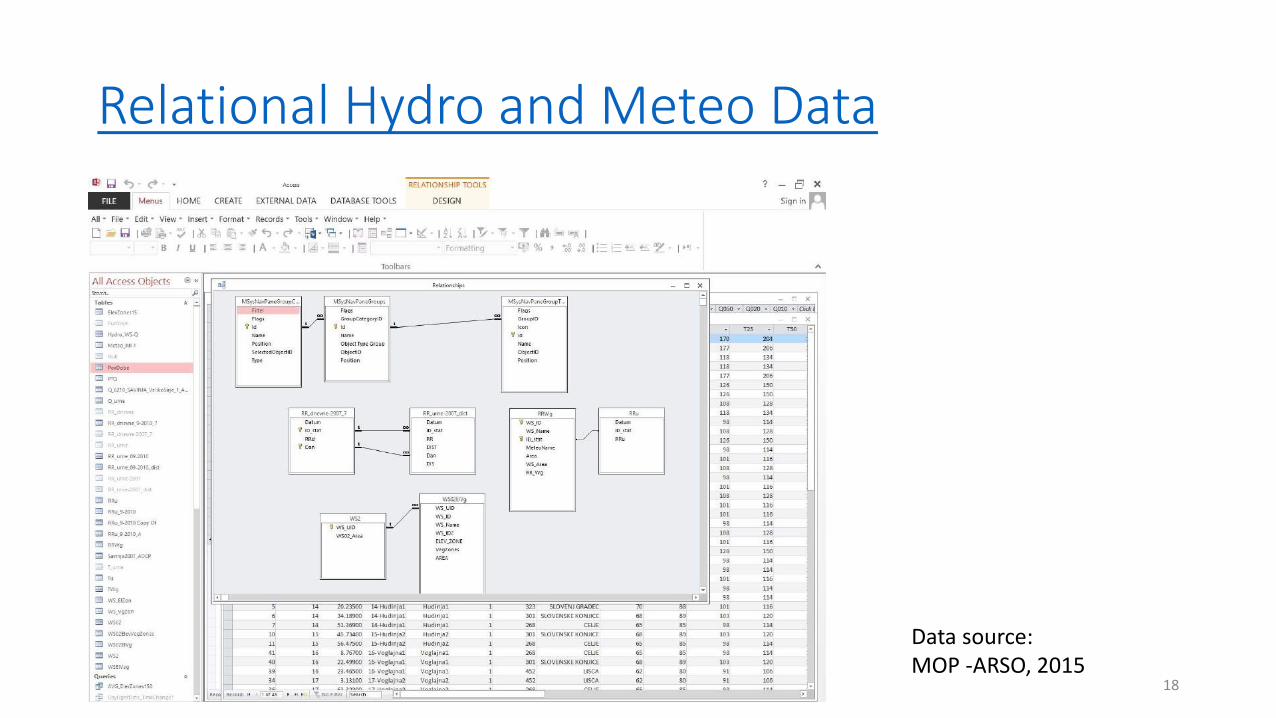
Relational Hydro and Meteo Data
18
Data source:MOP -ARSO, 2015
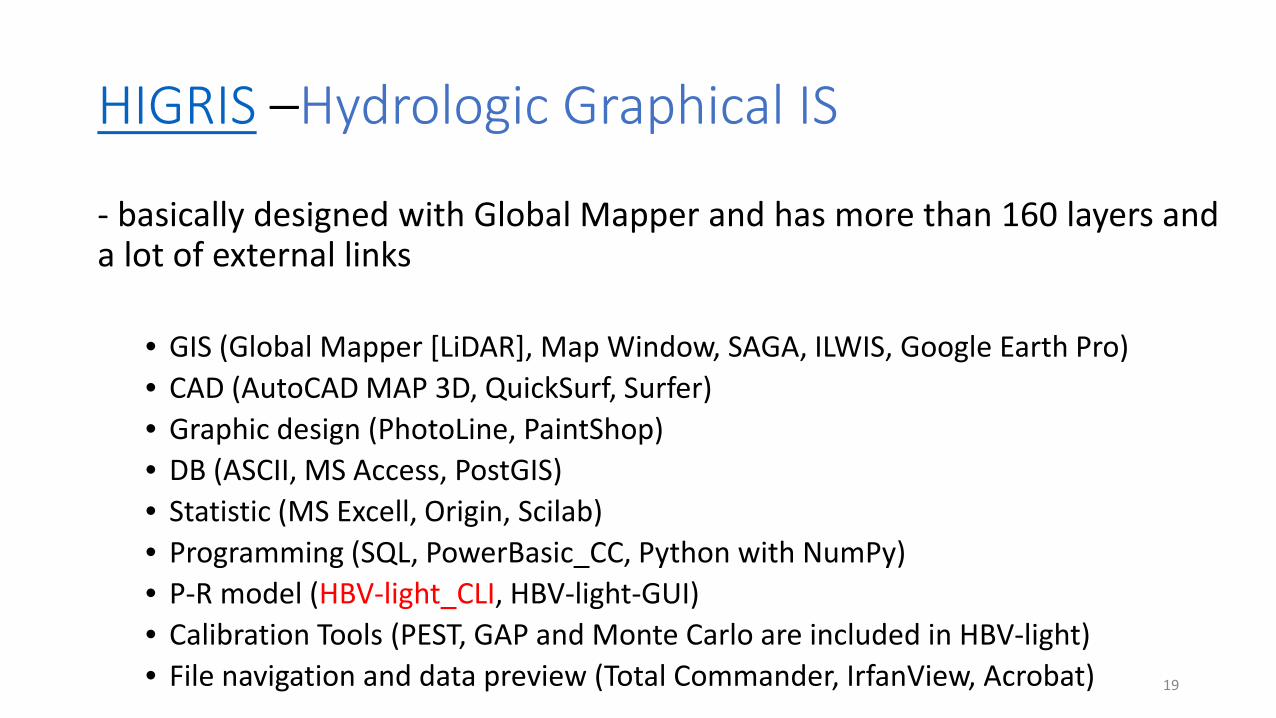
HIGRIS –Hydrologic Graphical IS
- basically designed with Global Mapper and has more than 160 layers and a lot of external links
• GIS (Global Mapper [LiDAR], Map Window, SAGA, ILWIS, Google Earth Pro)• CAD (AutoCAD MAP 3D, QuickSurf, Surfer)• Graphic design (PhotoLine, PaintShop)• DB (ASCII, MS Access, PostGIS)• Statistic (MS Excell, Origin, Scilab)• Programming (SQL, PowerBasic_CC, Python with NumPy)• P-R model (HBV-light_CLI, HBV-light-GUI)• Calibration Tools (PEST, GAP and Monte Carlo are included in HBV-light)• File navigation and data preview (Total Commander, IrfanView, Acrobat) 19
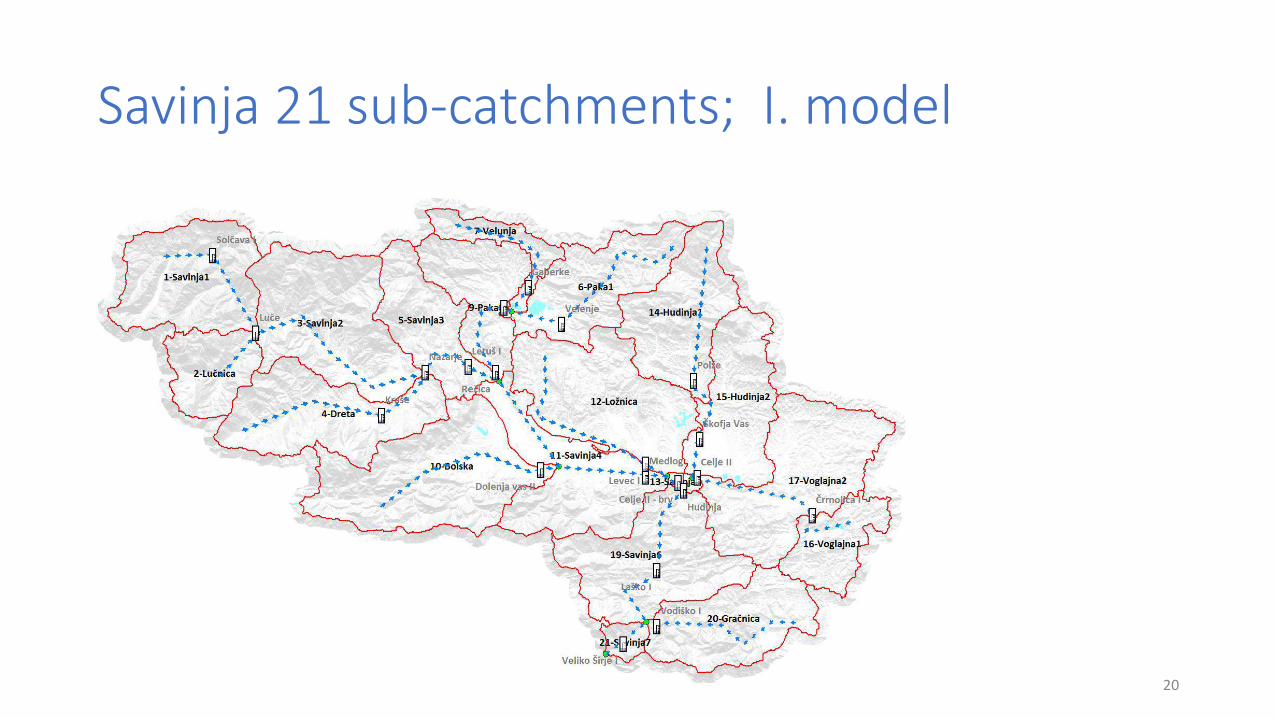
Savinja 21 sub-catchments; I. model
20
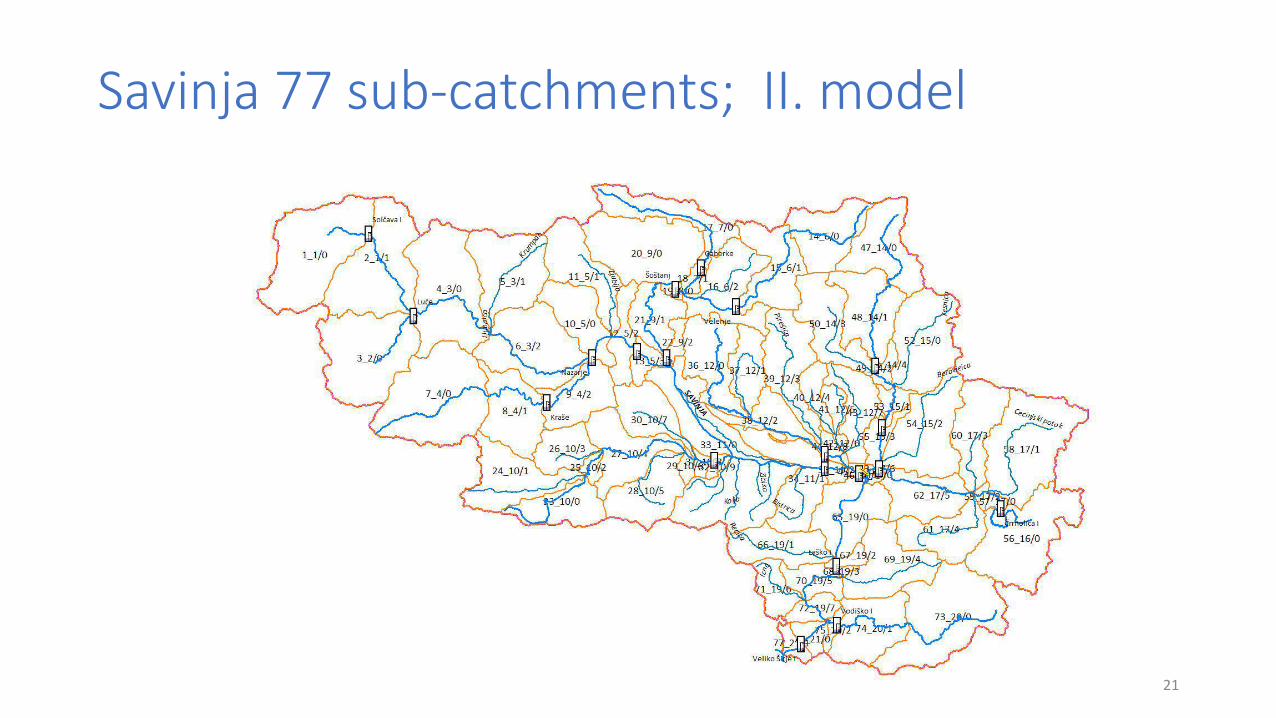
Savinja 77 sub-catchments; II. model
21
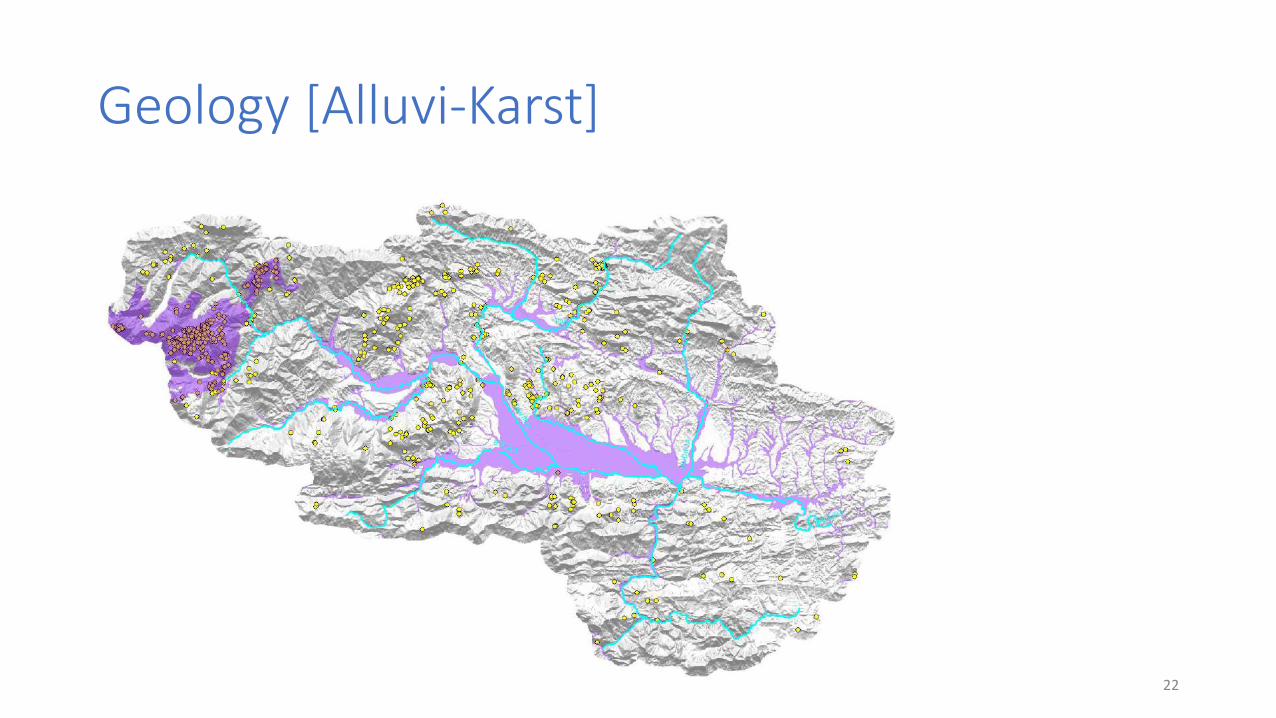
Geology [Alluvi-Karst]
22
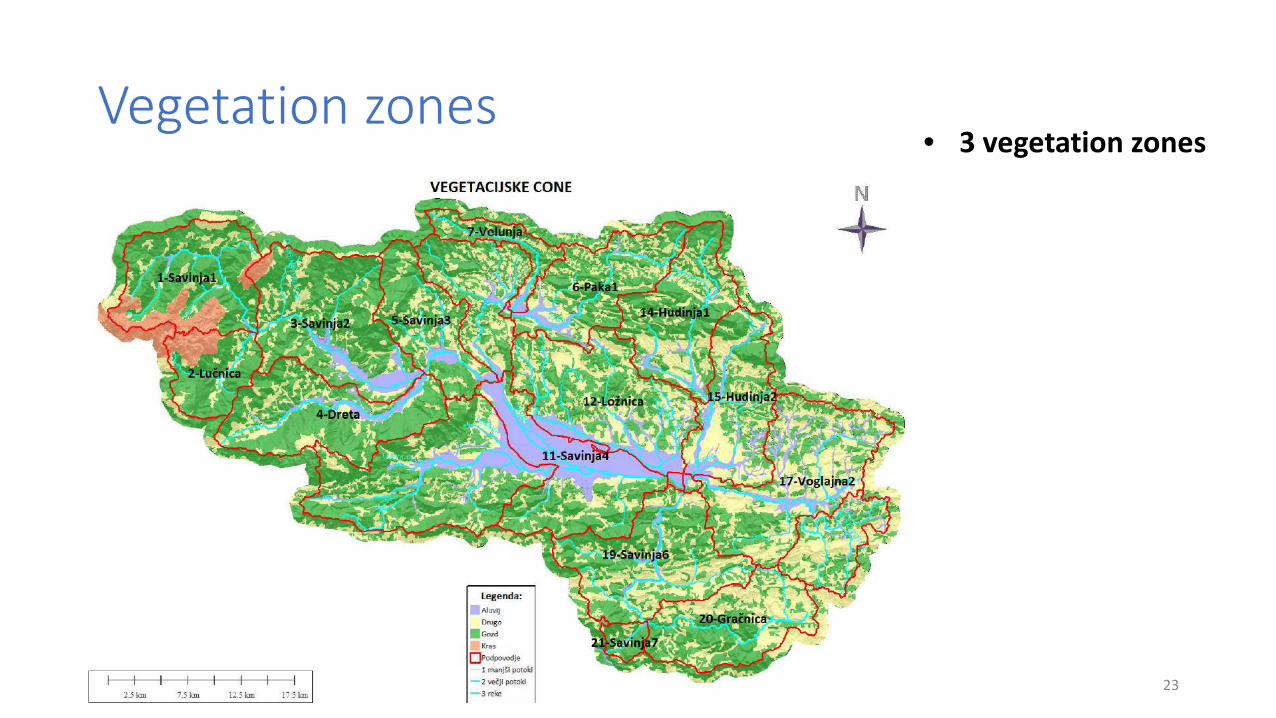
Vegetation zones
23
• 3 vegetation zones
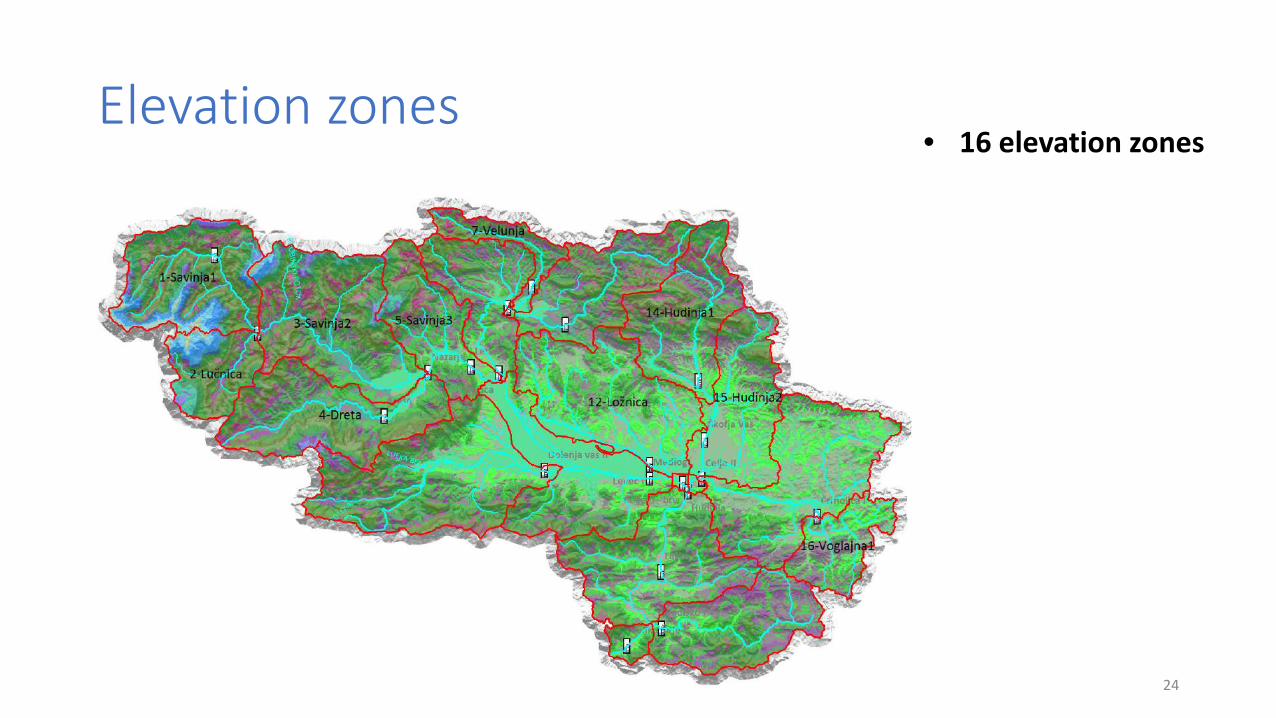
Elevation zones
24
• 16 elevation zones
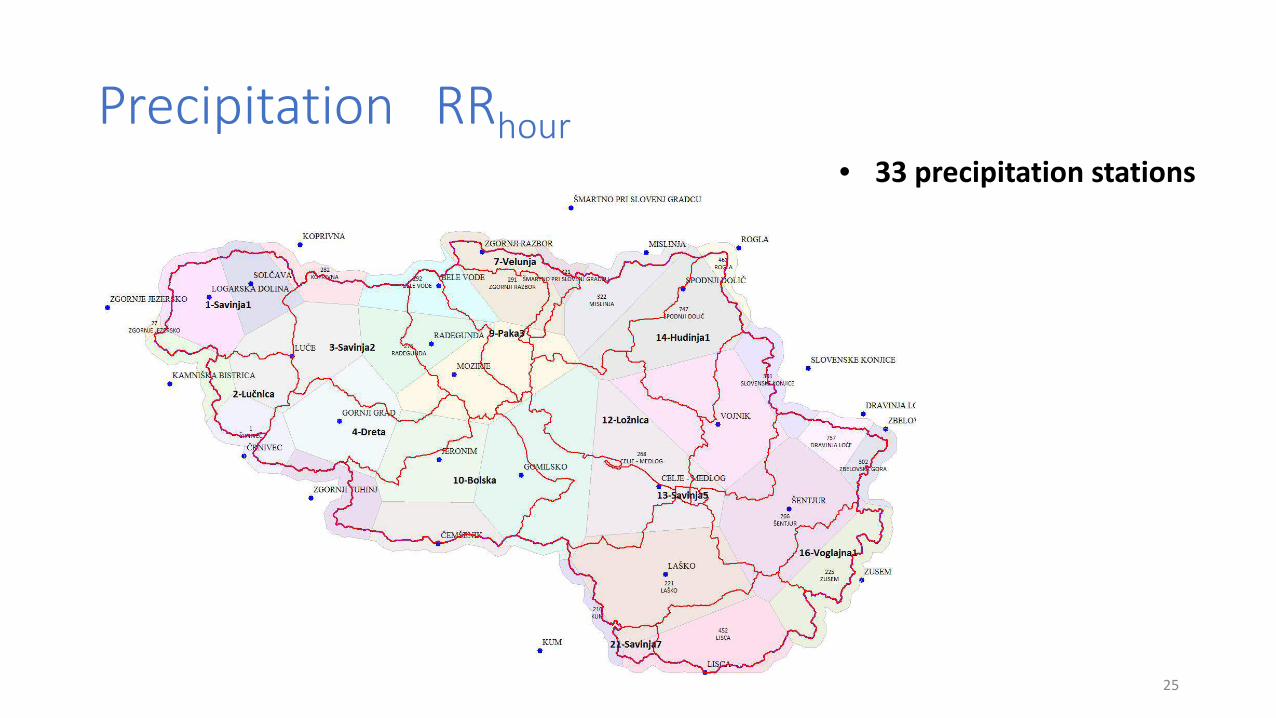
Precipitation RRhour
25
• 33 precipitation stations
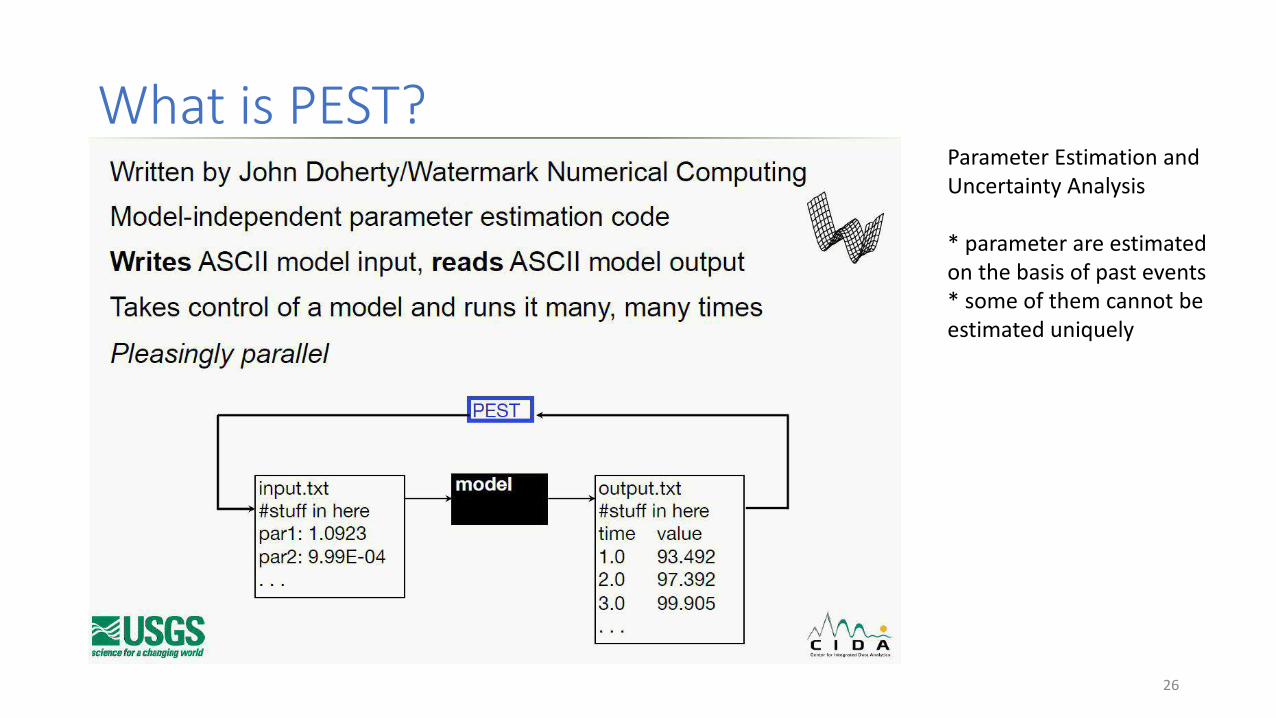
What is PEST?
26
Parameter Estimation andUncertainty Analysis
* parameter are estimated on the basis of past events * some of them cannot be estimated uniquely
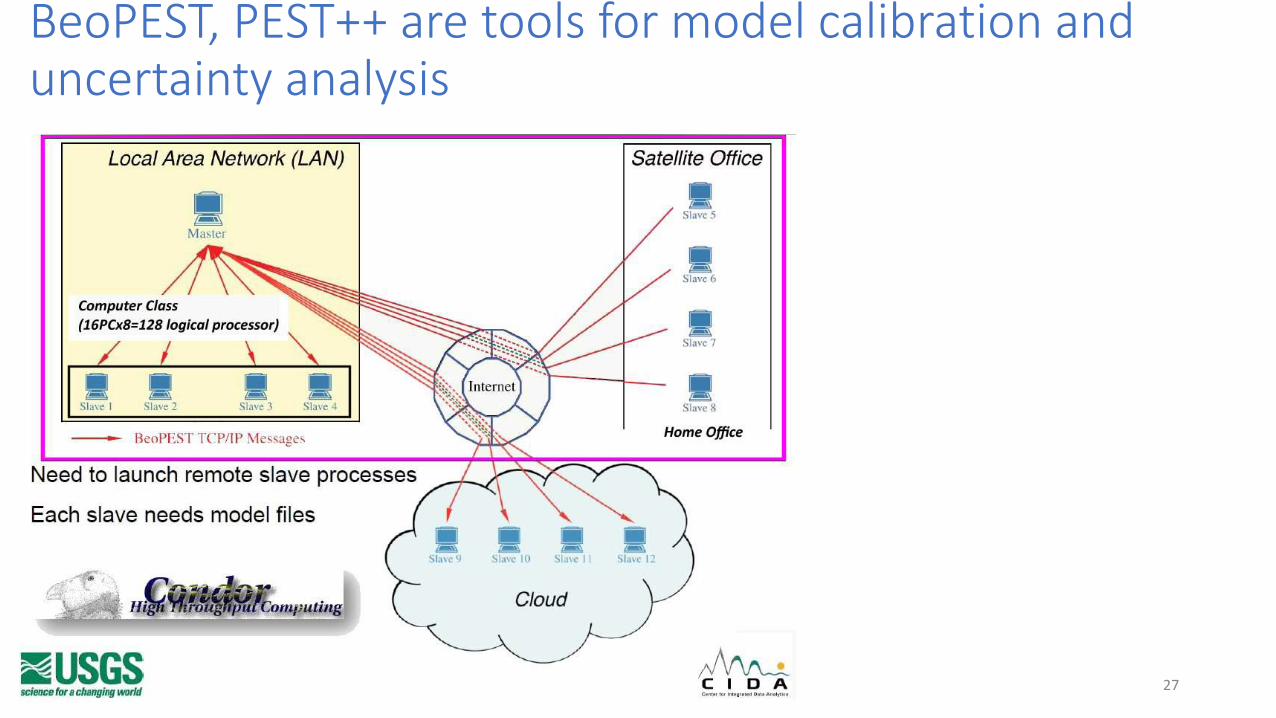
BeoPEST, PEST++ are tools for model calibration and uncertainty analysis
27

Model Calibration
28Source: Help HBV-light – Model Calibration
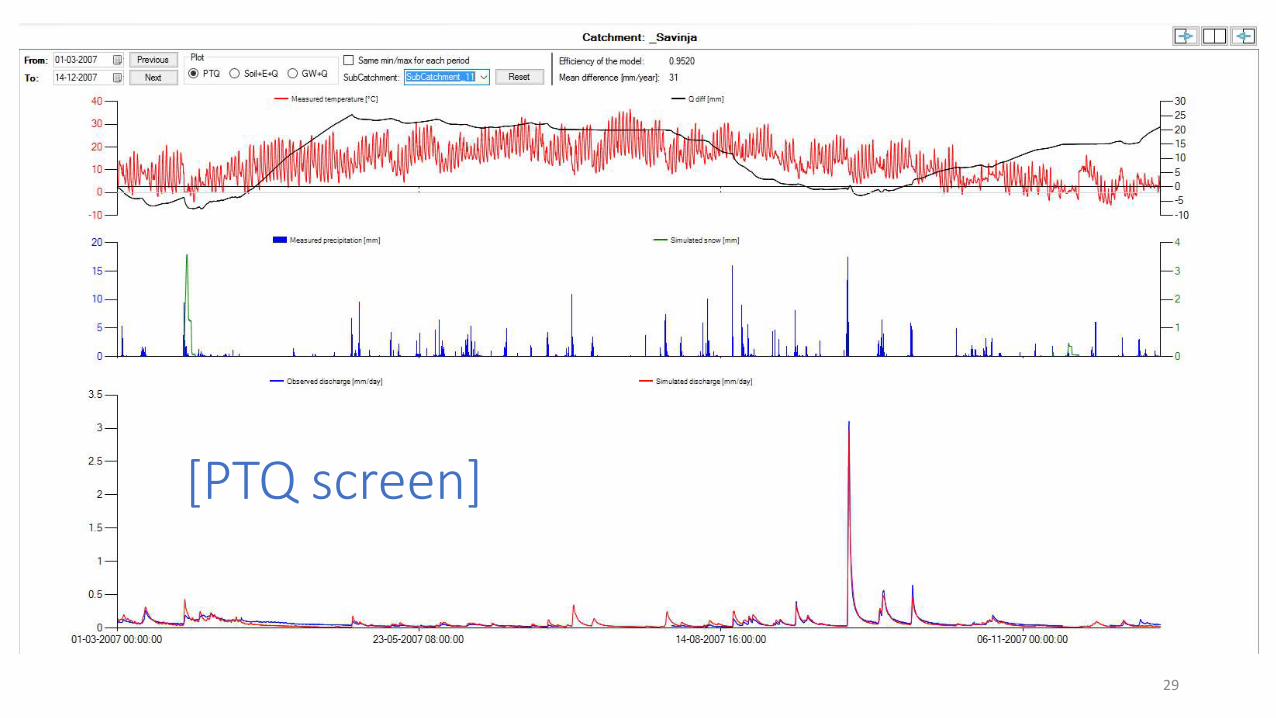
[PTQ screen]
29
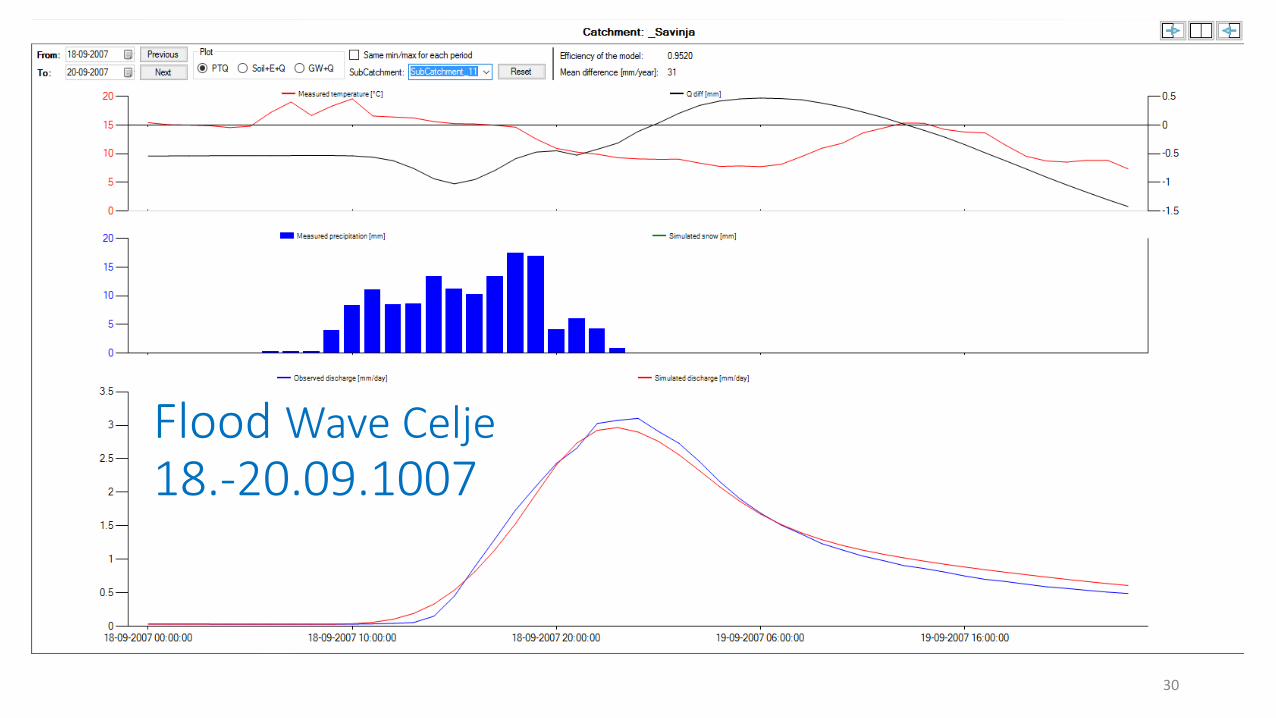
Flood Wave Celje18.-20.09.1007
30
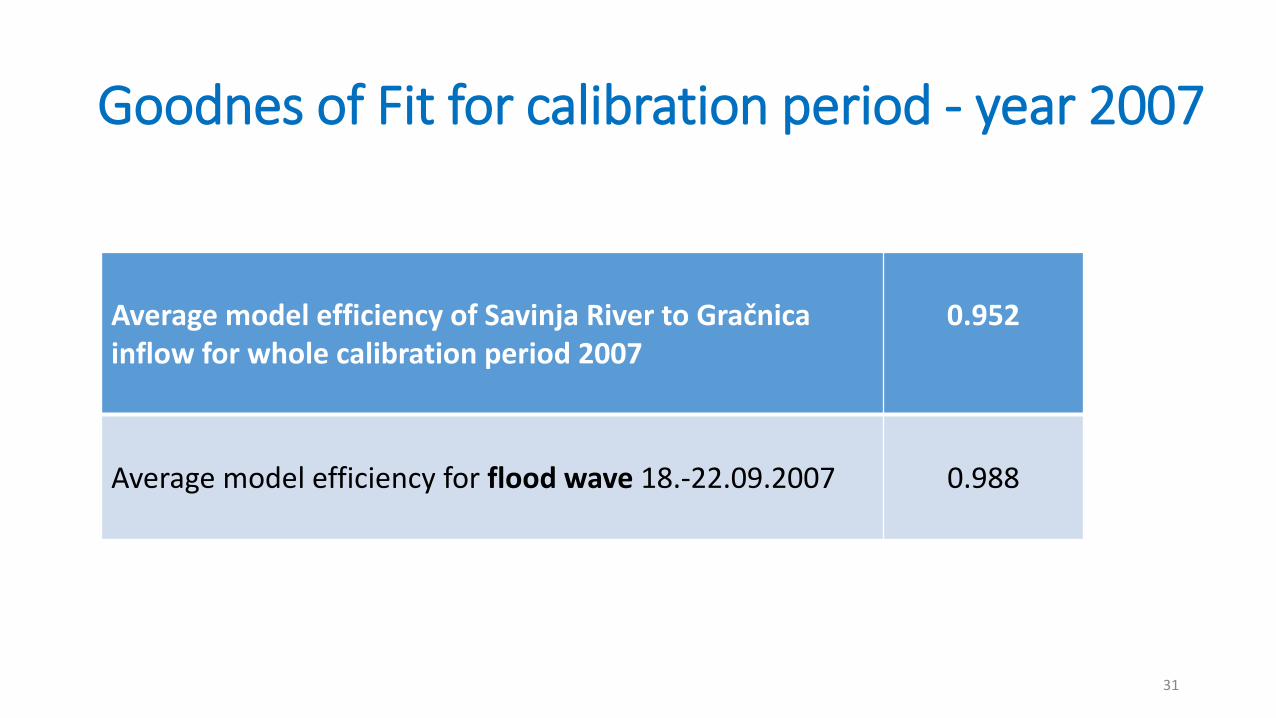
Goodnes of Fit for calibration period - year 2007
31
Average model efficiency of Savinja River to Gračnica inflow for whole calibration period 2007
0.952
Average model efficiency for flood wave 18.-22.09.2007 0.988
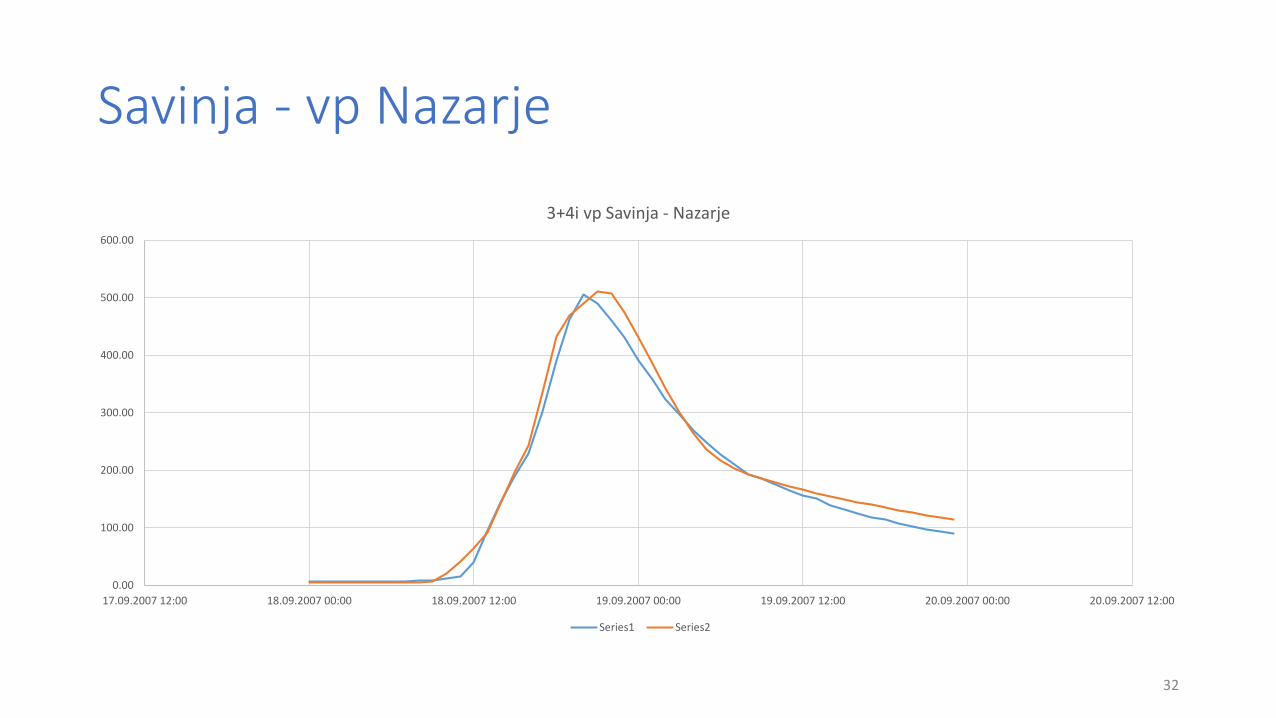
Savinja - vp Nazarje
32
0.00
100.00
200.00
300.00
400.00
500.00
600.00
17.09.2007 12:00 18.09.2007 00:00 18.09.2007 12:00 19.09.2007 00:00 19.09.2007 12:00 20.09.2007 00:00 20.09.2007 12:00
3+4i vp Savinja - Nazarje
Series1 Series2
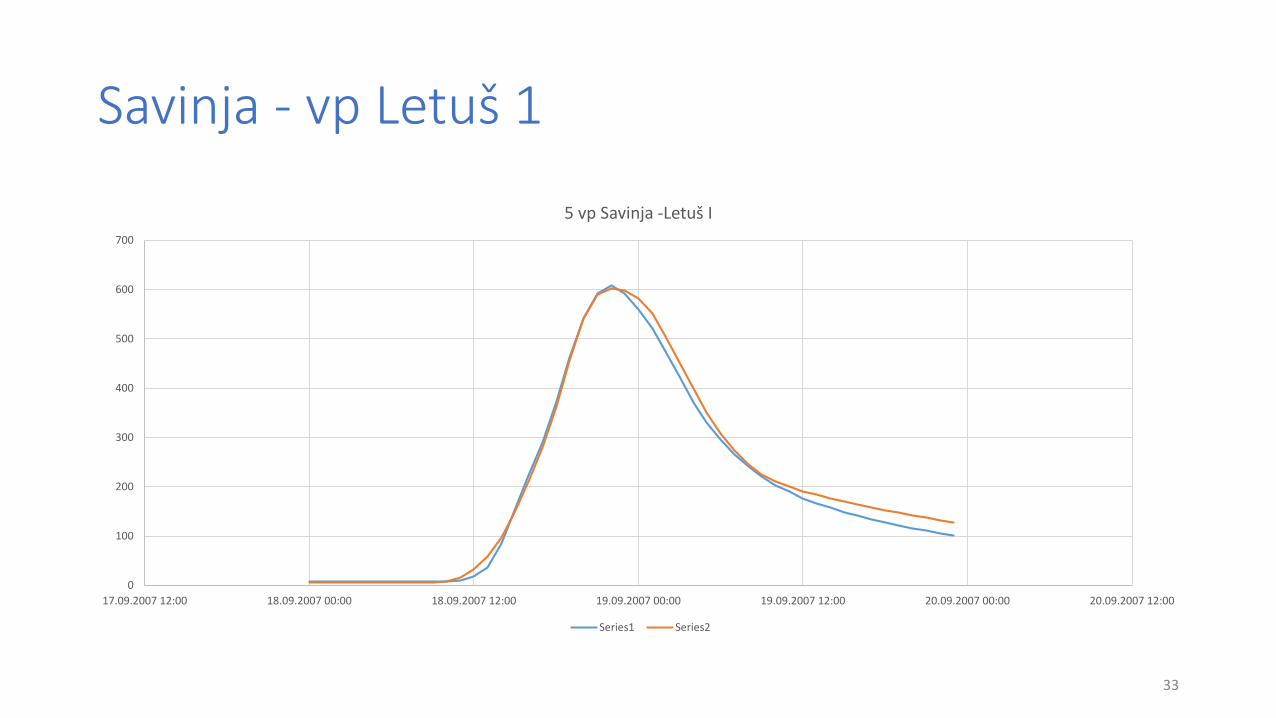
Savinja - vp Letuš 1
33
0
100
200
300
400
500
600
700
17.09.2007 12:00 18.09.2007 00:00 18.09.2007 12:00 19.09.2007 00:00 19.09.2007 12:00 20.09.2007 00:00 20.09.2007 12:00
5 vp Savinja -Letuš I
Series1 Series2
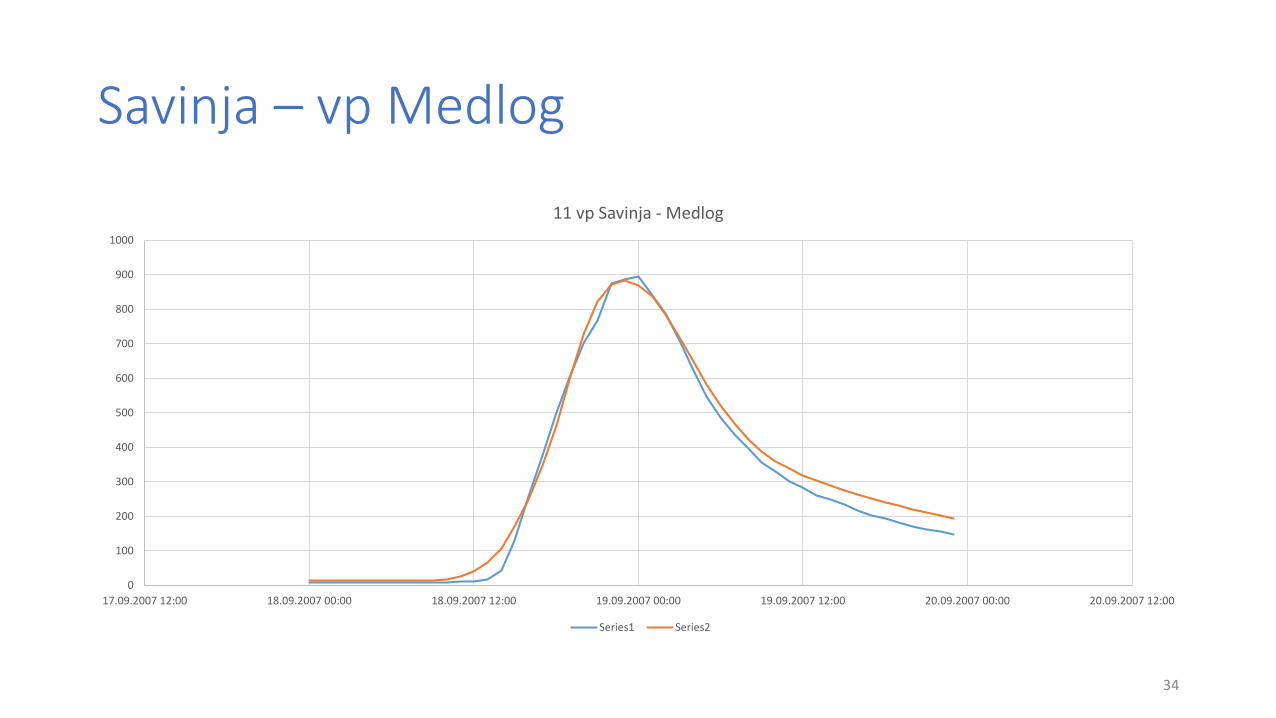
Savinja – vp Medlog
34
0
100
200
300
400
500
600
700
800
900
1000
17.09.2007 12:00 18.09.2007 00:00 18.09.2007 12:00 19.09.2007 00:00 19.09.2007 12:00 20.09.2007 00:00 20.09.2007 12:00
11 vp Savinja - Medlog
Series1 Series2
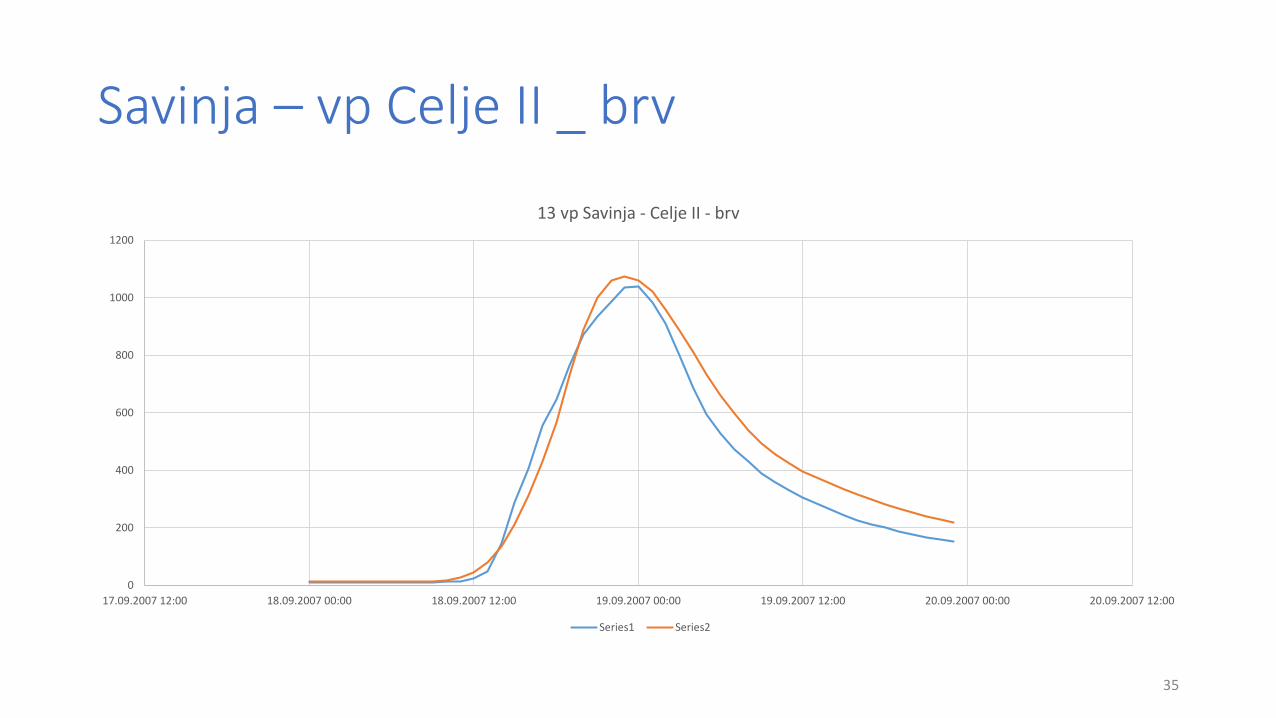
Savinja – vp Celje II _ brv
35
0
200
400
600
800
1000
1200
17.09.2007 12:00 18.09.2007 00:00 18.09.2007 12:00 19.09.2007 00:00 19.09.2007 12:00 20.09.2007 00:00 20.09.2007 12:00
13 vp Savinja - Celje II - brv
Series1 Series2
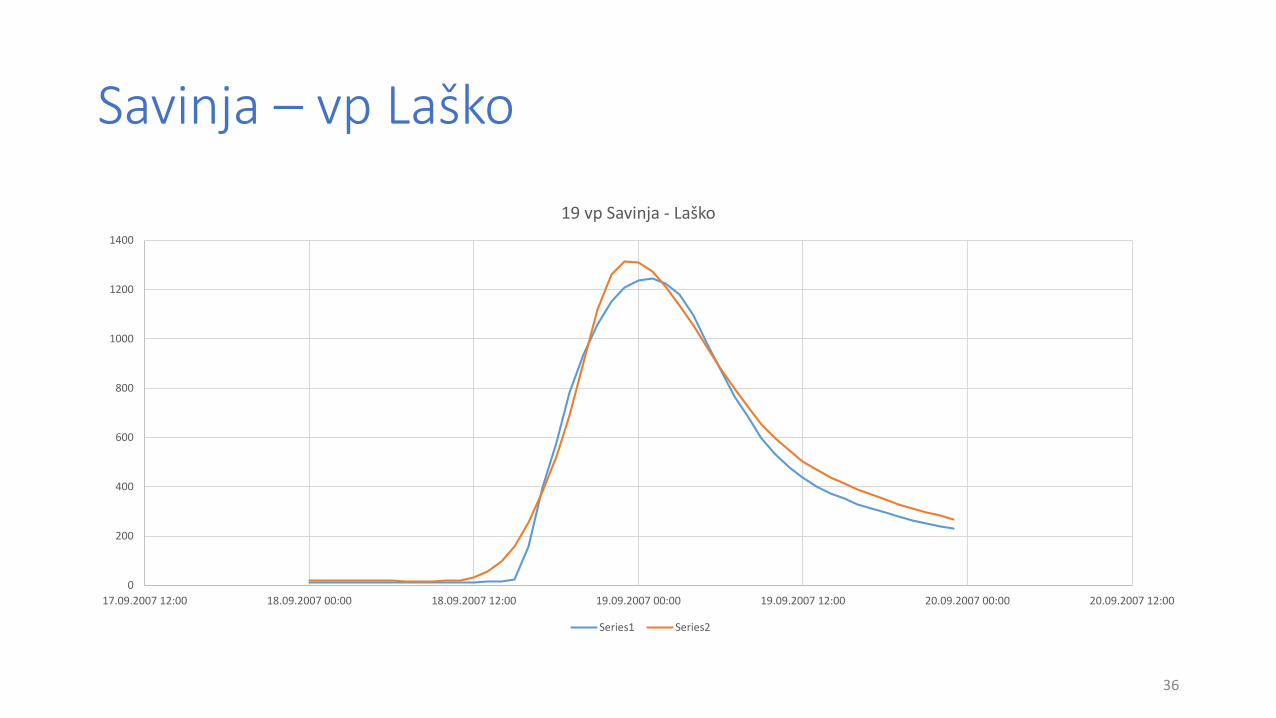
Savinja – vp Laško
36
0
200
400
600
800
1000
1200
1400
17.09.2007 12:00 18.09.2007 00:00 18.09.2007 12:00 19.09.2007 00:00 19.09.2007 12:00 20.09.2007 00:00 20.09.2007 12:00
19 vp Savinja - Laško
Series1 Series2
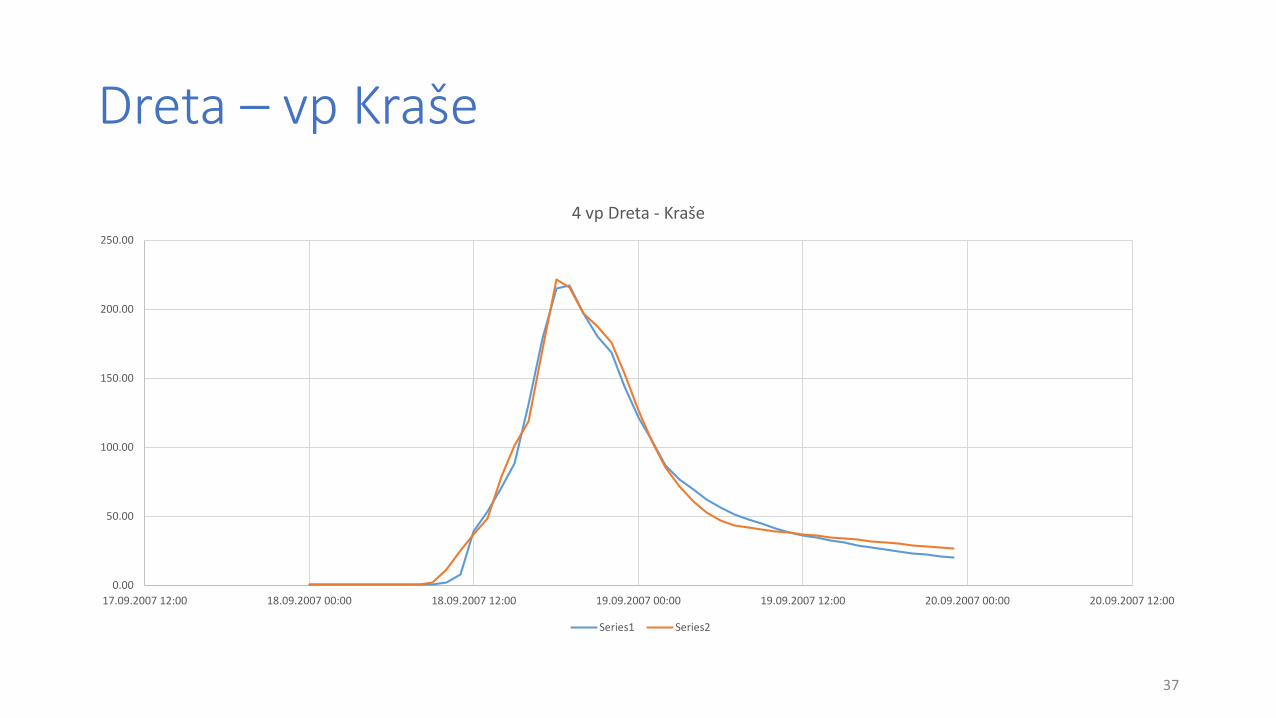
Dreta – vp Kraše
37
0.00
50.00
100.00
150.00
200.00
250.00
17.09.2007 12:00 18.09.2007 00:00 18.09.2007 12:00 19.09.2007 00:00 19.09.2007 12:00 20.09.2007 00:00 20.09.2007 12:00
4 vp Dreta - Kraše
Series1 Series2
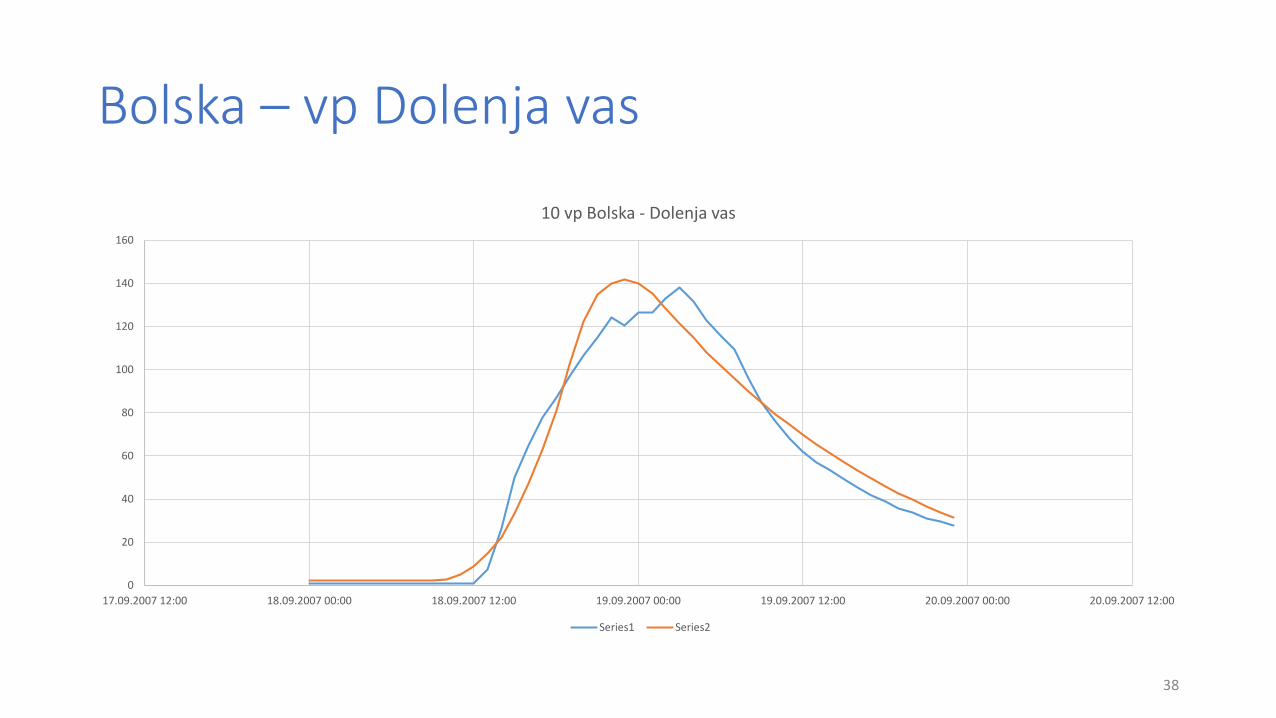
Bolska – vp Dolenja vas
38
0
20
40
60
80
100
120
140
160
17.09.2007 12:00 18.09.2007 00:00 18.09.2007 12:00 19.09.2007 00:00 19.09.2007 12:00 20.09.2007 00:00 20.09.2007 12:00
10 vp Bolska - Dolenja vas
Series1 Series2
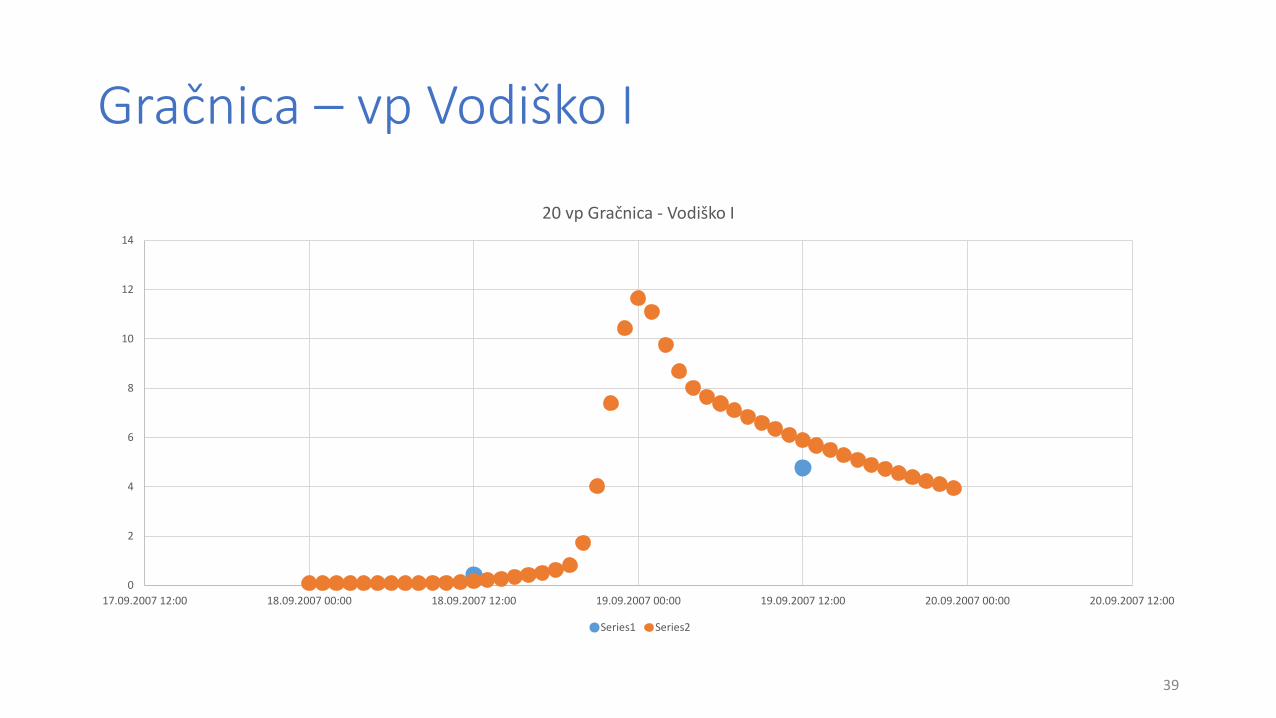
Gračnica – vp Vodiško I
39
0
2
4
6
8
10
12
14
17.09.2007 12:00 18.09.2007 00:00 18.09.2007 12:00 19.09.2007 00:00 19.09.2007 12:00 20.09.2007 00:00 20.09.2007 12:00
20 vp Gračnica - Vodiško I
Series1 Series2
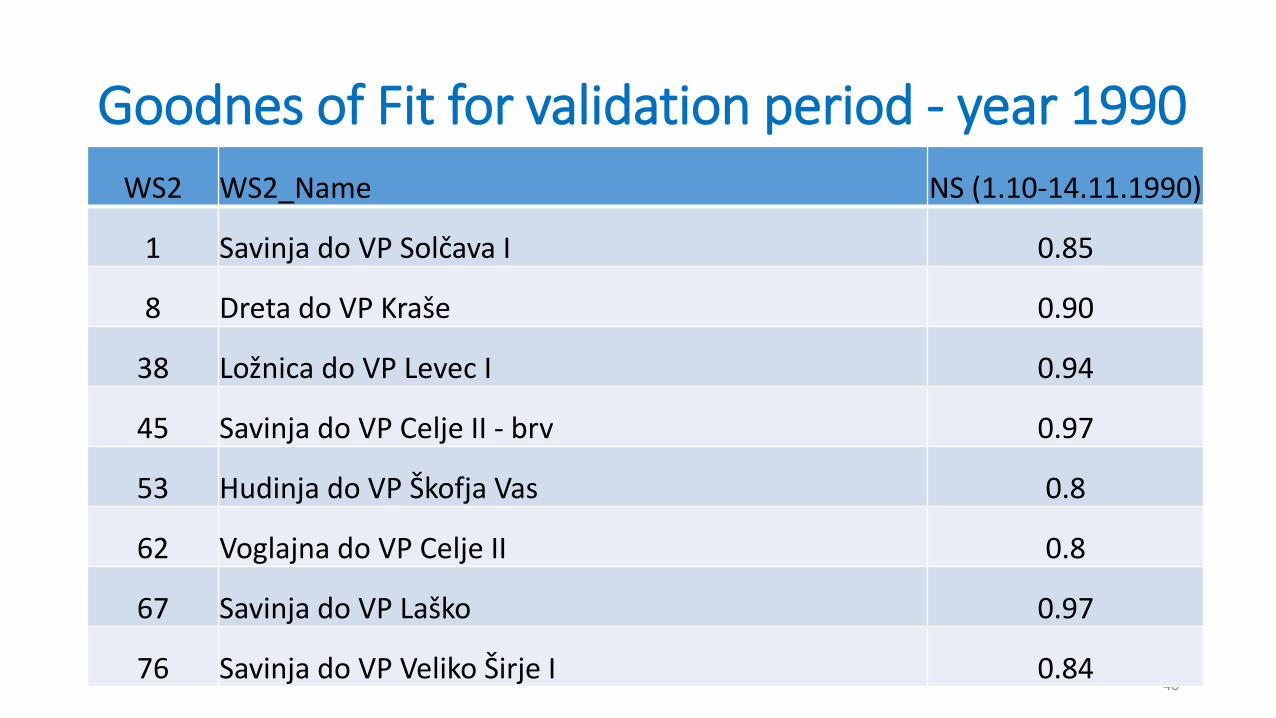
Goodnes of Fit for validation period - year 1990
40
WS2 WS2_Name NS (1.10-14.11.1990)
1 Savinja do VP Solčava I 0.85
8 Dreta do VP Kraše 0.90
38 Ložnica do VP Levec I 0.94
45 Savinja do VP Celje II - brv 0.97
53 Hudinja do VP Škofja Vas 0.8
62 Voglajna do VP Celje II 0.8
67 Savinja do VP Laško 0.97
76 Savinja do VP Veliko Širje I 0.84
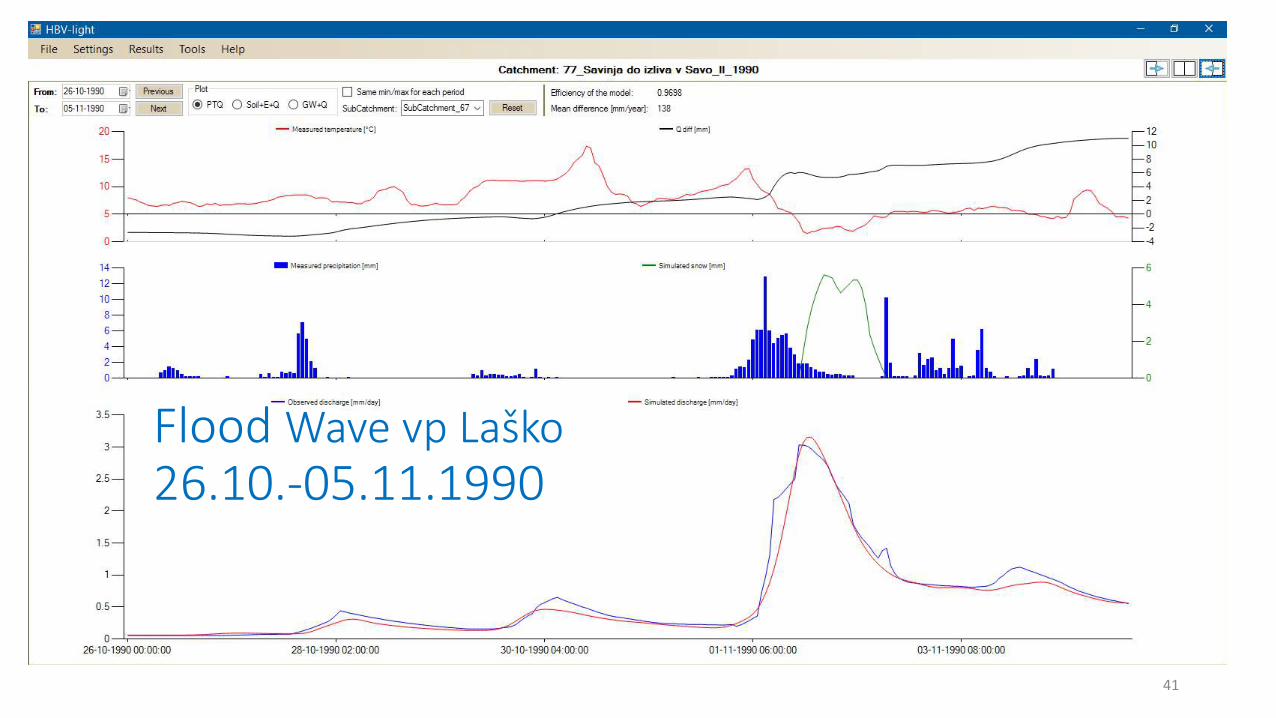
Flood Wave vp Laško26.10.-05.11.1990
41
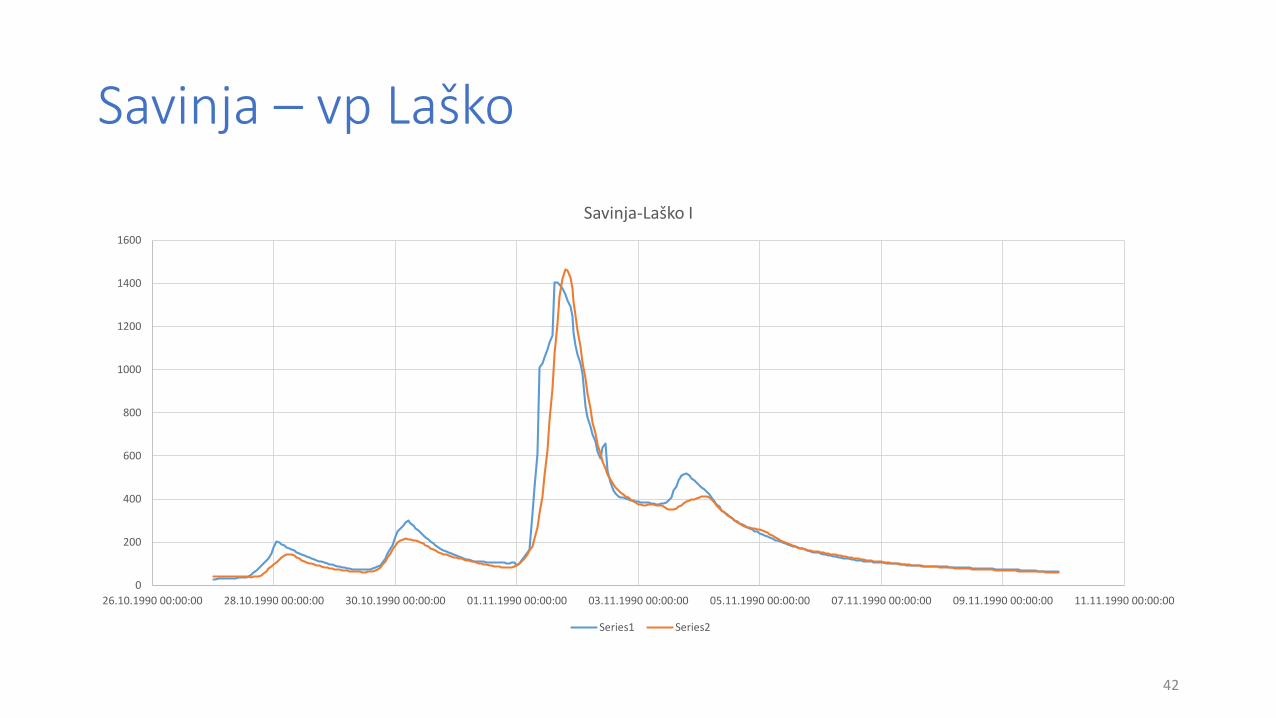
Savinja – vp Laško
42
0
200
400
600
800
1000
1200
1400
1600
26.10.1990 00:00:00 28.10.1990 00:00:00 30.10.1990 00:00:00 01.11.1990 00:00:00 03.11.1990 00:00:00 05.11.1990 00:00:00 07.11.1990 00:00:00 09.11.1990 00:00:00 11.11.1990 00:00:00
Savinja-Laško I
Series1 Series2
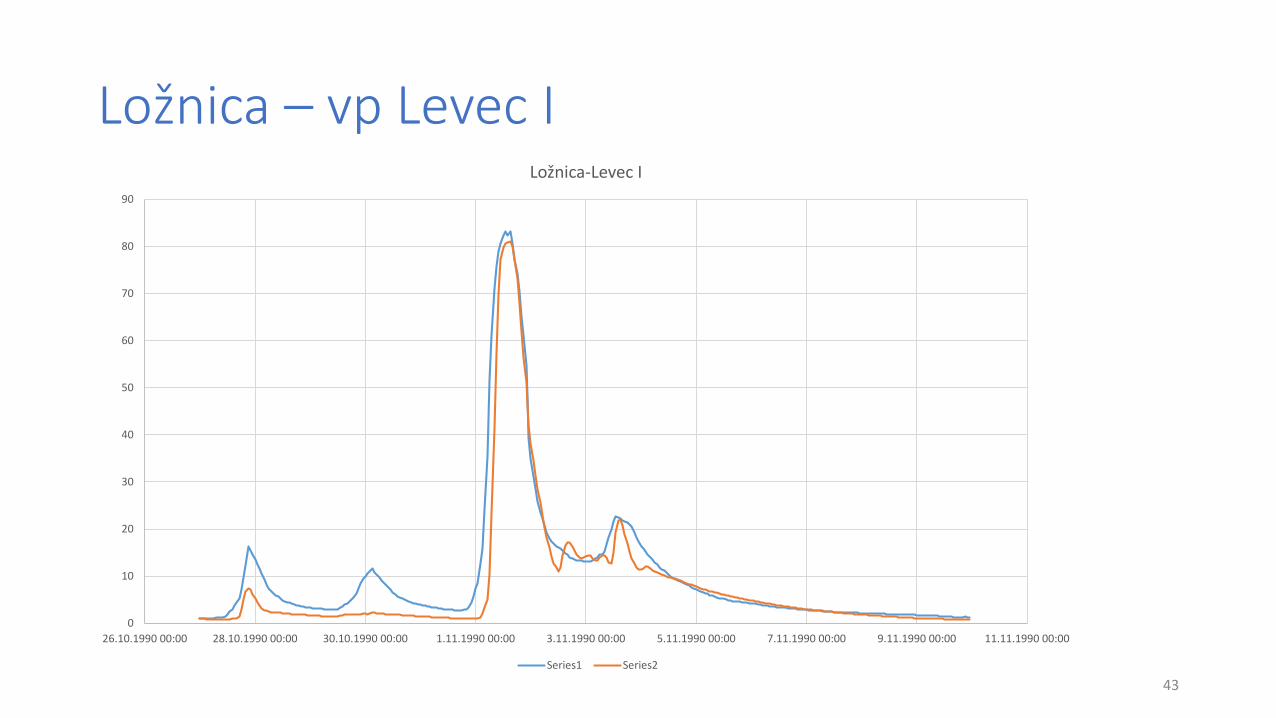
Ložnica – vp Levec I
43
0
10
20
30
40
50
60
70
80
90
26.10.1990 00:00 28.10.1990 00:00 30.10.1990 00:00 1.11.1990 00:00 3.11.1990 00:00 5.11.1990 00:00 7.11.1990 00:00 9.11.1990 00:00 11.11.1990 00:00
Ložnica-Levec I
Series1 Series2
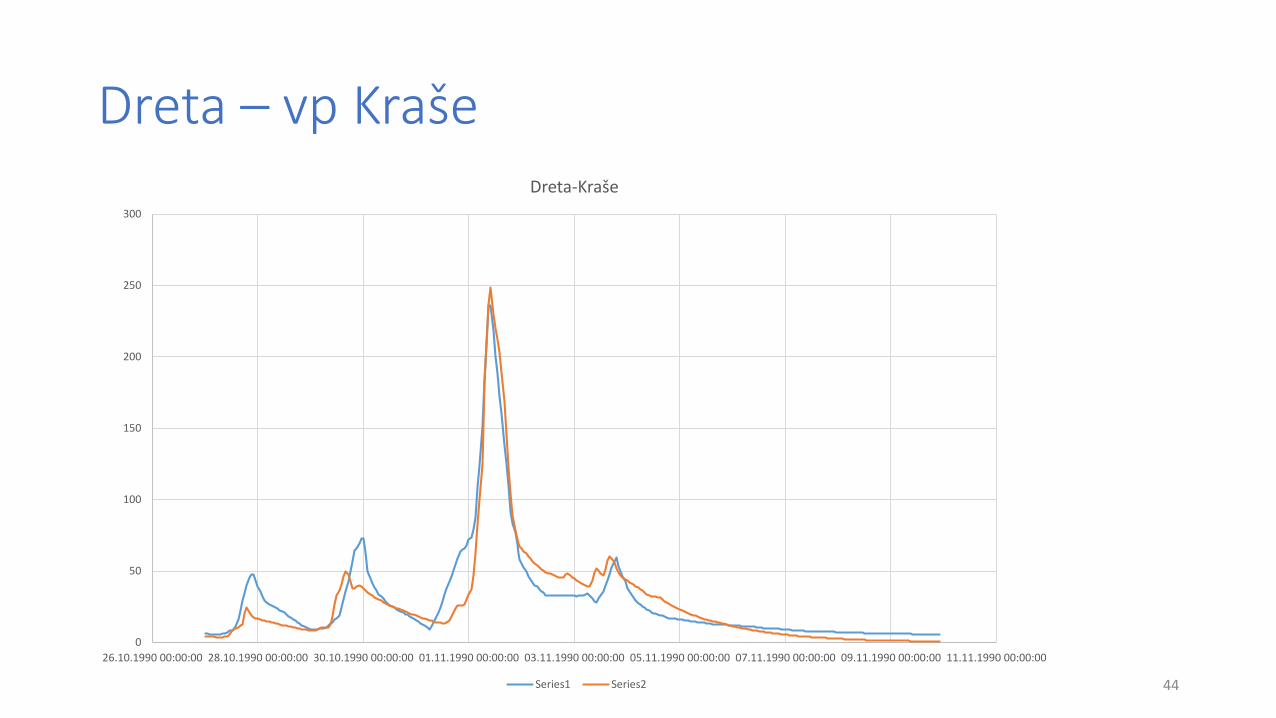
Dreta – vp Kraše
44
0
50
100
150
200
250
300
26.10.1990 00:00:00 28.10.1990 00:00:00 30.10.1990 00:00:00 01.11.1990 00:00:00 03.11.1990 00:00:00 05.11.1990 00:00:00 07.11.1990 00:00:00 09.11.1990 00:00:00 11.11.1990 00:00:00
Dreta-Kraše
Series1 Series2
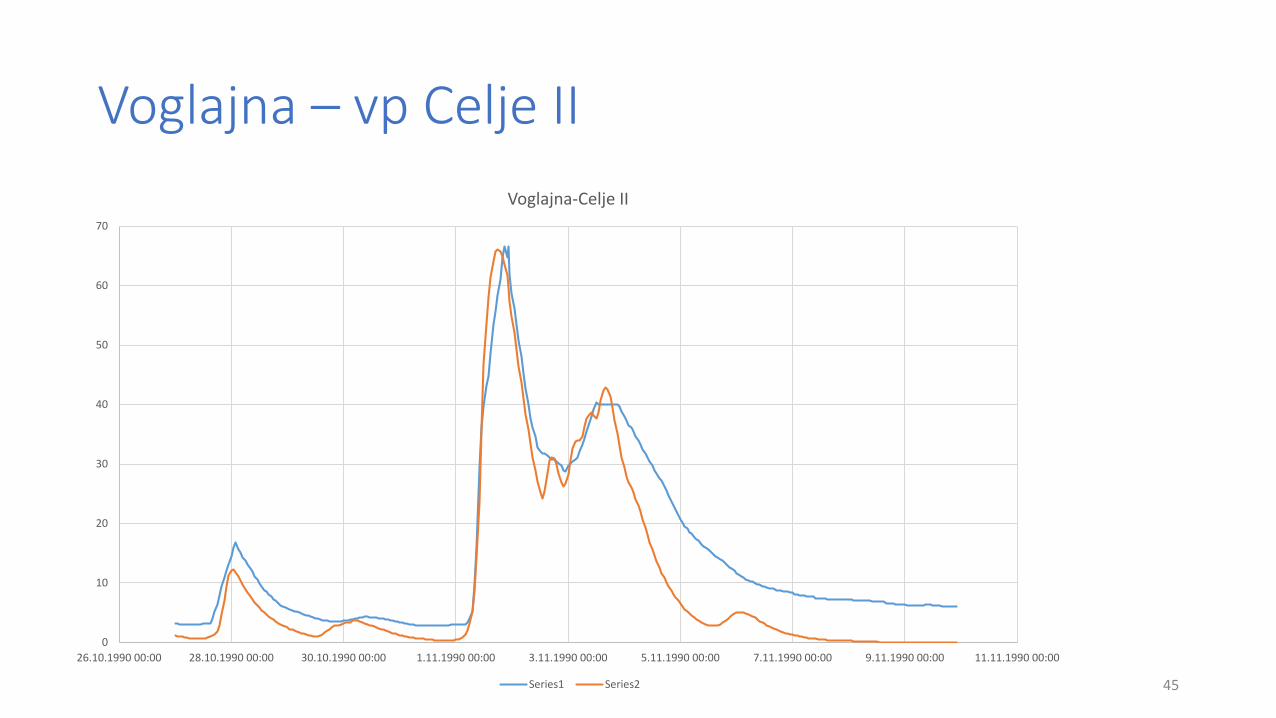
Voglajna – vp Celje II
45
0
10
20
30
40
50
60
70
26.10.1990 00:00 28.10.1990 00:00 30.10.1990 00:00 1.11.1990 00:00 3.11.1990 00:00 5.11.1990 00:00 7.11.1990 00:00 9.11.1990 00:00 11.11.1990 00:00
Voglajna-Celje II
Series1 Series2
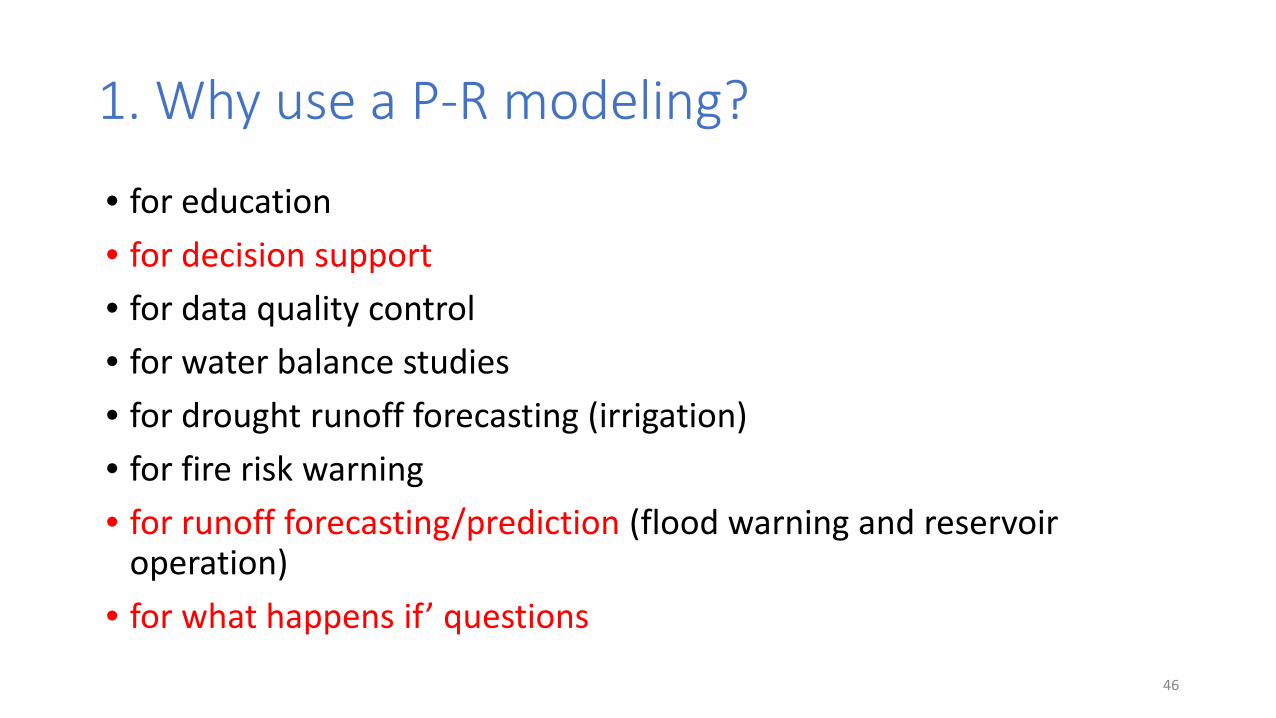
1. Why use a P-R modeling?
• for education• for decision support• for data quality control• for water balance studies• for drought runoff forecasting (irrigation)• for fire risk warning• for runoff forecasting/prediction (flood warning and reservoir
operation)• for what happens if’ questions
46
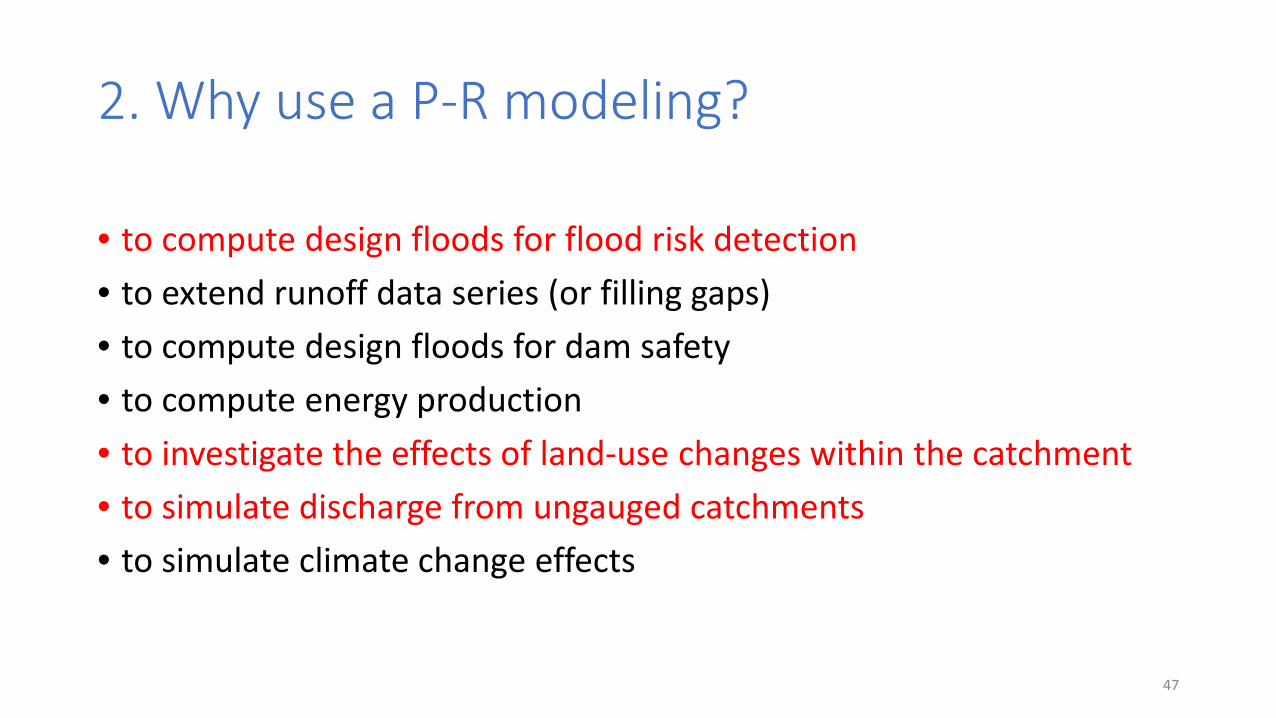
2. Why use a P-R modeling?
• to compute design floods for flood risk detection• to extend runoff data series (or filling gaps)• to compute design floods for dam safety• to compute energy production• to investigate the effects of land-use changes within the catchment• to simulate discharge from ungauged catchments• to simulate climate change effects
47
Designed Flood Predictions
• based on flood event 2007 (50 year return period)24 hour Precipitation Event for Q10, Q20, Q50, Q100, Q200 and Q500
• based on flood event 1990 and 1998 (100 year return period)48 hour Precipitation Event for Q10, Q20, Q50, Q100, Q200 and Q500
48
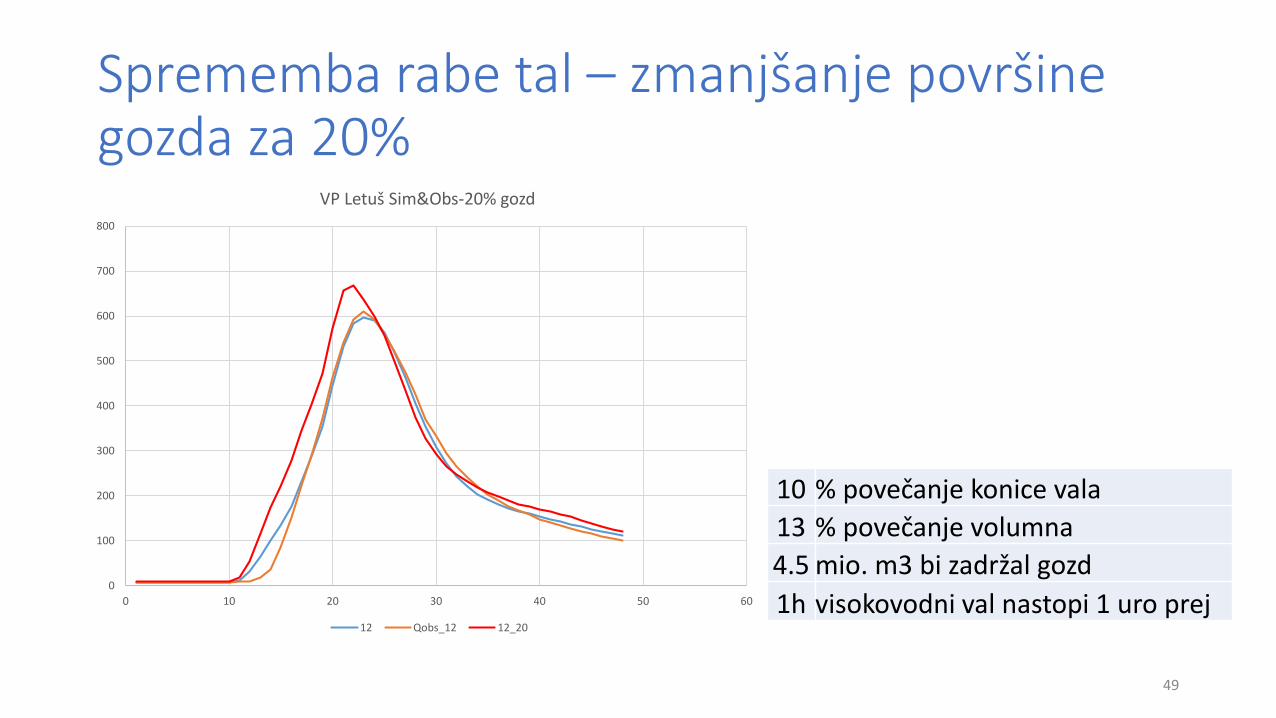
Sprememba rabe tal – zmanjšanje površinegozda za 20%
49
0
100
200
300
400
500
600
700
800
0 10 20 30 40 50 60
VP Letuš Sim&Obs-20% gozd
12 Qobs_12 12_20
10 % povečanje konice vala13 % povečanje volumna4.5 mio. m3 bi zadržal gozd1h visokovodni val nastopi 1 uro prej
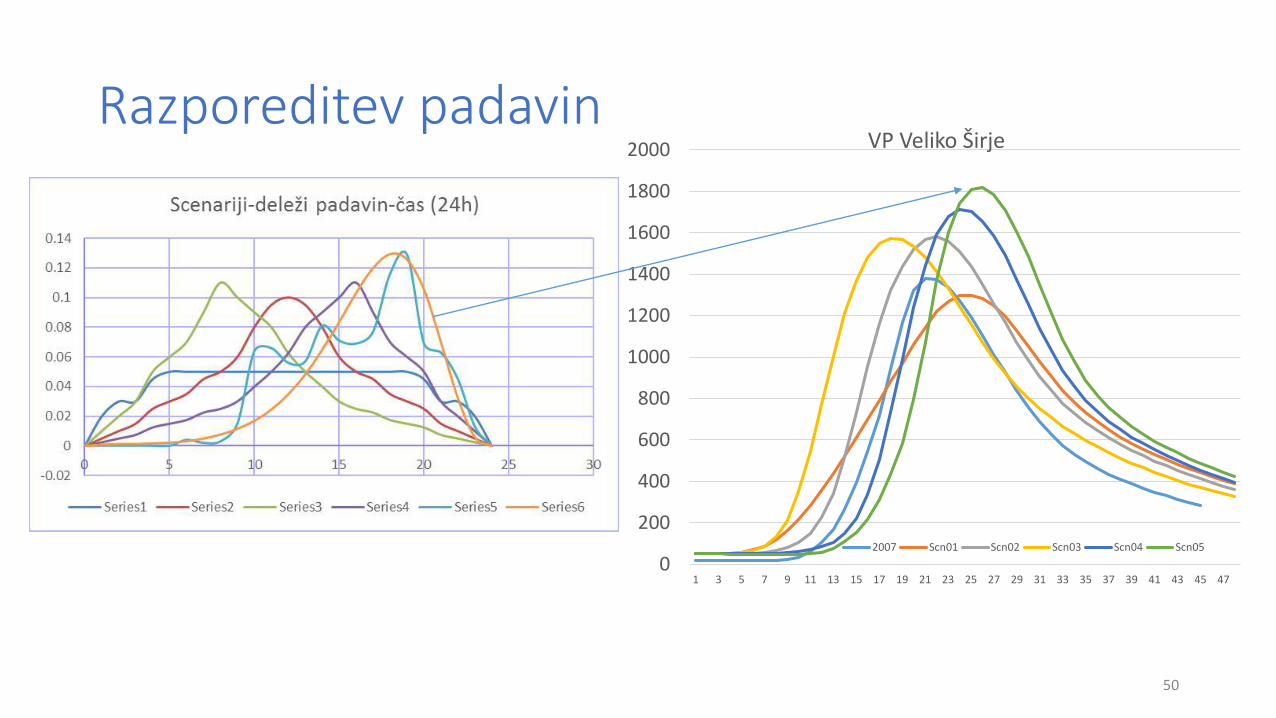
Razporeditev padavin
50
0
200
400
600
800
1000
1200
1400
1600
1800
2000
1 3 5 7 9 11 13 15 17 19 21 23 25 27 29 31 33 35 37 39 41 43 45 47
VP Veliko Širje
2007 Scn01 Scn02 Scn03 Scn04 Scn05
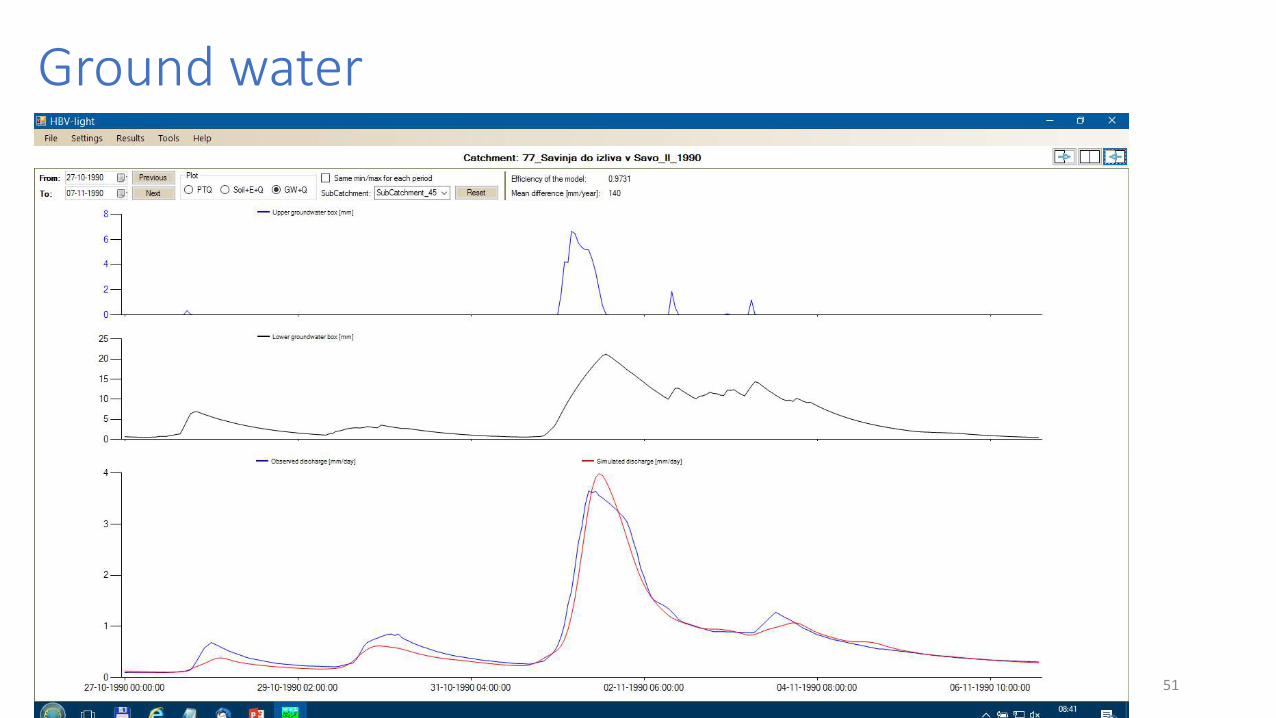
Ground water
51
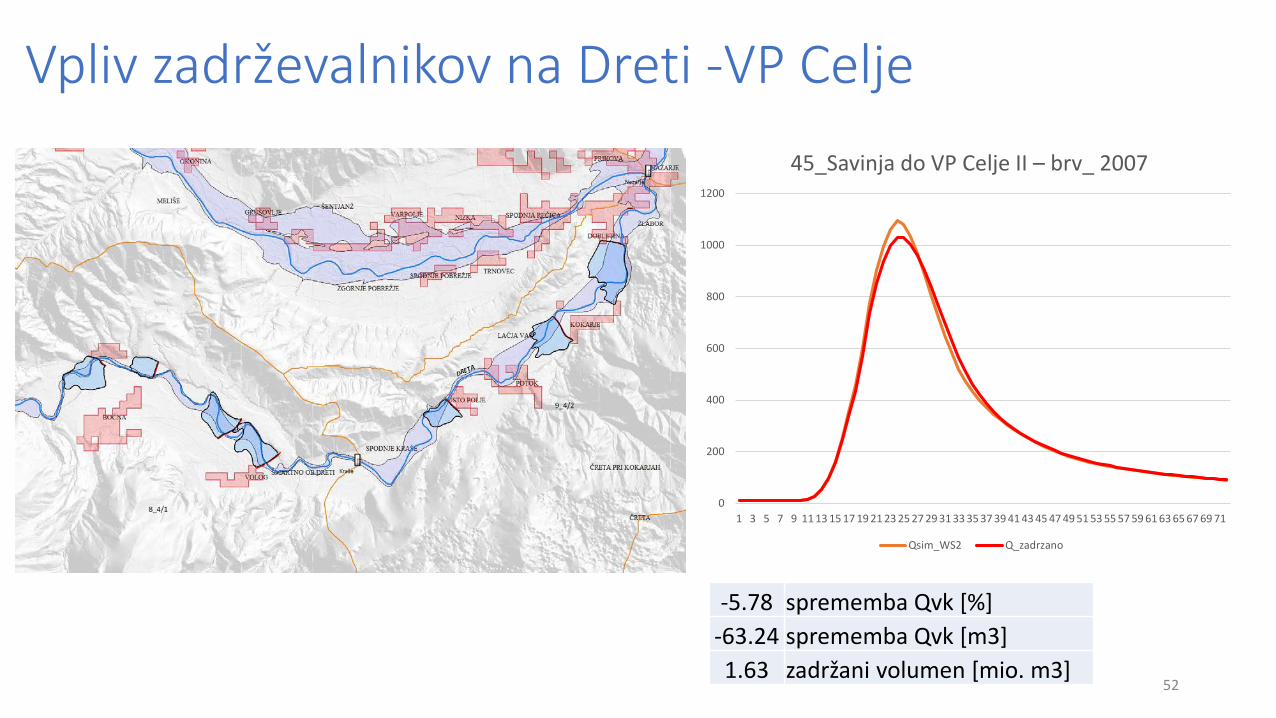
Vpliv zadrževalnikov na Dreti -VP Celje
52
0
200
400
600
800
1000
1200
1 3 5 7 9 11 13 15 17 19 21 23 25 27 29 31 33 35 37 39 41 43 45 47 49 51 53 55 57 59 61 63 65 67 69 71
45_Savinja do VP Celje II – brv_ 2007
Qsim_WS2 Q_zadrzano
-5.78 sprememba Qvk [%]-63.24 sprememba Qvk [m3]1.63 zadržani volumen [mio. m3]
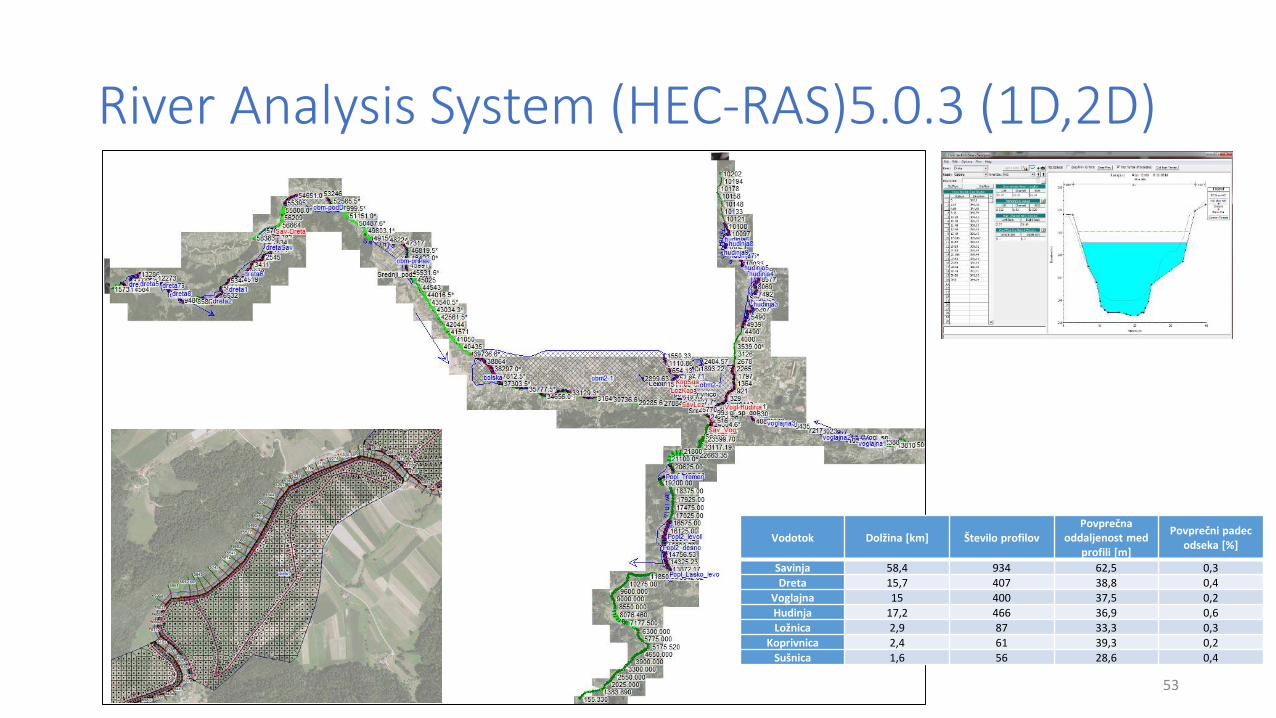
River Analysis System (HEC-RAS)5.0.3 (1D,2D)
53
Vodotok Dolžina [km] Število profilovPovprečna
oddaljenost med profili [m]
Povprečni padec odseka [%]
Savinja 58,4 934 62,5 0,3Dreta 15,7 407 38,8 0,4
Voglajna 15 400 37,5 0,2Hudinja 17,2 466 36,9 0,6Ložnica 2,9 87 33,3 0,3
Koprivnica 2,4 61 39,3 0,2Sušnica 1,6 56 28,6 0,4
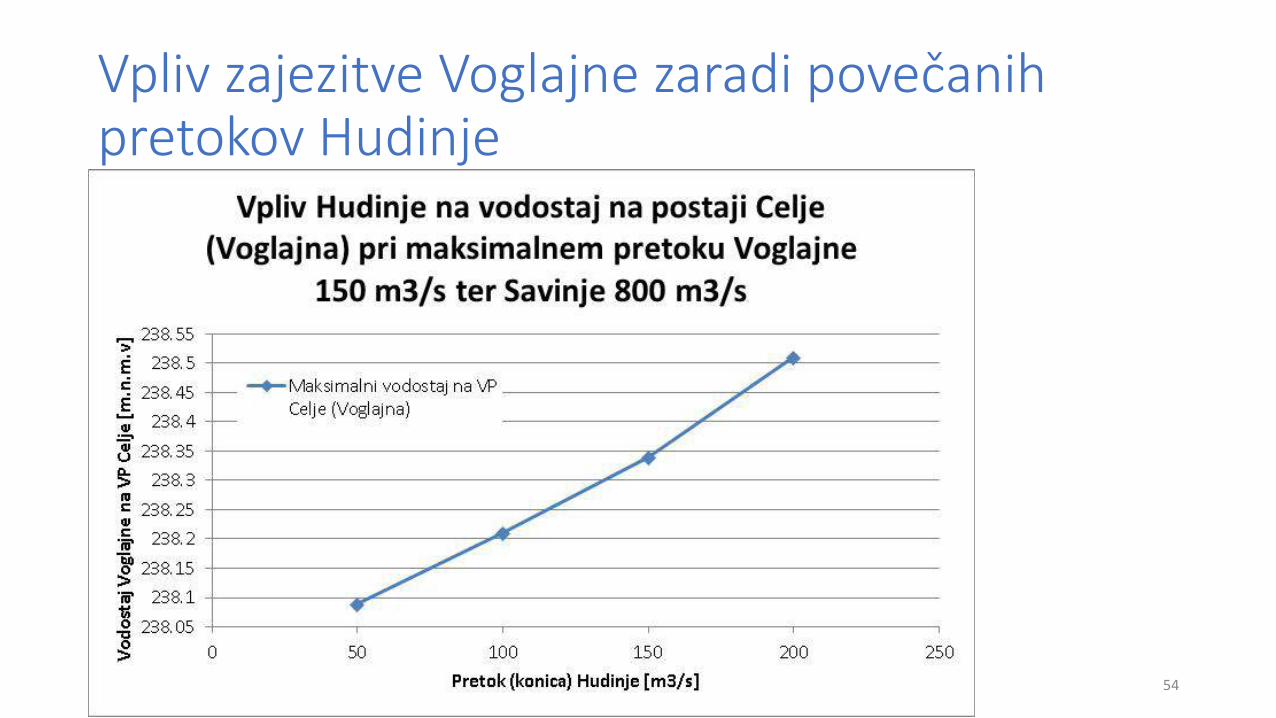
Vpliv zajezitve Voglajne zaradi povečanihpretokov Hudinje
54
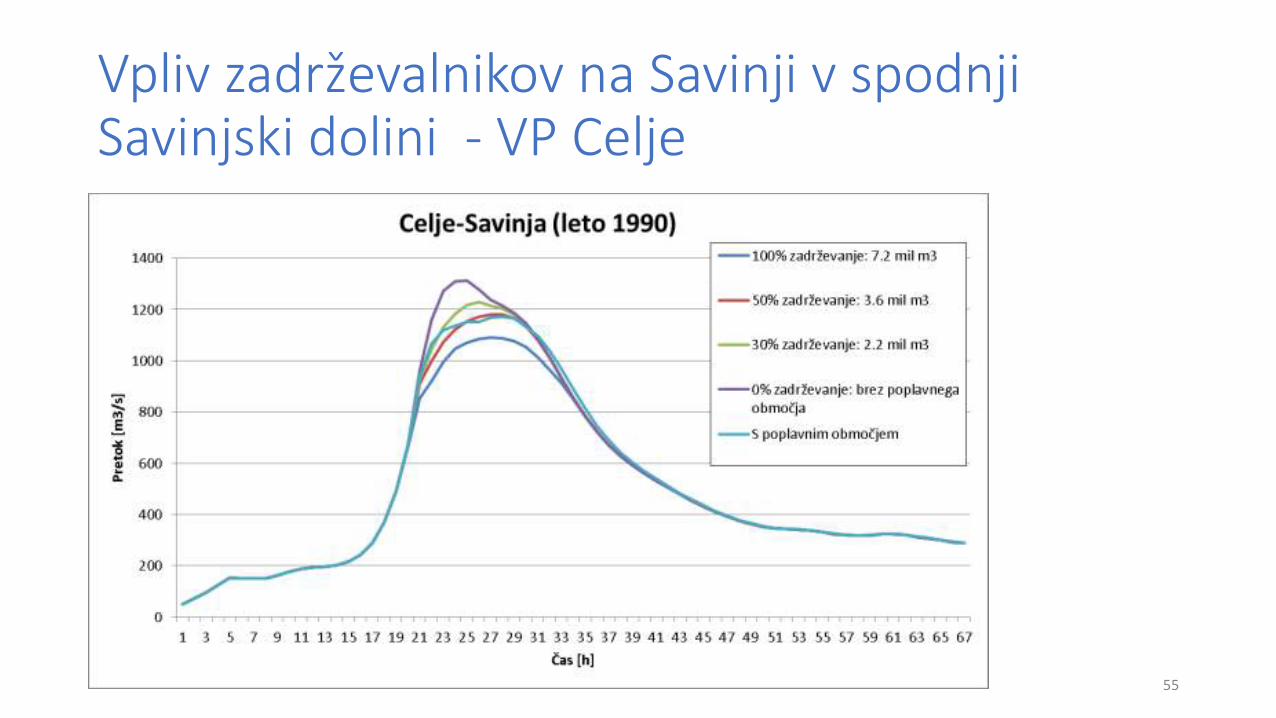
Vpliv zadrževalnikov na Savinji v spodnjiSavinjski dolini - VP Celje
55