Embed Size (px)
Citation preview

Precision turf management: A new water audit based on soil moisture The appl icat ion of principles of precision agriculture to tur fgrass m a n a g e m e n t has led to the deve lopment of an irrigation audit based on soil moisture.
Robert N. Carrow, Ph.D. Van Cline, Ph.D.
76 GCM August 2011
Precision turfgrass management, a relatively new concept for the golf course industry, is based on the principles of precision agriculture, which has been evolving since the early 1990s (2,3,11,12). Foundational principles are:
• Site-specific management means that inputs (water, fertilizer, cultivation operations, salin-ity leaching fraction, etc.) are applied only where needed, when needed and at the amount needed. The idea is to foster precise, efficient application of inputs on smaller areas, such as the area affected by a single irrigation head.
• Intensive site-specific information is neces-sary to make wise site-specific decisions. Site sampling of soil and plant factors takes place across the whole area on a close-sample grid in order to define the degree of spatial variability of measured parameters.
• Key soil and plant properties must be measured to accurately define spatial variability and to investigate relationships of parameters (2,3).
• Mobile, multiple-sensor devices are necessary to measure all factors in a timely manner on
close spacing and across large complex areas such as golf courses. Mobile devices developed for precision agriculture are not well adapted to turfgrass situations, and this has hindered the development of precision turfgrass man-agement. On smaller areas, such as golf greens, it is possible to use hand-held units to obtain spatial data.
• All site data are GPS-labeled (global positioning system), which allows the data to be imported into powerful geographic information system (GIS) programs for geostatistical analysis, for comparison of measured parameters at specific locations to explore relationships, and for devel-opment of detailed GIS maps.
A new device The Toro Co. recently developed a mobile,
multiple-sensor unit specifically designed for use on turfgrass sites (3,8). The Toro Precision Sense 6000 device has a mapping speed of 2 mph (3.2 kilome-ters/hour) and covers 2.5 acres (1 hectare)/hour using an 8 x 8-foot (2.4 x 2.4-meter) sample grid or
Toro Precision Sense 6000 mobile, multiple-sensor device (left) and mapping a golf course fairway (right). Photos courtesy of The Toro Co.
600 to 700 samples per acre. With a close-sample grid, GIS programs can accurately calculate the estimated value of measured parameters between sample locations, which effectively increases the spatial data four-fold. The multiple-sensor device measures the following GPS-labeled data:
• soil moisture as volumetric water content (%VWC) in the surface 0- to 4-inch zone (0-10 centimeters)
• soil salinity in the surface 0 to 4 inches • surface hardness by penetration resistance as
force to insert the probes in the top 0 to 4 inches
• plant performance based on spectral reflec-tance and reported as normalized difference vegetative index (NDVI), which is a measure of plant density, color and stress
• topography slope and aspect at 1-foot (0.3-meter) intervals.
The traditional water audit A new water audit for golf courses based on
soil moisture is a practical field application of pre-cision turfgrass management concepts, in which the water audit fosters sustainable golf course management practices though improved water-use efficiency and conservation. Before discuss-ing this new water audit approach, it is useful to understand the traditional water audit method based on catch-can methodology (13).
The Irrigation Association (9) says that through a traditional irrigation audit (that is, a water audit), "Information about each area's tech-nical characteristics and controller capabilities should be obtained. An irrigation audit involves collecting data, such as site maps, irrigation plans and water use records. Tuning of the irrigation system is accomplished during the inspection. Field tests are then conducted to determine the system's uniformity and to calculate various zone precipitation rates."
Thus, a water audit has two phases. The first phase is the collection of existing site information that may influence irrigation and the inspection of the system for repairable malfunctions (1,13). Information at this stage may include pressure tests, sources, water-quality tests and flow data.
During system inspection, the Irrigation Asso-ciation (9) recommends evaluating for:
• valve performance • sprinklers that are tilted, sunken, broken,
missing or clogged • nozzles that are incorrect, misaligned or have
spray deflected by objects • leak detection and repair
• drainage from low sprinkler locations. For golf courses, many of the items in this first
phase may already be accomplished on a routine basis, because they are part of a good maintenance protocol. However, a high level of system mainte-nance is not always the case at other turfgrass sites. As will be addressed later, the new water audit based on soil-moisture actually aids in implement-ing the first phase.
The second or field-test phase of a traditional catch-can water audit is to assess irrigation system uniformity, where catch-cans are placed in a grid pattern, the irrigation system is operated under low wind conditions and water distribution is determined. Only selected sites, such as problem sites, are evaluated in this manner. Major design issues are of special interest, such as:
• improper sprinkler spacing — if only a few heads are too close or too far apart, they can be moved, but a consistent pattern of wide spac-ing that cannot be corrected by installing dif-ferent heads or nozzles is a major design issue
• inadequate zoning or scheduling capability • inadequate piping, pressure or flow rate for
system operation • outdated or worn-out equipment.
Test results are used to calculate factors impor-tant for efficient irrigation operation such as (13):
• lower-quartile distribution uniformity (DUl ), a measure of how uniformly water is applied over an area, where a DU^ greater than 80 is good; the DUk| is based on the average of all catch-can samples and the average of the low-est 25% of readings
• run-time modifier (RTM), which is used to adjust timing in an irrigation zone to allow adequate water over the whole site where the run-time modifier increases as DU. decreases
lq
• a densogram that visually shows the wettest and driest areas within the test area and is valuable for making corrective measures such as chang-ing nozzles to obtain greater uniformity (4).
New soil-moisture-based water audit The new soil-moisture-based water audit
has been formulated as a decision-support system, which adds value to the data by combining site-data acquisition, traditional and geostatistical analysis, and GIS map displays into a practical decision-making package for the end-user (5). For data acquisition, the Toro Precision Sense 6000 determines soil moisture (%VWC) and the other parameters during a dry period when the irriga-tion system uniformity of water application would
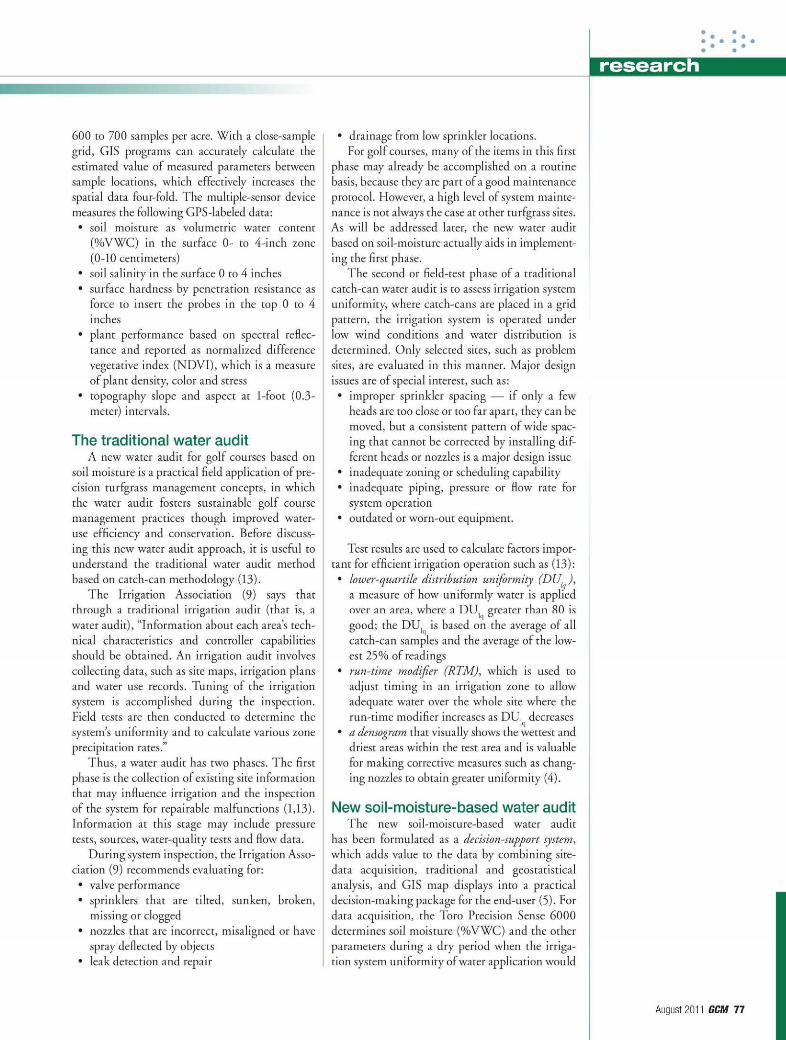
Soil moisture (VWC) Values (%) Standard deviation (SD)
<10 > 2 SD less 10-15 1.5-2.5 SD less 15-20 0.5-1.5 SD less 20-25 Mean +/- 0.5 SD 25-30 0.5-1.5 SD more 30-35 1.5-2.5 SD more 35-40 >2.5 SD more 40-45 45-50 >50
Figure 1. GIS maps of fairway 1 of a golf course presented as soil volumetric water content (VWC) (left) and in standard deviation format (right), which highlights the driest (pink) and wettest (blue) areas. Tables 2 and 3 and Figures 2 and 3 contain information on irrigation heads 4 and 8. Note the four-fold difference in soil volumetric water content from <15.1 % to >59.4% VWC (see Table 1).
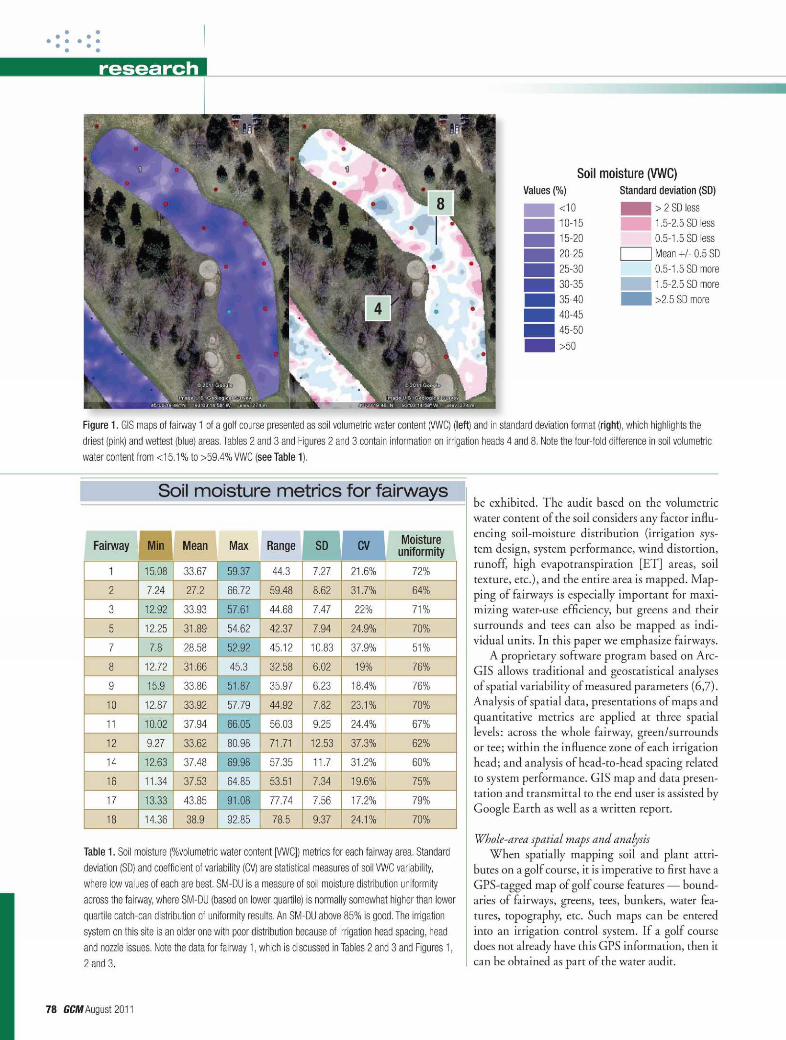
Soil moisture metrics for fairways
Fairway Min Mean Max Range SD CV Moisture uniformity
1 15.08 33.67 59.37 44.3 7.27 21.6% 72%
2 7.24 27.2 66.72 59.48 8.62 31.7% 64%
3 12.92 33.93 57.61 44.68 7.47 22% 71%
5 12.25 31.89 54.62 42.37 7.94 24.9% 70%
7 7.8 28.58 52.92 45.12 10.83 37.9% 51%
8 12.72 31.66 45.3 32.58 6.02 19% 76%
9 15.9 33.86 51.87 35.97 6.23 18.4% 76%
10 12.87 33.92 57.79 44.92 7.82 23.1% 70%
11 10.02 37.94 66,05 56.03 9.25 24.4% 67%
12 9,27 33.62 80.98 71.71 12.53 37.3% 62%
14 12.63 37.48 69.98 57.35 11.7 31.2% 60%
16 11.34 37.53 64.85 53.51 7.34 19.6% 75%
17 13.33 43.85 91.08 77.74 7.56 17.2% 79%
18 14.36 38.9 92.85 78.5 9.37 24.1% 70%
Table 1. Soil moisture (%volumetric water content [VWC]) metrics for each fairway area. Standard deviation (SD) and coefficient of variability (CV) are statistical measures of soil VWC variability, where low values of each are best. SM-DU is a measure of soil moisture distribution uniformity across the fairway, where SM-DU (based on lower quartile) is normally somewhat higher than lower quartile catch-can distribution of uniformity results. An SM-DU above 85% is good. The irrigation system on this site is an older one with poor distribution because of irrigation head spacing, head and nozzle issues. Note the data for fairway 1, which is discussed in Tables 2 and 3 and Figures 1, 2 and 3.
be exhibited. The audit based on the volumetric water content of the soil considers any factor influ-encing soil-moisture distribution (irrigation sys-tem design, system performance, wind distortion, runoff, high evapotranspiration [ET] areas, soil texture, etc.), and the entire area is mapped. Map-ping of fairways is especially important for maxi-mizing water-use efficiency, but greens and their surrounds and tees can also be mapped as indi-vidual units. In this paper we emphasize fairways.
A proprietary software program based on Arc-GIS allows traditional and geostatistical analyses of spatial variability of measured parameters (6,7). Analysis of spatial data, presentations of maps and quantitative metrics are applied at three spatial levels: across the whole fairway, green/surrounds or tee; within the influence zone of each irrigation head; and analysis of head-to-head spacing related to system performance. GIS map and data presen-tation and transmittal to the end user is assisted by Google Earth as well as a written report.
Whole-area spatial maps and analysis When spatially mapping soil and plant attri-
butes on a golf course, it is imperative to first have a GPS-tagged map of golf course features — bound-aries of fairways, greens, tees, bunkers, water fea-tures, topography, etc. Such maps can be entered into an irrigation control system. If a golf course does not already have this GPS information, then it can be obtained as part of the water audit.
78 GCM August 2011
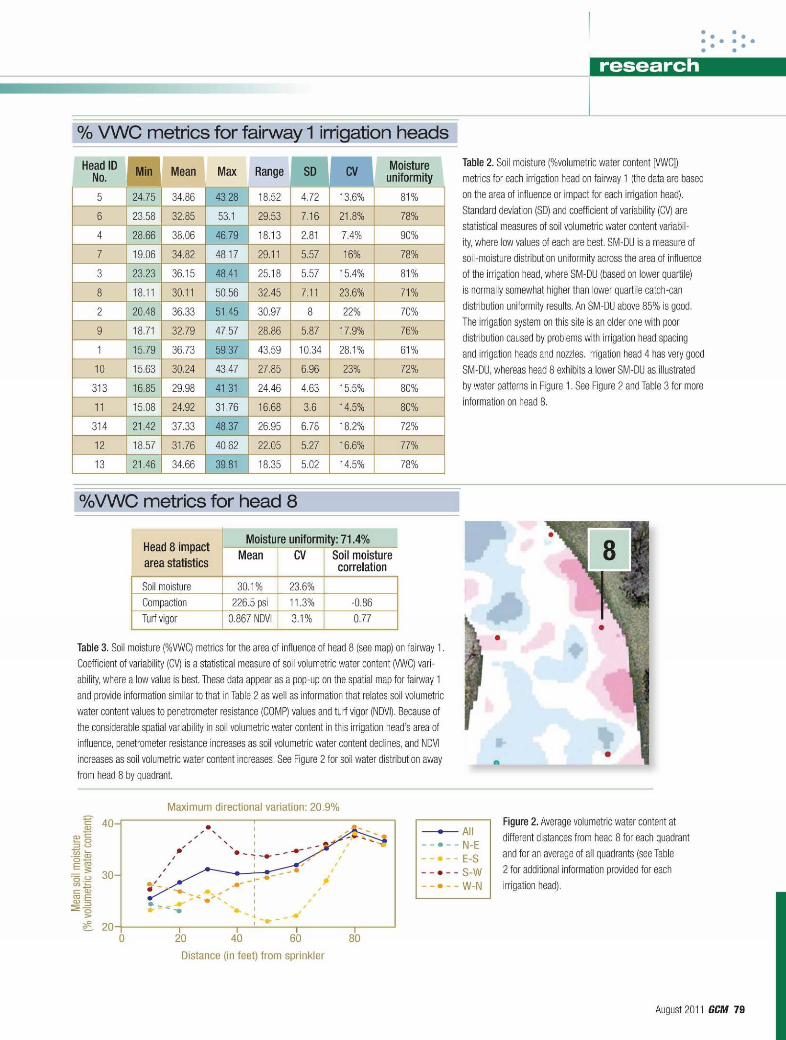
% VWC metrics for fairway 1 irrigation heads Head ID
No. Min Mean Max Range SD CV Moisture uniformity
5 24.75 34.86 43.28 18.52 4.72 13.6% 81%
6 23.58 32.85 53.1 29.53 7.16 21.8% 78%
4 28.66 38.06 46.79 18.13 2.81 7.4% 90%
7 19.06 34.82 48.17 29.11 5.57 16% 78%
3 23.23 36.15 48.41 25.18 5.57 15,4% 81%
8 18.11 30.11 50.56 32,45 7.11 23.6% 71%
2 20.48 36.33 51.45 30.97 8 22% 70%
9 18.71 32.79 47.57 28.86 5.87 17.9% 76%
1 15.79 36.73 59.37 43.59 10.34 28.1% 61%
10 15.63 30.24 43.47 27.85 6.96 23% 72%
313 16.85 29.98 41.31 24.46 4.63 15.5% 80%
11 15.08 24.92 31.76 16.68 3.6 14.5% 80%
314 21.42 37.33 48.37 26.95 6.78 18.2% 72%
12 18.57 31.76 40.62 22.05 5.27 16.6% 77%
13 21.46 34.66 39.81 18.35 5.02 14.5% 78%
Table 2. Soil moisture (%volumetric water content [VWC]) metrics for each irrigation head on fairway 1 (the data are based on the area of influence or impact for each irrigation head). Standard deviation (SD) and coefficient of variability (CV) are statistical measures of soil volumetric water content variabil-ity, where low values of each are best. SM-DU is a measure of soil-moisture distribution uniformity across the area of influence of the irrigation head, where SM-DU (based on lower quartile) is normally somewhat higher than lower quartile catch-can distribution uniformity results. An SM-DU above 85% is good. The irrigation system on this site is an older one with poor distribution caused by problems with irrigation head spacing and irrigation heads and nozzles. Irrigation head 4 has very good SM-DU, whereas head 8 exhibits a lower SM-DU as illustrated by water patterns in Figure 1. See Figure 2 and Table 3 for more information on head 8.
%VWC metrics for head 8
Head 8 impact area statistics
Moisture uniformity: 71.4% Head 8 impact area statistics
Mean CV Soil moisture correlation
Soil moisture 30.1% 23.6% Compaction 226.5 psi 11.3% -0.86 Turf vigor 0.867 NDVI 3.1% 0.77
Table 3. Soil moisture (%VWC) metrics for the area of influence of head 8 (see map) on fairway 1. Coefficient of variability (CV) is a statistical measure of soil volumetric water content (VWC) vari-ability, where a low value is best. These data appear as a pop-up on the spatial map for fairway 1 and provide information similar to that in Table 2 as well as information that relates soil volumetric water content values to penetrometer resistance (COMP) values and turf vigor (NDVI). Because of the considerable spatial variability in soil volumetric water content in this irrigation head's area of influence, penetrometer resistance increases as soil volumetric water content declines, and NDVI increases as soil volumetric water content increases. See Figure 2 for soil water distribution away from head 8 by quadrant.
Maximum directional variation: 20 .9% Figure 2. Average volumetric water content at different distances from head 8 for each quadrant and for an average of all quadrants (see Table 2 for additional information provided for each irrigation head).
Distance (in feet) from sprinkler
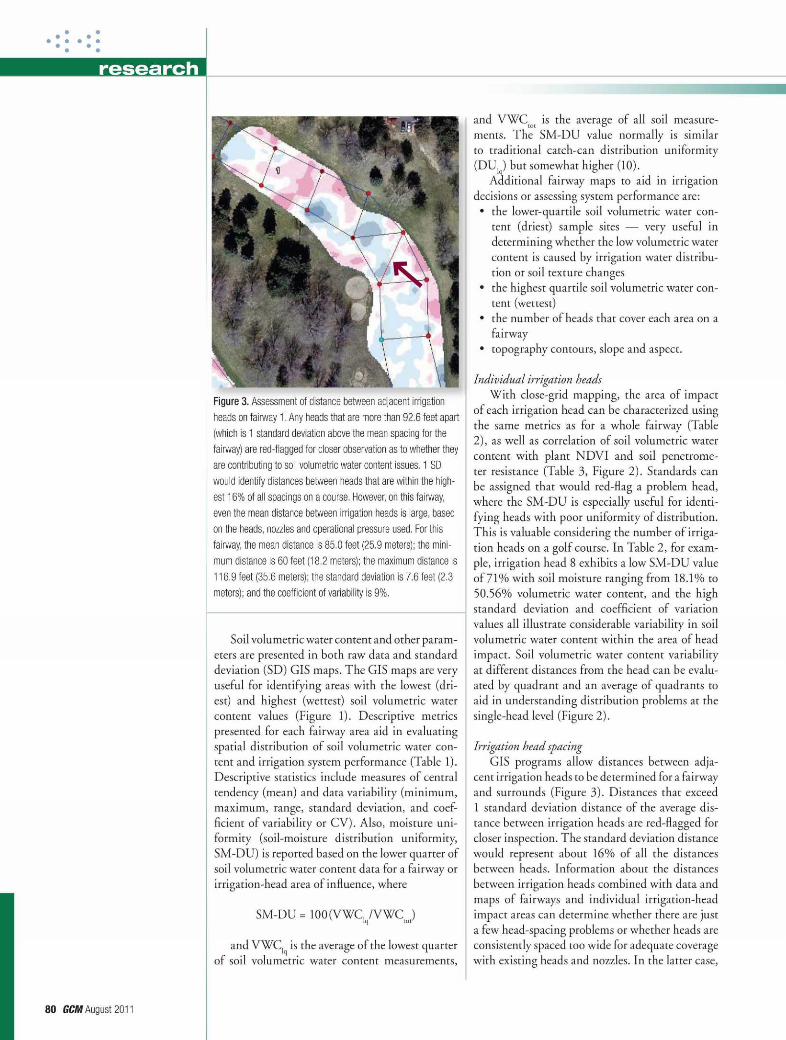
Figure 3. Assessment of distance between adjacent irrigation heads on fairway 1. Any heads that are more than 92.6 feet apart (which is 1 standard deviation above the mean spacing for the fairway) are red-flagged for closer observation as to whether they are contributing to soil volumetric water content issues. 1 SD would identify distances between heads that are within the high-est 16% of all spacings on a course. However, on this fairway, even the mean distance between irrigation heads is large, based on the heads, nozzles and operational pressure used. For this fairway, the mean distance is 85.0 feet (25.9 meters); the mini-mum distance is 60 feet (18.2 meters); the maximum distance is 116.9 feet (35.6 meters); the standard deviation is 7.6 feet (2.3 meters); and the coefficient of variability is 9%.
80 GCM August 2011
Soil volumetric water content and other param-eters are presented in both raw data and standard deviation (SD) GIS maps. The GIS maps are very useful for identifying areas with the lowest (dri-est) and highest (wettest) soil volumetric water content values (Figure 1). Descriptive metrics presented for each fairway area aid in evaluating spatial distribution of soil volumetric water con-tent and irrigation system performance (Table 1). Descriptive statistics include measures of central tendency (mean) and data variability (minimum, maximum, range, standard deviation, and coef-ficient of variability or CV). Also, moisture uni-formity (soil-moisture distribution uniformity, SM-DU) is reported based on the lower quarter of soil volumetric water content data for a fairway or irrigation-head area of influence, where
SM-DU = 100(VWC l q /VWCJ
and VWCj is the average of the lowest quarter of soil volumetric water content measurements,
and VWC is the average of all soil measure-tot &
ments. The SM-DU value normally is similar to traditional catch-can distribution uniformity (DUj) but somewhat higher (10).
Additional fairway maps to aid in irrigation decisions or assessing system performance are:
• the lower-quartile soil volumetric water con-tent (driest) sample sites — very useful in determining whether the low volumetric water content is caused by irrigation water distribu-tion or soil texture changes
• the highest quartile soil volumetric water con-tent (wettest)
• the number of heads that cover each area on a fairway
• topography contours, slope and aspect.
Individual irrigation heads With close-grid mapping, the area of impact
of each irrigation head can be characterized using the same metrics as for a whole fairway (Table 2), as well as correlation of soil volumetric water content with plant NDVI and soil penetrome-ter resistance (Table 3, Figure 2). Standards can be assigned that would red-flag a problem head, where the SM-DU is especially useful for identi-fying heads with poor uniformity of distribution. This is valuable considering the number of irriga-tion heads on a golf course. In Table 2, for exam-ple, irrigation head 8 exhibits a low SM-DU value of 71% with soil moisture ranging from 18.1% to 50.56% volumetric water content, and the high standard deviation and coefficient of variation values all illustrate considerable variability in soil volumetric water content within the area of head impact. Soil volumetric water content variability at different distances from the head can be evalu-ated by quadrant and an average of quadrants to aid in understanding distribution problems at the single-head level (Figure 2).
GIS programs allow distances between adja-cent irrigation heads to be determined for a fairway and surrounds (Figure 3). Distances that exceed 1 standard deviation distance of the average dis-tance between irrigation heads are red-flagged for closer inspection. The standard deviation distance would represent about 16% of all the distances between heads. Information about the distances between irrigation heads combined with data and maps of fairways and individual irrigation-head impact areas can determine whether there are just a few head-spacing problems or whether heads are consistently spaced too wide for adequate coverage with existing heads and nozzles. In the latter case,
The research says A mobile multiple-sensor unit
for conducting a soil-moisture-based water audit on large areas of turf, such as fairways, brings precision turfgrass
management to golf courses. The soil-moisture-based water
audit combines site data acquisition, traditional and geostatistical analysis
and GIS displays. Soil volumetric water content is
combined with GIS maps to identify the driest and wettest areas of an area such
as a fairway. - > Each irrigation head is evaluated
based on soil water content and distri-bution patterns in the area of influence for each head, which allows individual
head problems to be identified. Distances between irrigation
heads are recorded for a fairway, and excessive distances are highlighted
to call attention to problem irrigation heads and spacing.
The focus of the soil-moisture-based water audit is to correct deficien-
cies in the irrigation system, but NDVI and salinity data can also be helpful to
superintendents.
82 GCM August 2011
theoretical distribution from different heads and nozzle choices can determine replacement options or whether the system will be inadequate regard-less of reasonable changes. Flagged heads are field-evaluated for possible problems and fixes.
Other features T h e new soil-moisture-based water audit
focuses on water-use efficiency by assessing and correcting issues related to irrigation system design, maintenance and scheduling, but the N D V I and salinity data obtained during spatial mapping under drier conditions also are very valuable. Relations between soil volumetric water content and plant N D V I or soil salinity can be explored because the decision support system report contains this information. Soil moisture strongly influences turfgrass performance, salin-ity spatial distribution (when saline irrigation water is used), and salinity leaching efficiency.
In modern turfgrass management , integration of cutting-edge science technologies and concepts is important to maintain efficiency of resource inputs, including water. T h e new soil-moisture-based water audit is an important step toward improved site-assessment methodology to support sustainable golf course management .
Funding The Center for Advanced Turfgrass Technology of The Toro
Co. provided research funds for the University of Georgia research.
A c k n o w l e d g m e n t s We wish to acknowledge Kathy Rice of the Center for
Advanced Turfgrass Technology for her expertise in development of the Decision Support System software package.
Literature c i ted 1. Carrow, R.N., R.R. Duncan and C. Waltz. 2009. BMPs and
water-use efficiency and conservation plan for golf courses: Template and guidelines. Developed for Golf Course Superin-tendents Association of America by University of Georgia, www. commodities.caes.uga.edu/turfgrass/georgiaturf/Water/ Articles/BMPs_Water_Cons_09.pdf (verified June 21,2011).
2. Carrow, R.N., J. Krum, I. Flitcroft and V. Cline. 2010. Preci-sion turfgrass management: Challenges and field applica-tions for mapping turfgrass soil and stress. Precision Agri-culture 11(2):115-134.
3. Carrow, R.N., J. Krum and C. Hartwiger, 2009. Precision turfgrass management: a new concept for efficient applica-tions of inputs. USGA Turfgrass and Environmental Research Online 8(13):1-12. http://usgatero.msu.edu/v08/n13.pdf (verified June 21,2011).
4. Center for Irrigation Technology. 2009. Web-site and SPACE ProTM program, http://cit.cati.csufresno.edu/ (verified June 21,2011).
5. Cline, V., K. Rice, T. Carson and R.N. Carrow. 2011. Inten-sive, new water-audit approach and decision-support sys-tem. ASA Abstracts, American Society of Agronomy meet-ing, Oct. 16-19, 2011, San Antonio, Texas.
6. Esri. 2004. ArcGIS 9: Using ArcGIS geostatistical analyst. Esri, Redlands, Calif.
7. Esri. 2004. ArcGIS 9: Using ArcGIS spatial analyst. Esri, Redlands, Calif.
8. Flitcroft, l„ J. Krum, R. Carrow, etal. 2010. Spatial mapping of penetrometer resistance on turfgrass soils for site-spe-cific cultivation. 10th International Conference on Precision Agriculture Proceedings, July 18-21, 2010, Hyatt Regency Tech Center, Denver, Colo, www.icpaonline.org/finalpdf/ abstract_202.pdf (verified June 21,2011).
9. Irrigation Association. 2003. Certified golf irrigation auditor. Irrigation Association, Falls Church, Va.
10. Kieffer, D.L., and T.S. 0'Conner. 2007. Managing soil mois-ture on golf greens using a portable wave reflectometer. Proceedings 28th International Irrigation Show, Dec. 9-11, 2007, San Diego, Calif. [CD-ROM] The Irrigation Associa-tion, Falls Church, Va.
11. McBratney, A , B. Whelan and T. Ancev, 2005. Future direc-tions of precision agriculture. Precision Agriculture 6:7-23.
12. Sadler, E.J., C.R. Camp and R.G. Evans. 2007. New and future technology, p. 609-626. In: B.A. Stewart and D.R. Nielsen, eds. Irrigation of agricultural crops, 2nd ed. Agron-omy Monograph No. 30. Crop Science Society of America, Madison, Wis.
13. Vogt, M.D. 2011. You can't manage what you don't measure. Golf Course Management 79(6): 57-60.
GCM
Robert N. Carrow ([email protected]) is a professor in the department of crop and soil science at the Georgia Experiment Station, University of Georgia, Griffin, 6a., and Van Cline is manager of turf agronomics and research at The Toro Co., Bloomington, Minn.