Embed Size (px)
Citation preview
AIVC 11620 .
ASH RAE JOURNAL
Predicted and Measured Air Exchange Rates
By Walid S. Bouhamra, Amal S. Elkilani and Mahmoud Y. Abdul-Raheem
part of an ongoing indoor air quality (IAQ) modeling tudy, air exchange rates of ten Kuwait re idential buildings were mea ured according to the American
Society for Testing and Materials (ASTM) E741-83 standard which is a tracer gas decay technique. In this study, SF6 was used as the tracer gas. Air exchange rates were predicted ba ed on the characteristic of the HVAC y tern, openings ( uch as windows). leakage area pertaining average wind speed, average indoor/outd0or temperature difference and wind and stack coefficients.
When the coefficients recommended in the literature were used. predicted air exchange rates consistently were higher by about 34% than those obtained from tracer measurements . Therefore, a modified procedure has been proposed to accurately predict the air exchange rate of tightly controlled residen-1iaJ buildings of thi region.
Nonnally, lAQ models are based on a mas balance equation involving outdoor and indoor concentra1ion • ink, source and air exchange rate terms. An important element of these models i the air change rate, which is defined as the ratio of the net volumetric flow rate entering (or leaving) the volume of the building . Therefore, it is equivalent to the reciprocal of the mean residence time (or pace velocity), which i the u ual concept u ed in traditional chemical reactor theory.
The air exchange rate (also called 1he air change rate) is normaJ ly symbolized by ACH and is a measuremem of how much fresh outdoor air replaces indoor air in a given time period. It is measured in unic of air changes per hour and equals the ratio of the hourly indoor air volume replaced by ourdoor a ir to the total indoor volume. Therefore, a high ACH means a large volume of outdoor air comes in and replaces the indoor air over time.
In an accompanying detailed study, indoor and outdoor concentrations of certain volatile organic comp unds (VOCs) have been measured in the residential areas of Kuwait with the ullimate aim of developing a mathematical IAQ model.1 The model require , among other factors, an accurare estimate of air exchange rate (ACH). The air exchange rate of a building cannot be estimated ba ed on the building' construction or age or from a imple visual inspection. It is possible only when a detailed quantification of the leakage sites and their magnitude area are made. Then the air exchange rate of a building can be calculated in a straightforward manner given the 10cation and
42 ASHRAE Journal
leakage functions for every opening in the building enve the wind and tack coefficient over the building envelope. any mechanical ventilation airflow rate ..
Although these inputs are nonnally available, the stu involving experimental verifications are scarce. This means the reliabilfry of these calculations is unknown. Further, also uncertain whether these technique can be u ed c dently for buildings that may have different phy ical nature such as those in Kuwait and the Arabian Peninsula . The b ings in these locations are relatively new and are designe. cope with harsh conditions, such as extreme temperature dust stonns. The aim of this work is to measure air excha rates for some typical Kuwaiti residential buildings and c<
pare them with the predictions. The ultimate goal is to obta modified predictive technique.
Experimental Method A tracer gas method is used to determine the ACH in
Kuwaiti residential buildings. An appropriate tracer gas sho not be a normal constituent of air and has to be measurable a technique that is free of interference by substances that nonnally present in ambient air. Here SF6 (sulphur hexafluori was cho en a. a tracer ga because it is chemically inert wl pure and i also non-toxic.
The maximum allowable concentration of SF 6 in air (vol.Iv• was lOOO ppm and the minimum detectable concentration gas chromatography was 0.000002 ppm. On the other hand, : average tropospheric background concentration of SF6 is I ppm and the typical indoor and urban ambient concentratio1 around 10-5 ppm. The volume of SF 6 that was released throut out the entire house was adjusted depending on the ind( volume. It was then allowed to mix with the indoor air for ab( 30 minutes.
A series of air samples were collected intenniuemly at I sampling site (the living room). A sequential air ampler w tedlar bags automatically collected air samples into ix I L (0.
About the Authors
Walid S. Bouhamra is an associate professor in chemical engi
neering at Kuwait University.
Amal S. Elkilani is a laboratory engineer in the chemical engi
neering department at Kuwait University.
Mahmoud Y. Abdul-Raheem is the coordinator ofthe Regional
Organization for the Protection of Marine Environment
(ROPME). Previously, he was the secretary general of the Envi
ronment Protection Council (EPC) in Kuwait.
August 199
i' ---?:'..-..-=_ ••,-er - _ �, ..,.,, �---• ._ ... ··.-�--.. "°'".-.. - -�•' _ • _ _ --�
�� .. -� .
- -
r. ' - · . . ' . $ it,, ' '· . , - ' F - � : '. . . ... I . .
-
pe 1d
es at IS
:1-
jto td �e 1-
a
0 d y e ) n
6
7
·---------. ----.__,� )'-. ..:�
�J--·--Mill� ·-..,
"t).""
·�. ( - -z._, ......_:'HOUSH----"--,
. � .... ..._
6
c 0 :s -= c Cl> 5 u c 0 u CD ""-... 0 ...J
�' ...
................... � '·,'-tiloUSE 5
I 4
I 3
0 10 20 30 40 50 60 70 80 90 Time, minutes
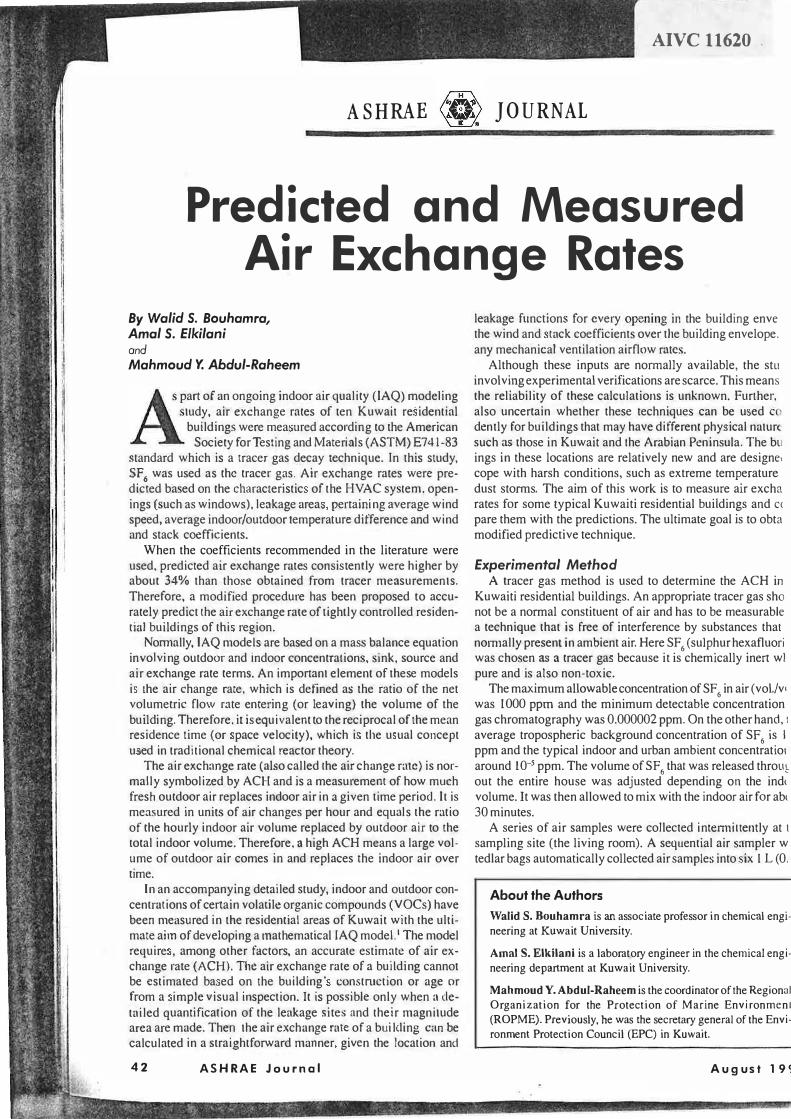
Figure J: Measured tracer gas concentration for three typical houses.
ft3) bags. Precise low flow rates were maintained using a critical orifice and applying a constant vacuum to the chamber.
The contents of the filled tedlar sampling bags were then analyzed for SF6 content using a gas chromatograph with a 1.5-m (5 ft) long and 4 mm (0.16 in. ) diameter propack column and a thermal conductivity detector.
Other pertinent details were performed according to the procedure outlined in "ASTM E741-83: Standard Test Method for Determining Air Leakage Rate by Tracer Dilution" and the National Institute of Standards and Technology protocol developed for the Washington State Energy Office (WSEO), "Instructions for Tracer Gas Test. "2
Background Air exchung between indoors and outdoors consists of two
groups: ventilation (controlled) und infiltration ( uncontrolled). Ventilation can be natural and forced. Natural ventilation is non-powered airflow through open windows, doors and other intentional openings in the building envelope. Forced ventilation is intentional and consists of powered air exchange by a fan or a blower and intake and/or exhaust vents specifically designed and installed for ventilation.
Infiltration is uncontrolled airflow through cracks, interstices and other unintentional openings. Infiltration, exfiltration and natural ventilation airflows are caused by pressure difference due to wind and indoor-outdoor temperature difference.3
The relation ·hip between tbe airflow through an opening in the bui ld ing envelope Q,v and the pressure dif� rence across it i · called the le<lbgc function of the opening. 111e form of the leakage function depends 011 lbc geometry of the opening. Airtl w can also depend on wind. Fuctors that affect the ventilation rnce due to wind r rec' include average speed ilnd prevail-
August 1998
AIR QUAL ITY
2
/
//. /
/ :c 1.5 � � Cl> Cl c "'
..c s ... ·c;; -0 � .. :(! Cl> •
/ _,,/ /
/ •
/ / •
// • /
/ /
,f / /
:;;: 0.5 • /
4 / • ,,,, . .-
/ / I 0 [/ I
0 0.5 1.5 2 2.5 Predicted air exchange rate, ACH
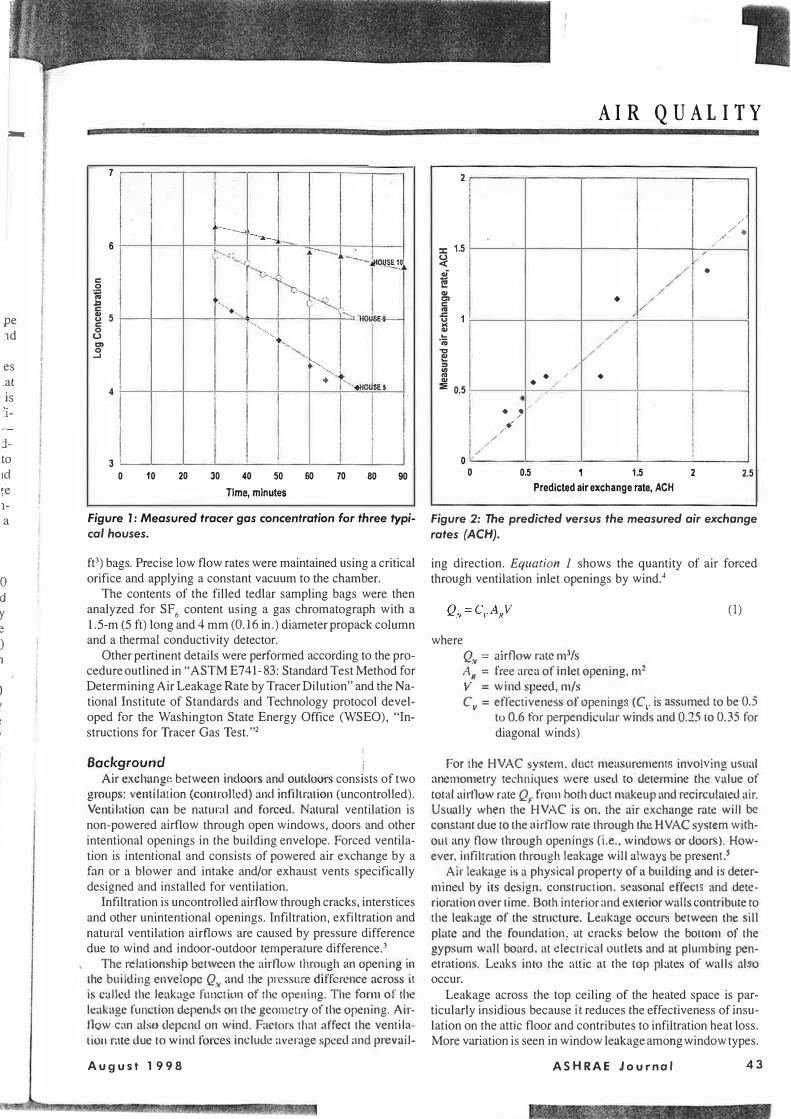
Figure 2: The predicted versus the measured air exchange rates (ACH).
ing direction. Equation 1 shows the quantity of air forced through ventilation inlet openings by wind.4
where Q.v = airflow rate mJ/s AR ::: free area of inlet opening, m2 V = wind 'peed, m/s
(1)
C11 = effectiveness of opening (C 11 i as urned to be 0.5 to 0.6 for perpendi ·ular winds and Q._S to 0.35 for diagonal winds)
For the HVAC system. duct mea ·urement invol ing u ual anemometry techniques were u ·ed to determine rhe alue of Lotal airflow rnte QF from both duct makeup and recirculated air. Usually when the HVAC is on, the air exchange rate will be con tam due 10 the airflow rate through th HVAC ·yscem wirhouL any flow rhrough openings (i.e., windows or door ). However. infiltration through leakage will a lway be present.j
Air leakage is a physical property of a building and is determined by it de ·ign, construction. sea onal effect and deterioration over time. Both interior and exteri r walls contribure ro the leakage of the 'tructure. Leakage occur between the sill plate and the foundation at cracks below the bottom of the gypsum wall board. at electrical outlets and at plumbing penetrations. Leaks into the attic at the top plate · of walls al o occur.
Leakage across the top ceiling of the heated space is particularly insidious because it reduces the effectiveness of insulation on the attic floor and contributes to infiltration heat loss. More variation is seen in window leakage among window types.
ASHRAE Journal 43
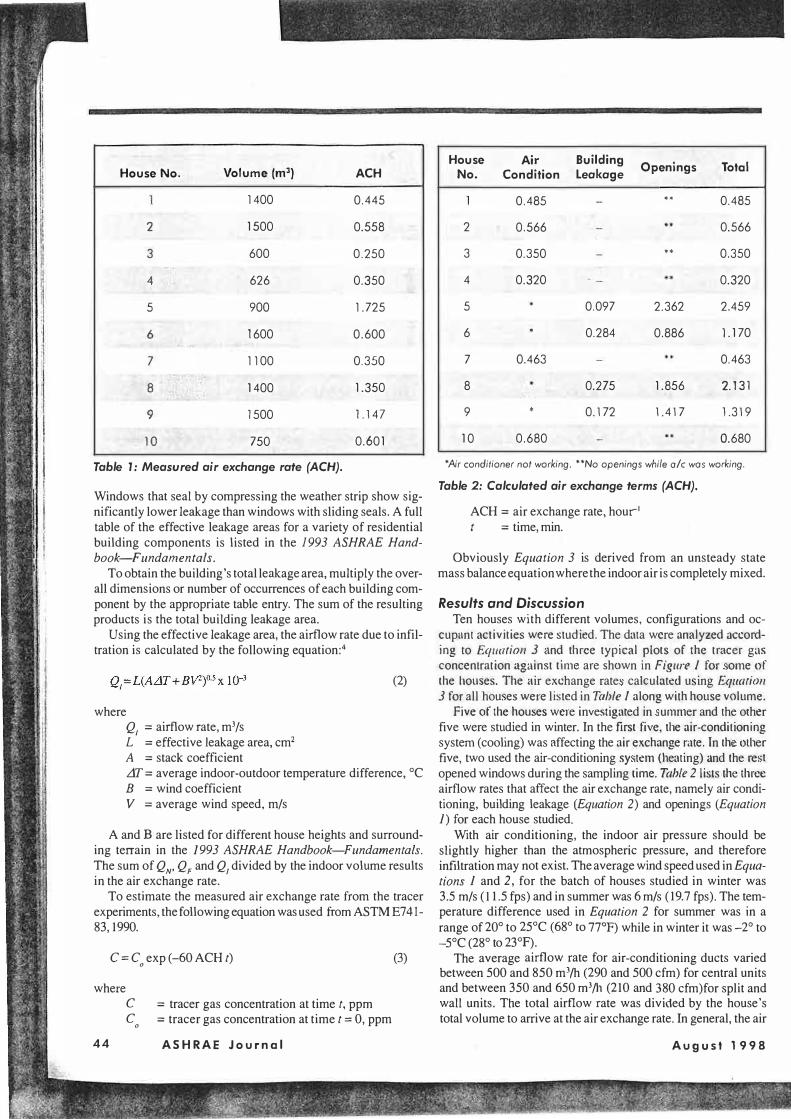
House No. Volume (m3) ACH
1400 0.445
2 1500 0.558
3 600 0.250
4 626 0.350
5 900 1.725
6 1600 0.600
7 1100 0.350
8 1400 1.350
9 1500 1.147
10 750 0.601
Table 1: Measured air exchange rate (ACH).
Windows that seal by compressing the weather strip show significantly lower leak.age than windows with sliding seals. A full table of the effective leakage areas for a variety of residential building components is listed in the 1993 ASHRAE Handbook-Fundamentals.
To obtain the building's total leak.age area, multiply the overall dimensions or number of occurrences of each building component by the appropriate table entry. The sum of the resulting products is the total building leakage area.
Using the effective leakage area, the airflow rate due to infiltration is calculated by the following equation:4
where Q1 =airflow rate, m3/s l = effective leak.age area, cm2 A = stack coefficient
(2)
LfI = average indoor-outdoor temperature difference, °C B = wind coefficient V = average wind speed, m/s
A and B are listed for different house heights and surrounding terrain in the 1993 ASHRAE Handbook-Fundamentals.
The sum of QN, QF and Q1 divided by the indoor volume results in the air exchange rate.
To estimate the measured air exchange rate from the tracer experiments, the following equation was used from ASTM E74 l-83, 1990.
C = C0 exp (-60 ACH t)
where c c
44 0
= tracer gas concentration at time t, ppm = tracer gas concentration at time t = 0, ppm
ASHRAE Jo urnal
(3)
House No.
2
3
4
5
6
7
8
9
10
Air Condition
0.485
0.566
0.350
0.320
0.463
0.680
Building Leakage
0.097
0.284
0.275
0.172
Openings
••
••
2.362
0.886
1.856
1.417
Total
0.485
0.566
0.350
0.320
2.459
1.170
0.463
2.131 1.319
0.680
*Air conditioner not working. **No openings while ale was working.
Table 2: Calculated air exchange terms (ACH).
ACH = air exchange rate, hour1 t = time, min.
Obviously Equation 3 is derived from an unsteady state mass balance equation where the indoor air is completely mixed.
Results and Discussion Ten houses with different volumes, configurations and oc
cupant activities were stud ied. The data were analyzed according to Equation 3 and three typical plots of the tracer gas concentration against time are shown in Figure J for ome of the house . The air exchange rate calculated u ing Equation 3 for all hou. es were l isted in Table I along with house volume.
Five of the houses were investigated in urnmer and the other five were studied in winter. In the first five the air-conditioning system (cooling) was affecting the air exchange rate . [n lh olher five, two used the air-conditioning sy tern (heating) and the re t
opened windows during the sampling lime. Tahle 2 list th three airflow rates that affect the air exchange rate, namely air conditioning, building leak.age (Equation 2) and openings (Equation 1) for each house studied.
With air conditioning, the indoor air pressure should be slightly higher than the atmospheric pressure, and therefore infiltration may not exist. The average wind speed used in Equa
tions 1 and 2, for the batch of houses studied in winter was 3.5 m/s (11.5 fps) and in summer was 6 m/s (19.7 fps). The temperature difference used in Equation 2 for summer was in a range of 20° to 25°C (68° to 77°F) while in winter it was -2° to -5°C (28° to 23°F).
The average airflow rate for air-conditioning ducts varied between 500 and 850 m3/h (290 and 500 cfm) for central units and between 350 and 650 m3/h (210 and 380 cfm)for split and wall units. The total airflow rate was divided by the house's total volume to arrive at the air exchange rate. In general, the air
Augu st 1998
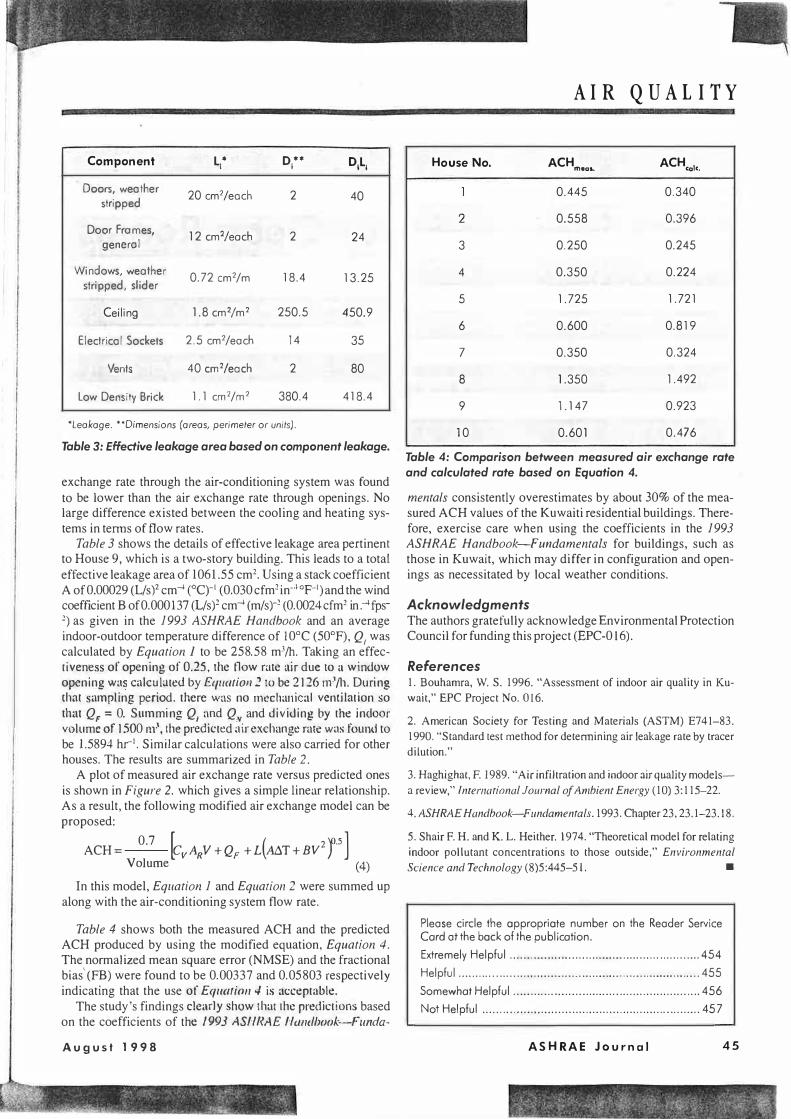
Component L.* D.** DILi I I
Doors, weather 20 cm2/each 2 40
stripped
Door Frames, 12 cm2/each 2 24 general
Windows, weather 0.72 cm2/m 18.4 13.25
stripped, slider
Ceiling 1.8 cm2/m2 250.5 450.9
Electrical Sockets 2.5 cm2/each 14 35
Vents 40 cm2/each 2 80
Low Density Brick 1.1 cm2/m2 380.4 418.4
•Leakage ... Dimensions (areas, perimeter or units).
Table 3: Effective leakage area based on component leakage.
exchange rate through the air-conditioning system was found to be lower than the air exchange rate through openings. No large difference existed between the cooling and heating systems in tenns of flow rates.
Table 3 shows the details of effective leakage area pertinent to House 9, which is a two-story building. This leads to a total effective leakage area of l 061.5 5 cm2• Using a stack coefficient A of0.00029 (L/s)2 cm--1 (0q-1 (0.030 cfm2 in--1°F-1) and the wind coefficient B of0 .000137 (L/s)2 cm--1 (m/s)-2 (0.0024cfm2 in.-1fps-2) as given in the 1993 ASHRAE Handbook and an average indoor-outdoor temperature difference of l 0°C ( 50°F), Q1 was calculated by Equation 1 to be 258.58 m3/h. Taking an effeccivenes of opening of 0.25, the flow rate air due to a window opening wn calculated by Equarion 2 to be 2126 m-1/h. During that ampling period, there was no mechani al ventilation ·o that QF = 0. Summing Q, and QN and dividing by the ind r volume of 1500 m\ the predicted air exchange rate was found to be 1.5894 hr1• Similar calculations were also carried for other houses. The results are summarized in Table 2.
A plot of measured air exchange rate versus predicted ones is shown in Figure 2. which gives a simple linear relationship. As a result, the following modified air exchange model can be proposed:
ACH= 0
·7 [cvARV +QF +L(A�T+Bv2}'5 ]
V�u� � In this model, Equation 1 and Equation 2 were summed up
along with the air-conditioning system flow rate.
Table 4 shows both the measured ACH and the predicted ACH produced by using the modified equation, Equation 4. The normalized mean square error (NMSE) and the fractional bias' (FB) were found to be 0.00337 and 0.0 5803 respectively indicating that the use of £q11mio11 4 is acceptable.
The study's findings clearly how that the predictions based on the coefficients of the 1993 ASH RAE Hunclbook-Funda-
August 1998
AIR QUAL ITY
House No.
2
3
4
5
6
7
8
9
10
ACH meoL
0.445
0.558
0.250
0.350
1.725
0.600
0.350
1.350
1.147
0.601
ACHcaic.
0.340
0.396
0.245
0.224
1.721
0.819
0.324
1.492
0.923
0.476
Table 4: Comparison between measured air exchange rate and calculated rate based on Equation 4. mentals consistently overestimates by about 30% of the measured ACH values of the Kuwaiti residential buildings. Therefore, exercise care when using the coefficients in the 1993 ASHRAE Handbook-Fundamentals for buildings, such as those in Kuwait, which may differ in configuration and openings as necessitated by local weather conditions.
Acknowledgments The authors gratefully acknowledge Environmental Protection Council for funding this project (EPC-016).
References 1. Bouhamra, W. S. 1996. "Assessment of indoor air quality in Ku
wait," EPC Project No. 016. 2. American Society for Testing and Materials (ASTM) E74l-83.
l 990. "Standard test method for detennining air leakage rate by tracer
dilution."
3. Haghighat, F. 1989. "Air infiltration and indoor air quality models
a review," lntemarional Journal of Ambient Energy (10) 3: 115-22.
4. ASHRAE Handbook-Fundamentals. 1993. Chapter 23, 23.1-23. 18.
5. Shair F. H. and K. L. Heither. 1974. "Theoretical model for relating
indoor pollutant concentrations to those outside," Environmental
Science and Technology (8)5:445-5 l. •
Please circle the appropriate number on the Reader Service Card at the back of the publication.
Extremely Helpful . ... ... ..... ... ........ . ......... . ... .... . . . . . .. . . ..... . 454
Helpful .... . . . . . . . . . . .................... . . ............ . . . ..... .......... ..... 455
Somewhat Helpful .... .......... ... ......................... .. . ... ... . ... 456
Not Helpful ... . . . . . .. . ... .. ... ....... .... . . .... ........ . . .... .. ..... ..... .. 45 7
ASHRAE Journal 45