Embed Size (px)
Citation preview
[Supporting Information]
Mass-flow-based Removal and Transformation Potentials
for TBBPA, HBCDs and PBDEs During Wastewater
Treatment Processes
Un-Jung Kima,b, Jeong-Eun Oha*
aDepartment of Civil and Environmental Engineering, Pusan National University, 2, Busandaehak-ro 63beon-gil, Geumjeong-gu, Busan, 46241, Republic of KoreabPresent address: Wadsworth Center, New York State Department of Health, and Department of Environmental Health Sciences, School of Public Health, State University of New York at Albany, Empire State Plaza, P.O. Box 509, Albany,New York 12201-0509, United States
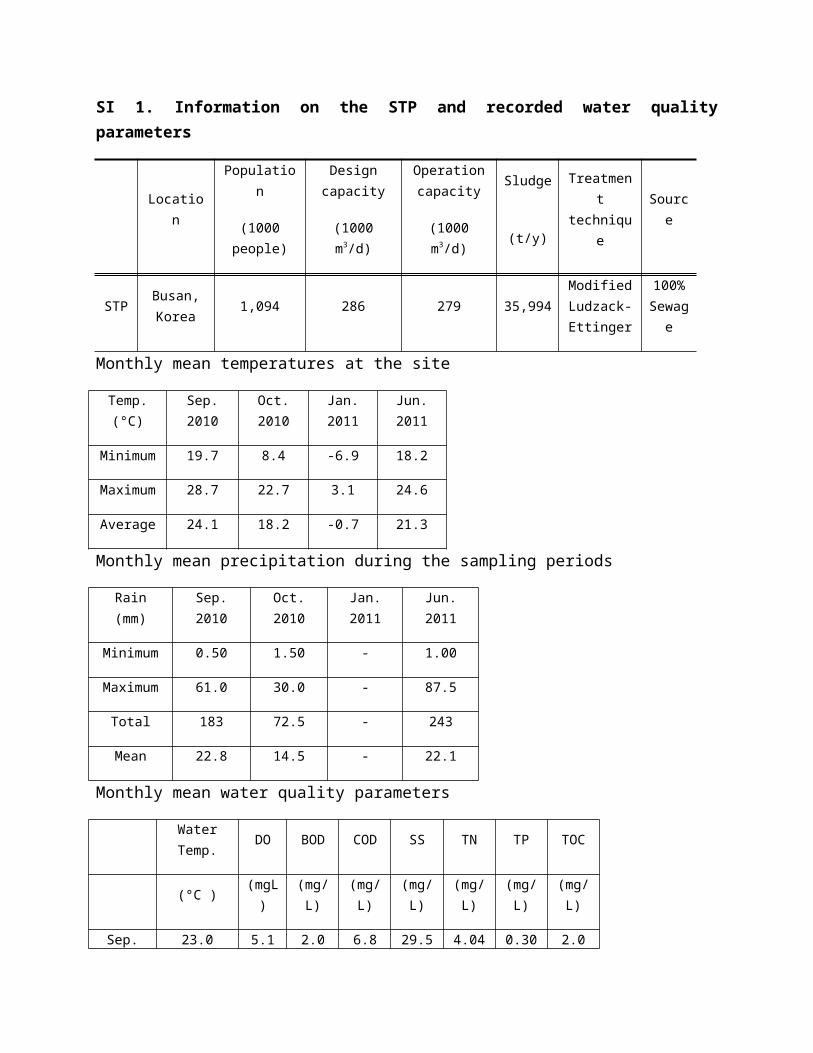
SI 1. Information on the STP and recorded water quality parameters
LocationPopulation
Design capacity
Operation capacity
SludgeTreatment technique
Source
(1000 people) (1000 m3/d) (1000 m3/d) (t/y)
STPBusan, Korea
1,094 286 279 35,994Modified Ludzack-Ettinger
100% Sewage
Monthly mean temperatures at the site
Temp. (°C) Sep. 2010 Oct. 2010 Jan. 2011 Jun. 2011
Minimum 19.7 8.4 -6.9 18.2
Maximum 28.7 22.7 3.1 24.6
Average 24.1 18.2 -0.7 21.3
Monthly mean precipitation during the sampling periods
Rain (mm) Sep. 2010 Oct. 2010 Jan. 2011 Jun. 2011
Minimum 0.50 1.50 - 1.00
Maximum 61.0 30.0 - 87.5
Total 183 72.5 - 243
Mean 22.8 14.5 - 22.1
Monthly mean water quality parameters
Water Temp. DO BOD COD SS TN TP TOC
(°C ) (mgL) (mg/L)(mg/L)
(mg/L) (mg/L)(mg/L)
(mg/L)
Sep. 2010
23.0 5.1 2.0 6.8 29.5 4.042 0.303 2.0
Oct. 2010 23.0 5.2 2.1 5.8 20.0 4.002 0.334 4.8
Jan. 2011 11.0 8.6 2.2 5.6 17.8 7.629 0.414 5.8
Jun. 2011 20.0 9.5 5.6 8.8 25.4 7.018 0.489 6.2
DO = dissolved oxygen concentration, BOD = biological oxygen demand, COD = chemical oxygen demand, SS = suspended solid concentration, TN = total nitrogen concentration, TP =
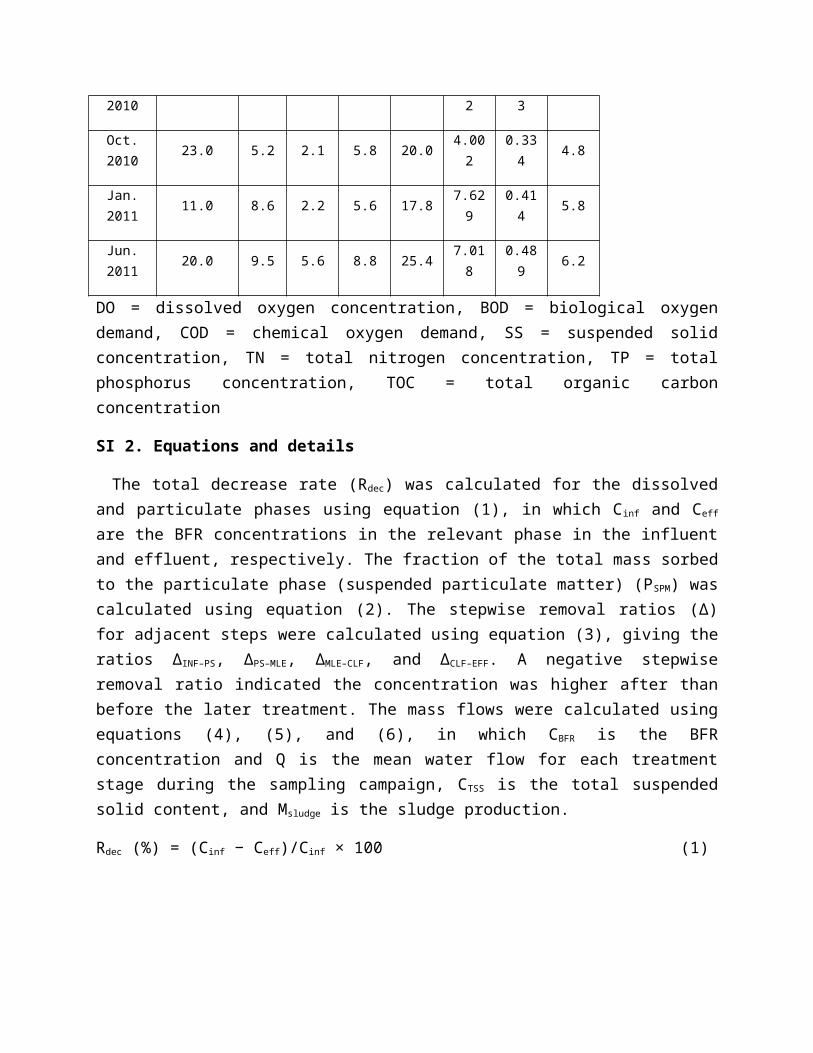
total phosphorus concentration, TOC = total organic carbon concentration
SI 2. Equations and details
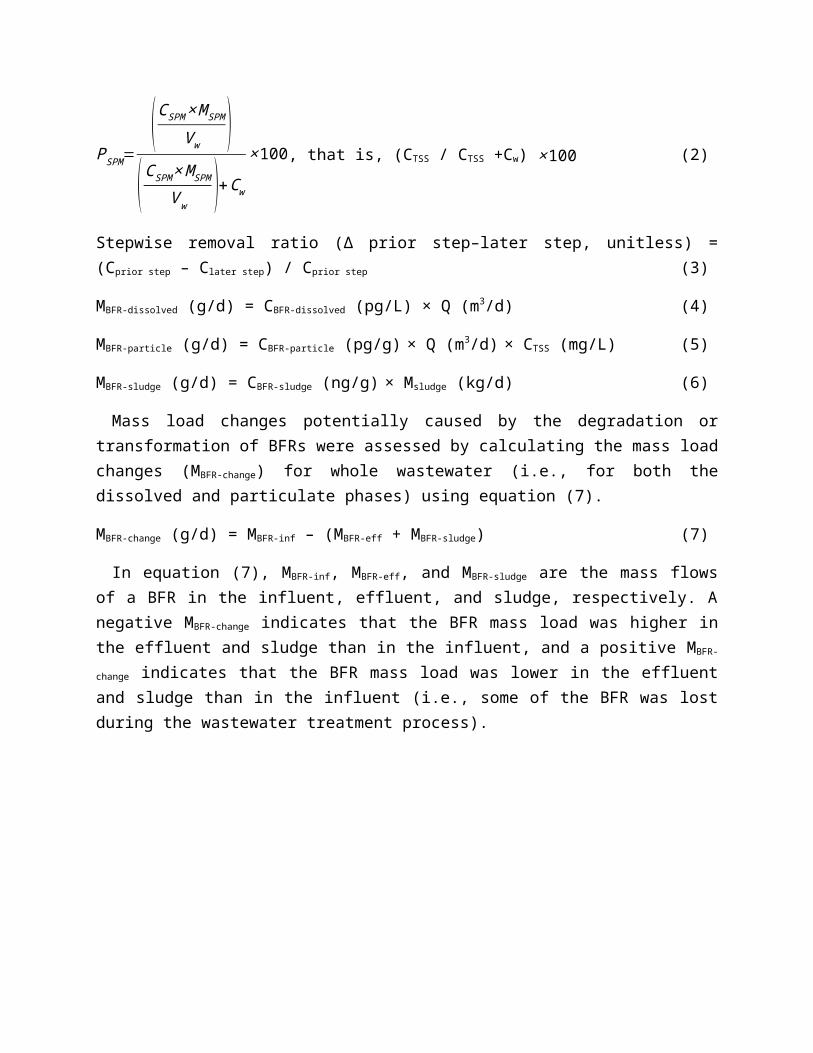
The total decrease rate (Rdec) was calculated for the dissolved and particulate phases using equation (1), in which Cinf and Ceff are the BFR concentrations in the relevant phase in the influent and effluent, respectively. The fraction of the total mass sorbed to the particulate phase (suspended particulate matter) (PSPM) was calculated using equation (2). The stepwise removal ratios (Δ) for adjacent steps were calculated using equation (3), giving the ratios ΔINF–PS, ΔPS–MLE, ΔMLE–CLF, and ΔCLF–EFF. A negative stepwise removal ratio indicated the concentration was higher after than before the later treatment. The mass flows were calculated using equations (4), (5), and (6), in which CBFR is the BFR concentration and Q is the mean water flow for each treatment stage during the sampling campaign, CTSS is the total suspended solid content, and Msludge is the sludge production.
Rdec (%) = (Cinf − Ceff)/Cinf × 100 (1)
PSPM=(CSPM×M SPM
V w )(C SPM×M SPM
V w )+Cw×100, that is, (CTSS / CTSS +Cw) ×100 (2)
Stepwise removal ratio (Δ prior step–later step, unitless) = (Cprior step – Clater step) / Cprior step (3)
MBFR-dissolved (g/d) = CBFR-dissolved (pg/L) × Q (m3/d) (4)
MBFR-particle (g/d) = CBFR-particle (pg/g) × Q (m3/d) × CTSS (mg/L) (5)
MBFR-sludge (g/d) = CBFR-sludge (ng/g) × Msludge (kg/d) (6)
Mass load changes potentially caused by the degradation or transformation of BFRs were assessed by calculating the mass load changes (MBFR-change) for whole wastewater (i.e., for both the dissolved and particulate phases) using equation (7).
MBFR-change (g/d) = MBFR-inf – (MBFR-eff + MBFR-sludge) (7)
In equation (7), MBFR-inf, MBFR-eff, and MBFR-sludge are the mass flows of a BFR in the influent, effluent, and sludge, respectively. A negative MBFR-change indicates that the BFR mass load was higher in the effluent and sludge than in the influent, and a positive MBFR-change indicates that the BFR mass load was lower in the effluent and sludge than in the influent (i.e., some of the BFR was lost during the wastewater treatment process).
SI 3. Concentration level comparison
From most of previous studies, the occurrence of BFRs in the STP was reported by analyzing sludge than wastewater. Few reports were available for PBDEs (4-29000 pg/L in effluent from WWTP in California, USA, North, 2004; 310 to 900 pg/L in effluent from WWTP in Maine, USA, Anderson and MacRae, 2006) and HBCDDs (16-400 ng/L in influent and 0.39-12 ng/L in effluent from STP, Japan, Ichihara et al., 2014). There was no wastewater result for TBBPA at this moment but in landfill leachate, 0.3-540 ng/L of TBBPA was reported (Suzuki and Hasegawa, 2006).
SI 4. Distributions of the BFRs in the wastewater samples
Three groups of PBDEs were used when assessing the PBDE congener distributions. These groups were BDE209, the nine other dominant PBDE congeners (BDE28, BDE47, BDE99, BDE100, BDE154, BDE153, BDE183, BDE197, and BDE196), and the remaining 17 PBDE congeners. As mentioned in the main text, the overall distributions of the three target BFR groups in the dissolved phase remained almost constant throughout the treatment processes, HBCD being dominant and contributing >40% of the total BFR concentrations in the dissolved phase. However, clearly different distributions were found in the particulate phase at the different treatment stages. The TBBPA concentration was lower than the HBCD concentration in both phases except in the particulate phase of the effluent. We also compared the BFR distributions in the particulate phase and the sludge, and found that BDE209 and the group of 17 PBDEs made higher contributions to the total BFR concentrations in sludge than in the particulate phase but that the HBCDs made similar contributions to the total BFR concentrations in sludge and the particulate phase. BDE28, BDE47, and BDE99 were the dominant PBDE congeners in the
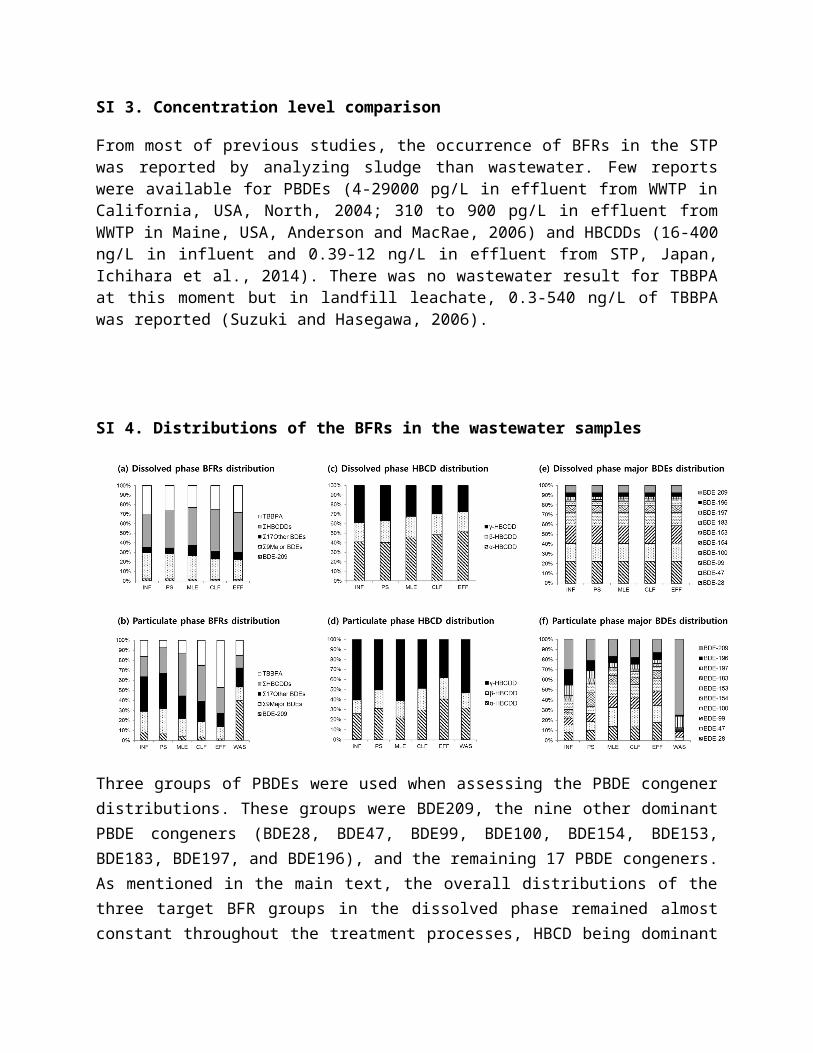
dissolved phase, each contributing almost 20% of the total PBDE concentrations in the dissolved phase. BDE100 and BDE154 made the next highest contributions to the total PBDE concentrations in the dissolved phase. These results agreed with the results of previous studies in which BDE47 was found to be the dominant PBDE in most biological samples from the aquatic environment (contributing almost 60% of the total PBDE concentrations in cetacean, oyster, and mussel tissue samples (Kajiwara et al., 2006; Ueno et al., 2010)) and BDE47 and BDE99 contributed, on average, 40% and 20%, respectively, of the total PBDE concentrations in estuarine water samples (Oros et al., 2005). The PBDE distributions in the dissolved phase remained more or less constant throughout the treatment process, but the less-brominated PBDEs were relatively enriched in the particulate phase at the end of the process. α-HBCD was the dominant HBCD diastereomer, and its contribution to the total HBCD concentration in the dissolved phase gradually increased through the treatment stages, and the γ-HBCD contribution correspondingly decreased. γ-HBCD was the dominant HBCD diastereomer in the particulate phase, contributing a maximum of 60% of the total HBCD concentrations in the influent and after the MLE stage. β-HBCD contributed <20% of the total HBCD concentrations in the dissolved and particulate phases, and this contribution remained constant for both phases throughout the treatment process.
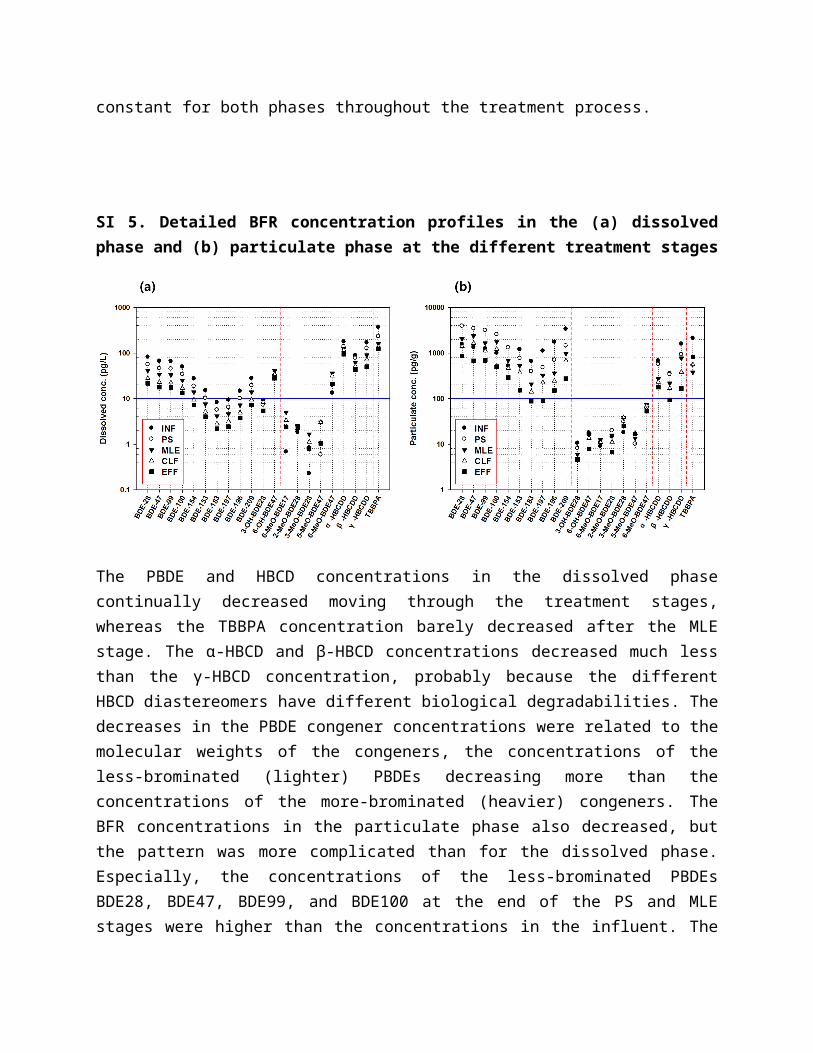
SI 5. Detailed BFR concentration profiles in the (a) dissolved phase and (b) particulate phase at the different treatment stages
The PBDE and HBCD concentrations in the dissolved phase continually decreased moving through the treatment stages, whereas the TBBPA concentration barely decreased after the MLE stage. The α-HBCD and β-HBCD concentrations decreased much less than the γ-HBCD
concentration, probably because the different HBCD diastereomers have different biological degradabilities. The decreases in the PBDE congener concentrations were related to the molecular weights of the congeners, the concentrations of the less-brominated (lighter) PBDEs decreasing more than the concentrations of the more-brominated (heavier) congeners. The BFR concentrations in the particulate phase also decreased, but the pattern was more complicated than for the dissolved phase. Especially, the concentrations of the less-brominated PBDEs BDE28, BDE47, BDE99, and BDE100 at the end of the PS and MLE stages were higher than the concentrations in the influent. The more-brominated PBDE concentrations continually decreased through the treatment stages, and large proportions of the concentrations in the influent had been removed after the PS and MLE stages. More-brominated PBDE congeners can be degraded to give less-brominated PBDE congeners, so the increases in the concentrations of the less-brominated PBDE congeners in the particulate phase were possibly related to the debromination of more-brominated PBDE congeners during the treatments.
SI 6. Stepwise removal ratios (Δ) for the OH-BDEs and MeO-BDEs for each wastewater treatment stage
The fates of the OH-BDEs and MeO-BDEs during the treatment stages were investigated by calculating the stepwise removal ratios (Δ) from the mean concentrations found in the samples collected in the four sampling events, and the results are shown in the figure below. The OH-BDE and MeO-BDE concentrations were higher after than before the biological reaction (MLE) and UV irradiation (CLF) processes, so it appeared that the OH-BDEs and MeO-BDEs were predominantly formed during these processes. The parent PBDE concentrations continually decreased through the wastewater treatment process (see section SI 4), but the OH-BDE and MeO-BDE concentrations tended to fluctuate and finally increase a little. The concentration profiles of the OH-BDEs and MeO-BDEs during the wastewater treatment process were clearly different from the concentration profiles of the parent compounds, indicating that the PBDEs and the OH-BDEs and MeO-BDEs behaved differently during the treatment processes.
SI 7. Hazard quotient estimation
The hazard quotient (HQ) could be estimated by leaning on the ratio between measured environmental concentrations (MECs) from above calculation and predicted no effect concentrations (PNECs) from the literatures. The estimated HQ for releasing effluent was observed 0.008 for PBDEs, 0.429 for TBBPA and 0.023 for HBCDDs. There were magnitude order differences between calculated HQ of PBDEs and other BFRs that seemed to be related with phase out of PBDEs since 2009. For dissolved concentration of BFRs, the HQ were decreased at least 34 fold than whole concentration as 2.37×10⁻³ for TBBPA, 2.34×10⁻⁴ for PBDEs, 5.81×10⁻⁴ for HBCDDs. That is inferring the necessity of investigating phase partitioning characteristics would be critical for hydrophobic chemicals in wastewater, especially when it can be differentiated along the treatment procedure.
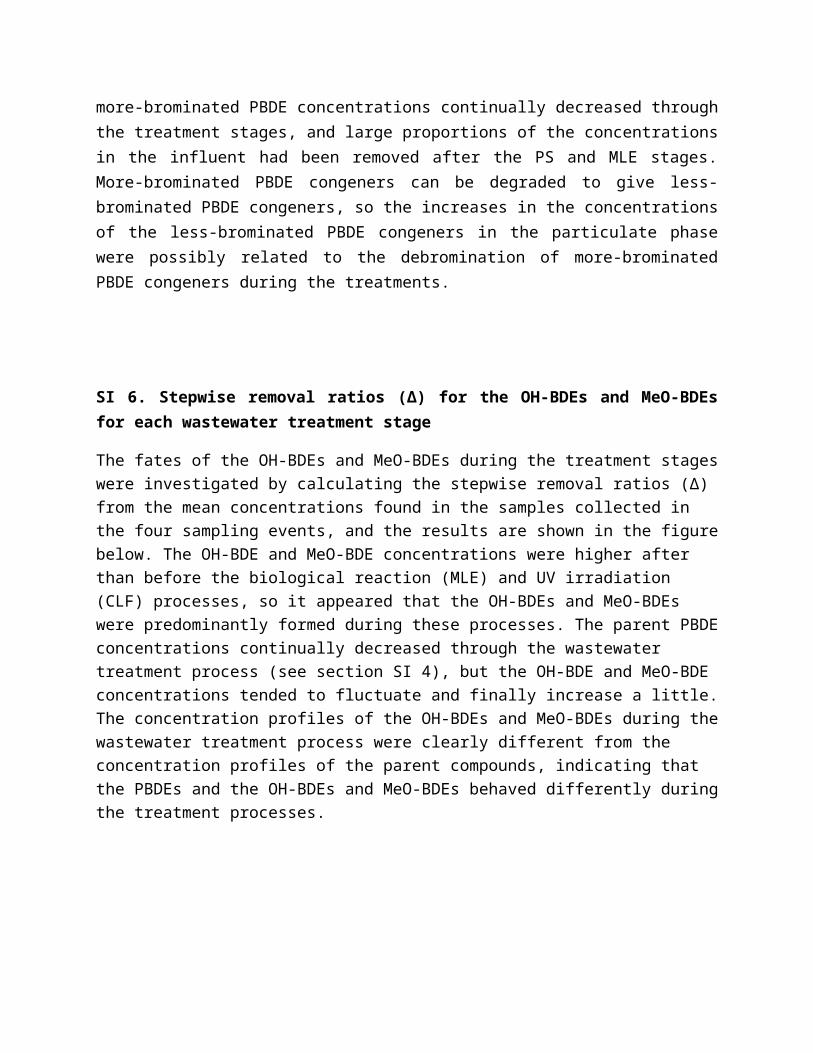
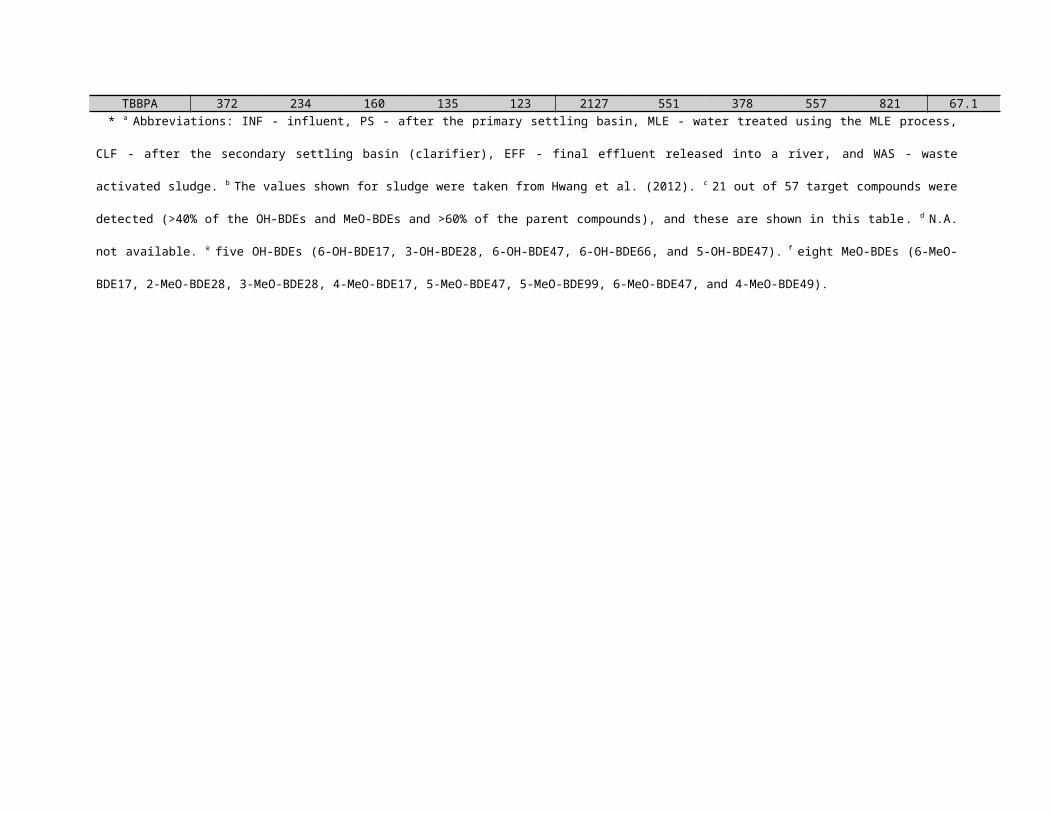
Table S1. Mean BFR concentrations in wastewater collected at the five different treatment stages and in sludge for all the sampling
campaigns
Target compoundc
Concentration in the dissolved phase (pg/L) a Concentration in the particulate phase (pg/g-dry) a
Concentration in the sludge b
(ng/g-dry)INF PS MLE CLF EFF INF PS MLE CLF EFF WAS d
BDE28 82.1 56.3 41.2 27.9 21.7 312 232 89.6 55.8 41.3 0.25BDE47 67.3 46.1 33.8 22.9 17.8 269 203 118 74.9 39.8 7.08BDE99 66.0 45.2 33.1 22.4 17.4 251 186 72.0 44.8 33.1 14.0BDE100 50.0 34.3 25.1 17.0 13.2 200 151 87.9 55.6 29.5 2.35BDE154 27.5 18.8 13.8 9.33 7.25 131 329 43.1 29.2 18.1 1.68BDE153 15.1 10.3 7.57 5.13 3.99 302 193 33.1 23.1 9.48 2.03BDE183 8.29 5.68 4.16 2.82 2.19 221 133 16.0 10.8 6.74 2.62BDE197 9.36 6.47 4.61 3.13 2.41 374 162 29.3 20.5 8.33 26.2BDE196 14.6 10.1 7.21 4.89 3.76 584 236 40.1 27.2 16.7 3.12BDE209 28.1 19.4 13.9 9.41 7.24 1124 485 108 75.3 30.6 175
Σ27PBDEs 409 285 243 160 124 7159 4388 1211 793 444 3183-OH-BDE28 5.30 7.30 9.20 8.30 5.40 10.6 8.21 6.00 <LOQ 4.63 N.A.6-OH-BDE47 26.8 32.0 40.6 34.0 27.8 17.9 16.0 15.9 13.6 7.94 N.A.
6-MeO-BDE17 0.68 2.49 4.99 3.34 2.38 9.09 11.0 12.5 10.9 <LOQ N.A.2-MeO-BDE28 1.84 2.49 2.50 2.23 2.38 14.6 19.9 15.6 11.1 6.81 N.A.3-MeO-BDE28 0.23 0.83 1.66 1.11 0.79 18.2 31.1 38.4 38.6 25.2 N.A.5-MeO-BDE47 1.05 0.59 3.05 3.02 1.04 16.6 10.2 13.6 17.3 16.6 N.A.6-MeO-BDE47 13.3 19.8 36.2 31.5 20.8 61.4 63.5 73.1 70.0 53.5 N.A.Σ5OH-BDEs e 37.6 44.8 57.3 47.8 38.7 37.6 37.6 33.7 22.9 18.9 N.A.
Σ8MeO-BDEs f 18.4 27.4 49.9 43.4 28.6 123 149 205 189 138 N.A.α-HBCD 178 139 125 116 93.2 680 573 272 233 178 17.0β-HBCD 88.9 77.5 62.1 51.5 37.5 355 342 217 169 94.5 8.19γ-HBCD 169 128 89.8 71.9 50.0 1590 932 770 383 167 28.8ΣHBCDs 437 344 277 240 180 2625 1846 1260 785 439 54.0TBBPA 372 234 160 135 123 2127 551 378 557 821 67.1
* a Abbreviations: INF - influent, PS - after the primary settling basin, MLE - water treated using the MLE process, CLF - after the secondary settling basin (clarifier), EFF -
final effluent released into a river, and WAS - waste activated sludge. b The values shown for sludge were taken from Hwang et al. (2012). c 21 out of 57 target compounds were
detected (>40% of the OH-BDEs and MeO-BDEs and >60% of the parent compounds), and these are shown in this table . d N.A. not available. e five OH-BDEs (6-OH-BDE17, 3-
OH-BDE28, 6-OH-BDE47, 6-OH-BDE66, and 5-OH-BDE47). f eight MeO-BDEs (6-MeO-BDE17, 2-MeO-BDE28, 3-MeO-BDE28, 4-MeO-BDE17, 5-MeO-BDE47, 5-MeO-
BDE99, 6-MeO-BDE47, and 4-MeO-BDE49).
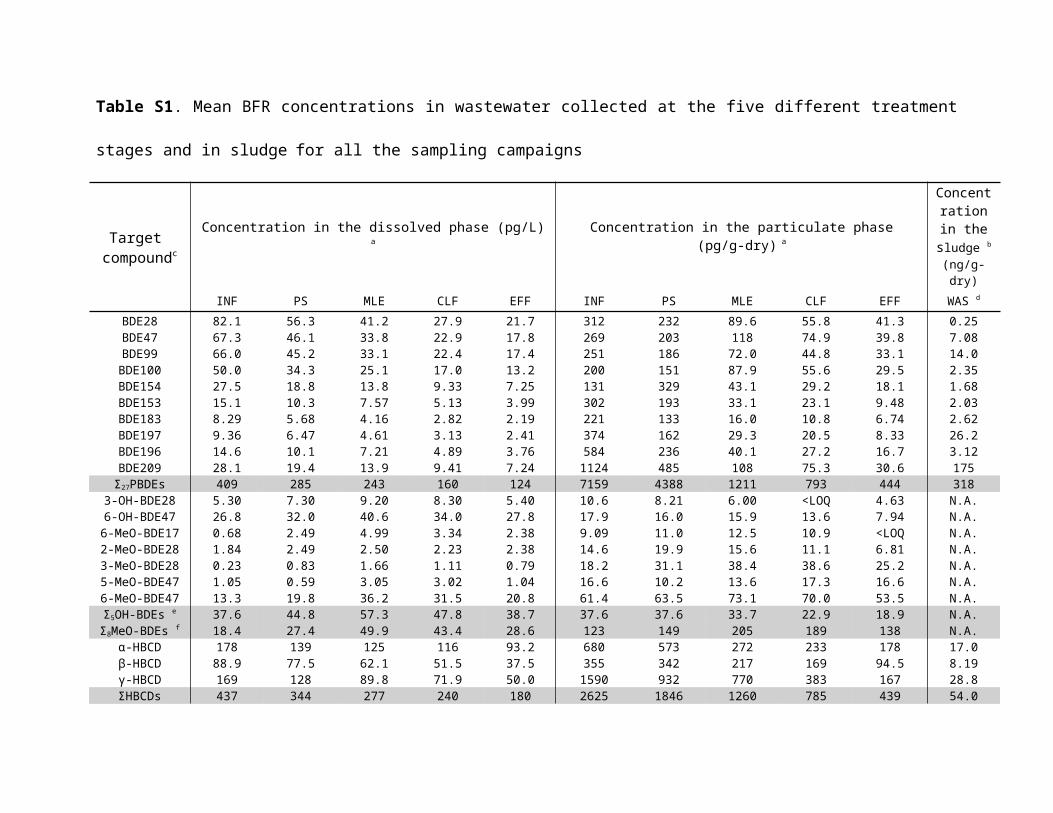
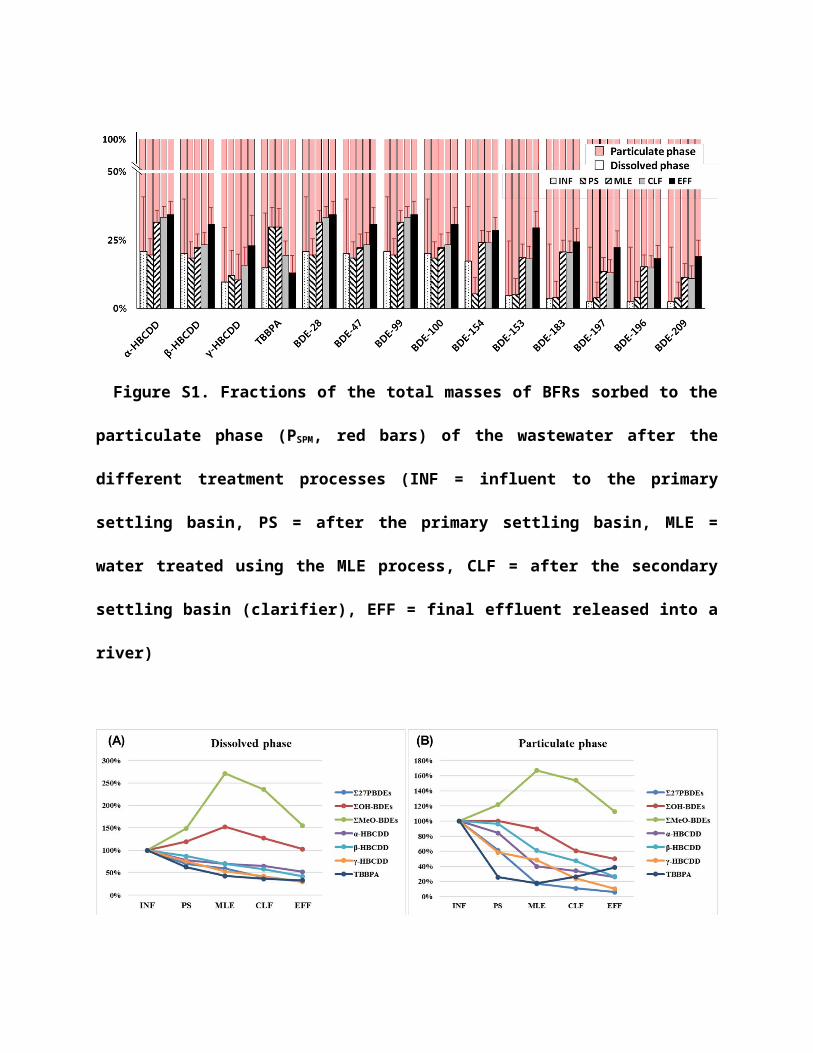
Figure S1. Fractions of the total masses of BFRs sorbed to the particulate phase (PSPM,
red bars) of the wastewater after the different treatment processes (INF = influent to the
primary settling basin, PS = after the primary settling basin, MLE = water treated using
the MLE process, CLF = after the secondary settling basin (clarifier), EFF = final effluent
released into a river)
Figure S2. Mean BFR concentrations in the samples collected at the five sampling points
relative to the initial BFR concentrations in the influent for (A) the dissolved phase and (B)
the particulate phase (INF = influent to the primary settling basin, PS = after the primary
settling basin, MLE = water treated using the MLE process, CLF = after the secondary
settling basin (clarifier), EFF = final effluent released into a river)
Figure S3. OH-BDE and MeO-BDE to parent PBDE concentration ratios (separated by
the substituent position) for the (A) dissolved phase and (B) the particulate phase, used to
indicate the degrees to which PBDEs were transformed during the treatment process
As can be seen from Figure S3, the concentration ratios were higher for the ortho-substituted compounds than for the meta- and para-substituted compounds in the dissolved phase. This is consistent with the natural formation of ortho-substituted OH-BDEs and MeO-BDEs in aquatic environments (Wan et al., 2009; Wiseman et al., 2011). The meta- and para-substituted compounds had similar or higher concentration ratios to the ortho-substituted compounds in the particulate phase, leading us to conclude that OH-BDEs and MeO-BDEs may have formed during the wastewater treatment processes.
References cited in the supporting information
Kajiwara, N., Kamikawa, S., Ramu, K., Ueno, D., Yamada, T. K., Subramanian, A., ... & Tanabe, S. (2006). Geographical distribution of polybrominated diphenyl ethers (PBDEs) and organochlorines in small cetaceans from Asian waters. Chemosphere, 64(2), 287-295
Oros, D.R., Hoover, D., Rodigari, F., Crane, D., Sericano, J. (2005). Levels and distribution of polybrominated diphenyl ethers in water, surface sediments, and bivalves from the San Francisco
Estuary. Environmental science & technology, 39(1), 33-41.
Ueno, D., Isobe, T., Ramu, K., Tanabe, S., Alaee, M., Marvin, C., ... & Nakata, H. (2010). Spatial distribution of hexabromocyclododecanes (HBCDs), polybrominated diphenyl ethers (PBDEs) and organochlorines in bivalves from Japanese coastal waters. Chemosphere, 78(10), 1213-1219