Embed Size (px)
Citation preview
Creep Crack Growth Prediction Using a Damage Based Approach†
M. Yatomi, K. M. Nikbin, N. P. O’Dowd
Department of Mechanical Engineering Imperial College London
South Kensington Campus, London, SW7 2AZ, UK
Abstract
This paper presents a numerical study of creep crack growth in a fracture mechanics specimen. The material properties used are representative of a carbon-manganese steel at 360oC and the constitutive behaviour of the steel is described by a power law creep model. A damage-based approach is used to predict the crack propagation rate in a compact tension specimen and the data are correlated against an independently determined C* parameter. Elastic-creep and elastic-plastic-creep analyses are performed using two different crack growth criteria to predict crack extension under plane stress and plane strain conditions. The plane strain crack growth rate predicted from the numerical analysis is found to be less conservative than the plane strain upper bound of an existing ductility exhaustion model, for values of C* within the limits of the present creep crack growth testing standards. At low values of C* the predicted plane stress and plane strain crack growth rates differ by a factor between 5 and 30 depending on the creep ductility of the material. However, at higher loads and C* values, the plane strain crack growth rates, predicted using an elastic-plastic-creep material response, approach those for plane stress. These results are consistent with experimental data for the material and suggest that purely elastic-creep modelling is unrealistic for the carbon-manganese steel as plastic strains are significant at relevant loading levels.
Keywords: Creep, crack growth, finite element analysis, multiaxiality, damage, constraint
1 Introduction
Many components used in power generation plants are continually exposed to high
temperatures and failure processes such as net section rupture, creep crack growth or
fatigue crack growth can occur within the high temperature regime. Safe and accurate
methods to predict creep crack growth (CCG) are therefore required in order to assess the
reliability of such components. With advances in finite element (FE) methods, more
complex models can be applied in the study of CCG where simple analytical solutions or
approximate methods are no longer applicable. In this work the role of fracture mechanics
parameters in estimating creep crack growth rates is examined using FE analysis and the
results are validated with experimental data.
† To appear in the International Journal of Pressure Vessels and Piping, 2003
Hayhurst et al. [1] were among the first to carry out finite element calculations using a
Kachanov-type [2] damage variable to account for the evolution of creep damage within
the material. While these studies focused on uncracked structures (notched bars), the
approach has also been used to estimate creep damage and rupture life in cracked
components, e.g. [3]–[9]. In many of these studies, e.g. [1], [3], [8], special procedures
have been used to remove elements within the FE mesh which have reached a critical
level of damage. The loss of load bearing capacity due to creep damage within the
element is thus accounted for. However, it is well known that the use of a coupled damage
approach in conjunction with element removal can lead to a mesh sensitive result, e.g.
[10], [11]. Furthermore, the removal of elements may not accurately model the situation
where a sharp crack is growing within a creeping material. In this work therefore an
alternative approach is adopted whereby nodes ahead of the crack tip are released when
the damage reaches a critical value. A similar node-release approach to model crack
growth under creep conditions has been employed in recent work, [12] and [13].
However, in [12], [13] the crack growth rate has been assumed a priori, based on
experimental data, and has not been determined within the analysis. Therefore the
approach cannot be used for the prediction of creep crack growth and rupture life.
In the present study a damage variable, based on the equivalent (von Mises) creep strain
rate and the Cocks and Ashby void growth model [14], is used to predict creep crack
growth in a compact tension (CT) fracture specimen within an FE framework. The creep
parameter, C*, which is independently determined from the numerically calculated load-
line displacement rate, is used to correlate the predicted crack growth data. In addition, a
sensitivity analysis of the CCG predictions is presented, to identify the effects of mesh
size and relevant elastic-plastic and creep material properties. Both plane stress and plane
strain conditions are examined.
2 Material data
2.1 Uniaxial creep properties
The material properties for the carbon manganese (C-Mn) steel at 360°C were obtained
from uniaxial tensile tests and creep tests [15]. The details of the material composition
and the relevant mechanical properties are given in Table 1 and Table 2 respectively. The
material batch chosen in this study has been designated as a high nitrogen content C-Mn
steel. This alloy has been previously shown to be more brittle under creep conditions than
a corresponding low nitrogen C-Mn steel [15].
2
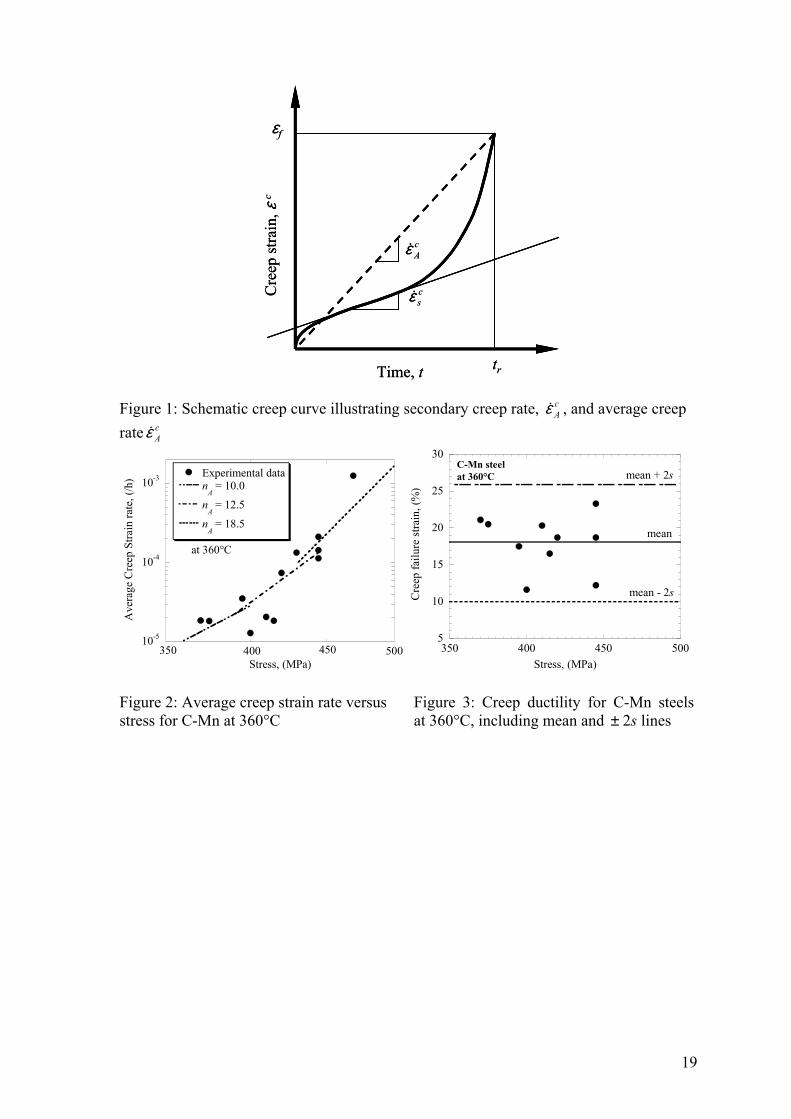
A representative creep curve (creep strain vs. time) is shown in Figure 1. In general,
creep deformation can be considered to be composed of three regimes, namely primary,
secondary and tertiary creep regimes. The use of an average creep rate obtained directly
from creep rupture data has been proposed [16] to account for all three stages of creep.
This average creep rate, Aε& , is described schematically in Figure 1 and is defined by
A
A
nA
n
or
fA A
tσ
σσε
εε =
==
0
&& , (1)
where εf is the uniaxial failure strain, tr is the time to rupture and σ is the applied stress.
The variables , σo, AA and nA in equation (1) are generally taken as material constants,
though as illustrated below they may depend on stress.
oε&
Figure 2 and Figure 3 show the dependence of Aε& and εf respectively on stress for the
C-Mn steel determined from constant load creep tests on round bars [15]. It may be seen
in Figure 2 that the creep exponent, nA, defined by equation (1), is not constant at a given
temperature but increases with stress. The values of AA and nA used in the analysis are
shown in Table 2, which are the ones most relevant to the test conditions being examined
(relatively low stress and strain rate). Figure 3 shows the dependence of uniaxial creep
failure strain, εf, on stress for the steel at 360°C. It is seen that within the scatter of the
data εf is independent of stress. Due to the observed scatter the numerical analysis was
performed using the mean value of the creep failure strain and the upper and lower bound
values (mean ± 2s (where s is the standard deviation)) estimated as 18%, 26% and 10%
respectively. In addition, for the purposes of a sensitivity analysis, analyses with failure
strain equal to 50% were also carried out.
2.2 High Temperature Fracture Mechanics
The theory behind the correlation of high temperature crack growth data essentially
follows that of elastic-plastic fracture mechanics theory. Various aspects of the
characterisation of creep crack growth have been reviewed in [17] and [18].
For situations where elasticity dominates (short times and/or high loads) the linear elastic
stress intensity factor, K, may be used to predict crack growth. Under steady state
conditions, however, the crack tip stress and strain rate fields are characterised by the
parameter C* and linear elasticity may no longer be applicable. For a power law creeping
material, the stress and strain rate in the vicinity of the crack tip are given by (see e.g.
[17]),
3
),,(~)1(1
nrI
Cij
n
n000ij θσ
σεσσ
+∗
=
&
),,(~)1(
nrI
Cij
nn
n000ij θε
σεεε
+∗
=
&&&
(2)
where r and θ measure distance and polar angle relative to the crack tip, In is a parameter
which depends only on the creep exponent, n, and ij~σ and ij
~ε are dimensionless functions.
The parameter C* in equation (2) may be obtained from a path independent integral and is
analogous to the J integral for rate independent material behaviour [19]. C* may also be
interpreted as an energy release rate analogous to the energy definition of J, i.e.,
dadU
BC
∗∗ −= 1 , (3)
where a is the crack length, B is the thickness and U* is the potential energy rate. The C*
integral has been widely used as a parameter for correlating CCG under steady state creep
conditions [20].
Based on the form of the crack tip fields in equation (3) and using a ductility exhaustion
argument it was shown in [21], [22], that the creep crack growth rate, a , may be written
as,
&
( ) )1/(1)1/(
00
*
*01 +
+
+= n
c
nn
nf
rI
Cna
εσεε
&
&& , (4)
where rc is the size of the creep process zone and is the appropriate crack tip ductility,
(taken as the uniaxial failure strain, εf, for plane stress and εf /30 for plane strain [23]).
This model, known as the NSW model, was shown to provide good agreement with
measured CCG rates for a range of materials. The cracking rate a in equation (4) can be
written in simplified form as
*fε
&
φ*DCa =& , (5)
where D and φ are material constants, with φ = n/(n+1) from the NSW model and the
value of D depends on the uniaxial creep properties and the appropriate failure strain . *fε
2.3 Creep Crack Growth Testing and Analysis
In laboratory tests, rather than use the line integral definition or equation (3) directly, C*
may be determined from the creep load-line displacement rate. Following ASTM E1457-
01 [20] C* is given by the following equation:
4
FbB∆PCn
c&=* , (6)
where P is the applied load, b is the remaining ligament ahead of the crack and Bn is the
net thickness (= B for a specimen without side grooves). The factor, F, in equation (6)
depends on geometry and creep exponent, n. For a CT specimen F is given by
[ ])/1(522.021
Wan
nF −++
= , (7)
where a is crack length and W the specimen width. In equation (6) ∆ is the load-line
creep displacement rate and is calculated as follows:
c&
peTc ∆∆∆∆ &&&& −−= , (8)
where , and are the total, elastic and plastic displacement rates respectively.
The contribution to the total displacement rate from the elastic displacement rate, ∆ , is
due to the change in crack length and an equation for is provided in ASTM E1457-01
[20]. Creep crack growth testing is normally carried out at loads where plastic
deformation is insignificant [17] and it is assumed that >> . Hence the creep strain
rate can be calculated as [20]
T∆& e∆& p∆&
e&
e∆&
∆& c p∆&
eTc ∆∆∆ &&& −= . (9)
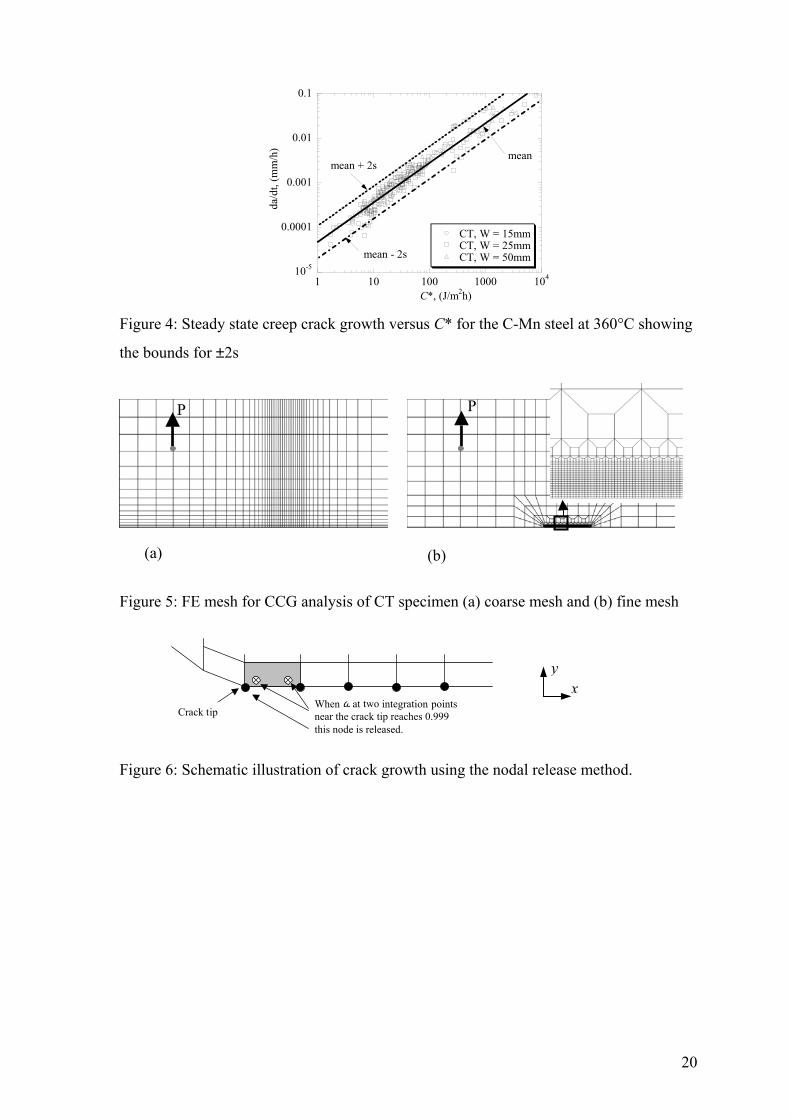
The creep crack growth behaviour of the C-Mn steel at 360oC, obtained from tests on CT
specimens of different sizes and analysed according to ASTM E1457-01 [20], is shown in
Figure 4 (taken from [15]). These data will be used to validate the finite element models
presented in this paper.
The data in Figure 4 show no apparent size effect during steady state creep crack growth
behaviour within the examined sizes (W = 15, 25 and 50 mm) and the cracking rate a can
therefore be characterized by C*. A mean fit to the data is shown in Figure 4 using
equation (5) with D = 4 and φ = 0.89 (C* in J/m2h and da/dt in mm/h). (Note
that this value of φ is consistent with the relationship that φ = n/n+1). Also included in the
figure are the upper and lower bounds of the CCG rate based on the mean ± 2s.
&
51070. −×
3 Finite Element Modelling
3.1 Damage accumulation
In this work a ductility exhaustion approach is used to account for the accumulation of
creep damage. The damage parameter, ω, is defined such that 0 ≤ ω ≤ 1 and failure occurs
5
when ω approaches 1. The rate of damage accumulation, ω& is related to the equivalent
creep strain rate by the relationship,
∗=f
c
εεω&
& (10)
and the total damage at any instant is the integral of the damage rate in equation (10) up to
that time:
∫=t
dt0
ωω & . (11)
Thus, failure occurs in the vicinity of the crack tip when the local accumulated strain
reaches the local (multiaxial) creep ductility. Assuming that the mechanism of creep crack
growth is by void coalescence, then the multiaxial creep ductility, , can be obtained
from a number of available void growth models (e.g. [14], [24] and [25]). It has been
found that the Cocks and Ashby model [14] is the most appropriate for representing the
multiaxial creep ductility of the material under study. The model describes the ratio of the
multiaxial to uniaxial failure strain, as
∗fε
f*f / εε
+−
+−=
e
m
f
*f
nn
nn
σσ
εε
21212sinh
2121
32sinh , (12)
where σm/σe is the ratio between the mean (hydrostatic) stress and equivalent (von Mises)
stress. This ratio is often referred to as the triaxiality. Note that within an FE analysis the
value of changes for a fixed material point since it depends on the triaxiality through
equation (12), which, as will be seen, changes with time as the stress redistributes local to
the crack tip.
∗fε
3.2 Elastic, plastic and creep strains
Calculations have been performed using elastic-creep and elastic-plastic-creep behaviour.
In the latter case the plastic strains are understood to be independent of strain rate giving
the total strain as crplel εεεε ++= , (13)
where, εel, εpl and εcr are elastic, plastic and creep strains respectively. As discussed in
Section 2.1 the creep response is described by a secondary creep law using the average
creep properties. The yield strength of the steel at 360oC is 240 MPa (see Table 2) which
6
is relatively low, so the effect of plasticity may be important for this material. The plastic
response is assumed to be governed by a Mises flow rule with isotropic strain hardening
and was obtained by fitting to uniaxial tensile test data at 360°C. The post-yield strain
hardening response is treated as piece-wise linear up to the UTS (= 570 MPa) beyond
which no strain hardening occurs. For an elastic-creep analysis or during unloading the
plastic strain rate is zero.
3.3 Finite Element Framework
A two dimensional FE model of a CT specimen with W = 25 mm, B = 12.5 mm and
a/W = 0.45 is examined. Two different meshes for the CT specimen are used (see Figure
5) in order to examine the influence of mesh size. For the coarse mesh in Figure 5(a) the
mesh size at the crack tip is 0.25 mm, while for the fine mesh in Figure 5(b) the mesh size
at the crack tip is approximately 0.0154 mm, which is similar to the grain size of the
C-Mn steels examined. All finite element analyses were conducted using ABAQUS 5.8
[26] and a typical coarse mesh contains 602 four noded elements while the fine mesh
contains 7581 four noded elements. Full account is taken in the analysis of large
displacements and rotations, due to, e.g., the blunting of the initially sharp crack tip.
Two methods for modelling crack extension were considered. The first, which will be
identified as the fixed-node model, considers that the crack has propagated when damage,
ω, as derived from equations (10)–(12), reaches 0.999 at two integration points ahead of
the crack tip. There is no change in the boundary conditions and the damage parameter
simply acts as an indicator to locate the position of the crack tip as damage spreads
throughout the specimen. In the second method, identified as the node-release model, the
node at the crack tip is released when ω reaches 0.999 and as a result the crack propagates
through the mesh along the axis of symmetry.
Figure 6 shows a schematic illustration of the node release method. It is assumed that
the crack grows in the plane of the initial crack front, i.e. along the symmetry plane. The
model therefore assumes a sharp fronted flat crack, which idealises the actual condition of
multiple microscopic cracks linking up ahead of the main crack front. A user subroutine
(MPC) which allows the user to alter nodal constraints during the analysis, was used to
release the nodes. Within this subroutine, the y-displacement at a node is held fixed until
the node is to be released and, subsequent to the release, the constraint in the y-direction is
no longer applied. In the crack growth analysis the maximum extent of crack growth is
determined by the mesh design (crack grows through a region of uniform sized elements
7
as shown in the inset to Figure 5(b)). With this mesh design the maximum amount of
crack growth is approximately 3.75 mm (i.e. 0.33a) for both fine and coarse mesh design.
Table 3 provides a complete list of the FE runs carried out using different combinations of
material properties and conditions. The results from these analyses are discussed in
section 4.
4 Finite Element Results
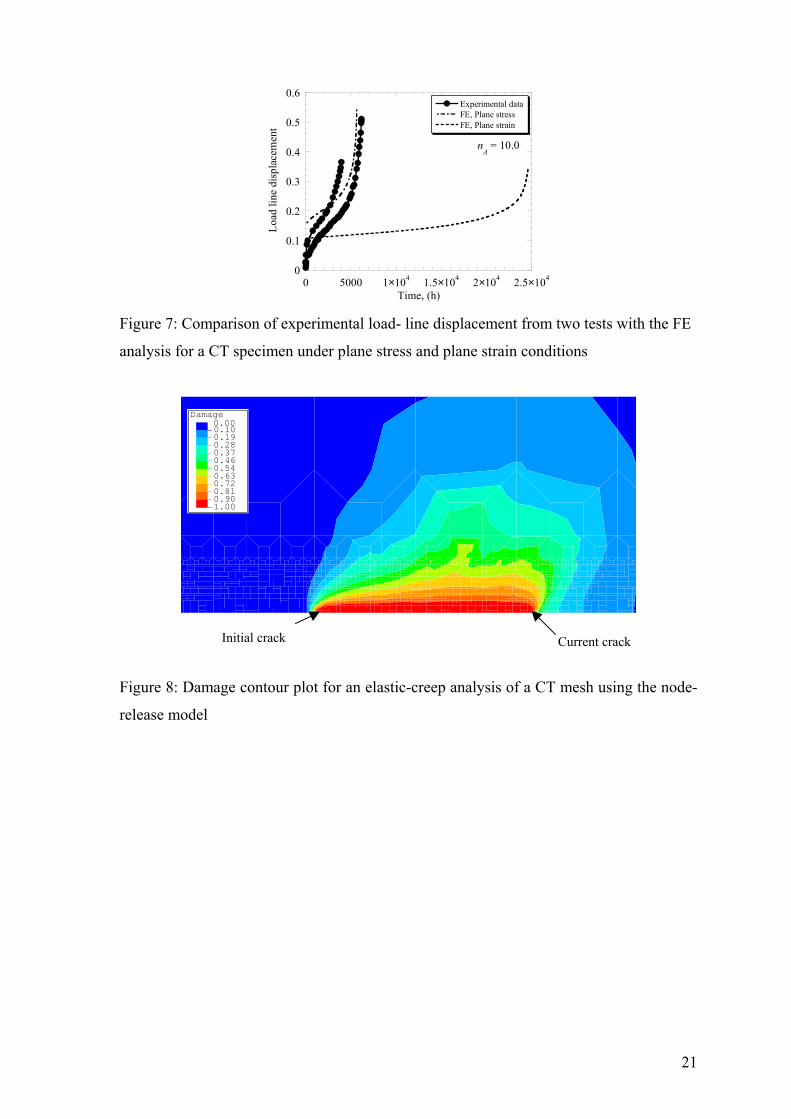
A typical result from a node-release analysis is illustrated in Figure 7, which shows the
total load-line displacement obtained from the FE analysis compared with two
experimental results. Tertiary creep behaviour (rapid increase in displacement towards the
end of the test) is predicted by the finite element analysis, due to the reduction in area
caused by cracked growth. It is seen that the experimental data generally lie between the
plane stress and plane strain predictions. The creep load-line displacement data from the
numerical analysis is subsequently used to calculate the parameter C* using equation (6).
The FE results can then be compared directly with the experimental CCG results shown in
Figure 4.
Figure 8 illustrates damage contours for the node-release method, in a typical plane strain
analyses. The ‘wake’ of creep damage behind the current crack tip may be seen in the
figure. The relatively uniform size and shape of the region suggests that crack growth is
occurring within the steady state regime for this analysis.
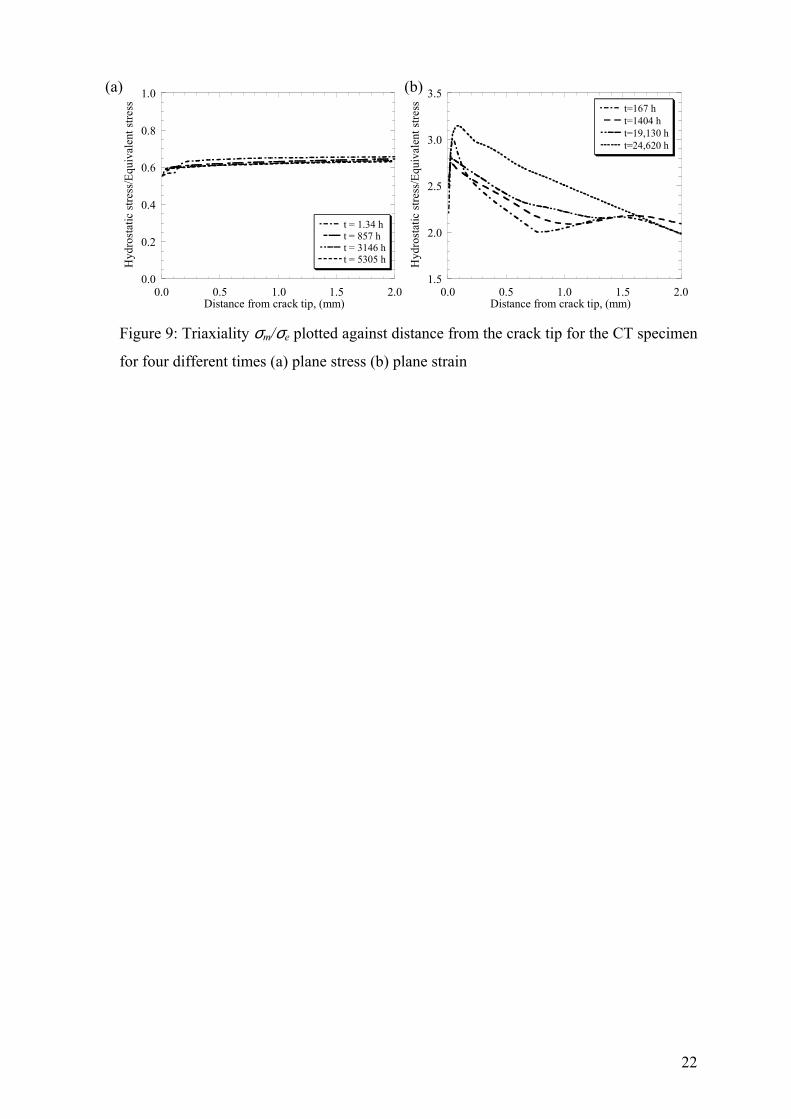
The rate of accumulation of damage depends strongly on the triaxiality, σm/σe, through
equation (12). Under plane stress conditions it has been found from the FE analysis that
σm/σe is relatively insensitive to the distance ahead of the crack tip, while under plane
strain conditions σm/σe varies with distance from the crack tip and also depends on the
extent of crack growth. As an example Figure 9 shows the variation of σm/σe with
distance from the crack tip under plane stress and plane strain conditions using the node-
release method. The average values for σm/σe from these analyses are 0.6 and 2.5 for
plane stress and strain respectively. Similar values for crack tip triaxiality σm/σe were
found in [27] and the values are consistent with the theoretical crack tip distributions of
equation (2) (see e.g. [28]). (Note however that equation (2) predicts that σm/σe is
independent of distance from the crack tip r, implying the zone of dominance of the HRR
solution may be very small for the plane strain case). The implications of this strong
8
difference in crack tip triaxiality between plane stress and plane strain conditions will be
seen in the subsequent sections.
4.1 Comparison between fixed-node and node-release models of CCG
The difference in the predicted increase in crack length (∆a) with time for the two models
of crack extension is examined in this section. The coarse mesh shown in Figure 5(a) was
used and elastic-creep analyses for plane stress and plane strain conditions were
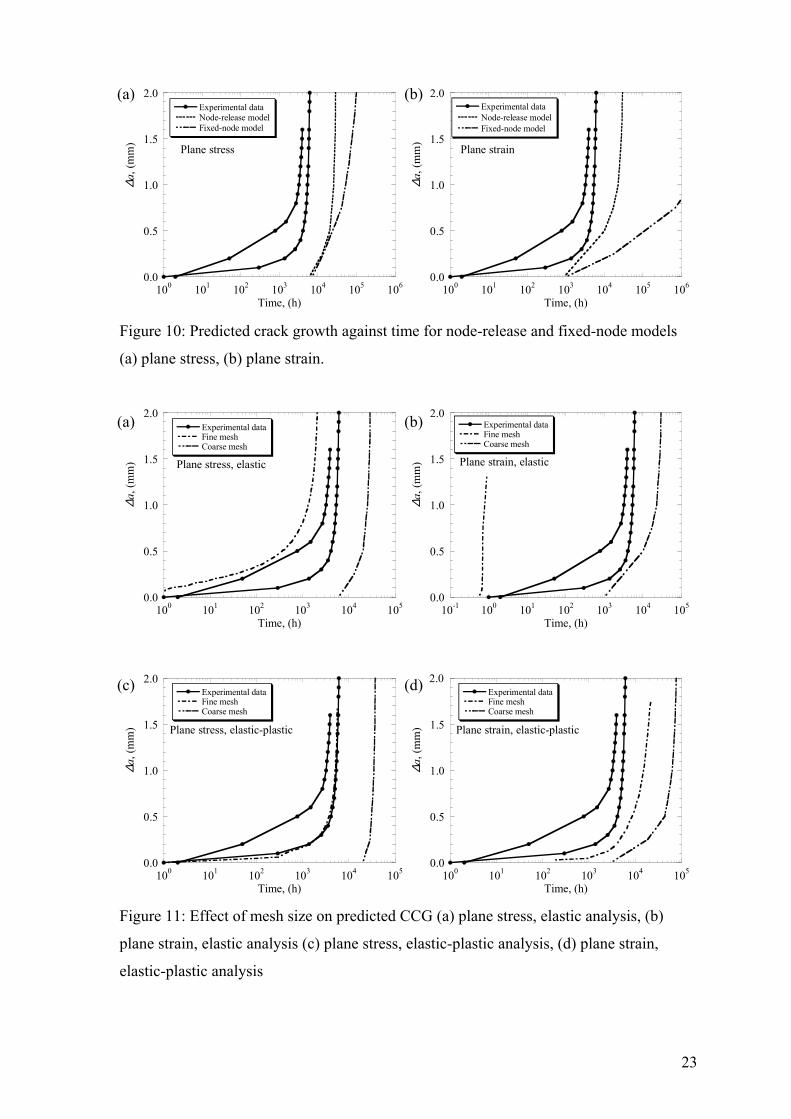
conducted. Figure 10 shows the amount of crack growth predicted by the fixed-node and
the node-release model under plane stress and strain conditions when the applied load is
9 kN. The experimental data are also included on the figure. Since the first data point for
the coarse mesh will be at ∆a = 0.25 mm (the smallest element size) the finite element
results are extrapolated back to the initial crack length (∆a = 0) using the slope of the
predicted curve at ∆a = 0.25 mm. This provides a more realistic representation of the
initiation period before crack growth occurs.
It is seen in Figure 10 that the amount of crack growth predicted by the node-release
model is greater than that from the fixed-node model, particularly under plane strain
conditions, and is also closer to the experimental data (as might be expected). However in
all cases the predicted amount of crack growth is less than that observed in the
experiments, so both models are non-conservative. By comparing Figure 10(a) and (b) it
can be seen that the predicted rate of crack growth under plane strain conditions is
initially higher than that for plane stress conditions (predicted crack growth is negligible
under plane stress conditions for time, t < 6×10³ hours). However the crack growth rate
under plane stress conditions becomes higher for t > 6×10³ hours. A possible explanation
for this behaviour is that the stress and strain distributions for plane strain conditions are
more localised than those for plane stress conditions (see Figure 9). Therefore although
the damage in the element at the crack tip accumulates faster for plane strain conditions
than for plane stress conditions, the damage accumulates more slowly in the second and
third elements from the crack tip, leading to an overall faster rate of crack growth under
plane stress at the same load.
4.2 Effects of mesh size and crack tip plasticity in the node-release model
In the previous section, it was found that the node-release model gives better agreement
with the experimental data than the fixed-node model. In this section, the effect of mesh
size and crack tip plasticity on the predictions from the node-release model are examined.
9
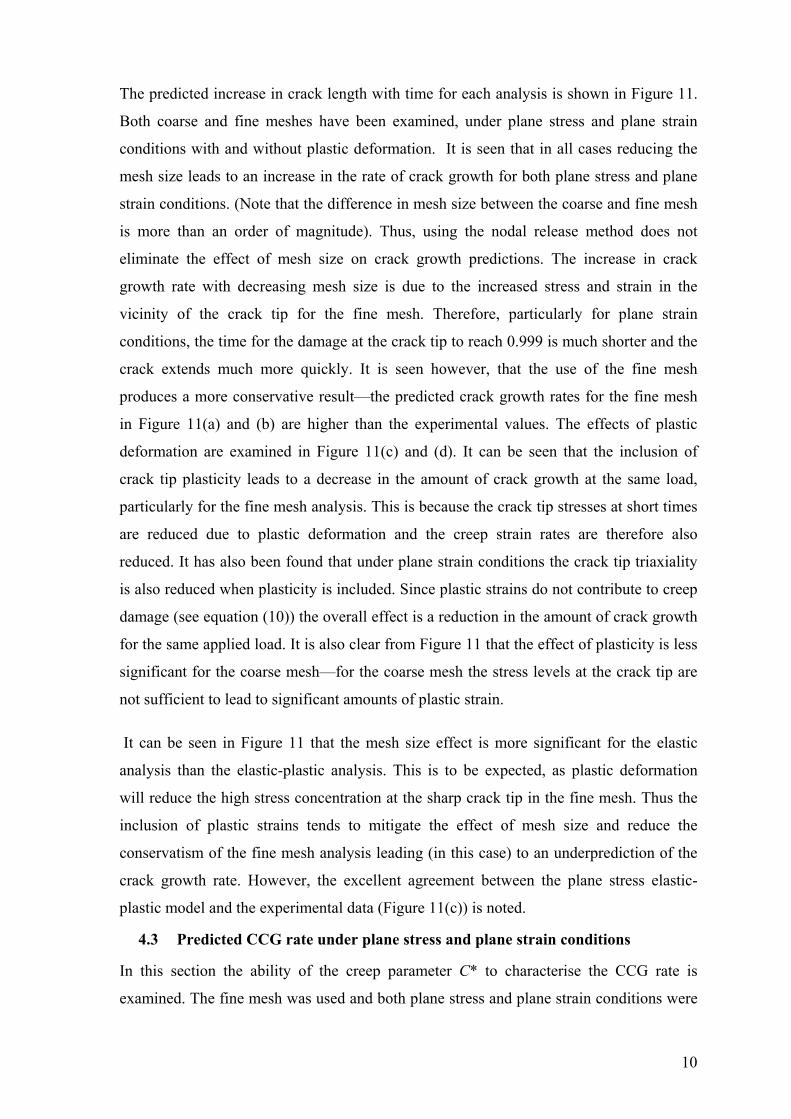
The predicted increase in crack length with time for each analysis is shown in Figure 11.
Both coarse and fine meshes have been examined, under plane stress and plane strain
conditions with and without plastic deformation. It is seen that in all cases reducing the
mesh size leads to an increase in the rate of crack growth for both plane stress and plane
strain conditions. (Note that the difference in mesh size between the coarse and fine mesh
is more than an order of magnitude). Thus, using the nodal release method does not
eliminate the effect of mesh size on crack growth predictions. The increase in crack
growth rate with decreasing mesh size is due to the increased stress and strain in the
vicinity of the crack tip for the fine mesh. Therefore, particularly for plane strain
conditions, the time for the damage at the crack tip to reach 0.999 is much shorter and the
crack extends much more quickly. It is seen however, that the use of the fine mesh
produces a more conservative result—the predicted crack growth rates for the fine mesh
in Figure 11(a) and (b) are higher than the experimental values. The effects of plastic
deformation are examined in Figure 11(c) and (d). It can be seen that the inclusion of
crack tip plasticity leads to a decrease in the amount of crack growth at the same load,
particularly for the fine mesh analysis. This is because the crack tip stresses at short times
are reduced due to plastic deformation and the creep strain rates are therefore also
reduced. It has also been found that under plane strain conditions the crack tip triaxiality
is also reduced when plasticity is included. Since plastic strains do not contribute to creep
damage (see equation (10)) the overall effect is a reduction in the amount of crack growth
for the same applied load. It is also clear from Figure 11 that the effect of plasticity is less
significant for the coarse mesh—for the coarse mesh the stress levels at the crack tip are
not sufficient to lead to significant amounts of plastic strain.
It can be seen in Figure 11 that the mesh size effect is more significant for the elastic
analysis than the elastic-plastic analysis. This is to be expected, as plastic deformation
will reduce the high stress concentration at the sharp crack tip in the fine mesh. Thus the
inclusion of plastic strains tends to mitigate the effect of mesh size and reduce the
conservatism of the fine mesh analysis leading (in this case) to an underprediction of the
crack growth rate. However, the excellent agreement between the plane stress elastic-
plastic model and the experimental data (Figure 11(c)) is noted.
4.3 Predicted CCG rate under plane stress and plane strain conditions
In this section the ability of the creep parameter C* to characterise the CCG rate is
examined. The fine mesh was used and both plane stress and plane strain conditions were
10
examined. The upper-bound value of εf (= 50%) is used, which results in a relatively slow
crack growth rate and ensures that transient effects are relatively small (i.e. crack growth
occurs under predominantly steady state conditions).
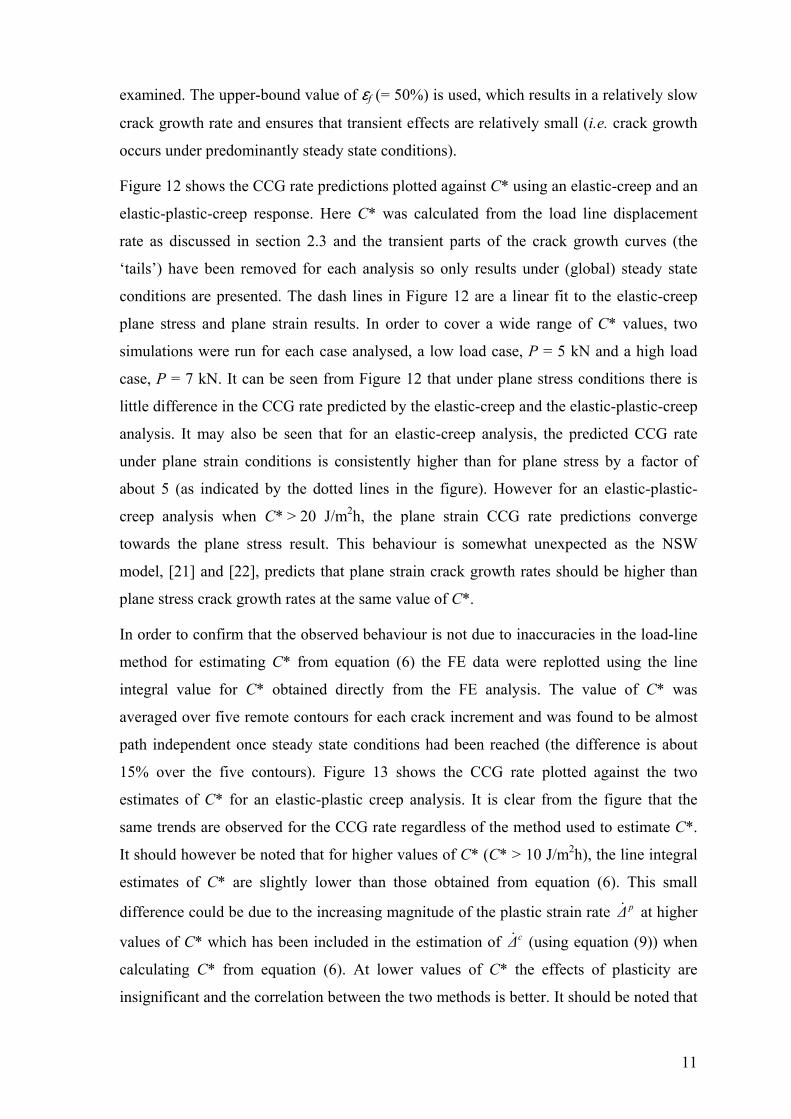
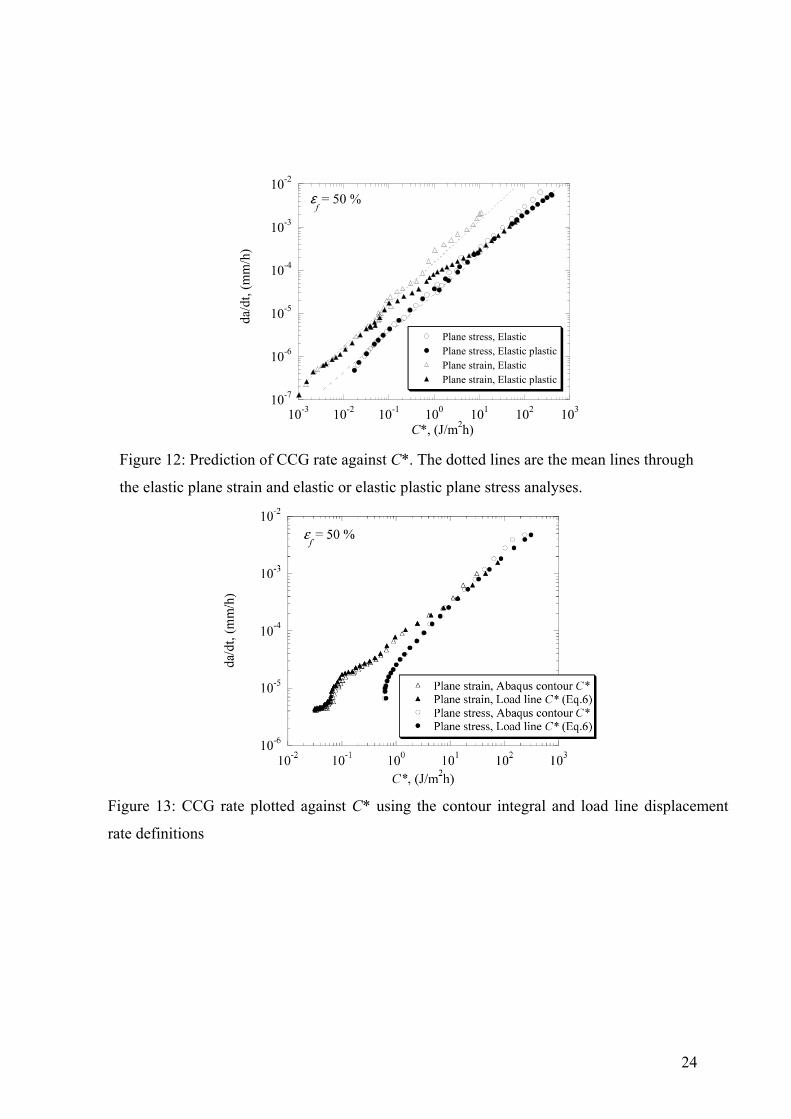
Figure 12 shows the CCG rate predictions plotted against C* using an elastic-creep and an
elastic-plastic-creep response. Here C* was calculated from the load line displacement
rate as discussed in section 2.3 and the transient parts of the crack growth curves (the
‘tails’) have been removed for each analysis so only results under (global) steady state
conditions are presented. The dash lines in Figure 12 are a linear fit to the elastic-creep
plane stress and plane strain results. In order to cover a wide range of C* values, two
simulations were run for each case analysed, a low load case, P = 5 kN and a high load
case, P = 7 kN. It can be seen from Figure 12 that under plane stress conditions there is
little difference in the CCG rate predicted by the elastic-creep and the elastic-plastic-creep
analysis. It may also be seen that for an elastic-creep analysis, the predicted CCG rate
under plane strain conditions is consistently higher than for plane stress by a factor of
about 5 (as indicated by the dotted lines in the figure). However for an elastic-plastic-
creep analysis when C* > 20 J/m2h, the plane strain CCG rate predictions converge
towards the plane stress result. This behaviour is somewhat unexpected as the NSW
model, [21] and [22], predicts that plane strain crack growth rates should be higher than
plane stress crack growth rates at the same value of C*.
In order to confirm that the observed behaviour is not due to inaccuracies in the load-line
method for estimating C* from equation (6) the FE data were replotted using the line
integral value for C* obtained directly from the FE analysis. The value of C* was
averaged over five remote contours for each crack increment and was found to be almost
path independent once steady state conditions had been reached (the difference is about
15% over the five contours). Figure 13 shows the CCG rate plotted against the two
estimates of C* for an elastic-plastic creep analysis. It is clear from the figure that the
same trends are observed for the CCG rate regardless of the method used to estimate C*.
It should however be noted that for higher values of C* (C* > 10 J/m2h), the line integral
estimates of C* are slightly lower than those obtained from equation (6). This small
difference could be due to the increasing magnitude of the plastic strain rate at higher
values of C* which has been included in the estimation of (using equation (9)) when
calculating C* from equation (6). At lower values of C* the effects of plasticity are
insignificant and the correlation between the two methods is better. It should be noted that
p∆&
c∆&
11
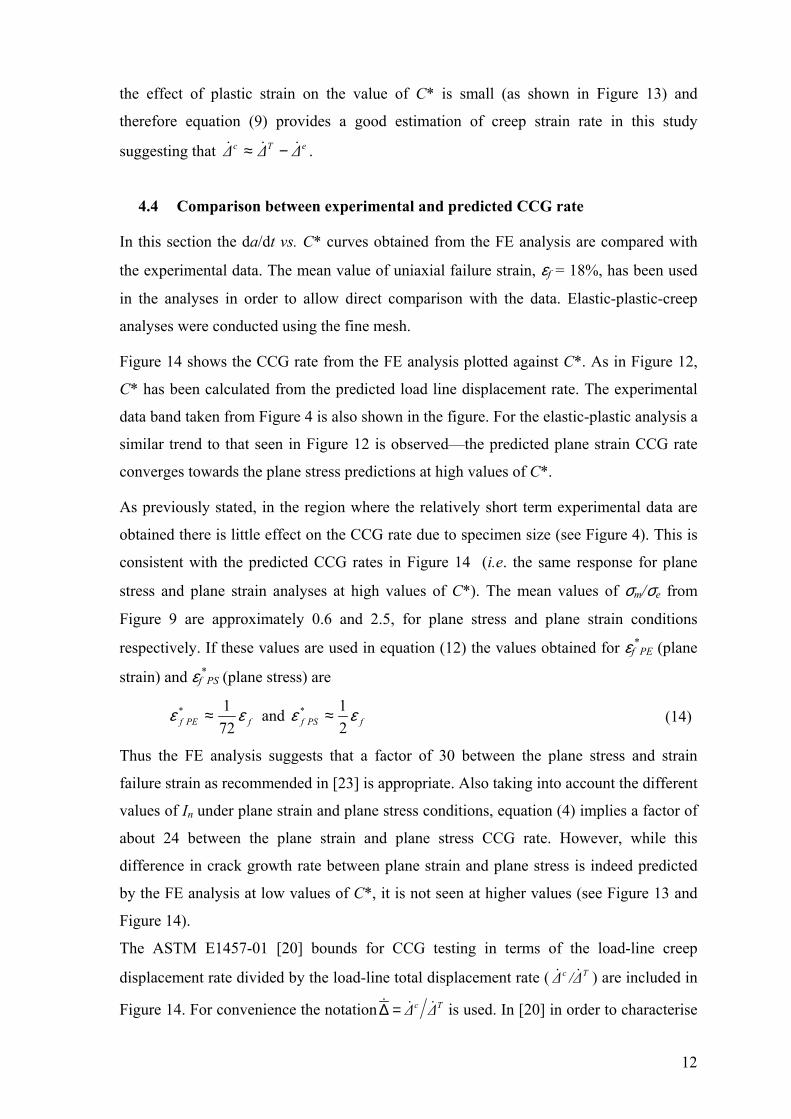
the effect of plastic strain on the value of C* is small (as shown in Figure 13) and
therefore equation (9) provides a good estimation of creep strain rate in this study
suggesting that . eTc ∆∆∆ &&& −≈
fε721
fε *
4.4 Comparison between experimental and predicted CCG rate
In this section the da/dt vs. C* curves obtained from the FE analysis are compared with
the experimental data. The mean value of uniaxial failure strain, εf = 18%, has been used
in the analyses in order to allow direct comparison with the data. Elastic-plastic-creep
analyses were conducted using the fine mesh.
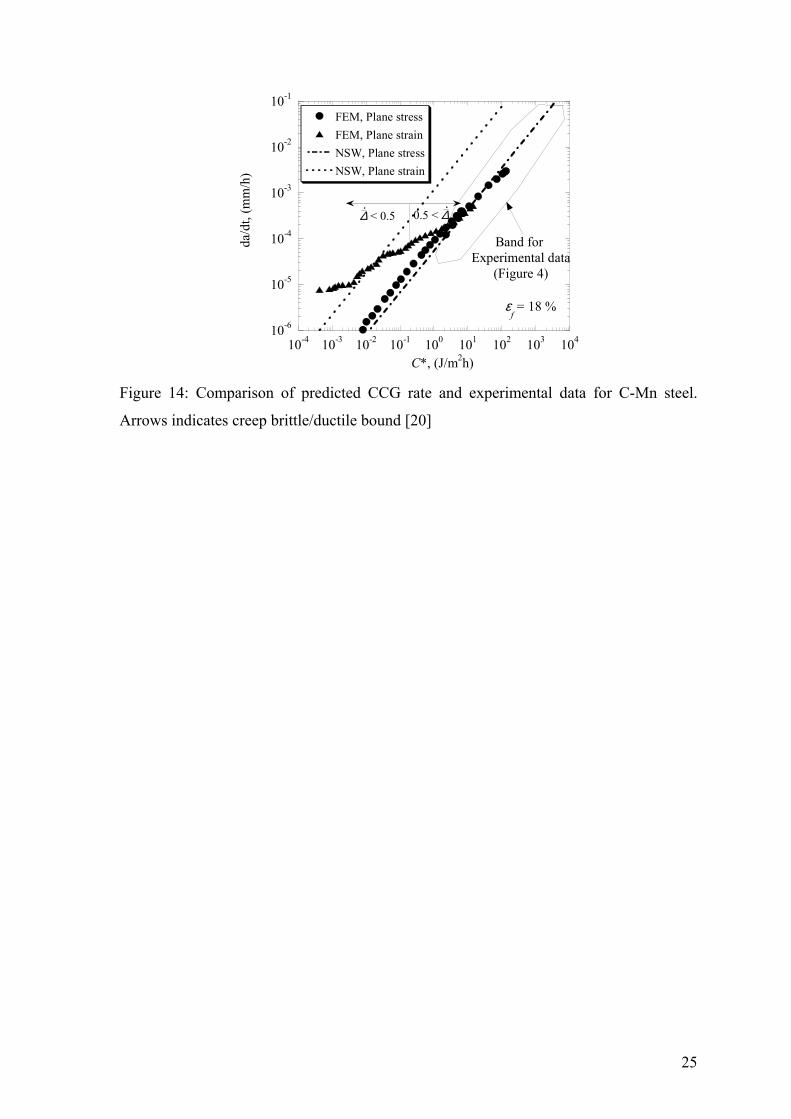
Figure 14 shows the CCG rate from the FE analysis plotted against C*. As in Figure 12,
C* has been calculated from the predicted load line displacement rate. The experimental
data band taken from Figure 4 is also shown in the figure. For the elastic-plastic analysis a
similar trend to that seen in Figure 12 is observed—the predicted plane strain CCG rate
converges towards the plane stress predictions at high values of C*.
As previously stated, in the region where the relatively short term experimental data are
obtained there is little effect on the CCG rate due to specimen size (see Figure 4). This is
consistent with the predicted CCG rates in Figure 14 (i.e. the same response for plane
stress and plane strain analyses at high values of C*). The mean values of σm/σe from
Figure 9 are approximately 0.6 and 2.5, for plane stress and plane strain conditions
respectively. If these values are used in equation (12) the values obtained for εf*
PE (plane
strain) and εf*
PS (plane stress) are
PEfε * ≈ and fPS ε21≈ (14)
Thus the FE analysis suggests that a factor of 30 between the plane stress and strain
failure strain as recommended in [23] is appropriate. Also taking into account the different
values of In under plane strain and plane stress conditions, equation (4) implies a factor of
about 24 between the plane strain and plane stress CCG rate. However, while this
difference in crack growth rate between plane strain and plane stress is indeed predicted
by the FE analysis at low values of C*, it is not seen at higher values (see Figure 13 and
Figure 14).
The ASTM E1457-01 [20] bounds for CCG testing in terms of the load-line creep
displacement rate divided by the load-line total displacement rate ( ) are included in
Figure 14. For convenience the notation
Tc ∆/∆ &&
Tc ∆∆ &&& =∆ is used. In [20] in order to characterise
12
CCG by C*, it is required that ∆& > 0.5. It is also suggested in [20] that for ∆& < 0.25, the
linear elastic stress intensity factor K may be applicable. The NSW predictions, equation
(4), are shown in Figure 14 taking = εf for plane stress and = εf /30 for plane strain
[23]. Comparing the finite element results to the predictions of the NSW model and
disregarding the limits set by ASTM E1457-01 [20], there is a good comparison between
the CCG rate bounds of the FE and the NSW model at low values of C* (where elastic-
creep conditions hold). Furthermore, there is good agreement over the full range of C*
between the NSW plane stress prediction and the plane stress FE result.
*fε *
fε
∆&
∆&
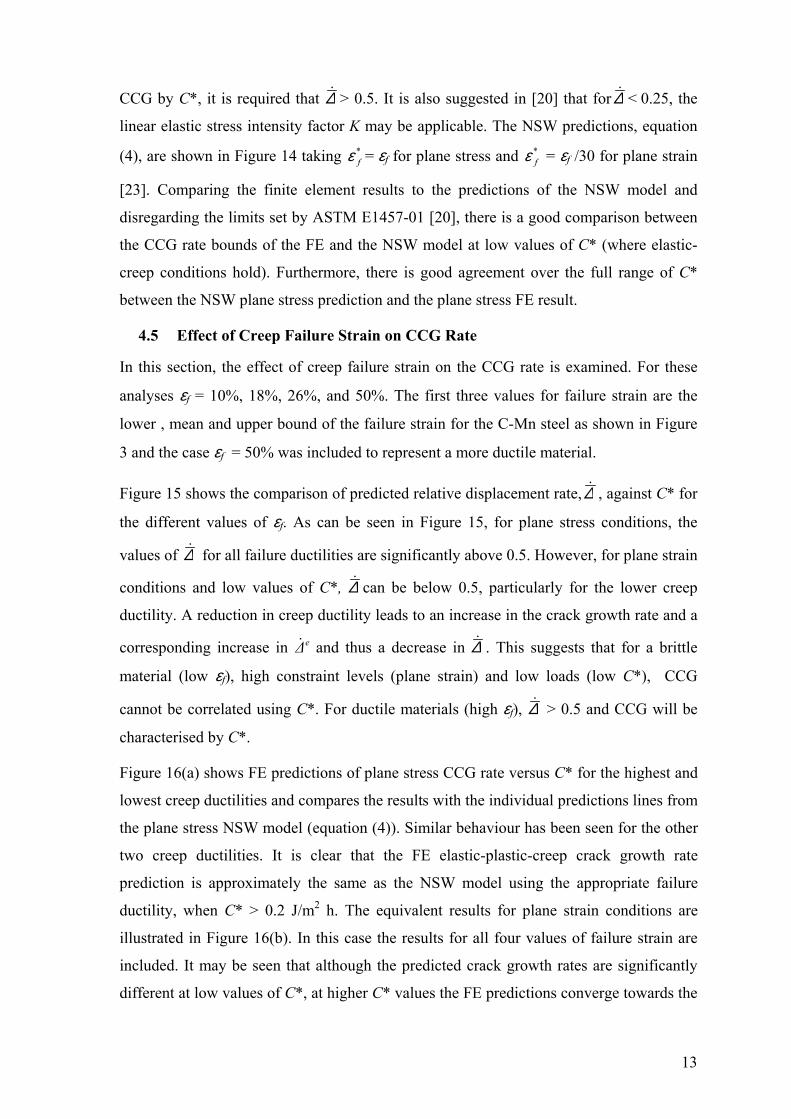
4.5 Effect of Creep Failure Strain on CCG Rate
In this section, the effect of creep failure strain on the CCG rate is examined. For these
analyses εf = 10%, 18%, 26%, and 50%. The first three values for failure strain are the
lower , mean and upper bound of the failure strain for the C-Mn steel as shown in Figure
3 and the case εf = 50% was included to represent a more ductile material.
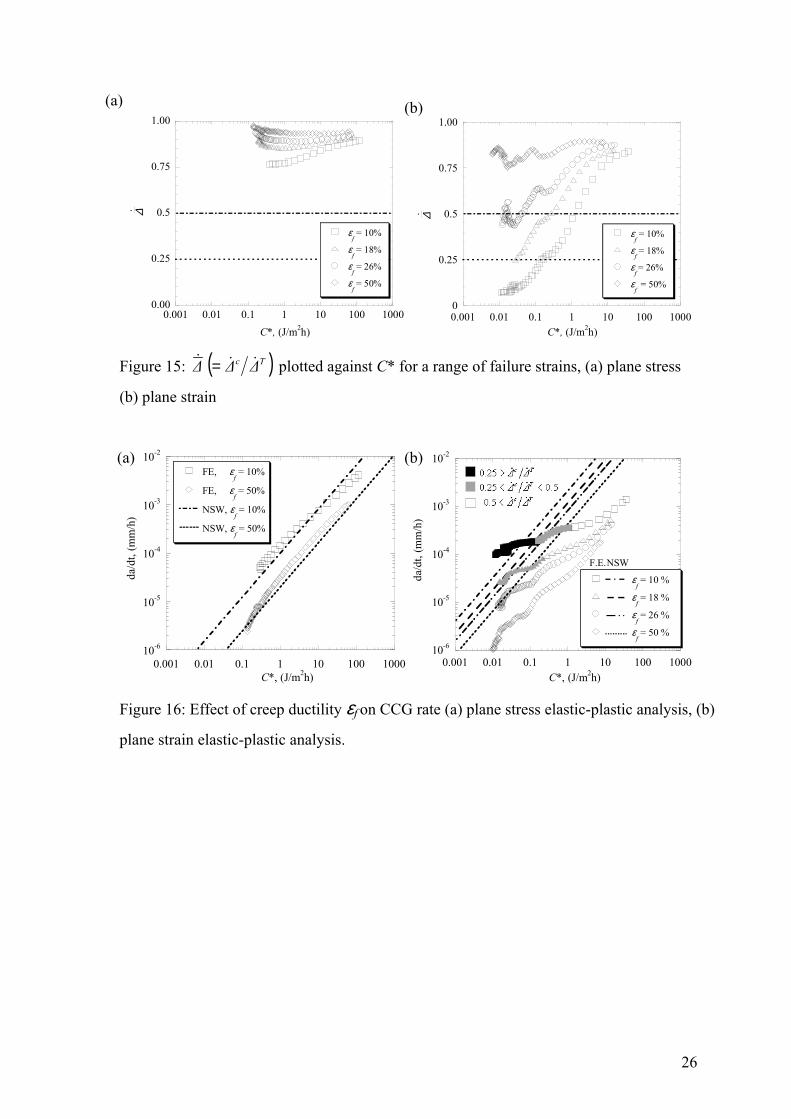
Figure 15 shows the comparison of predicted relative displacement rate, ∆& , against C* for
the different values of εf. As can be seen in Figure 15, for plane stress conditions, the
values of ∆& for all failure ductilities are significantly above 0.5. However, for plane strain
conditions and low values of C*, can be below 0.5, particularly for the lower creep
ductility. A reduction in creep ductility leads to an increase in the crack growth rate and a
corresponding increase in ∆ and thus a decrease in e& ∆& . This suggests that for a brittle
material (low εf), high constraint levels (plane strain) and low loads (low C*), CCG
cannot be correlated using C*. For ductile materials (high εf), > 0.5 and CCG will be
characterised by C*.
Figure 16(a) shows FE predictions of plane stress CCG rate versus C* for the highest and
lowest creep ductilities and compares the results with the individual predictions lines from
the plane stress NSW model (equation (4)). Similar behaviour has been seen for the other
two creep ductilities. It is clear that the FE elastic-plastic-creep crack growth rate
prediction is approximately the same as the NSW model using the appropriate failure
ductility, when C* > 0.2 J/m2 h. The equivalent results for plane strain conditions are
illustrated in Figure 16(b). In this case the results for all four values of failure strain are
included. It may be seen that although the predicted crack growth rates are significantly
different at low values of C*, at higher C* values the FE predictions converge towards the
13
plane stress lines (compare data in Figure 16(a) and (b)) and the difference in crack
growth rate is reduced.
The values of CCG rate are plotted as hollow symbols in Figure 16(b) for ∆& > 0.5, as
grey symbols for ∆& < 0.5 and in black for ∆& < 0.25. It can be seen that in all cases the
upper-bound (plane strain) NSW prediction is conservative when ∆& > 0.5 (i.e. the NSW
model predicts faster CCG rates than the FE analysis) and the model remain conservative
(though less so) provided ∆& > 0.25. This suggests that the CCG rate can also be safely
correlated by C* and the NSW upper bound prediction in the region 0.25 < ∆& < 0.5. This
region generally corresponds to conditions of low stress and could be described as a
transition region between creep ductile and creep brittle conditions. Note that the value of
∆& used here includes the contribution from the plastic displacement rate and therefore the
true value of ∆& is slightly smaller. This further suggests that the present ASTM transition
limit of 0.5 for C* characterisation [20] is somewhat conservative and could safely be
lowered.
5 Discussion and Conclusions
This paper presents methods for predicting creep crack growth in a CT specimen, using a
damage variable to quantify time dependent crack tip degradation. The material examined
is a carbon-manganese steel at a test temperature of 360 ºC. A power law creep model is
used to describe the constitutive behaviour of the steel and both plane stress and plane
strain conditions are examined using the finite element method. The predicted CCG rate is
correlated using the creep parameter C* determined from the load-line displacement rate.
The effect of mesh size, crack tip plasticity and uniaxial failure ductility, εf, on the creep
crack growth rate were examined and found to have a stronger influence under plane
strain conditions than under plane stress conditions.
The results obtained from the analyses suggest that for this material the effect of crack tip
plasticity cannot be ignored over the full loading range. When plastic strains are included,
it is found that at high values of C* the predicted plane strain crack growth rate
approaches that for plane stress whereas at low loads they differ by a factor of ∼ 5–30
depending on the creep ductility. The convergence of the plane stress and plane strain
predictions at high values of C* is believed to be due to the reduction in constraint level in
the plane strain geometry caused by plastic deformation. The trend is consistent with the
14
experimental observation of little effect of specimen size on CCG at high values of C* for
this material. Laboratory CCG testing times are usually between 1,000 and 5,000 h giving
values of C* usually in excess of 1 J/m2h. On the other hand, component used in plant are
exposed to creep conditions at lower stresses for periods of 104–105 h leading to values of
C* << 1 J/m2h for most components. The FE results therefore suggest that the prediction
of component life using the data band from short-term experimental tests may not be
sufficiently conservative.
It is also observed that provided ∆& > 0.25 the predicted finite element CCG rates at low
loads (C* < 1 J/m2h) are consistent with the predictions using the NSW ductility
exhaustion model, over a wide range of failure ductilities, although it is found that the
NSW model is considerably more conservative. This suggests that the limits of ∆& , as
defined by ASTM E1457-01 [20], which disallows the use of C* at ∆& < 0.5 may need to
be re-examined for long term test conditions of more brittle materials. Additional
experimental investigations to derive more accurate creep properties and the use of
detailed creep constitutive equations are needed to validate these findings further.
References
[1] Hayhurst, D.R., Dimmer, P.R. and Morrison, C.J., ‘Development of continuum
damage in the creep rupture of notched bars,’ Phil. Trans. R. Soc. Lond. A 1984;
311,103-129
[2] Kachanov, L.M., 1986, ‘Introduction to Continuum Damage Mechanics’, Kluwer
Academic Publishers, Dordrecht
[3] Hayhurst, D.R., Brown, P.R. and Morrison, C.J., ‘The role of continuum damage in
creep crack growth’, Phil. Trans. R. Soc. Lond. A 1984; 311, 131-158
[4] Hyde, T.H., Xia, L. and Becker, A.A., ‘Prediction of creep failure in aero-engine
materials under multi-axial stress states’, Int. J. Mech. Sci. 1996; 38, 385-403.
[5] Hyde, T.H., Sun, W. and Becker, A.A., ‘Creep crack growth in welds: a damage
mechanics approach to predicting initiation and growth of circumferential cracks’,
Int. J. of Press. Vess. And Pip. 2001; 78, 765-771
[6] Bellenger, E. and Bussy, P., ‘Phenomenological modelling and numerical
simulation of different modes of creep damage evolution’, Int. J. Sol. and Str. 2001;
38, 577-604
15
[7] Hall, F.R. and Hayhurst, D.R., ‘Continuum damage mechanics modelling of high
temperature deformation and failure in a pipe weldment’, Proc. R. Soc. Lond. A
1991; 433, 383-403
[8] Perrin, I.J., and Hayhurst, D.R., ‘Continuum damage mechanics analyses of type IV
creep failure in ferritic steel cross-weld specimens’, Int. J. Pres. Vess. and Piping.
1999; 76, 599-617
[9] Bassani, J.L. and Hawk, D.E., ‘Influence of damage on crack-tip fields under small-
creep conditions’, Int. J. of Fracture. 1990; 42, 155-172
[10] Murakami S., Liu. Y. and Mizuno M.’ Computational methods for creep fracture
analysis by damage mechanics’, Computing Methods Appl. Mech. Engrg. 2000;
183, 15-33
[11] Yatomi, M., O’Dowd, N. P., Nikbin, K. M. ‘Modelling of damage development and
failure in notched bar multiaxial creep tests’ submitted for publication
[12] Zao, L.G., Tong, J., Byrne, J., ’Finite element simulation of creep-crack growth in a
nickel base super alloy’, Eng. Frac. Mech.2001, 68, 1157-1170
[13] Saxena, A., Hall, D.E., McDowell, D.L., ‘Assessment of deflection rate partitioning
for analysing creep crack growth data’, Eng. Frac. Mech., 1999; 62, 111-122
[14] Cocks, A.C.F. and Ashby, M.F., ‘Intergranular fracture during power-law creep
under multiaxial stress’, Metal Science 1980; 14, 395-402.
[15] Maskell, R. V., Fleming, A., Crawford, P. J. and Buchanan, L. W., ‘Creep crack
growth in internally pressurised tubes’, J. Materials at High Temperature,
1998;15(3/4) 151-158.
[16] Nikbin, K.M., Smith, D.J. and Webster, G.A., ‘Prediction of creep crack growth
from uniaxial creep data’, Proc. Roy. Soc. London, A 1984; 396, 183-197.
[17] Webster, G.A. and Ainsworth, R.A. 1994, ‘High Temperature Component Life
Assessment’, Chapman and Hall.
[18] Riedel, H, 1987, Fracture at High Temperatures, Springer-Verlag Berlin,
Heidelberg.
[19] Rice, J.R., 1968, Mathematical analysis in the mechanics of fracture, in Treatise on
Fracture (ed. H. Liebowitz), vol. 2, Academic Press, New York.
[20] ASTM E1457-01, ‘Standard test method for measurement of creep crack growth
rates in Metals’, 2002.
[21] Nikbin, K.M., Smith, D.J. and Webster, G.A., ‘Advances in life prediction methods
at elevated temperatures’, Conf. Proc. ASME 1983; 183-197.
16
[22] Nikbin, K.M., Smith, D.J. and Webster, G.A. ‘An engineering approach to the
prediction of creep crack growth’, J. of Engineering Materials and technology 1986;
108, 186-191.
[23] Tan, M., Celard, N.J.C., Nikbun, K.M. and Webster, G.A., 2001, ‘Comparison of
creep crack initiation and growth in four steels tested in HIDA’, Int. J. Pres. Vess.
and Piping., 78, 737-747.
[24] Rice, J.R. and Tracey, D.M., ‘On the Ductile Enlargement of Voids in Triaxial
Stress Fields’, J. Mech. Phys. Solids, 1969; 17, 201–217.
[25] Spindler, M.W., 1994.’ ‘The Multiaxial Creep of Austenitic Stainless Steels’,
Nuclear Electric Report TIGM/REP/0014/94.
[26] ABAQUS version 5.8, 1998. Hibbitt, Karlsson & Sorensen, Inc.
[27] LICON, Draft Code of Practice, EU FP5- Collaborative Programme on Accelerated
damage Testing in Advenaced steels’, June 2001.
[28] Kanninen, M.F. and Popelar, C.H., 1985, Advanced Fracture Mechanics, Oxford
University Press, New York.
17
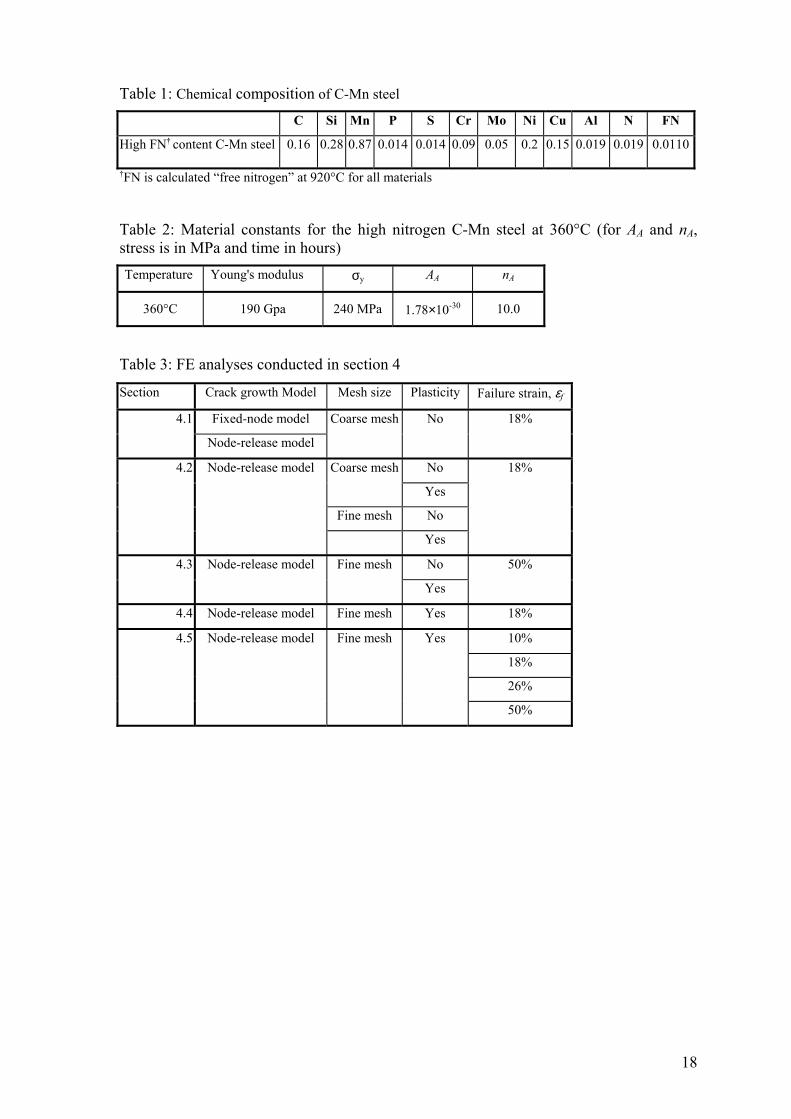
Table 1: Chemical composition of C-Mn steel
C Si Mn P S Cr Mo Ni Cu Al N FN
High FN† content C-Mn steel 0.16 0.28 0.87 0.014 0.014 0.09 0.05 0.2 0.15 0.019 0.019 0.0110
†FN is calculated “free nitrogen” at 920°C for all materials
Table 2: Material constants for the high nitrogen C-Mn steel at 360°C (for AA and nA, stress is in MPa and time in hours) Temperature Young's modulus σy AA nA
360°C 190 Gpa 240 MPa 1.78×10⁻³⁰ 10.0
Table 3: FE analyses conducted in section 4
Section Crack growth Model Mesh size Plasticity Failure strain, εf
Fixed-node model 4.1
Node-release model
Coarse mesh No 18%
No Coarse mesh
Yes
Fine mesh No
4.2 Node-release model
Yes
18%
No 4.3 Node-release model Fine mesh
Yes
50%
4.4 Node-release model Fine mesh Yes 18%
10%
18%
26%
4.5 Node-release model Fine mesh Yes
50%
18
trTime, t
Cre
ep st
rain
, ε c
εf
cAε&
csε&
trTime, t
Cre
ep st
rain
, ε c
εf
cAε&
csε&
Figure 1: Schematic creep curve illustrating secondary creep rate, , and average creep rate
cAε&
cAε&
10-5
10-4
10-3
400 500
Experimental datan
A = 10.0
nA = 12.5
nA = 18.5
Ave
rage
Cre
ep S
train
rate
, (/h
)
Stress, (MPa)
at 360°C
350 4505
10
15
20
25
30
350 400 450 500
Cre
ep fa
ilure
stra
in, (
%)
Stress, (MPa)
mean
mean + 2s
mean - 2s
C-Mn steelat 360°C
Figure 2: Average creep strain rate versus stress for C-Mn at 360°C
Figure 3: Creep ductility for C-Mn steels at 360°C, including mean and 2s lines ±
19
1 10 100 1000 10410-5
0.0001
0.001
0.01
0.1
CT, W = 15mmCT, W = 25mmCT, W = 50mm
C*, (J/m2h)
da/d
t, (m
m/h
) meanmean + 2s
mean - 2s
Figure 4: Steady state creep crack growth versus C* for the C-Mn steel at 360°C showing
the bounds for ±2s
P P
(a) (b)
Figure 5: FE mesh for CCG analysis of CT specimen (a) coarse mesh and (b) fine mesh
yx
When ω at two integration pointsnear the crack tip reaches 0.999 this node is released.
ipCrack t
Figure 6: Schematic illustration of crack growth using the nodal release method.
20
0
0.1
0.2
0.3
0.4
0.5
0.6
0 5000 1×10⁴ 1.5×10⁴ 2×10⁴ 2.5×10⁴
Experimental dataFE, Plane stressFE, Plane strain
Load
line
dis
plac
emen
t
Time, (h)
nA = 10.0
Figure 7: Comparison of experimental load- line displacement from two tests with the FE
analysis for a CT specimen under plane stress and plane strain conditions
Damage0.000.100.190.280.370.460.540.630.720.810.901.00
k
Figure 8: Dam
release model
Initial crack
age contour plot for an elastic-creep analysis of a CT
Current crac
mesh using the node-
21
0.0
0.2
0.4
0.6
0.8
1.0
0.0 0.5 1.0 1.5 2.0
t = 1.34 ht = 857 ht = 3146 ht = 5305 h
Distance from crack tip, (mm)
Hyd
rost
atic
stre
ss/E
quiv
alen
t stre
ss
1.5
2.0
2.5
3.0
5
0.0 0.5 1.0 1.5 2.0
t=167 ht=1404 ht=19,130 ht=24,620 h
Distance from crack tip, (mm)
Hyd
rost
atic
stre
ss/E
quiv
alen
t stre
ss
(a) 3.(b)
Figure 9: Triaxiality σm/σe plotted against distance from the crack tip for the CT specimen
for four different times (a) plane stress (b) plane strain
22
0.0
0.5
1.0
1.5
2.0
100 101 102 103 104 105 106
Experimental dataNode-release modelFixed-node model
∆a, (
mm
)
Time, (h)
Plane stress
0.0
0.5
1.0
1.5
2.0
100 101 102 103 104 105 106
Experimental dataNode-release modelFixed-node model
Time, (h)
∆a, (
mm
) Plane strain
(a) (b)
Figure 10: Predicted crack growth against time for node-release and fixed-node models
(a) plane stress, (b) plane strain.
0.0
0.5
1.0
1.5
2.0
100 101 102 103 104 105
Experimental dataFine meshCoarse mesh
∆a, (
mm
)
Time, (h)
Plane stress, elastic
0.0
0.5
1.0
1.5
2.0
10-1 100 101 102 103 104 105
Experimental dataFine meshCoarse mesh
∆a, (
mm
)
Time, (h)
Plane strain, elastic
(a) (b)
0.0
0.5
1.0
1.5
2.0
100 101 102 103 104 105
Experimental dataFine meshCoarse mesh
∆a, (
mm
)
Time, (h)
Plane stress, elastic-plastic
0.0
0.5
1.0
1.5
0
100 101 102 103 104 105
Experimental dataFine meshCoarse mesh
∆a, (
mm
)
Time, (h)
Plane strain, elastic-plastic
2.(d) (c)
Figure 11: Effect of mesh size on predicted CCG (a) plane stress, elastic analysis, (b)
plane strain, elastic analysis (c) plane stress, elastic-plastic analysis, (d) plane strain,
elastic-plastic analysis
23
10-7
10-6
10-5
10-4
10-3
10-2
10-3 10-2 10-1 100 101 102 103
Plane stress, ElasticPlane stress, Elastic plasticPlane strain, ElasticPlane strain, Elastic plastic
da/d
t, (m
m/h
)
C*, (J/m2h)
εf = 50 %
Figure 12: Prediction of CCG rate against C*. The dotted lines are the mean lines through
the elastic plane strain and elastic or elastic plastic plane stress analyses.
Figure 13: CCG rate plotted against C* using the contour integral and load line displacement
rate definitions
24
10-6
10-5
10-4
10-3
10-2
10-1
10-4 10-3 10-2 10-1 100 101 102 103 104
FEM, Plane stressFEM, Plane strainNSW, Plane stressNSW, Plane strain
da/d
t, (m
m/h
)
C*, (J/m2h)
Band for Experimental data
(Figure 4)
εf = 18 %
∆ < 0.5.
0.5 < ∆.
Figure 14: Comparison of predicted CCG rate and experimental data for C-Mn steel.
Arrows indicates creep brittle/ductile bound [20]
25
) (a
0.00
0.25
0.5
0.75
1.00
0.001 0.01 0.1 1 10 100 1000
εf = 10%
εf = 18%
εf = 26%
εf = 50%
C*, (J/m2h)
∆.
0
0.25
0.5
0.75
1.00
0.001 0.01 0.1 1 10 100 1000
εf = 10%
εf = 18%
εf = 26%
εf = 50%
C*, (J/m2h)
∆.
(b)
Figure 15: ( Tc ∆∆∆ &&& = ) plotted against C* for a range of failure strains, (a) plane stress
(b) plane strain
10-6
10-5
10-4
10-3
10-2
0.001 0.01 0.1 1 10 100 1000
FE, εf = 10%
FE, εf = 50%
NSW, εf = 10%
NSW, εf = 50%
C*, (J/m2h)
da/d
t, (m
m/h
)
10-6
10-5
10-4
10-3
10-2
0.001 0.01 0.1 1 10 100 1000
εf = 10 %
εf = 18 %
εf = 26 %
εf = 50 %
C*, (J/m2h)
da/d
t, (m
m/h
)
F.E.NSW
(a) (b)
Figure 16: Effect of creep ductility εf on CCG rate (a) plane stress elastic-plastic analysis, (b)
plane strain elastic-plastic analysis.
26