Embed Size (px)
Citation preview
The Diffusion of Fear: Modeling Community Response to a Terrorist Strike
William J. Burns Decision Research, CREATE, Cal State University San Marcos1*
Paul Slovic Decision Research2
KEY WORDS: terrorism, anthrax, risk perception, fear, social amplification of risk, system
dynamics model,
1 California State University, CoBA, San Marcos, California 92096-0001
2 Decision Research, 1201 Oak St. (# 200) Eugene, Oregon 97401,
* Address correspondence to William J. Burns, California State University, CoBA, San Marcos,
California; [email protected]
William J. Burns is a research scientist at Decision Research (Eugene, OR), a consultant
at the Center for Risk and Economic Analysis of Terrorism Events (CREATE) and teaches part-
time in the College of Business at Cal State University San Marcos.
Paul Slovic is president of Decision Research and a professor of psychology at the
University of Oregon. He studies human judgment, decision making, and risk perception, and
has published extensively on these topics.
Date submitted: April 30 2007; first resubmission: October 10, 2007; second
resubmission: November 21, 2007; accepted: January 2008.
In press, Journal of Defense Modeling and Simulation. Copyright © 2008 Society for
Modeling and Simulation International.
1
ABSTRACT
Understanding those factors critical to predicting public response is crucial to our ability
to model the consequences of a terrorist strike in an urban area. To forecast community response,
a system dynamics model was constructed that examines how a community is likely to respond
to a terrorist attack along several dimensions. For three scenarios (anthrax attack, bomb blast and
propane tank explosion) intensity of investigation, media coverage, public risk perception,
diffusion of fear and community intervention are simulated over a six month period. Terrorist
attacks generated intense media coverage initially resulting in high perceptions of risk and
diffusion of fear. Delays in community intervention contributed to higher and more prolonged
levels of fear. Perceptions of risk rose very quickly but declined quite slowly. These findings
should prove useful to those wishing to predict public response to a variety of different
contingencies involving terrorism.
1. INTRODUCTION
The objective of this paper is to examine factors critical to predicting public reaction to a
terrorist strike and to describe an approach to modeling the dynamic complexity that underlies a
community’s response. Emergency response systems, information and communication channels,
and social support networks are likely to be influenced by the particular characteristics of a
terrorist event to produce a wide range of physical, social, and economic impacts [1-3]. To
forecast community response, a system dynamics simulation model is introduced that illustrates
some of the complexity likely to determine impacts within a large urban community during such
2

a crisis. Additionally, this model simulates the immediate and mid-term impacts (e.g., diffusion
of fear) of two different types of terrorist events and an accidental mishap.
As a practical motivation for such modeling, consider the fact that public officials,
business leaders, health care providers and most citizens now feel the need to prepare for the
impacts a terrorist strike might have on an urban community. Following the events of September
11th and the anthrax attacks during the same period, individuals and organizations have become
aware of their vulnerability with respect to explosions (bombing of tunnels and bridges),
biological agents (smallpox, anthrax), and radiation releases (“dirty bombs,” attacks on nuclear
reactors). Reflecting this sense of vulnerability, websites, books, and news reports addressing
disaster preparedness have become ubiquitous. Universities now offer courses covering all
aspects of terrorism.
There is a clear need to provide researchers, educators, homeland security officials, and
policy makers with a better understanding of the dynamics that underlie how a community is
likely to prepare for and respond to an attack [4].
1.1. Overview of Study
This study intends to accomplish two goals. First, we seek to illustrate how systems
modeling may provide insight into how risk signals following a hazardous event may ripple
through a community. Hence, we propose a systems model and provide simulation output
depicting the diffusion of fear in a community. Second, we seek to examine how characteristics
of different hazards may contribute to the diffusion of fear. With this in mind, we incorporate
survey findings reported in [5] into our systems model. In that study hypothetical threat scenarios
were developed and survey data were collected that principally compare accidents to terrorism
3

across two damage mechanisms: explosions and infectious diseases. The authors found that
perceptions of risk and risk-related behaviors differed markedly depending on the mechanism
involved and whether terrorism was implicated. However, that study did not analyze how public
reaction might change over the course of the event. Hence, this paper extends their findings by
simulating the diffusion of fear over a six month period in the context of community response.
This simulation is guided by two conceptual frameworks, the social amplification of risk and
systems thinking and modeling which are discussed next.
1.2. Theoretical and Empirical Basis for Study
The Social Amplification of Risk. This study is guided by two conceptual frameworks,
the social amplification of risk and systems thinking and modeling. The central idea behind the
social amplification framework is that an adverse event, in this case an accident or act of
terrorism, interacts with psychological, social, institutional, and cultural processes in ways that
may amplify (or attenuate) community response to the event [1]. According to this theory, the
effects of an accident or act of terrorism sometimes extend far beyond the direct damages to
victims, property, or environment and may result in immense indirect impacts. When a mishap
occurs, information flows through various channels to the public and its many cultural groups.
This information is interpreted largely on the basis of its interaction with the above processes.
This interaction, in turn, triggers risk-related behavior. Such behavior, together with the
influence of the media and special interest groups, generates secondary social and economic
consequences that eventually call for additional institutional responses and protective actions [6].
Prior Studies. Numerous studies have examined aspects of the social amplification
framework from particular disciplinary points of view and methodological approaches [7] with
4

applications from media and risk reporting [8], organizational amplification and attenuation [9-
11], institutional trust [12-13], nuclear power and stigma [14-15] and public policy [16]. Much
has been learned about the public perception of risk, but far less is known about the contexts
under which amplification or attenuation occurs or how such amplification of risk perceptions
are linked to other community impacts [17].
Systems Thinking. We also discuss systems thinking and later systems modeling as a
way to address some of the issues raised by these studies. According to [3], the modeling tools
employed in systems thinking are useful for understanding the structure of a system, the
interactions among its components, and how change in one area affects the whole system and its
parts over time. In fact, one of the early pioneering applications of system dynamics modeling
examined urban renewal policies and their ironic contribution to the acceleration of inner-city
decay [18].
From a systems perspective, to understand community reaction to a terrorist act, focus
must be placed on the interaction of the community’s essential components and processes [19].
In fact, the dynamics of such a systemic response can be understood in terms of the interaction of
positive (self-reinforcing) and negative (self-correcting) feedback loops, along with time and
information delays and nonlinearities [20]. Nonlinearity, as used here, refers to the potential for
simple changes in one part of a system to produce dynamically complex effects throughout the
entire system (in this case the community). It also refers to the possible curvilinear relationships
that may exist between model variables. Examples of both are offered later in the paper. The
social amplification framework provides the theoretical and empirical substance to guide what
processes should be modeled and how system feedback loops and delays may contribute to
5

impacts far in excess of what one might expect based on the immediate and most tangible
consequences of a terrorist act.
Positive loops tend to amplify behaviors and negative loops tend to counter such change.
For example, positive loops formed as the media began to follow the investigation of the anthrax
attacks in Washington, D.C., Trenton, New Jersey, and Boca Raton, Florida. People around the
nation began to alert friends and coworkers about this new threat and information spread rapidly
via word-of-mouth. As a result, concern and to some extent fear began to rise dramatically,
according to news polls at the time. Ripple effects were felt around the nation as citizens called
information hotlines and health care providers, brought suspicious mail to local police and fire
departments, and sought vaccines and antibiotics in case of exposure. Health care facilities felt
the need to review bioterrorism response and preparedness plans. Conversely, negative loops
also formed. As word-of-mouth increased, people had fewer new people to talk with or less fresh
news to talk about and hence “water cooler” conversation declined, having exhausted itself.
Likewise, as fear spread institutions (e.g., governmental agencies, health care providers, religious
organizations) responded, offering reassurance and information that the threat of anthrax was not
as serious as imagined (e.g., not international terrorism) and was being addressed (e.g., the postal
service screening mail). Fear decreased and so did the volume of telephone calls to health care
facilities and demands for antibiotics, but the call for bioterrorism preparedness persists today
[21].
Delays between actions and consequences as well as nonlinearities are also important and
make community response difficult to predict and manage [22]. Despite an intensive federal
investigation, it took time to determine that international terrorism wasn’t behind the anthrax
attacks and to declare the Senate Office Building free of anthrax spores. Likewise, support
6

organizations required time to respond and offer help. Meanwhile the nation was on the alert.
Even after new information and reassurances were available, it took time for people to
emotionally adjust, because it was easier to become scared than to calm down. Finally, the
effects of terrorist acts in general are unlikely to be proportional to the direct damage they cause.
The effects are likely to be nonlinear in this sense. The anthrax attacks of 2001 were local events,
unconnected to international terrorism, in which five people died. Yet, this event, in the wake of
September 11, has led to massive efforts in bioterrorist research, disaster preparedness, and the
stockpiling of vaccines and antibiotics.
2. SYSTEMS MODELING
2.1. Modeling Procedures and Hypothesis
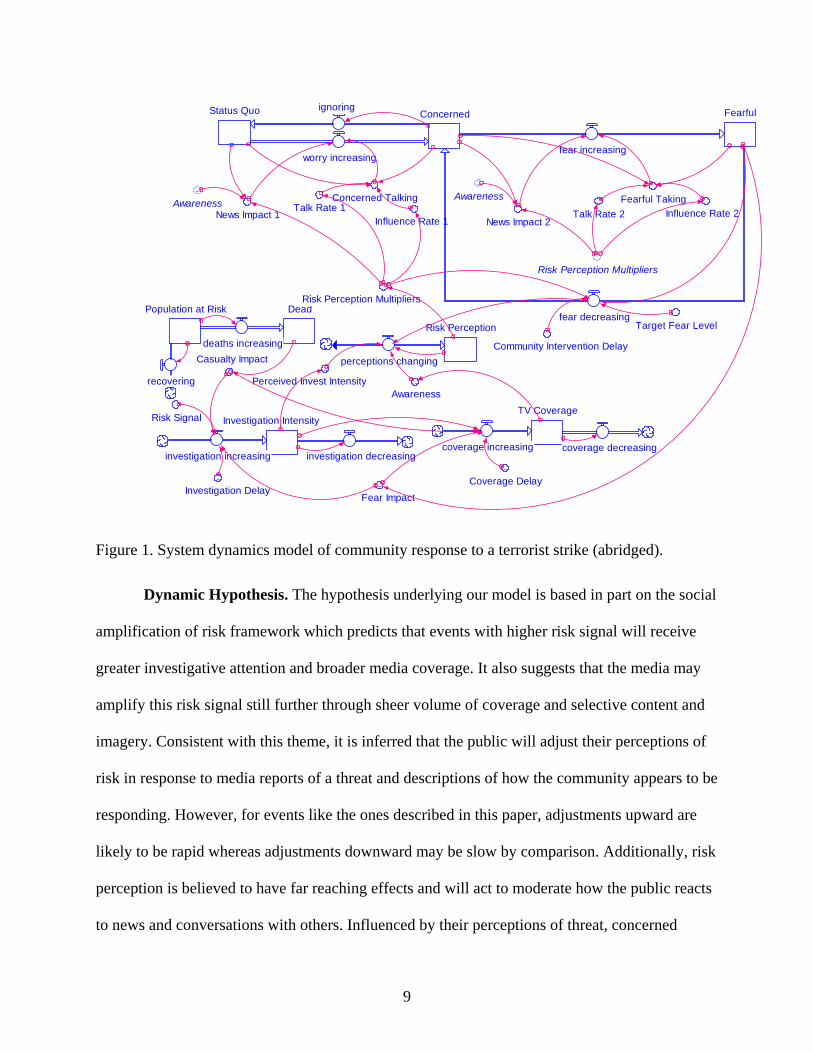
Procedures. As an explanation of our systems modeling procedures, consider the model
shown in Figure 1 which seeks to depict the diffusion of fear in a community following a
terrorist attack. This model has been abridged for ease of discussion. However, the full model, its
input values and all its equations are posted on the authors’ website [25].1 All model equations
and inputs are also shown in the Appendix. Figure 1 is a stock and flow diagram [3, 20] designed
to represent the state of a system at any given moment and to track how the system changes over
time. Stocks (depicted as rectangles and italicized throughout the paper), are accumulations and
represent the state of the system at any given time. Flows (depicted as in-flowing and out-
flowing pipes) increase or decrease the size of the stocks over time, respectively. Rates of flow
are regulated by valves, which in turn are influenced by causal factors (depicted as small circles)
linked to rates by feedback loops (depicted as arrows). 1 http://www.decisionresearch.org/people/burns/
7
One example of stocks used here are the number of citizens moving first from a state of
Status Quo (level of concern prior to terrorist event) to Concerned as worry increases, to Fearful
as fear increases, and back to Concerned as fear decreases. The rate of flow (citizens per day),
say from Concerned to Fearful is regulated by the valve “fear increasing.” This, in turn, is
influenced by “fearful talking” and “news impact”. Naturally, the number of concerned
citizens—Concerned—diminish at the same rate as fearful citizens—Fearful—increase (people
in a system are conserved). The clouds at the beginning and end of the pipes are stocks (sources
and sinks respectively) representing variables outside the boundary of the model.
As will be discussed shortly, this simulation varies a number of model parameters such
Risk Signal (characteristics of an event that portend immediate or future danger) and Community
Intervention Delay (time required to reduce fear levels to a target level) to observe how critical
endogenous variables in the model change over time. The number of fearful people is especially
important in this respect. However, no attempt is made to introduce stochastic elements into our
simulation similar to that of a Monte Carlo study. This model is deterministic and instead focuses
on the underlying dynamics of how risk and risk-related behaviors (e.g., fear) diffuse in response
to different types of events and speeds of community intervention.
8
Population at Risk Dead
deaths increasing
~
Awareness
Investigation Intensity
investigation increasing
Risk Perception Multipliers
Risk Signal
investigation decreasing
recovering
TV Coverage
coverage increasing coverage decreasing
Risk Perception Multipliers
Risk Perception
~
Awareness
perceptions changing
Status Quo Concerned
worry increasing
ignoring
News Impact 1
Concerned TalkingTalk Rate 1
Influence Rate 1
Fearful
fear increasing
fear decreasing
News Impact 2
~
Perceived Invest Intensity
~
Awareness Fearful TakingTalk Rate 2 Influence Rate 2
Target Fear Level
~
Casualty ImpactCommunity Intervention Delay
~
Investigation Delay ~
Fear Impact
~
Coverage Delay
Figure 1. System dynamics model of community response to a terrorist strike (abridged).
Dynamic Hypothesis. The hypothesis underlying our model is based in part on the social
amplification of risk framework which predicts that events with higher risk signal will receive
greater investigative attention and broader media coverage. It also suggests that the media may
amplify this risk signal still further through sheer volume of coverage and selective content and
imagery. Consistent with this theme, it is inferred that the public will adjust their perceptions of
risk in response to media reports of a threat and descriptions of how the community appears to be
responding. However, for events like the ones described in this paper, adjustments upward are
likely to be rapid whereas adjustments downward may be slow by comparison. Additionally, risk
perception is believed to have far reaching effects and will act to moderate how the public reacts
to news and conversations with others. Influenced by their perceptions of threat, concerned
9
citizens may also serve as amplifying stations through word-of-mouth and thus contribute to the
rapid diffusion of fear in a community. Responding to public reaction, community efforts (e.g.
social services, faith-based groups) will almost certainly seek to calm citizens and restore
normalcy. This intervention may not only quell fear but may reduce risk perceptions as well.
Though not modeled in this paper, high levels of fear may subsequently lead to costly secondary
impacts as increasing demands are placed on community, regional, and national resources (e.g.
security efforts following the attacks of September 11th).
Story Context. The simulation described here is based on three hypothetical disaster
scenarios taking place in a theme park near a large city in southern California [5]. These events
involve an accidental propane tank explosion, a bomb blast and an anthrax release. While these
scenarios are similar in terms of casualties they differ in terms of risk signal and length of
investigation. The context of the simulation involves a city of one million adults, one thousand of
whom are put in harm’s way during a terrorist attack or accidental mishap at the park. Half of
these people die within days (on average three days for explosions and five days for anthrax).
Model and Story Outline. As depicted in Figure 1, the story begins with people in the
proximity of a terrorist act or accidental mishap (Population at Risk), some sustain harm (i.e.
injured or infected) and about half eventually die (Dead). An investigation ensues based on these
deaths and the risk characteristics (e.g., accident, terrorism, infectious disease) of the event. As
the investigation intensifies (Investigative Intensity), media coverage (TV Coverage) increases,
and alerts citizens about the event. Increased awareness of the terrorist strike leads to an
increased perception of risk (Risk Perception) causing people to become concerned (Concerned)
and alert others. Some people will also become fearful (Fearful). However, as the population
becomes fearful, networks within the community (formal and informal) begin to offer support
10

and reassurance, which in turn begins to reduce the level of fear and subsequently perceptions of
risk. Eventually the community regains its equilibrium but the public remains at a higher state of
concern and perceived risk (and to some extent fearful) than before the event.
2.2 Stock and Flow Computations
Metrics. For some model variables the choice of scale was straightforward. For example,
variables involving delays such as Investigation Delay were measured in terms of days.
Likewise, stock variables such as Population at Risk, Dead, Status Quo, Concerned and Fearful
were naturally described in terms of people. However, for a number of variables, scale selection
was based on ease of assessment and interpretation. For example, Investigation Intensity, TV
Coverage, Risk Perception, Awareness and Perceived Investigation Intensity were normalized to
a unitless 0-100 scale. Similarly, factors such as Risk Signal, Fear Impact and a number of the
risk perception multipliers were standardized to a unitless 0-1 scale. For a complete list of all
model variables and their unit scales see the authors’ website [25].
Model Inputs. Inputs and relationships among model variables were based on survey
results [5-6] and on author judgments (informed by both a familiarity with the disaster literature
and the San Diego community). Some inputs varied as a direct result of the simulation. For
example, in simulating public response for the three mishaps mentioned above, scores for Risk
Signal were assigned on a relative basis as follows: anthrax (1) bomb blast (.8) and massive
propane tank explosion (.3). These values were based on survey results and on conversations
with first responders. Length of the investigation also differed for each event (60 days, 30 days,
10 days respectively). The minimum length of time to investigate an anthrax release was judged
to be 60 days, and investigations for the other events were assessed relative to this value. Time to
death for each event was 5 days, 3 days and 3 days respectively. Community Intervention Delay
11
was manipulated independently of the event (1 day, 3 days, 5 days). However, other inputs were
fixed throughout the simulation. For example, the rate at which a person might talk with others at
the height of a crisis was judged to be 10 people per day and was based on survey results [5].
The target fear level for community intervention was fixed at 100,000 people (ten percent of the
population). The initial value for the stock Status Quo was set equal to the population size of
adults in San Diego (1,000,000). In contrast, the initial value for the stock Population at Risk was
set equal to the number of people proposed to be near the site of the mishap (1,000). For all other
stocks initial values were set to zero.
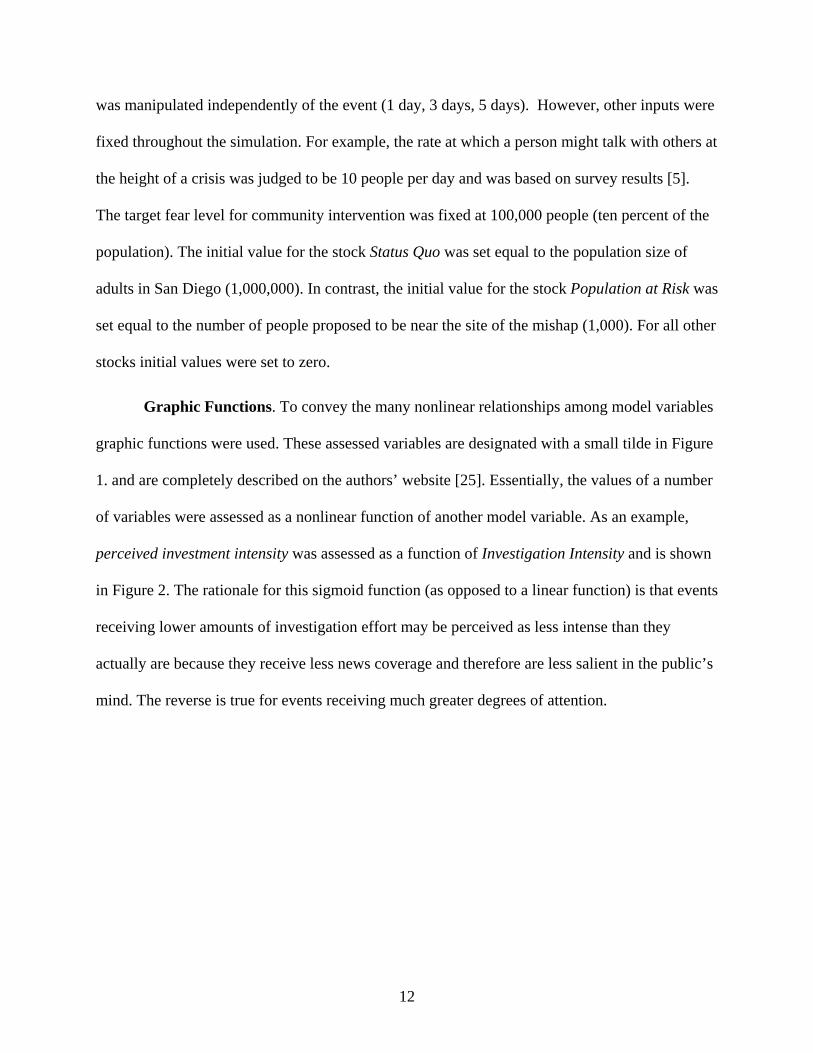
Graphic Functions. To convey the many nonlinear relationships among model variables
graphic functions were used. These assessed variables are designated with a small tilde in Figure
1. and are completely described on the authors’ website [25]. Essentially, the values of a number
of variables were assessed as a nonlinear function of another model variable. As an example,
perceived investment intensity was assessed as a function of Investigation Intensity and is shown
in Figure 2. The rationale for this sigmoid function (as opposed to a linear function) is that events
receiving lower amounts of investigation effort may be perceived as less intense than they
actually are because they receive less news coverage and therefore are less salient in the public’s
mind. The reverse is true for events receiving much greater degrees of attention.
12

Figure 2. Graphic assessment of Investigation Intensity vs. Perceived Investigation Intensity.
Rate Equations. All stocks in the model change in relation to their corresponding rate
equations and these are listed in Table 1. Most variables comprising these equations are depicted
in Figure 1 and all are described in the Appendix. For a complete representation of variable
relationships see the unabridged model on the authors’ website [25]. Dead represents a tally of
the number of people who have died during the event. It increases as a function of the population
exposed to the threat (1,000 people), and the time it takes to die for the 500 persons designated to
perish in the simulation. Investigative Intensity represents the allocation of community resources
in response to a crisis and depends on a number of model variables that evolve during the event.
This stock increases (investigation increasing in Table 1) as a weighted function of factors
involving casualties, risk signal, fear, available resources and delays in investigation.
Conversely, Investigation Intensity decreases over time depending on the length of the
investigation.
13
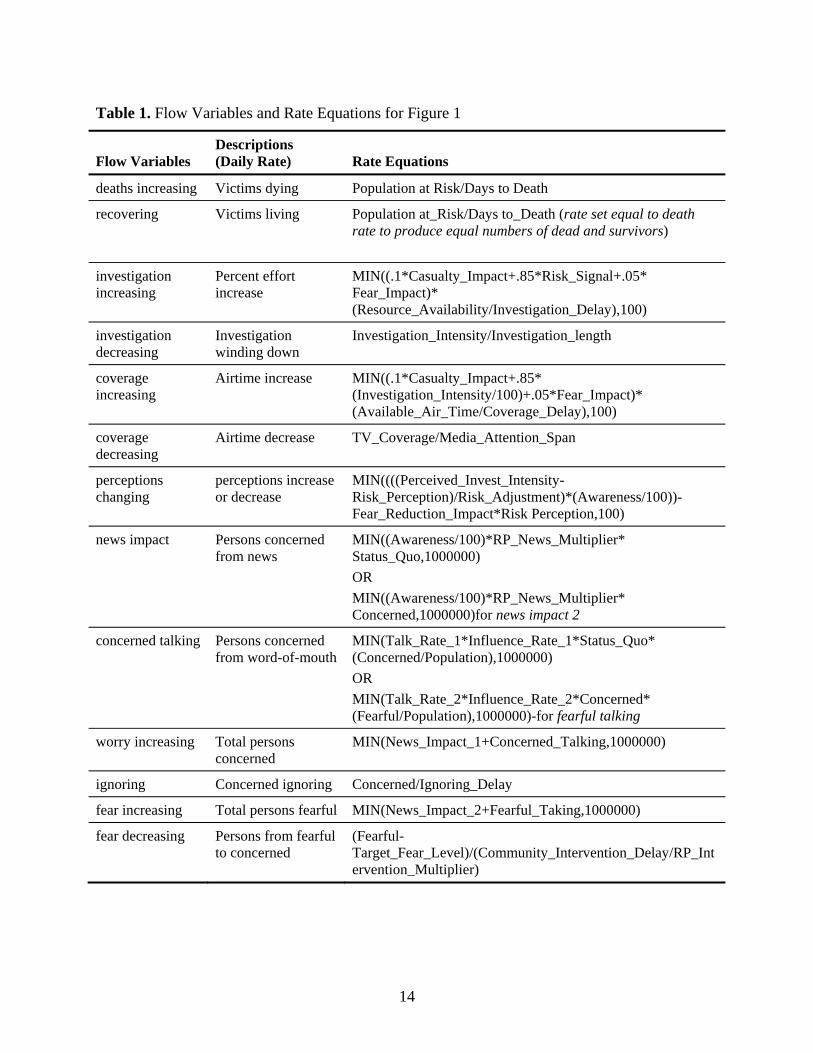
Table 1. Flow Variables and Rate Equations for Figure 1
Flow Variables Descriptions (Daily Rate) Rate Equations
deaths increasing Victims dying Population at Risk/Days to Death
recovering Victims living Population at_Risk/Days to_Death (rate set equal to death rate to produce equal numbers of dead and survivors)
investigation increasing
Percent effort increase
MIN((.1*Casualty_Impact+.85*Risk_Signal+.05* Fear_Impact)* (Resource_Availability/Investigation_Delay),100)
investigation decreasing
Investigation winding down
Investigation_Intensity/Investigation_length
coverage increasing
Airtime increase MIN((.1*Casualty_Impact+.85* (Investigation_Intensity/100)+.05*Fear_Impact)* (Available_Air_Time/Coverage_Delay),100)
coverage decreasing
Airtime decrease TV_Coverage/Media_Attention_Span
perceptions changing
perceptions increase or decrease
MIN((((Perceived_Invest_Intensity-Risk_Perception)/Risk_Adjustment)*(Awareness/100))-Fear_Reduction_Impact*Risk Perception,100)
news impact Persons concerned from news
MIN((Awareness/100)*RP_News_Multiplier* Status_Quo,1000000) OR MIN((Awareness/100)*RP_News_Multiplier* Concerned,1000000)for news impact 2
concerned talking Persons concerned from word-of-mouth
MIN(Talk_Rate_1*Influence_Rate_1*Status_Quo* (Concerned/Population),1000000) OR MIN(Talk_Rate_2*Influence_Rate_2*Concerned* (Fearful/Population),1000000)-for fearful talking
worry increasing Total persons concerned
MIN(News_Impact_1+Concerned_Talking,1000000)
ignoring Concerned ignoring Concerned/Ignoring_Delay
fear increasing Total persons fearful MIN(News_Impact_2+Fearful_Taking,1000000)
fear decreasing Persons from fearful to concerned
(Fearful-Target_Fear_Level)/(Community_Intervention_Delay/RP_Intervention_Multiplier)
14

TV Coverage increases (coverage increasing in Table 1) with factors involving casualties
(human hardship), investigative efforts (providing a plot for the story), fear (community
response), available airtime (competitive stories) and response delays (time and effort to obtain
details). However, media attention is competitive and a story begins to lose its “newsworthiness”
over time. As a result, increasing and decreasing coverage were treated as inversely related to
time. Mathematically representing Investigation Intensity and TV Coverage in this way allows
for the possibility that an event such as a terrorist threat involving no casualties could have
potentially much larger consequences than an accidental mishap in which many lives are lost.
Risk Perception embodies the public’s assessment of threat (a state of mind) in response
to the crisis and acts as a moderating factor throughout the model as shown in Figure 1. Changes
in perceived risk (perceptions changing in Table 1) are a complex function of perceived
investigation intensity, current risk perceptions, public awareness of the threat, speed of
perceptual adjustment (risk adjustment), and assessments of community efforts to quell fear (fear
reduction impact). The speed and direction of this change depends largely on the nature of the
gap between perceptions of investigative efforts and current perceptions of threat. For example,
Risk Perception increases rapidly when current perceptions of the threat are considerably less
than perceptions of investigative intensity (i.e. people are highly responsive to reports of
potential danger) and decreases slowly when the reverse is true (i.e. people are slow to recover
despite expert assessments).
The diffusion of fear is modeled by counting the number of people moving between the
states Status Quo (pre-event levels of concern), Concerned (worried, possibly seeking
information and prepared to take prudent action) and Fearful (high anxiety and possibly taking
self-protective though not necessarily prudent actions). The stock of Concerned citizens
15

increases as a direct result of individuals becoming worried (worry increasing in Table 1) on the
basis of news reports and conversations with others (news impact and concerned talking
respectively in Table1). The number of people affected by news reports depends on the
community’s level of awareness, perceptions of risk, and how many are yet unconcerned
(awareness, risk perception multipliers, and status quo respectively in Figure 1). The spread of
concern by word-of-mouth is more complicated. The rate at which people talk (concerned talking
in Table 1) varies according to levels of awareness, number of people contacted per person, how
much influence each conversation has, the number of people yet unconcerned, and the fraction of
concerned citizens in the population (awareness, talk rate, influence rate, and status quo
respectively in Figure 1-population is not shown). Note that contact rate and level of influence
depend on levels of perceived risk (through its multipliers) hence, events with more news
coverage and higher perceived risk are attended to more closely, are talked about more
frequently (conversations are also more influential) and are more likely to generate a number of
“self-protective” actions [5-6].
The stock of Fearful citizens increases (fear increasing in Table 1) in the same way the
stock of Concerned citizens increases. Fear however, has the potential to spread quickly, and
communities cannot sustain high levels of fear for long. To counteract the diffusion of fear it is
assumed that community networks mobilize to offer support and reassure people. How rapid or
effective this response might be is unclear and almost certainly depends on community
cohesiveness and preparedness. How quickly levels of fear decrease (fear decreasing in Table 1)
depend on the gap between the current and target levels of fear, the time it takes for the
community to intervene and perceptions of risk (target fear level, community intervention delay,
and risk perception multipliers respectively in Figure 1). The idea here is that a community has
16
an explicit or implicit goal to reduce fear levels to some sustainable level and hence will attempt
to monitor and close this gap. However, it may take a number of days to restore a fearful public
back to a level of being concerned about their safety. A target of reducing the number of fearful
people to ten percent was taken as a desired goal because levels below this level may be
unrealistic. A three day delay was used as a base rate in all model calculations.
2.3. Results
Community Response. Now that our modeling has been discussed, consider the
following model output (Figure 3) depicting important factors likely to be involved in a
community’s response to an anthrax attack in which 500 die. Notice that the community
responds quickly during the first few days following the anthrax attack. Investigation Intensity,
which is not shown here, begins immediately and is already at over 50% of available resources
by the first day (still at fifty two percent 2 months later). TV Coverage in Figure 3 spikes quickly
offering extensive reporting for about two weeks and then begins to rapidly decline as it turns to
other news (less than five percent 2 months later). Within days perceived risk peaks, and over
eighty five percent of the public are in a state of fear (at forty four percent 2 months later). This
percentage corresponds exactly, to a nationwide survey conducted two months after September
11th in which 21% of people described themselves as very afraid and 23% were somewhat afraid
[23]. However, it should be noted that the two studies may not be measuring fear in the same
way. Observe that within a few weeks both risk perception and fear begin to decline but
perceived risk drops much more slowly. This reflects the fact that a community may intervene
directly to calm people down but attitudes toward certain hazardous events are resistant to
change (e.g. nuclear power following the accident at Three Mile Island).
17

Figure 3. Simulated community response to an anthrax attack during the first six months.
Differences in Fear Across Mechanisms. The public is likely to respond differently
depending on the risk characteristics (e.g. terrorism, infectious agent) of the event. Figure 4
compares the diffusion of fear in a community following an anthrax attack, bomb blast and
accidental propane tank explosion. All three events result in the same number of deaths (500).
However, these events differ not only in their risk signal but in the amount of time it may take to
investigate the event (i.e. ability to say something definitive to the public regarding causes and
consequences). Notice that both terrorist events cause considerably more public fear than does
the propane tank accident. While public fear for the anthrax and bomb blast attacks peak at about
the same level, fear subsides more quickly for the bomb blast (forty four percent and twenty four
percent 2 months later respectively). This is due largely to likely differences in the length of
investigation. The propane tank explosion overall causes a comparatively smaller public reaction
(twenty percent 2 months later) because propane tanks are very familiar to the public and first
responders are skilled at controlling this type of hazard (if negligence is involved outrage may be
18

extensive). The differences in the number of fearful people and the length of time they remain
afraid has sobering implications for the physical and economic health of a community, not to
mention its quality of life. This kind of amplification results from the reinforcing feedback loops,
delays, and nonlinearities predicted by the social amplification of risk framework.
Figure 4. Simulated response for events differing in risk signal and investigation duration.
Impact of Community Intervention. A wide range of formal and informal community
networks are likely to respond to public concerns during a crisis. How quickly they are able to
effectively reach out to its members may have substantial consequences for the community.
Figure 5 compares the diffusion of fear in the community for three levels of intervention
(average response delays). Notice that timely intervention causes fear to drop much more quickly
for an average delay of one day versus five days (twenty percent and sixty two percent after 2
months respectively). This difference is most likely understated because longer delays may also
encourage the perception that too little is being done to help.
19

Figure 5. Simulated response to anthrax attack for three levels of delayed intervention.
3. DISCUSSION
3.1. Major Findings
This study has simulated three threat scenarios (anthrax attack, bomb blast and propane
tank explosion) extending survey findings from a previous study [5] into a systems model to
examine how fear might diffuse within a community immediately following a terrorist attack or
an accident. Scenarios differing in risk signal (i.e. terrorism versus accident and infectious
disease versus explosion) and length of investigation were simulated to determine their impact
on media coverage, risk perception, word-of-mouth and the diffusion of fear over a six month
period. Community intervention delays were also investigated to understand their role in the
diffusion of fear. Small increases in risk signal in combination with length of the investigation
had a pronounced amplifying effect on the number of fearful people, and rate of diffusion and
duration of fear. Likewise, increased delays in community intervention also led to substantial
20

increases in the level and duration of fear. Community response was substantially different for
accidents versus terrorist events, a finding consistent with the social amplification of risk
framework. This study begins to demonstrate how responses to carefully designed scenarios can
provide data and parameters for input into our system dynamics model.
3.2. Study Limitations
Our model represents an attempt to capture some of the dynamics likely to drive
community response to certain hazardous events. Model construction was guided by the social
amplification of risk framework (the roles of the media, citizen word-of-mouth and formal and
informal networks as possible amplification or attenuation stations), and survey data (risk
perception of events with differing risk characteristics, propensity to contact friends or pay
attention to the media, risk-related behaviors such as avoiding public places or the perceived
calming influence of government officials, clergy, social agencies, or health care experts).
However, many of the functional relationships between model variables were based on
reasonable but subjective judgments. For example, level of investigative effort was modeled as a
function of risk signal, fear level and fatalities but a more objective assessment of resource
allocation may be possible and provide further insight [24]. Additionally, we know that formal
and informal social support networks engage the public during a crisis but it is difficult to
describe how effective these efforts are. The effectiveness of community intervention here was
approximated with a small range of response delays and an assumed target for the level of fear in
the community. Hence, it would be helpful to corroborate these findings with behavioral data as
it becomes available. We did compare the level of fear predicted by our model 60 days after an
anthrax attack with national surveys that tracked public perceptions following September 11th
and found our projections surprisingly close.
21

Likewise, we have incorporated a number of critical variables but some potentially
important factors were not included. For example, we did not model the impact of public trust in
community leaders. However, this response would probably influence not only public risk
perceptions and fear but may impact the magnitude of the event itself through the public’s
willingness to comply with warnings. Finally, several of the variables in our systems model are
really an aggregate of a number of related variables. This was done for simplicity but these
components may not always behave as an aggregate. For example, Investigative Intensity
potentially represents the efforts of first responders, health care workers, scientists, and local and
federal authorities. However, an event such as a propane tank explosion might require intense
efforts by first responders, health care workers and to some extent local authorities whereas a
terrorist threat may involve enormous attention from a number of groups.
3.3. Policy Implications
Policy makers often must anticipate the impact of potentially hazardous events on their
communities and society as well. In terms of public reaction, terrorist acts are likely to spark
rapid and perhaps prolonged concern and fear until the public comes to terms with the crisis.
Results from our simulation suggest that the longer the crisis goes unresolved in terms of
investigative closure or supportive intervention the more opportunity there is for the risk signal
to amplify and for fear to spread throughout the community. Likewise, the greater the level of
fear in the community the greater the effort required to restore normalcy among the public.
Conversely, intervention by social support groups and institutions can help restore normalcy.
These findings speak to the need for a careful, coordinated and rapid response on the part of
government officials, first responders, and community leaders and support groups. An active
effort should be made in advance to search for any and all delays in the community’s delivery of
22

health care, financial assistance, and social support. For these reasons terrorism presents a unique
challenge to officials wishing to mitigate the effects of a terrorist strike in a community.
3.4. Suggestions for Future Research
Our systems model includes a number of the variables likely to influence public response
(event risk characteristics, media coverage, word-of-mouth, community intervention) but more
work is needed to determine the requisite factors required to adequately forecast the impact of a
terrorist strike. Likewise, it would be helpful to have a better understanding of how these factors
change and interact overtime reflecting the dynamic nature of community of response. It also
would be important to have better insight into the structural mechanisms that drive such change,
especially system feedbacks and delays. Hurricane Katrina illustrated with devastating clarity
how the effects of a disaster can be made much worse by systems delays. Additionally, we
should learn more about how responses differ across gender, age, ethnicity, and geographic
region to better understand the diversity of public reaction within a community. Finally, in this
paper we have modeled the diffusion of fear, but we need to better understand how fear
translates into impacts on the economy or the long-term well being of the community.
23

ACKNOWLEDGMENTS
This research was supported by the National Science Foundation under grant number SES
0728934. It was also supported by the United States Department of Homeland Security through
the Center for Risk and Economic Analysis of Terrorism Events (CREATE) under grant number
N00014-05-0630. However, any opinions, findings, and conclusions or recommendations in this
document are those of the authors and do not necessarily reflect views of the United States
Department of Homeland Security.
REFERENCES
[1] Kasperson, Roger E., Ortwin Renn, Paul Slovic, Halina S. Brown, Jacque Emel, Robert
Goble, Jeanne X. Kasperson, and Samuel Ratick. "The Social Amplification of Risk: A
Conceptual Framework." Risk Analysis 8 (1988): 177-87.
[2] Comfort, L. K., ed. Shared Risk: Complex Systems in Seismic Response. New York:
Pergamon, 1999: 3-54.
[3] Maani, K. E., and R. Y. Cavana. Systems Thinking and Modelling: Understanding Change
and Complexity. Auckland, New Zealand: Prentice Hall, 2000.
[4] Lasker, H. D. "Redefining Readiness: Terrorism Planning through the Eyes of the Public."
New York: The New York Academy of Medicine, 2004.
http://www.cacsh.org/pdf/RedefiningReadinessStudy.pdf (accessed February 11, 2004).
[5] Burns, William J., and Paul Slovic. "Public Response to a Terrorist Strike." Risk Analysis
under review (2007).
[6] Burns, W. J., P. Slovic, R. E. Kasperson, J. X. Kasperson, O. Renn, and S. Emani.
"Incorporating Structural Models into Research on the Social Amplification of Risk:
24
Implications for Theory Construction and Decision Making." Risk Analysis 13 (1993):
611-23.
[7] Pidgeon, Nick, Roger E. Kasperson, and Paul Slovic. The Social Amplification of Risk. UK:
Cambridge University Press, 2003: 1-10.
[8] Freudenburg, William R., C. L. Coleman, J. Gonzales, and C. Hegeland. "Media Coverage of
Hazard Events -- Analyzing the Assumptions." Risk Analysis 16, no. 1 (1996): 31-42.
[9] Pidgeon, N. F. "Risk Communication and the Social Amplification of Risk — Phase 1
Scoping Study." London: HSE Books, 1997.
[10] Kasperson, Roger E. "The Social Amplification of Risk: Progress in Developing an
Integrative Framework of Risk." In Social Theories of Risk, edited by Sheldon Krimsky
and Dominic Golding, 153-78. New York: Praeger, 1992.
[11] Freudenburg, William R. "Nothing Recedes Like Success? Risk Analysis and the
Organizational Amplification of Risks." Risk: Issues in Health and Safety 3 (1992): 1-35.
[12] Slovic, Paul. "Perceived Risk, Trust, and Democracy." Risk Analysis 13 (1993): 675-82.
[13] Slovic, Paul, ed. The Perception of Risk. London: Earthscan, 2000.
[14] Flynn, James, Paul Slovic, and Howard Kunreuther, eds. Risk, Media, and Stigma:
Understanding Public Challenges to Modern Science and Technology. London:
Earthscan, 2001.
[15] Slovic, P., Mark Layman, Nancy Kraus, James Flynn, Jim Chalmers, and G. Gesell.
"Perceived Risk, Stigma, and Potential Economic Impacts of a High-Level Nuclear
Waste Repository in Nevada." Risk Analysis 11 (1991): 683-96.
[16] Renn, O. "The Role of Risk Communication and Public Dialog for Improving Risk
Management." Risk Decision and Policy 3 (1998): 5-30.
25

[17] Kasperson, J. X., R. E. Kasperson, N. Pidgeon, and Paul Slovic. "The Social Amplification
of Risk: Assessing Fifteen Years of Research and Theory." In The Social Amplification of
Risk, edited by N. Pidgeon, R. E. Kasperson and Paul Slovic, 13-46. UK: Cambridge
University Press, 2003.
[18] Forrester, J. W. Urban Dynamics. Cambridge, MA: MIT Press, 1969.
[19] Ackoff, R. L. Re-Creating the Corporation: A Design of Organizations for the 21st Century.
New York: Oxford University Press, 1999.
[20] Sterman, J. D. Business Dynamics: Systems Thinking and Modeling for a Complex World.
Boston: McGraw-Hill, 2000: 3-39; 845-891.
[21] Stein, B. D., T. L. Tanielian, D. P. Eisenman, D. J. Keyser, A. Burnam, and H. A. Pincus.
"Emotional and Behavioral Consequences of Bioterrorism: Planning a Public Health
Response." The Milbank Quarterly: A Multidisciplinary Journal of Population Health
Policy 82, no. 3 (2004): 1-32.
http://www.nhoem.state.nh.us/BehavioralHealth/emotional_behavioral.pdf (accessed
February 11, 2005).
[22] Senge, P. M. The Fifth Discipline: The Art and Practice of the Learning Organization. New
York: Doubleday, 1990.
[23] Snyder, L. B., and C. L. Park. "National Studies of Stress Reactions and Media Exposure to
the Attacks." In Communication and Terrorism: Public and Media Responses to 911,
edited by Bradley S. Greenberg, 177-92. Cresskill, NJ: Hampton Press, 2002.
[24] Willis, H. H., A. R. Morral, T. K. Kelly, and J. J. Medby. Estimating Terrorism Risk. Santa
Monica, CA: RAND, Center for Terrorism and Risk Management Policy, 2005.
[25] Burns, W. J., and P. Slovic (2007). http://www.decisionresearch.org/people/burns/
26
APPENDIX
Model Equations:
Stocks (state of system): Bold 12 pt Flows (rate of system change): Bold and Italicized 12 pt Event Parameters: Bold 12 pt Community Intervention Parameter: Bold 12 pt Graphic Functions (description of functional relationship between two variables-they represent the authors’ assessment of what is typically a nonlinear relationship): Response Variable = Graph (Predictor Variable) Model Parameters (fixed inputs): For example, Population = 1,000,000 INIT (Stock initial values prior to simulation): For example, INIT Concerned = 0 UNITS (units of variable): For example, UNITS: person/day Concerned(t) = Concerned(t - dt) + (worry_increasing + fear_decreasing - ignoring - fear_increasing) * dt INIT Concerned = 0 UNITS: person INFLOWS: worry_increasing = MIN(News_Impact_1+Concerned_Talking,1000000) UNITS: person/day fear_decreasing = (Fearful-Target_Fear_Level)/(Community_Intervention_Delay/RP_Intervention_Multiplier) UNITS: person/day OUTFLOWS: ignoring = Concerned/Ignoring_Delay UNITS: person/day fear_increasing = MIN(News_Impact_2+Fearful_Taking,1000000) UNITS: person/day Dead(t) = Dead(t - dt) + (deaths_increasing) * dt INIT Dead = 0 UNITS: person INFLOWS: deaths_increasing = Population_at_Risk/Days_to_Death UNITS: person/day Fearful(t) = Fearful(t - dt) + (fear_increasing - fear_decreasing) * dt INIT Fearful = 0 UNITS: person INFLOWS: fear_increasing = MIN(News_Impact_2+Fearful_Taking,1000000) UNITS: person/day OUTFLOWS: fear_decreasing = (Fearful-Target_Fear_Level)/(Community_Intervention_Delay/RP_Intervention_Multiplier) UNITS: person/day
27

Investigation_Intensity(t) = Investigation_Intensity(t - dt) + (investigation_increasing - investigation_decreasing) * dt INIT Investigation_Intensity = 0 UNITS: Unitless INFLOWS: investigation_increasing = MIN((.1*Casualty_Impact+.85*Risk_Signal+.05*Fear_Impact)*(Resource_Availability/Investigation_Delay),100) UNITS: 1/day OUTFLOWS: investigation_decreasing = Investigation_Intensity/Investigation_length UNITS: 1/day Population_at_Risk(t) = Population_at_Risk(t - dt) + (- deaths_increasing - recovering) * dt INIT Population_at_Risk = 1000 UNITS: person OUTFLOWS: deaths_increasing = Population_at_Risk/Days_to_Death UNITS: person/day recovering = Population_at_Risk/Days_to_Death UNITS: person/day Risk_Perception(t) = Risk_Perception(t - dt) + (perceptions_changing) * dt INIT Risk_Perception = 0 UNITS: Unitless INFLOWS: perceptions_changing = MIN((((Perceived_Invest_Intensity-Risk_Perception)/Risk_Adjustment)*(Awareness/100))-Fear_Reduction_Impact*Risk Perception,100) UNITS: 1/day Status_Quo(t) = Status_Quo(t - dt) + (ignoring - worry_increasing) * dt INIT Status_Quo = Population-Concerned-Fearful UNITS: person INFLOWS: ignoring = Concerned/Ignoring_Delay UNITS: person/day OUTFLOWS: worry_increasing = MIN(News_Impact_1+Concerned_Talking,1000000) UNITS: person/day TV_Coverage(t) = TV_Coverage(t - dt) + (coverage_increasing - coverage_decreasing) * dt INIT TV_Coverage = 0 UNITS: Unitless INFLOWS: coverage_increasing = MIN((.1*Casualty_Impact+.85*(Investigation_Intensity/100)+.05*Fear_Impact)*(Available_Air_Time/Coverage_Delay),100) UNITS: 1/day
28

OUTFLOWS: coverage_decreasing = TV_Coverage/Media_Attention_Span UNITS: 1/day Attention_Base_Rate = 7 UNITS: day Available_Air_Time = Max_Coverage-TV_Coverage UNITS: Unitless Community_Intervention_Delay = 3 (Baseline value but varied over 1, 3 and 5 days) UNITS: day Concerned_Talking = MIN(Talk_Rate_1*Influence_Rate_1*Status_Quo*(Concerned/Population),1000000) UNITS: person/day Contacts_1 = 10 UNITS: contact/day-person Contacts_2 = 10 UNITS: contact/day-person Days_to_Death = 3 (Days to death for explosions were 3 days, for anthrax 5 days) UNITS: day Fearful_Taking = MIN(Talk_Rate_2*Influence_Rate_2*Concerned*(Fearful/Population),1000000) UNITS: person/day Ignoring_Delay = 15 UNITS: day Influence_Rate_1 = RP_Influence_Multiplier UNITS: person/contact Influence_Rate_2 = RP_Influence_Multiplier UNITS: person/contact Investigation_length = 10 (propane explosion =10, bomb blast = 30, anthrax = 60) UNITS: day Max_Coverage = 100 UNITS: Unitless Max_Resources = 100 UNITS: Unitless Media_Attention_Span = MAX((Investigation_Intensity/100)*Attention_Base_Rate,1) UNITS: day News_Impact_1 = MIN((Awareness/100)*RP_News_Multiplier*Status_Quo,1000000) UNITS: person/day News_Impact_2 = MIN((Awareness/100)*RP_News_Multiplier*Concerned,1000000) UNITS: person/day Percent_Concerned = (Concerned/Population)*100 UNITS: Unitless Percent_Fearful = (Fearful/Population)*100 UNITS: Unitless Population = 1000000 UNITS: person Resource_Availability = Max_Resources-Investigation_Intensity
29

UNITS: Unitless Risk_Signal = .3 (propane explosion = .3, bomb blast = .8, anthrax = 1) UNITS: Unitless Talk_Rate_1 = Contacts_1*RP_Talk_Multiplier UNITS: contact/day-person Talk_Rate_2 = Contacts_2*RP_Talk_Multiplier UNITS: contact/day-person Target_Fear_Level = 100000 UNITS: person Awareness = GRAPH(TV_Coverage) (0.00, 0.00), (10.0, 35.0), (20.0, 60.0), (30.0, 75.0), (40.0, 80.0), (50.0, 85.0), (60.0, 86.0), (70.0, 87.0), (80.0, 88.0), (90.0, 89.0), (100, 90.0) UNITS: Unitless Casualty_Impact = GRAPH(Dead) (0.00, 0.00), (25.0, 0.25), (50.0, 0.5), (75.0, 0.75), (100, 1.00), (125, 1.00), (150, 1.00), (175, 1.00), (200, 1.00), (225, 1.00), (250, 1.00), (275, 1.00), (300, 1.00), (325, 1.00), (350, 1.00), (375, 1.00), (400, 1.00), (425, 1.00), (450, 1.00), (475, 1.00), (500, 1.00) UNITS: Unitless Coverage_Delay = GRAPH(TIME) (1.00, 0.125), (2.00, 0.333), (3.00, 0.333), (4.00, 0.667), (5.00, 0.667), (6.00, 0.667), (7.00, 1.00), (8.00, 2.00), (9.00, 4.00), (10.0, 6.00), (11.0, 8.00), (12.0, 10.0), (13.0, 12.0), (14.0, 14.0), (15.0, 24.0), (16.0, 27.0), (17.0, 30.0), (18.0, 33.0), (19.0, 36.0), (20.0, 39.0), (21.0, 42.0), (22.0, 60.0), (23.0, 64.0), (24.0, 68.0), (25.0, 72.0), (26.0, 76.0), (27.0, 84.0), (28.0, 84.0), (29.0, 84.0), (30.0, 84.0) UNITS: day Fear_Impact = GRAPH(Percent_Fearful) (0.00, 0.00), (10.0, 0.1), (20.0, 0.15), (30.0, 0.2), (40.0, 0.3), (50.0, 0.5), (60.0, 0.7), (70.0, 0.8), (80.0, 0.9), (90.0, 0.95), (100, 1.00) UNITS: Unitless Fear_Reduction_Impact = GRAPH(fear_decreasing/Population) (0.00, 0.00), (10.0, 0.05), (20.0, 0.10), (30.0, 0.20), (40.0, 0.20), (50.0, 0.20), (60.0, 0.20), (70.0, 0.20), (80.0, 0.20), (90.0, 0.20), (100, 0.20) UNITS: 1/day Investigation_Delay = GRAPH(TIME) (1.00, 1.00), (2.00, 1.00), (3.00, 1.00), (4.00, 2.00), (5.00, 3.00), (6.00, 4.00), (7.00, 5.00), (8.00, 10.0), (9.00, 12.0), (10.0, 14.0), (11.0, 16.0), (12.0, 18.0), (13.0, 20.0), (14.0, 22.0), (15.0, 36.0), (16.0, 39.0), (17.0, 42.0), (18.0, 45.0), (19.0, 48.0), (20.0, 51.0), (21.0, 54.0), (22.0, 76.0), (23.0, 80.0), (24.0, 84.0), (25.0, 88.0), (26.0, 92.0), (27.0, 96.0), (28.0, 100), (29.0, 100), (30.0, 100) UNITS: day Perceived_Invest_Intensity = GRAPH(Investigation_Intensity) (0.00, 0.00), (10.0, 5.00), (20.0, 10.0), (30.0, 20.0), (40.0, 30.0), (50.0, 50.0), (60.0, 70.0), (70.0, 80.0), (80.0, 90.0), (90.0, 95.0), (100, 100) UNITS: Unitless Risk_Adjustment = GRAPH(Perceived_Invest_Intensity-Risk_Perception)
30

31
(-100, 7.00), (-90.0, 7.00), (-80.0, 7.00), (-70.0, 7.00), (-60.0, 7.00), (-50.0, 7.00), (-40.0, 6.00), (-30.0, 4.00), (-20.0, 2.50), (-10.0, 1.50), (0.00, 1.00), (10.0, 0.75), (20.0, 0.5), (30.0, 0.25), (40.0, 0.25), (50.0, 0.125), (60.0, 0.125), (70.0, 0.125), (80.0, 0.125), (90.0, 0.0625), (100, 0.063) UNITS: day RP_Influence_Multiplier = GRAPH(Risk_Perception) (0.00, 0.00), (10.0, 0.05), (20.0, 0.1), (30.0, 0.2), (40.0, 0.3), (50.0, 0.5), (60.0, 0.7), (70.0, 0.8), (80.0, 0.9), (90.0, 0.95), (100, 1.00) UNITS: person/contact RP_Intervention_Multiplier = GRAPH(Risk_Perception) (0.00, 0.05), (10.0, 0.1), (20.0, 0.15), (30.0, 0.2), (40.0, 0.3), (50.0, 0.5), (60.0, 0.7), (70.0, 0.8), (80.0, 0.9), (90.0, 0.95), (100, 1.00) UNITS: Unitless RP_News_Multiplier = GRAPH(Risk_Perception) (0.00, 0.00), (10.0, 0.05), (20.0, 0.1), (30.0, 0.2), (40.0, 0.3), (50.0, 0.5), (60.0, 0.7), (70.0, 0.8), (80.0, 0.9), (90.0, 0.95), (100, 1.00) UNITS: 1/day RP_Talk_Multiplier = GRAPH(Risk_Perception) (0.00, 0.00), (10.0, 0.01), (20.0, 0.015), (30.0, 0.02), (40.0, 0.025), (50.0, 0.04), (60.0, 0.06), (70.0, 0.1), (80.0, 0.2), (90.0, 0.4), (100, 1.00) UNITS: Unitless