Embed Size (px)
Citation preview
Predicting Residual Tensile Strength of Seven-WireStrands Using That of Single Wires Exposed
to Chloride EnvironmentsRadhakrishna G. Pillai1; Kenneth F. Reinschmidt, P.E., M.ASCE2; David Trejo, P.E., M.ASCE3;
Paolo Gardoni, M.ASCE4; and Mary Beth D. Hueste, P.E., M.ASCE5
Abstract: The steel strands in posttensioned (PT) concrete systems are typically embedded inside cementitious grout for protection from theenvironment. However, strands not embedded in grout have been observed in PT systems. The exposed strand is susceptible to corrosion, andparticularly the location where the strand protrudes from the grout (i.e., grout-air-steel interface) is more vulnerable to corrosion. Prediction ofthe tension capacity (CT ) of strands with such interfaces under various exposure conditions is necessary for structural assessment. Thisprediction could be accomplished by using the data from an experimental program that includes the exposure of strands to various corrosiveenvironments and testing to determine the time-variant residual CT of these strands. However, these tests are cumbersome and expensive,especially when it is necessary to maintain very high tensile stress conditions during the exposure period to simulate the in-service stressconditions on the strands in PT systems. Similar investigations of unstressed single wires are simpler and less expensive. This paper presentsan experimental investigation of the corrosion-induced losses in the CT of unstressed wires, unstressed strands, and stressed strands. Based onthese data, this paper develops probabilistic models to predict the CT of unstressed wires with grout-air-steel interfaces and subjected tovarious moisture and chloride conditions. By using these models for wires and the experimental data on strands, two probabilistic models arethen developed to predict the CT of stressed strands based on the CT of unstressed wires. The developed models can be used to determine theCT of strands with grout-air-steel interfaces subjected to various exposure conditions, provided the CT of corresponding wires under thoseconditions is estimated. DOI: 10.1061/(ASCE)MT.1943-5533.0000933. © 2014 American Society of Civil Engineers.
Author keywords: Probability; Tensile strength; Corrosion; Prestressing; Posttensioning; Wires and strands; Chlorides; Stress; Voids.
Introduction
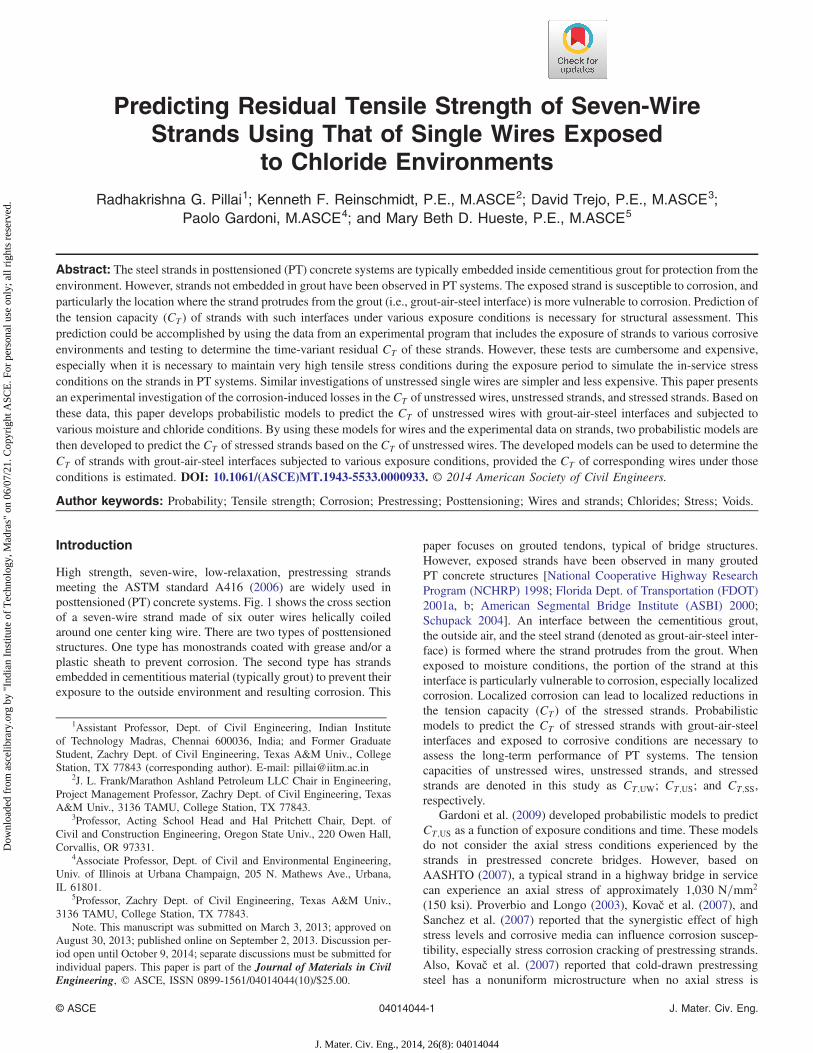
High strength, seven-wire, low-relaxation, prestressing strandsmeeting the ASTM standard A416 (2006) are widely used inposttensioned (PT) concrete systems. Fig. 1 shows the cross sectionof a seven-wire strand made of six outer wires helically coiledaround one center king wire. There are two types of posttensionedstructures. One type has monostrands coated with grease and/or aplastic sheath to prevent corrosion. The second type has strandsembedded in cementitious material (typically grout) to prevent theirexposure to the outside environment and resulting corrosion. This
paper focuses on grouted tendons, typical of bridge structures.However, exposed strands have been observed in many groutedPT concrete structures [National Cooperative Highway ResearchProgram (NCHRP) 1998; Florida Dept. of Transportation (FDOT)2001a, b; American Segmental Bridge Institute (ASBI) 2000;Schupack 2004]. An interface between the cementitious grout,the outside air, and the steel strand (denoted as grout-air-steel inter-face) is formed where the strand protrudes from the grout. Whenexposed to moisture conditions, the portion of the strand at thisinterface is particularly vulnerable to corrosion, especially localizedcorrosion. Localized corrosion can lead to localized reductions inthe tension capacity (CT) of the stressed strands. Probabilisticmodels to predict the CT of stressed strands with grout-air-steelinterfaces and exposed to corrosive conditions are necessary toassess the long-term performance of PT systems. The tensioncapacities of unstressed wires, unstressed strands, and stressedstrands are denoted in this study as CT;UW; CT;US; and CT;SS,respectively.
Gardoni et al. (2009) developed probabilistic models to predictCT;US as a function of exposure conditions and time. These modelsdo not consider the axial stress conditions experienced by thestrands in prestressed concrete bridges. However, based onAASHTO (2007), a typical strand in a highway bridge in servicecan experience an axial stress of approximately 1,030 N=mm2
(150 ksi). Proverbio and Longo (2003), Kovač et al. (2007), andSanchez et al. (2007) reported that the synergistic effect of highstress levels and corrosive media can influence corrosion suscep-tibility, especially stress corrosion cracking of prestressing strands.Also, Kovač et al. (2007) reported that cold-drawn prestressingsteel has a nonuniform microstructure when no axial stress is
1Assistant Professor, Dept. of Civil Engineering, Indian Instituteof Technology Madras, Chennai 600036, India; and Former GraduateStudent, Zachry Dept. of Civil Engineering, Texas A&M Univ., CollegeStation, TX 77843 (corresponding author). E-mail: [email protected]
2J. L. Frank/Marathon Ashland Petroleum LLC Chair in Engineering,Project Management Professor, Zachry Dept. of Civil Engineering, TexasA&M Univ., 3136 TAMU, College Station, TX 77843.
3Professor, Acting School Head and Hal Pritchett Chair, Dept. ofCivil and Construction Engineering, Oregon State Univ., 220 Owen Hall,Corvallis, OR 97331.
4Associate Professor, Dept. of Civil and Environmental Engineering,Univ. of Illinois at Urbana Champaign, 205 N. Mathews Ave., Urbana,IL 61801.
5Professor, Zachry Dept. of Civil Engineering, Texas A&M Univ.,3136 TAMU, College Station, TX 77843.
Note. This manuscript was submitted on March 3, 2013; approved onAugust 30, 2013; published online on September 2, 2013. Discussion per-iod open until October 9, 2014; separate discussions must be submitted forindividual papers. This paper is part of the Journal of Materials in CivilEngineering, © ASCE, ISSN 0899-1561/04014044(10)/$25.00.
© ASCE 04014044-1 J. Mater. Civ. Eng.
J. Mater. Civ. Eng., 2014, 26(8): 04014044
Dow
nloa
ded
from
asc
elib
rary
.org
by
"Ind
ian
Inst
itute
of
Tec
hnol
ogy,
Mad
ras"
on
06/0
7/21
. Cop
yrig
ht A
SCE
. For
per
sona
l use
onl
y; a
ll ri
ghts
res
erve
d.
present, and transgranular cracks can occur at stress levels ofapproximately 0.6 times the ultimate strength. In addition, Trejoet al. (2009b) observed that the time-variant loss in CT;SS could beas high as 27% more than the corresponding loss in CT;US. Thesestudies indicate that CT;SS could be significantly different fromCT;US when exposed to corrosive environments. Therefore, Pillaiet al. (2010) developed a probabilistic model to predict CT;SS(denoted as US-SS model). This model was developed using theexperimental data from the exposure and the tension testing ofunstressed and stressed strands performed by Trejo et al. (2009a).Modification of the US-SS model to suit the exposure conditions,which were not studied by Trejo et al. (2009a), requires additionalcumbersome and expensive testing of strands. A less cumbersomeand less expensive approach is to predict the stressed-strand capac-ity, CT;SS, as a function of unstressed wire capacity, CT;UW. Beforediscussing this modeling approach, a discussion is provided on whythe exposure and tension testing of unstressed and stressed strandsis more expensive and cumbersome than the exposure and tensiontesting of unstressed wires.
Experimental Requirements of Seven-Wire StrandTesting
The exposure and tension testing of unstressed strands requiressignificant resources associated with the tension testing machine,the strand specimen length, and the laboratory storage space withcontrolled environment. Similar testing of stressed strands requiresadditional significant resources associated with the large reactionframes needed to maintain high stress during exposure and signifi-cant laboratory storage space to expose the samples.
The requirements for the tension test machine include largecapacity and the hydraulic grips sufficient to prevent slippage andstress concentration within the grips. Typically, the ASTM A416(2006) strands in as-received conditions (i.e., defined as the con-ditions with negligible corrosion) and with a nominal diameter of13 or 15 mm (0.5 or 0.6 in.) have a minimum ultimate tensilestrength (MUTSstrand) of approximately 182 kN (41 kips) or261 kN (58.6 kips), respectively. Tension test machines meetingthis capacity requirement are very expensive. The gripping forcesand grip lengths are also important to consider for testing. The grip-ping forces, if applied using a standard V-grip that is manuallytightened, are typically not sufficient to resist the large forces dur-ing the tension testing of strands. If the stress concentrations withinthe grips are high, then the strands could fail within or at the edge ofthe grips. To prevent this and avoid erroneous data collection, longgrips [approximately 203 mm (8 in.) long] are needed at both endsof the strand specimen. Therefore, long, powerful, and expensivehydraulic grips are needed.
The total length of strand test specimens is governed by boththe gauge length and grip length (i.e., the length of hydraulic grips).
For a wire or rectangular plate specimen, the AASHTO T244(2002), requires that the cross-sectional area at the center region ofthe specimen be less than that at the end regions, where the spec-imens are gripped. This reduction in area induces more stress atthe center portion, which is defined as the gauge-length region.Because the stress within the gauge-length region is larger than thestress outside the gauge-length region, the specimen will fail withinthe gauge-length region. However, fabrication of a similar gauge-length region on a seven-wire strand specimen is not possible. Thisis because the strand specimen consists of seven wires and themechanisms resisting the tensile stress on a seven-wire strand arecomplex and different from that of a single wire or plate specimen.The pitch of the helically coiled outer wires has to be taken intoaccount while defining the gauge length of a strand test specimen.Considering these, the AASHTO T 244 (2002) specifically definethe gauge length on a strand specimen as the distance between thegrips at the ends of the strand specimen and require a minimumgauge length of 610 mm (24 in.). Considering the required gaugelength and grip lengths, the total length of a typical strand specimenwould be approximately 1,016 mm (40 in.)—the minimum sizeof the testing region on the test machine. Tension testing machineswith this minimum size are very expensive and not available inmost structural testing laboratories.
To simulate the typical stress conditions in bridge elements, ahigh axial stress should be applied to the strands during the entireperiod of the controlled exposure. Large reaction frames are neededto continuously maintain the high stress on the 1,016-mm (40-in.)long strand specimens. This in turn requires large laboratory spacewith controlled environments. This is particularly important whenexposure conditions are numerous and the strands are to be main-tained under constant tensile stress for the entire exposure period.Because of these reasons, the exposure and the tension testing ofstrands are very cumbersome and expensive.
Experimental Requirements of Wire Testing
Typically, the king wires extracted from ASTM A416 (2006)strands in as-received conditions have a nominal diameter of 4.3or 5.1 mm (0.17 or 0.20 in.). The CT of these king wires is typicallyless than 44.5 kN (10 kips). Therefore, the required machine capac-ity for performing tension testing of king wires is only a bit morethan 44.5 kN (10 kips). Such machines are less expensive com-pared with the machines required for strand testing. According toAASHTO T244 (2002) and ASTM A370 (1996), the requiredlength of a wire specimen for tension testing is approximately4 times its nominal diameter. For a king wire specimen, this is20 mm (0.8 in.). In addition, the standard low-cost V-grips with agrip length of 38 mm (1.5 in.) at each end are adequate for grippingthe king wire specimens during tension testing. Considering these,the total required length of a king wire specimen is approximately58 mm (2.3 in.), which is much smaller than the required length of astrand specimen. Because of the smaller specimen length, the lab-oratory space required for the exposure of wire specimens is muchsmaller than that required for strand specimens.
Based on the preceding discussions, the exposure and tensiontesting of unstressed wire specimens is simpler and less expensivethan the exposure and tension testing of unstressed or stressedstrands; and therefore, significant economy can be realized if mod-els correlating the capacity of unstressed wires with that of stressedstrands can be developed. In other words, a less cumbersome andless expensive approach is to predict the stressed-strand capacity,CT;SS, as a function of unstressed wire capacity, CT;UW.
This paper first develops the probabilistic models for unstressedwires (denoted as UW models). The primary contributions of this
Fig. 1. Cross section of seven-wire strands showing a king wire and sixouter wires
© ASCE 04014044-2 J. Mater. Civ. Eng.
J. Mater. Civ. Eng., 2014, 26(8): 04014044
Dow
nloa
ded
from
asc
elib
rary
.org
by
"Ind
ian
Inst
itute
of
Tec
hnol
ogy,
Mad
ras"
on
06/0
7/21
. Cop
yrig
ht A
SCE
. For
per
sona
l use
onl
y; a
ll ri
ghts
res
erve
d.
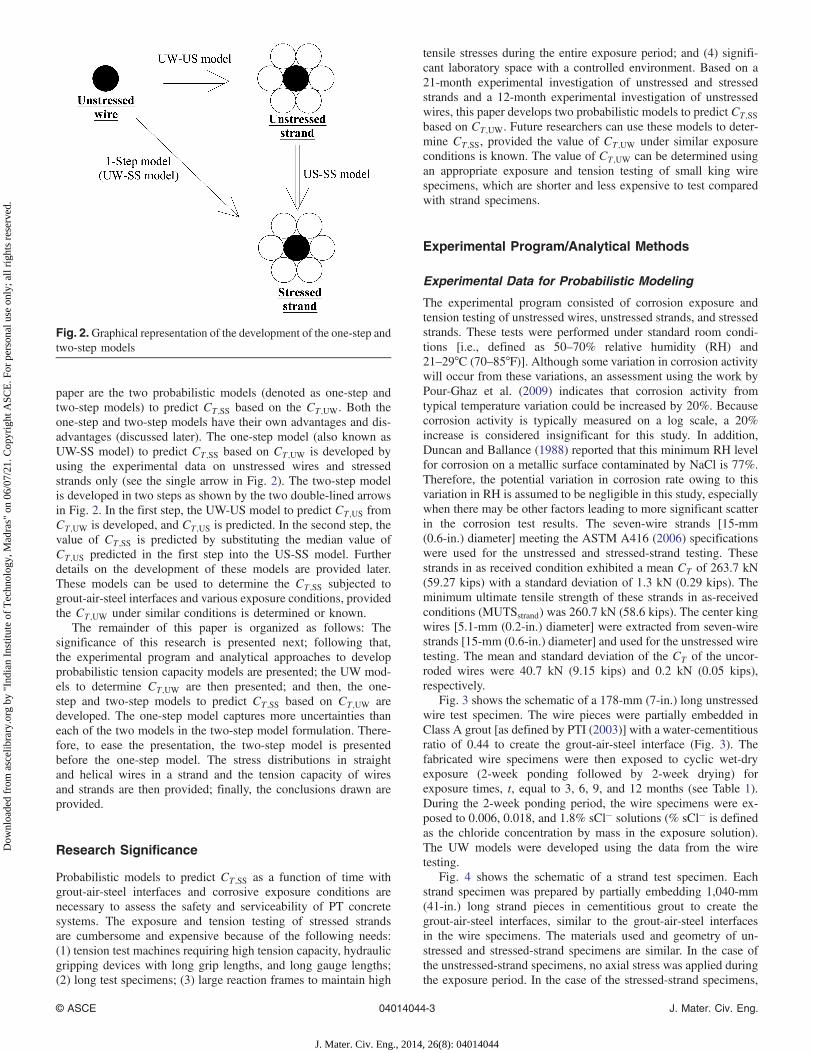
paper are the two probabilistic models (denoted as one-step andtwo-step models) to predict CT;SS based on the CT;UW. Both theone-step and two-step models have their own advantages and dis-advantages (discussed later). The one-step model (also known asUW-SS model) to predict CT;SS based on CT;UW is developed byusing the experimental data on unstressed wires and stressedstrands only (see the single arrow in Fig. 2). The two-step modelis developed in two steps as shown by the two double-lined arrowsin Fig. 2. In the first step, the UW-US model to predict CT;US fromCT;UW is developed, and CT;US is predicted. In the second step, thevalue of CT;SS is predicted by substituting the median value ofCT;US predicted in the first step into the US-SS model. Furtherdetails on the development of these models are provided later.These models can be used to determine the CT;SS subjected togrout-air-steel interfaces and various exposure conditions, providedthe CT;UW under similar conditions is determined or known.
The remainder of this paper is organized as follows: Thesignificance of this research is presented next; following that,the experimental program and analytical approaches to developprobabilistic tension capacity models are presented; the UW mod-els to determine CT;UW are then presented; and then, the one-step and two-step models to predict CT;SS based on CT;UW aredeveloped. The one-step model captures more uncertainties thaneach of the two models in the two-step model formulation. There-fore, to ease the presentation, the two-step model is presentedbefore the one-step model. The stress distributions in straightand helical wires in a strand and the tension capacity of wiresand strands are then provided; finally, the conclusions drawn areprovided.
Research Significance
Probabilistic models to predict CT;SS as a function of time withgrout-air-steel interfaces and corrosive exposure conditions arenecessary to assess the safety and serviceability of PT concretesystems. The exposure and tension testing of stressed strandsare cumbersome and expensive because of the following needs:(1) tension test machines requiring high tension capacity, hydraulicgripping devices with long grip lengths, and long gauge lengths;(2) long test specimens; (3) large reaction frames to maintain high
tensile stresses during the entire exposure period; and (4) signifi-cant laboratory space with a controlled environment. Based on a21-month experimental investigation of unstressed and stressedstrands and a 12-month experimental investigation of unstressedwires, this paper develops two probabilistic models to predict CT;SSbased on CT;UW. Future researchers can use these models to deter-mine CT;SS, provided the value of CT;UW under similar exposureconditions is known. The value of CT;UW can be determined usingan appropriate exposure and tension testing of small king wirespecimens, which are shorter and less expensive to test comparedwith strand specimens.
Experimental Program/Analytical Methods
Experimental Data for Probabilistic Modeling
The experimental program consisted of corrosion exposure andtension testing of unstressed wires, unstressed strands, and stressedstrands. These tests were performed under standard room condi-tions [i.e., defined as 50–70% relative humidity (RH) and21–29°C (70–85°F)]. Although some variation in corrosion activitywill occur from these variations, an assessment using the work byPour-Ghaz et al. (2009) indicates that corrosion activity fromtypical temperature variation could be increased by 20%. Becausecorrosion activity is typically measured on a log scale, a 20%increase is considered insignificant for this study. In addition,Duncan and Ballance (1988) reported that this minimum RH levelfor corrosion on a metallic surface contaminated by NaCl is 77%.Therefore, the potential variation in corrosion rate owing to thisvariation in RH is assumed to be negligible in this study, especiallywhen there may be other factors leading to more significant scatterin the corrosion test results. The seven-wire strands [15-mm(0.6-in.) diameter] meeting the ASTM A416 (2006) specificationswere used for the unstressed and stressed-strand testing. Thesestrands in as received condition exhibited a mean CT of 263.7 kN(59.27 kips) with a standard deviation of 1.3 kN (0.29 kips). Theminimum ultimate tensile strength of these strands in as-receivedconditions (MUTSstrand) was 260.7 kN (58.6 kips). The center kingwires [5.1-mm (0.2-in.) diameter] were extracted from seven-wirestrands [15-mm (0.6-in.) diameter] and used for the unstressed wiretesting. The mean and standard deviation of the CT of the uncor-roded wires were 40.7 kN (9.15 kips) and 0.2 kN (0.05 kips),respectively.
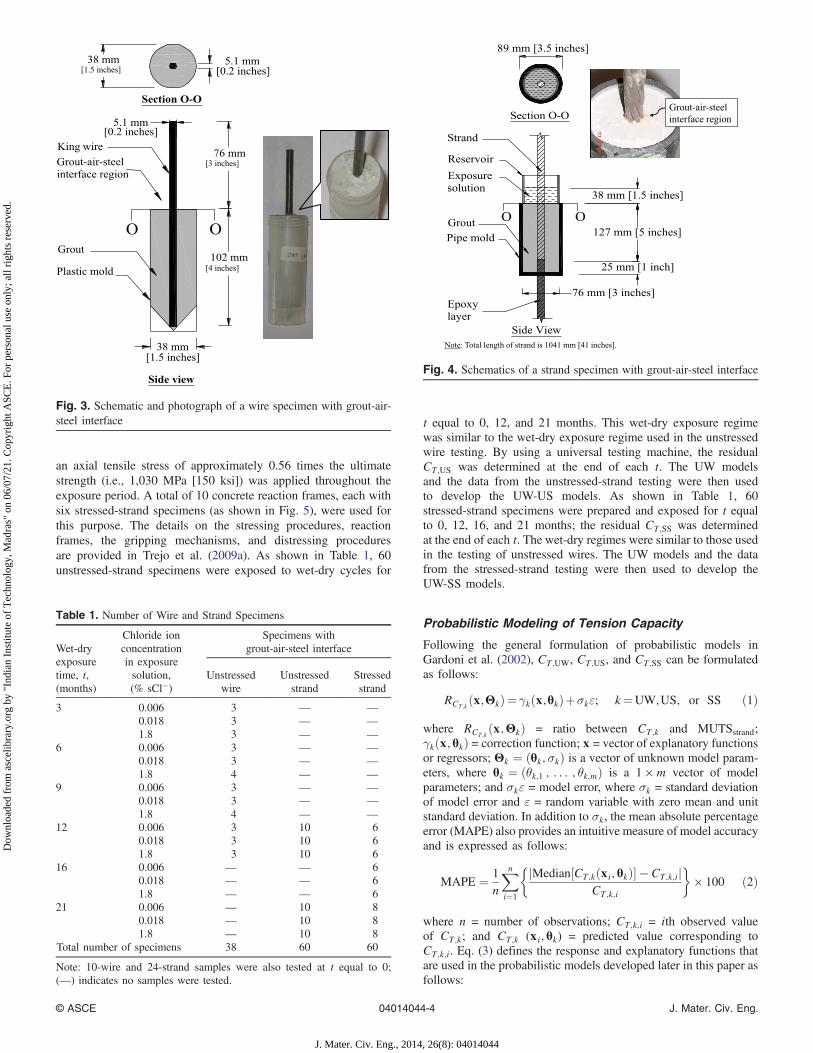
Fig. 3 shows the schematic of a 178-mm (7-in.) long unstressedwire test specimen. The wire pieces were partially embedded inClass A grout [as defined by PTI (2003)] with a water-cementitiousratio of 0.44 to create the grout-air-steel interface (Fig. 3). Thefabricated wire specimens were then exposed to cyclic wet-dryexposure (2-week ponding followed by 2-week drying) forexposure times, t, equal to 3, 6, 9, and 12 months (see Table 1).During the 2-week ponding period, the wire specimens were ex-posed to 0.006, 0.018, and 1.8% sCl− solutions (% sCl− is definedas the chloride concentration by mass in the exposure solution).The UW models were developed using the data from the wiretesting.
Fig. 4 shows the schematic of a strand test specimen. Eachstrand specimen was prepared by partially embedding 1,040-mm(41-in.) long strand pieces in cementitious grout to create thegrout-air-steel interfaces, similar to the grout-air-steel interfacesin the wire specimens. The materials used and geometry of un-stressed and stressed-strand specimens are similar. In the case ofthe unstressed-strand specimens, no axial stress was applied duringthe exposure period. In the case of the stressed-strand specimens,
Fig. 2.Graphical representation of the development of the one-step andtwo-step models
© ASCE 04014044-3 J. Mater. Civ. Eng.
J. Mater. Civ. Eng., 2014, 26(8): 04014044
Dow
nloa
ded
from
asc
elib
rary
.org
by
"Ind
ian
Inst
itute
of
Tec
hnol
ogy,
Mad
ras"
on
06/0
7/21
. Cop
yrig
ht A
SCE
. For
per
sona
l use
onl
y; a
ll ri
ghts
res
erve
d.
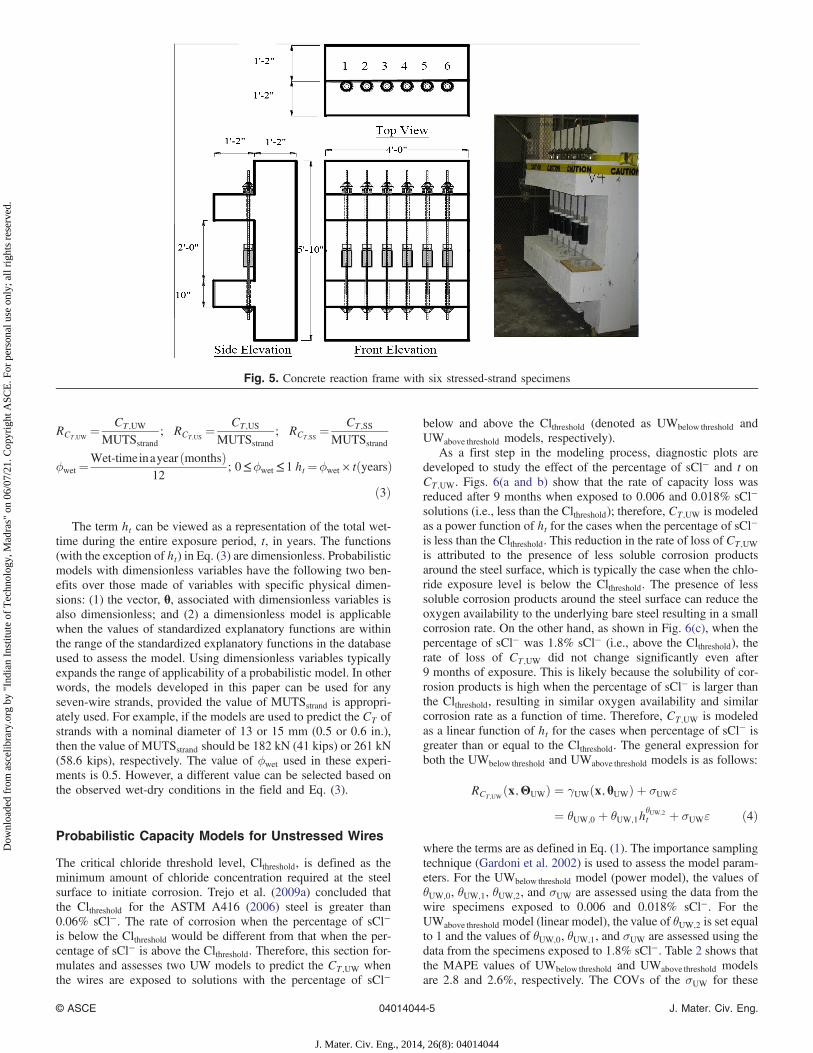
an axial tensile stress of approximately 0.56 times the ultimatestrength (i.e., 1,030 MPa [150 ksi]) was applied throughout theexposure period. A total of 10 concrete reaction frames, each withsix stressed-strand specimens (as shown in Fig. 5), were used forthis purpose. The details on the stressing procedures, reactionframes, the gripping mechanisms, and distressing proceduresare provided in Trejo et al. (2009a). As shown in Table 1, 60unstressed-strand specimens were exposed to wet-dry cycles for
t equal to 0, 12, and 21 months. This wet-dry exposure regimewas similar to the wet-dry exposure regime used in the unstressedwire testing. By using a universal testing machine, the residualCT;US was determined at the end of each t. The UW modelsand the data from the unstressed-strand testing were then usedto develop the UW-US models. As shown in Table 1, 60stressed-strand specimens were prepared and exposed for t equalto 0, 12, 16, and 21 months; the residual CT;SS was determinedat the end of each t. The wet-dry regimes were similar to those usedin the testing of unstressed wires. The UW models and the datafrom the stressed-strand testing were then used to develop theUW-SS models.
Probabilistic Modeling of Tension Capacity
Following the general formulation of probabilistic models inGardoni et al. (2002), CT;UW, CT;US, and CT;SS can be formulatedas follows:
RCT;kðx;ΘkÞ¼ γkðx;θkÞþσkε; k¼UW;US; or SS ð1Þ
where RCT;kðx;ΘkÞ = ratio between CT;k and MUTSstrand;
γkðx; θkÞ = correction function; x = vector of explanatory functionsor regressors; Θk ¼ ðθk; σkÞ is a vector of unknown model param-eters, where θk ¼ ðθk;1 ; : : : ; θk;mÞ is a 1 ×m vector of modelparameters; and σkε = model error, where σk = standard deviationof model error and ε = random variable with zero mean and unitstandard deviation. In addition to σk, the mean absolute percentageerror (MAPE) also provides an intuitive measure of model accuracyand is expressed as follows:
MAPE ¼ 1
n
Xni¼1
�jMedian½CT;kðxi; θkÞ� − CT;k;ijCT;k;i
�× 100 ð2Þ
where n = number of observations; CT;k;i = ith observed valueof CT;k; and CT;k (xi; θk) = predicted value corresponding toCT;k;i. Eq. (3) defines the response and explanatory functions thatare used in the probabilistic models developed later in this paper asfollows:
Fig. 3. Schematic and photograph of a wire specimen with grout-air-steel interface
Table 1. Number of Wire and Strand Specimens
Wet-dryexposuretime, t,(months)
Chloride ionconcentrationin exposuresolution,(% sCl−)
Specimens withgrout-air-steel interface
Unstressedwire
Unstressedstrand
Stressedstrand
3 0.006 3 — —0.018 3 — —1.8 3 — —
6 0.006 3 — —0.018 3 — —1.8 4 — —
9 0.006 3 — —0.018 3 — —1.8 4 — —
12 0.006 3 10 60.018 3 10 61.8 3 10 6
16 0.006 — — 60.018 — — 61.8 — — 6
21 0.006 — 10 80.018 — 10 81.8 — 10 8
Total number of specimens 38 60 60
Note: 10-wire and 24-strand samples were also tested at t equal to 0;(—) indicates no samples were tested.
Fig. 4. Schematics of a strand specimen with grout-air-steel interface
© ASCE 04014044-4 J. Mater. Civ. Eng.
J. Mater. Civ. Eng., 2014, 26(8): 04014044
Dow
nloa
ded
from
asc
elib
rary
.org
by
"Ind
ian
Inst
itute
of
Tec
hnol
ogy,
Mad
ras"
on
06/0
7/21
. Cop
yrig
ht A
SCE
. For
per
sona
l use
onl
y; a
ll ri
ghts
res
erve
d.
RCT;UW¼ CT;UW
MUTSstrand; RCT;US
¼ CT;US
MUTSstrand; RCT;SS
¼ CT;SS
MUTSstrand
ϕwet ¼Wet-timeinayear ðmonthsÞ
12; 0≤ϕwet ≤ 1 ht ¼ϕwet× tðyearsÞ
ð3Þ
The term ht can be viewed as a representation of the total wet-time during the entire exposure period, t, in years. The functions(with the exception of ht) in Eq. (3) are dimensionless. Probabilisticmodels with dimensionless variables have the following two ben-efits over those made of variables with specific physical dimen-sions: (1) the vector, θ, associated with dimensionless variables isalso dimensionless; and (2) a dimensionless model is applicablewhen the values of standardized explanatory functions are withinthe range of the standardized explanatory functions in the databaseused to assess the model. Using dimensionless variables typicallyexpands the range of applicability of a probabilistic model. In otherwords, the models developed in this paper can be used for anyseven-wire strands, provided the value of MUTSstrand is appropri-ately used. For example, if the models are used to predict the CT ofstrands with a nominal diameter of 13 or 15 mm (0.5 or 0.6 in.),then the value of MUTSstrand should be 182 kN (41 kips) or 261 kN(58.6 kips), respectively. The value of ϕwet used in these experi-ments is 0.5. However, a different value can be selected based onthe observed wet-dry conditions in the field and Eq. (3).
Probabilistic Capacity Models for Unstressed Wires
The critical chloride threshold level, Clthreshold, is defined as theminimum amount of chloride concentration required at the steelsurface to initiate corrosion. Trejo et al. (2009a) concluded thatthe Clthreshold for the ASTM A416 (2006) steel is greater than0.06% sCl−. The rate of corrosion when the percentage of sCl−is below the Clthreshold would be different from that when the per-centage of sCl− is above the Clthreshold. Therefore, this section for-mulates and assesses two UW models to predict the CT;UW whenthe wires are exposed to solutions with the percentage of sCl−
below and above the Clthreshold (denoted as UWbelow threshold andUWabove threshold models, respectively).
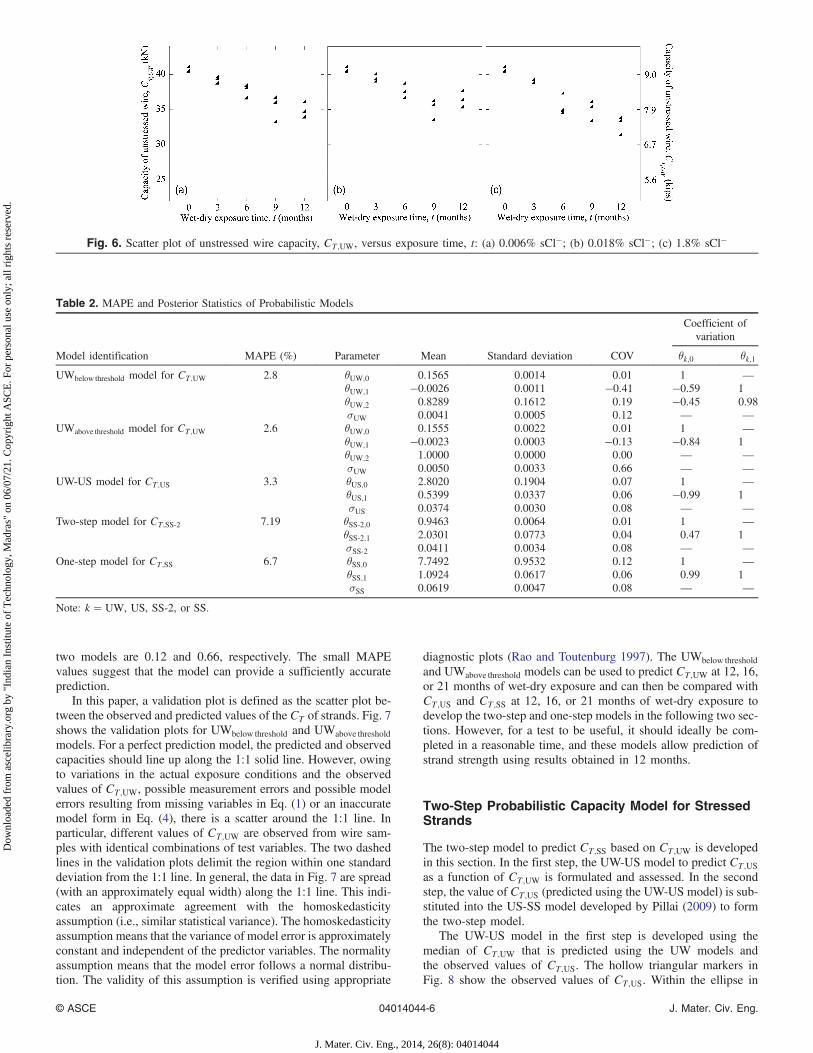
As a first step in the modeling process, diagnostic plots aredeveloped to study the effect of the percentage of sCl− and t onCT;UW. Figs. 6(a and b) show that the rate of capacity loss wasreduced after 9 months when exposed to 0.006 and 0.018% sCl−solutions (i.e., less than the Clthreshold); therefore, CT;UW is modeledas a power function of ht for the cases when the percentage of sCl−is less than the Clthreshold. This reduction in the rate of loss of CT;UWis attributed to the presence of less soluble corrosion productsaround the steel surface, which is typically the case when the chlo-ride exposure level is below the Clthreshold. The presence of lesssoluble corrosion products around the steel surface can reduce theoxygen availability to the underlying bare steel resulting in a smallcorrosion rate. On the other hand, as shown in Fig. 6(c), when thepercentage of sCl− was 1.8% sCl− (i.e., above the Clthreshold), therate of loss of CT;UW did not change significantly even after9 months of exposure. This is likely because the solubility of cor-rosion products is high when the percentage of sCl− is larger thanthe Clthreshold, resulting in similar oxygen availability and similarcorrosion rate as a function of time. Therefore, CT;UW is modeledas a linear function of ht for the cases when percentage of sCl− isgreater than or equal to the Clthreshold. The general expression forboth the UWbelow threshold and UWabove threshold models is as follows:
RCT;UWðx;ΘUWÞ ¼ γUWðx; θUWÞ þ σUWε
¼ θUW;0 þ θUW;1hθUW;2t þ σUWε ð4Þ
where the terms are as defined in Eq. (1). The importance samplingtechnique (Gardoni et al. 2002) is used to assess the model param-eters. For the UWbelow threshold model (power model), the values ofθUW;0, θUW;1, θUW;2, and σUW are assessed using the data from thewire specimens exposed to 0.006 and 0.018% sCl−. For theUWabove threshold model (linear model), the value of θUW;2 is set equalto 1 and the values of θUW;0, θUW;1, and σUW are assessed using thedata from the specimens exposed to 1.8% sCl−. Table 2 shows thatthe MAPE values of UWbelow threshold and UWabove threshold modelsare 2.8 and 2.6%, respectively. The COVs of the σUW for these
Fig. 5. Concrete reaction frame with six stressed-strand specimens
© ASCE 04014044-5 J. Mater. Civ. Eng.
J. Mater. Civ. Eng., 2014, 26(8): 04014044
Dow
nloa
ded
from
asc
elib
rary
.org
by
"Ind
ian
Inst
itute
of
Tec
hnol
ogy,
Mad
ras"
on
06/0
7/21
. Cop
yrig
ht A
SCE
. For
per
sona
l use
onl
y; a
ll ri
ghts
res
erve
d.
two models are 0.12 and 0.66, respectively. The small MAPEvalues suggest that the model can provide a sufficiently accurateprediction.
In this paper, a validation plot is defined as the scatter plot be-tween the observed and predicted values of the CT of strands. Fig. 7shows the validation plots for UWbelow threshold and UWabove thresholdmodels. For a perfect prediction model, the predicted and observedcapacities should line up along the 1∶1 solid line. However, owingto variations in the actual exposure conditions and the observedvalues of CT;UW, possible measurement errors and possible modelerrors resulting from missing variables in Eq. (1) or an inaccuratemodel form in Eq. (4), there is a scatter around the 1∶1 line. Inparticular, different values of CT;UW are observed from wire sam-ples with identical combinations of test variables. The two dashedlines in the validation plots delimit the region within one standarddeviation from the 1∶1 line. In general, the data in Fig. 7 are spread(with an approximately equal width) along the 1∶1 line. This indi-cates an approximate agreement with the homoskedasticityassumption (i.e., similar statistical variance). The homoskedasticityassumption means that the variance of model error is approximatelyconstant and independent of the predictor variables. The normalityassumption means that the model error follows a normal distribu-tion. The validity of this assumption is verified using appropriate
diagnostic plots (Rao and Toutenburg 1997). The UWbelow thresholdand UWabove threshold models can be used to predict CT;UW at 12, 16,or 21 months of wet-dry exposure and can then be compared withCT;US and CT;SS at 12, 16, or 21 months of wet-dry exposure todevelop the two-step and one-step models in the following two sec-tions. However, for a test to be useful, it should ideally be com-pleted in a reasonable time, and these models allow prediction ofstrand strength using results obtained in 12 months.
Two-Step Probabilistic Capacity Model for StressedStrands
The two-step model to predict CT;SS based on CT;UW is developedin this section. In the first step, the UW-US model to predict CT;USas a function of CT;UW is formulated and assessed. In the secondstep, the value of CT;US (predicted using the UW-US model) is sub-stituted into the US-SS model developed by Pillai (2009) to formthe two-step model.
The UW-US model in the first step is developed using themedian of CT;UW that is predicted using the UW models andthe observed values of CT;US. The hollow triangular markers inFig. 8 show the observed values of CT;US. Within the ellipse in
Fig. 6. Scatter plot of unstressed wire capacity, CT;UW, versus exposure time, t: (a) 0.006% sCl−; (b) 0.018% sCl−; (c) 1.8% sCl−
Table 2. MAPE and Posterior Statistics of Probabilistic Models
Model identification MAPE (%) Parameter Mean Standard deviation COV
Coefficient ofvariation
θk;0 θk;1
UWbelow threshold model for CT;UW 2.8 θUW;0 0.1565 0.0014 0.01 1 —θUW;1 −0.0026 0.0011 −0.41 −0.59 1θUW;2 0.8289 0.1612 0.19 −0.45 0.98σUW 0.0041 0.0005 0.12 — —
UWabove threshold model for CT;UW 2.6 θUW;0 0.1555 0.0022 0.01 1 —θUW;1 −0.0023 0.0003 −0.13 −0.84 1θUW;2 1.0000 0.0000 0.00 — —σUW 0.0050 0.0033 0.66 — —
UW-US model for CT;US 3.3 θUS;0 2.8020 0.1904 0.07 1 —θUS;1 0.5399 0.0337 0.06 −0.99 1σUS 0.0374 0.0030 0.08 — —
Two-step model for CT;SS-2 7.19 θSS-2;0 0.9463 0.0064 0.01 1 —θSS-2;1 2.0301 0.0773 0.04 0.47 1σSS-2 0.0411 0.0034 0.08 — —
One-step model for CT;SS 6.7 θSS;0 7.7492 0.9532 0.12 1 —θSS;1 1.0924 0.0617 0.06 0.99 1σSS 0.0619 0.0047 0.08 — —
Note: k ¼ UW, US, SS-2, or SS.
© ASCE 04014044-6 J. Mater. Civ. Eng.
J. Mater. Civ. Eng., 2014, 26(8): 04014044
Dow
nloa
ded
from
asc
elib
rary
.org
by
"Ind
ian
Inst
itute
of
Tec
hnol
ogy,
Mad
ras"
on
06/0
7/21
. Cop
yrig
ht A
SCE
. For
per
sona
l use
onl
y; a
ll ri
ghts
res
erve
d.
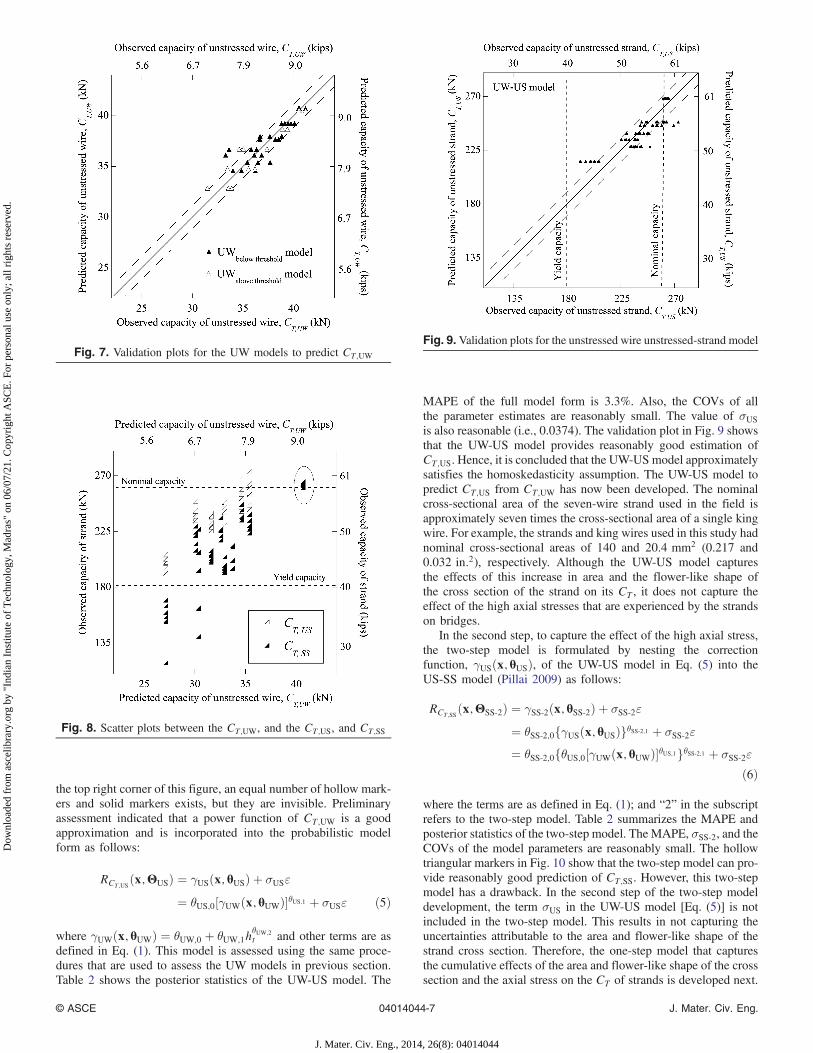
the top right corner of this figure, an equal number of hollow mark-ers and solid markers exists, but they are invisible. Preliminaryassessment indicated that a power function of CT;UW is a goodapproximation and is incorporated into the probabilistic modelform as follows:
RCT;USðx;ΘUSÞ ¼ γUSðx; θUSÞ þ σUSε
¼ θUS;0½γUWðx; θUWÞ�θUS;1 þ σUSε ð5Þ
where γUWðx; θUWÞ ¼ θUW;0 þ θUW;1hθUW;2t and other terms are as
defined in Eq. (1). This model is assessed using the same proce-dures that are used to assess the UW models in previous section.Table 2 shows the posterior statistics of the UW-US model. The
MAPE of the full model form is 3.3%. Also, the COVs of allthe parameter estimates are reasonably small. The value of σUSis also reasonable (i.e., 0.0374). The validation plot in Fig. 9 showsthat the UW-US model provides reasonably good estimation ofCT;US. Hence, it is concluded that the UW-US model approximatelysatisfies the homoskedasticity assumption. The UW-US model topredict CT;US from CT;UW has now been developed. The nominalcross-sectional area of the seven-wire strand used in the field isapproximately seven times the cross-sectional area of a single kingwire. For example, the strands and king wires used in this study hadnominal cross-sectional areas of 140 and 20.4 mm2 (0.217 and0.032 in:2), respectively. Although the UW-US model capturesthe effects of this increase in area and the flower-like shape ofthe cross section of the strand on its CT , it does not capture theeffect of the high axial stresses that are experienced by the strandson bridges.
In the second step, to capture the effect of the high axial stress,the two-step model is formulated by nesting the correctionfunction, γUSðx; θUSÞ, of the UW-US model in Eq. (5) into theUS-SS model (Pillai 2009) as follows:
RCT;SSðx;ΘSS-2Þ ¼ γSS-2ðx; θSS-2Þ þ σSS-2ε
¼ θSS-2;0fγUSðx; θUSÞgθSS-2;1 þ σSS-2ε
¼ θSS-2;0fθUS;0½γUWðx; θUWÞ�θUS;1gθSS-2;1 þ σSS-2ε
ð6Þ
where the terms are as defined in Eq. (1); and “2” in the subscriptrefers to the two-step model. Table 2 summarizes the MAPE andposterior statistics of the two-step model. The MAPE, σSS-2, and theCOVs of the model parameters are reasonably small. The hollowtriangular markers in Fig. 10 show that the two-step model can pro-vide reasonably good prediction of CT;SS. However, this two-stepmodel has a drawback. In the second step of the two-step modeldevelopment, the term σUS in the UW-US model [Eq. (5)] is notincluded in the two-step model. This results in not capturing theuncertainties attributable to the area and flower-like shape of thestrand cross section. Therefore, the one-step model that capturesthe cumulative effects of the area and flower-like shape of the crosssection and the axial stress on the CT of strands is developed next.
Fig. 7. Validation plots for the UW models to predict CT;UW
Fig. 8. Scatter plots between the CT;UW, and the CT;US, and CT;SS
Fig. 9.Validation plots for the unstressed wire unstressed-strand model
© ASCE 04014044-7 J. Mater. Civ. Eng.
J. Mater. Civ. Eng., 2014, 26(8): 04014044
Dow
nloa
ded
from
asc
elib
rary
.org
by
"Ind
ian
Inst
itute
of
Tec
hnol
ogy,
Mad
ras"
on
06/0
7/21
. Cop
yrig
ht A
SCE
. For
per
sona
l use
onl
y; a
ll ri
ghts
res
erve
d.
One-Step Probabilistic Capacity Model for StressedStrands
This section presents the development of the one-step model usingthe median predicted values of CT;UW and the observed data onCT;SS. The solid triangular markers in Fig. 8 show the scatter plotbetween CT;UW and CT;SS. Each CT;UW value is predicted using theUW models. A preliminary analysis of these data indicated thatCT;SS can be expressed as a power function of CT;UW. FollowingEq. (1), the probabilistic model for CT;SS is formulated as follows:
RCT;SSðx;ΘSSÞ ¼ γðx; θSSÞ þ σSSε
¼ θSS;0½γðx; θUWÞ�θSS;1 þ σSSε ð7Þ
where γðx; θUWÞ ¼ θUW;0 þ θUW;1hθUW;2t and the other terms are as
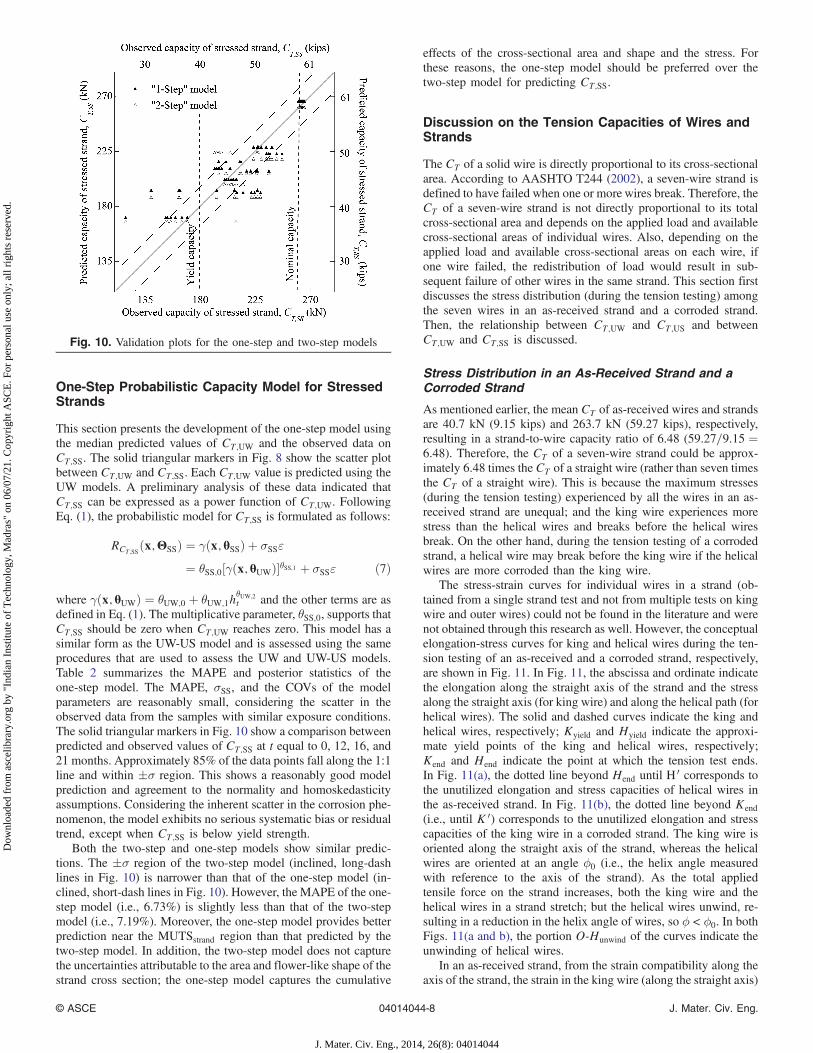
defined in Eq. (1). The multiplicative parameter, θSS;0, supports thatCT;SS should be zero when CT;UW reaches zero. This model has asimilar form as the UW-US model and is assessed using the sameprocedures that are used to assess the UW and UW-US models.Table 2 summarizes the MAPE and posterior statistics of theone-step model. The MAPE, σSS, and the COVs of the modelparameters are reasonably small, considering the scatter in theobserved data from the samples with similar exposure conditions.The solid triangular markers in Fig. 10 show a comparison betweenpredicted and observed values of CT;SS at t equal to 0, 12, 16, and21 months. Approximately 85% of the data points fall along the 1∶1line and within �σ region. This shows a reasonably good modelprediction and agreement to the normality and homoskedasticityassumptions. Considering the inherent scatter in the corrosion phe-nomenon, the model exhibits no serious systematic bias or residualtrend, except when CT;SS is below yield strength.
Both the two-step and one-step models show similar predic-tions. The �σ region of the two-step model (inclined, long-dashlines in Fig. 10) is narrower than that of the one-step model (in-clined, short-dash lines in Fig. 10). However, the MAPE of the one-step model (i.e., 6.73%) is slightly less than that of the two-stepmodel (i.e., 7.19%). Moreover, the one-step model provides betterprediction near the MUTSstrand region than that predicted by thetwo-step model. In addition, the two-step model does not capturethe uncertainties attributable to the area and flower-like shape of thestrand cross section; the one-step model captures the cumulative
effects of the cross-sectional area and shape and the stress. Forthese reasons, the one-step model should be preferred over thetwo-step model for predicting CT;SS.
Discussion on the Tension Capacities of Wires andStrands
The CT of a solid wire is directly proportional to its cross-sectionalarea. According to AASHTO T244 (2002), a seven-wire strand isdefined to have failed when one or more wires break. Therefore, theCT of a seven-wire strand is not directly proportional to its totalcross-sectional area and depends on the applied load and availablecross-sectional areas of individual wires. Also, depending on theapplied load and available cross-sectional areas on each wire, ifone wire failed, the redistribution of load would result in sub-sequent failure of other wires in the same strand. This section firstdiscusses the stress distribution (during the tension testing) amongthe seven wires in an as-received strand and a corroded strand.Then, the relationship between CT;UW and CT;US and betweenCT;UW and CT;SS is discussed.
Stress Distribution in an As-Received Strand and aCorroded Strand
As mentioned earlier, the mean CT of as-received wires and strandsare 40.7 kN (9.15 kips) and 263.7 kN (59.27 kips), respectively,resulting in a strand-to-wire capacity ratio of 6.48 (59.27=9.15 ¼6.48). Therefore, the CT of a seven-wire strand could be approx-imately 6.48 times the CT of a straight wire (rather than seven timesthe CT of a straight wire). This is because the maximum stresses(during the tension testing) experienced by all the wires in an as-received strand are unequal; and the king wire experiences morestress than the helical wires and breaks before the helical wiresbreak. On the other hand, during the tension testing of a corrodedstrand, a helical wire may break before the king wire if the helicalwires are more corroded than the king wire.
The stress-strain curves for individual wires in a strand (ob-tained from a single strand test and not from multiple tests on kingwire and outer wires) could not be found in the literature and werenot obtained through this research as well. However, the conceptualelongation-stress curves for king and helical wires during the ten-sion testing of an as-received and a corroded strand, respectively,are shown in Fig. 11. In Fig. 11, the abscissa and ordinate indicatethe elongation along the straight axis of the strand and the stressalong the straight axis (for king wire) and along the helical path (forhelical wires). The solid and dashed curves indicate the king andhelical wires, respectively; Kyield and Hyield indicate the approxi-mate yield points of the king and helical wires, respectively;Kend and Hend indicate the point at which the tension test ends.In Fig. 11(a), the dotted line beyond Hend until H 0 corresponds tothe unutilized elongation and stress capacities of helical wires inthe as-received strand. In Fig. 11(b), the dotted line beyond Kend(i.e., until K 0) corresponds to the unutilized elongation and stresscapacities of the king wire in a corroded strand. The king wire isoriented along the straight axis of the strand, whereas the helicalwires are oriented at an angle ϕ0 (i.e., the helix angle measuredwith reference to the axis of the strand). As the total appliedtensile force on the strand increases, both the king wire and thehelical wires in a strand stretch; but the helical wires unwind, re-sulting in a reduction in the helix angle of wires, so ϕ < ϕ0. In bothFigs. 11(a and b), the portion O-Hunwind of the curves indicate theunwinding of helical wires.
In an as-received strand, from the strain compatibility along theaxis of the strand, the strain in the king wire (along the straight axis)
Fig. 10. Validation plots for the one-step and two-step models
© ASCE 04014044-8 J. Mater. Civ. Eng.
J. Mater. Civ. Eng., 2014, 26(8): 04014044
Dow
nloa
ded
from
asc
elib
rary
.org
by
"Ind
ian
Inst
itute
of
Tec
hnol
ogy,
Mad
ras"
on
06/0
7/21
. Cop
yrig
ht A
SCE
. For
per
sona
l use
onl
y; a
ll ri
ghts
res
erve
d.
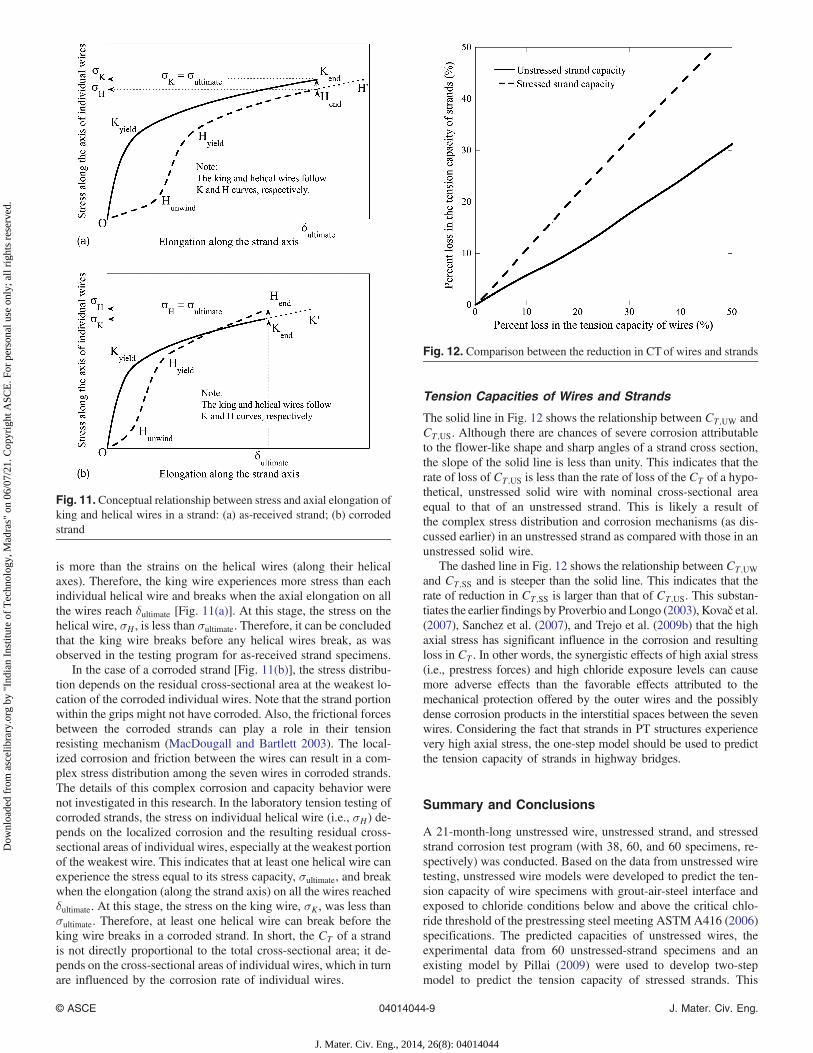
is more than the strains on the helical wires (along their helicalaxes). Therefore, the king wire experiences more stress than eachindividual helical wire and breaks when the axial elongation on allthe wires reach δultimate [Fig. 11(a)]. At this stage, the stress on thehelical wire, σH , is less than σultimate. Therefore, it can be concludedthat the king wire breaks before any helical wires break, as wasobserved in the testing program for as-received strand specimens.
In the case of a corroded strand [Fig. 11(b)], the stress distribu-tion depends on the residual cross-sectional area at the weakest lo-cation of the corroded individual wires. Note that the strand portionwithin the grips might not have corroded. Also, the frictional forcesbetween the corroded strands can play a role in their tensionresisting mechanism (MacDougall and Bartlett 2003). The local-ized corrosion and friction between the wires can result in a com-plex stress distribution among the seven wires in corroded strands.The details of this complex corrosion and capacity behavior werenot investigated in this research. In the laboratory tension testing ofcorroded strands, the stress on individual helical wire (i.e., σH) de-pends on the localized corrosion and the resulting residual cross-sectional areas of individual wires, especially at the weakest portionof the weakest wire. This indicates that at least one helical wire canexperience the stress equal to its stress capacity, σultimate, and breakwhen the elongation (along the strand axis) on all the wires reachedδultimate. At this stage, the stress on the king wire, σK , was less thanσultimate. Therefore, at least one helical wire can break before theking wire breaks in a corroded strand. In short, the CT of a strandis not directly proportional to the total cross-sectional area; it de-pends on the cross-sectional areas of individual wires, which in turnare influenced by the corrosion rate of individual wires.
Tension Capacities of Wires and Strands
The solid line in Fig. 12 shows the relationship between CT;UW andCT;US. Although there are chances of severe corrosion attributableto the flower-like shape and sharp angles of a strand cross section,the slope of the solid line is less than unity. This indicates that therate of loss of CT;US is less than the rate of loss of the CT of a hypo-thetical, unstressed solid wire with nominal cross-sectional areaequal to that of an unstressed strand. This is likely a result ofthe complex stress distribution and corrosion mechanisms (as dis-cussed earlier) in an unstressed strand as compared with those in anunstressed solid wire.
The dashed line in Fig. 12 shows the relationship between CT;UWand CT;SS and is steeper than the solid line. This indicates that therate of reduction in CT;SS is larger than that of CT;US. This substan-tiates the earlier findings by Proverbio and Longo (2003), Kovač et al.(2007), Sanchez et al. (2007), and Trejo et al. (2009b) that the highaxial stress has significant influence in the corrosion and resultingloss in CT . In other words, the synergistic effects of high axial stress(i.e., prestress forces) and high chloride exposure levels can causemore adverse effects than the favorable effects attributed to themechanical protection offered by the outer wires and the possiblydense corrosion products in the interstitial spaces between the sevenwires. Considering the fact that strands in PT structures experiencevery high axial stress, the one-step model should be used to predictthe tension capacity of strands in highway bridges.
Summary and Conclusions
A 21-month-long unstressed wire, unstressed strand, and stressedstrand corrosion test program (with 38, 60, and 60 specimens, re-spectively) was conducted. Based on the data from unstressed wiretesting, unstressed wire models were developed to predict the ten-sion capacity of wire specimens with grout-air-steel interface andexposed to chloride conditions below and above the critical chlo-ride threshold of the prestressing steel meeting ASTM A416 (2006)specifications. The predicted capacities of unstressed wires, theexperimental data from 60 unstressed-strand specimens and anexisting model by Pillai (2009) were used to develop two-stepmodel to predict the tension capacity of stressed strands. This
Fig. 11. Conceptual relationship between stress and axial elongation ofking and helical wires in a strand: (a) as-received strand; (b) corrodedstrand
Fig. 12. Comparison between the reduction in CT of wires and strands
© ASCE 04014044-9 J. Mater. Civ. Eng.
J. Mater. Civ. Eng., 2014, 26(8): 04014044
Dow
nloa
ded
from
asc
elib
rary
.org
by
"Ind
ian
Inst
itute
of
Tec
hnol
ogy,
Mad
ras"
on
06/0
7/21
. Cop
yrig
ht A
SCE
. For
per
sona
l use
onl
y; a
ll ri
ghts
res
erve
d.
two-step model has the following three merits: (1) It is possible tolearn about the behavior of unstressed strands based on the un-stressed wire behavior; (2) more is learned about the behaviorof stressed strand by breaking down the differences in the behaviorbetween stressed strand and unstressed wires into the contributionthat results from considering a strand instead of a wire when theyare both unstressed and owing to adding a tension force (i.e., goingfrom unstressed strands to stressed strands); and (3) if data areavailable on unstressed strands, the second model in the two-stepformulation can be used to compute the response of stressedstrands. Therefore, in the future, testing can be done on unstressedstrands and then the response of stressed strands can be computedusing the second model in the two-step formulation. However, thetwo-step model has a demerit of not being able to explicitly capturethe uncertainty attributed to the area and flower-like shape ofthe strand cross section. Therefore, the predicted capacities ofunstressed wires and the experimental data from 60 stressed-strandspecimens were used to develop the one-step model to predict thetension capacity of stressed strands. The one-step model capturesthe cumulative uncertainty attributable to the area, shape of thestrand cross section, and the applied stress. The developed modelscan be used to predict the tension capacity of strands subjected tovarious exposure conditions, provided the tension capacity ofunstressed wires subjected to similar exposure conditions andthe minimum ultimate tensile strength of strands (MUTSstrand) areknown. It was also found that the tension capacity of a strand is notdirectly proportional to the total cross-sectional area; it depends onthe cross-sectional areas of individual wires, which in turn is influ-enced by the corrosion rates of individual wires. The differences inthe stress-strain behavior of individual wires in strands with varyingdegrees of corrosion deserve investigation.
Acknowledgments
This research was performed at Texas Transportation Instituteand Zachry Department of Civil Engineering, Texas A&M Univer-sity, College Station, Texas, through the sponsored project No.0-4588 (2003-2008) from the Texas Department of Transportation(TxDOT), Austin, Texas. The authors also acknowledge the assis-tance from Mr. Jeff Perry, Mr. Matt Potter, Mr. Scott Crauneur,Mr. Scott Dobrovolny, Mr. Robert Kocman, Mr. Ramesh Kumar,and Prof. Daren Cline.
References
AASHTOT244. (2002). “Standard method of test for mechanical testing ofsteel products.” Washington, DC.
AASHTO. (2007). “AASHTO LRFD bridge design specifications.”Washington, DC.
American Segmental Bridge Institute (ASBI). (2000). “American segmen-tal bridge institute grouting committee, interim statement on groutingpractices.” Phoenix, AZ.
ASTM A370. (1996). “Standard test methods and definitions for mechani-cal testing of steel products.” West Conshohocken, PA.
ASTM A416. (2006). “Standard specification for steel strand, uncoatedseven-wire for prestressed concrete.” West Conshohocken, PA.
Duncan, J. R., and Ballance, J. A. (1988). “Marine salts contribution toatmospheric corrosion.” Degradation of metals in the Atmosphere,ASTM STP 965, S. W. Dean and T. S. Lee, eds., ASTM, WestConshohocken, PA, 317–326.
Florida Dept. of Transportation (FDOT). (2001a). “Mid-bay bridge post-tensioning evaluation—Final report.” Corven Engineering, Tallahassee,FL.
Florida Dept. of Transportation (FDOT). (2001b). “Sunshine skywaybridge post-tensioned tendons investigation.” Parsons BrinckerhoffQuade and Douglas, Tallahasse, FL.
Gardoni, P., Pillai, R. G., Trejo, D., Hueste, M. D., and Reinschmidt, K.(2009). “Probabilistic capacity models for corroding posttensioningstrands calibrated using laboratory results.” J. Eng. Mech., 10.1061/(ASCE)EM.1943-7889.0000021, 906–916.
Gardoni, P. G., Der Kiureghian, A., Mosalam, K. M. (2002). “Probabilisticcapacity models and fragility estimates for reinforced concrete columnsbased on experimental observations.” J. Eng. Mech., 10.1061/(ASCE)0733-9399(2002)128:10(1024), 1024–1038.
Kovač, J., Leban, M., and Legat, A. (2007). “Detection of SCC on pre-stressing steel wire by the simultaneous use of electrochemical noiseand acoustic emission measurements.” Electrochemica Acta, 52(27),7607–7616.
MacDougall, C., and Bartlett, F. M. (2003). “Tests of unbonded seven-wiretendon with broken outer wires.” ACI Mater. J., 100(5), 581–588.
National Cooperative Highway Research Program (NCHRP). (1998).“Durability of precast segmental bridges.” NCHRP Web DocumentNo. 15, Project 20-7/Task 92, R. W. Poston and J. P. Wouters, Trans-portation Research Board, National Research Council, Washington,DC.
Pillai, R. G. (2009). “Electrochemical characterization and time-variantstructural reliability assessment of post-tensioned, segmental concretebridges.” Ph.D. dissertation, Zachry Dept. of Civil Engineering, TexasA&M Univ., College Station, TX.
Pillai, R. G., Gardoni, P., Trejo, D., Hueste, M. D., and Reinschmidt, K.(2010). “Probabilistic models for the tensile strength of corrodingstrands in posttensioned, segmental concrete bridges.” J. Mater. Civ.Eng., 10.1061/(ASCE)MT.1943-5533.0000096, 967–977.
Post-Tensioning Institute (PTI). (2003). “Specification for grouting of post-tensioned structures.” Phoenix, AZ.
Pour-Ghaz, M., Burkan Isgor, O., and Ghods, P. (2009). “The effect oftemperature on the corrosion of steel in concrete. Part I: Simulatedpolarization resistance tests and model development.” Corrosion Sci.,51(2), 415–425.
Proverbio, E., and Longo, P. (2003). “Failure mechanisms of high strengthsteels in bicarbonate solutions under anodic polarization.” CorrosionSci., 45(9), 2017–2030.
Rao, C. R., and Toutenburg, H. (1997). Linear models, least squares andalternatives, Springer, New York.
Sanchez, J., Fullea, J., Andrade, C., and Alonso, C. (2007). “Stresscorrosion cracking mechanism of prestressing steels in bicarbonatesolutions.” Corrosion Sci., 49(11), 4069–4080.
Schupack, M. (2004). “PT Grout: Bleedwater voids.” Concr. Int., 26(8),69–77.
Trejo, D., et al. (2009a). “Effects of voids in grouted, post-tensioned,concrete bridge construction.” Rep. No. 0-4588-1, Texas TransportationInstitute, Texas Dept. of Transportation, Austin, TX, ⟨http://tti.tamu.edu/documents/0-4588-1-Vol1.pdf⟩ (Mar. 15, 2014).
Trejo, D., Pillai, R. G., Hueste, M. D., Reinschmidt, K., and Gardoni, P.(2009b). “Parameters influencing corrosion and tension capacity ofpost-tensioning strands.” ACI Mater. J., 106(2), 144–153.
© ASCE 04014044-10 J. Mater. Civ. Eng.
J. Mater. Civ. Eng., 2014, 26(8): 04014044
Dow
nloa
ded
from
asc
elib
rary
.org
by
"Ind
ian
Inst
itute
of
Tec
hnol
ogy,
Mad
ras"
on
06/0
7/21
. Cop
yrig
ht A
SCE
. For
per
sona
l use
onl
y; a
ll ri
ghts
res
erve
d.