Embed Size (px)
Citation preview

Electric Power Consulting Pty Ltd
1
University of WollongongCountry Energy
Predicting the Voltage Sag Performanceof Electricity Distribution Networks
by
Dr Robert Barr, Electric Power Consulting Pty Ltd
Prof. Vic Gosbell, University of Wollongong
Mr Chris Halliday, Country Energy

Electric Power Consulting Pty Ltd
2
University of WollongongCountry Energy
Figure 1 - Typical Rectangular Voltage Sag
-1.2-1
-0.8-0.6-0.4-0.2
00.20.40.60.8
11.2
0 0.1 0.2 0.3 0.4 0.5 0.6 0.7 0.8 0.9 1
Time seconds
PU S
uppl
y V
olta
ge .
Sag duration 0.3 seconds
Sag voltage 0.3 PU

Electric Power Consulting Pty Ltd
3
University of WollongongCountry Energy
Voltage Sag Patterns - Multiple Sites - Typical Data - Log Time Scale
0
0.1
0.2
0.3
0.4
0.5
0.6
0.7
0.8
0.9
1
0.01 0.1 1 10Time seconds
PU
Sag
Vol
tage
SMPS
Protection Curve
ITIC Curve
Typical Sag Data
log scale

Electric Power Consulting Pty Ltd
4
University of WollongongCountry Energy
Voltage Sag Patterns - Multiple Sites - Typical Data Linear Time Scale
0
0.1
0.2
0.3
0.4
0.5
0.6
0.7
0.8
0.9
1
0 0.2 0.4 0.6 0.8 1 1.2 1.4Time seconds
PU S
ag V
olta
ge
SMPS
Protection Curve
ITIC Curve
Typical Sag Data

Electric Power Consulting Pty Ltd
5
University of WollongongCountry Energy
Typical Distribution Network
66kV
11kV
66kV
230/400V
“A”
Range of possible
11kV faultlocations
High Speed Translay Protection (~0.1secs)
High Speed Bus Zone Protection (~0.1secs)
High Speed Differential Protection (~0.1secs)
“B”“C”“D”
“E”“F”
Low Speed Over Current/Earth FaultFeeder Protection - must grade above distribution Tx fuse protection. (~0.3 to 1.0sec)
Customer see sag voltage from faults on feeders“A” ,”B” and “C” feeders plus upstream faults
O/C E/F protection at “E” &”F” must grade above “A”, “B”, “C” &”D”

Electric Power Consulting Pty Ltd
6
University of WollongongCountry Energy
Standard Inverse Protection Voltage Sag Model
11kV busbar
“A”
NetworkSourceImpedance(Zsrc Per Unit)
“B”“C”“D”“Standard Inverse”overcurrent protection relay
Customers see a sag voltage from the short circuit fault on feeder “A”
Variable fault impedancegoverned by fault location
variable fault location
)1...(seconds1 - )I/I
0.140.02uppick
timeoperating O/C(
= τ
...(3)seconds1 - up)I/Ipick
0.14 (Tsag)Duration Sag
...(2)volts. (Vsag) SagVoltage
0.02
src
(=
−=τ
ZIVsrc
Source Voltage Vs
I
Notes> X/R ratio constant throughout 11kV feeder> Network at zero load before voltage sag generating fault.> Circuit breaker opening time is 0.1 seconds.> Overcurrent protection relay has a Standard Inverse characteristic.

Electric Power Consulting Pty Ltd
7
University of WollongongCountry Energy
Fault Model Single Radial 11kV Line
230/400V
11kV faultlocations
11kV busbar
“A”“B”“C”“D”
Source Voltage Vs
Observation point

Electric Power Consulting Pty Ltd
8
University of WollongongCountry Energy
LV Phase to Neutral Voltages

Electric Power Consulting Pty Ltd
9
University of WollongongCountry Energy
Voltage Sag ModelLV Phase to Neutral
0
0.1
0.2
0.3
0.4
0.5
0.6
0.7
0.8
0.9
1
0 0.5 1 1.5Time Seconds
Sag
Volta
ge P
U
Va Vb & Vc - MV 3Ph fault
ITIC Curve
Protection Curve
© Electric Power Consulting Pty Ltd June 2005
7km line - 0.1km steps

Electric Power Consulting Pty Ltd
10
University of WollongongCountry Energy
Voltage Sag ModelLV Phase to Neutral
0
0.1
0.2
0.3
0.4
0.5
0.6
0.7
0.8
0.9
1
1.1
0 0.5 1 1.5Time Seconds
Sag
Volta
ge P
U
Van LV - MV Ph toPh fault
Vbn LV - MV Ph toPh fault
Vcn LV - MV Ph toPh fault
Va Vb & Vc - MV 3Ph fault
ITIC Curve
Protection Curve
© Electric Power Consulting Pty Ltd June 2005
7km line - 0.1km steps

Electric Power Consulting Pty Ltd
11
University of WollongongCountry Energy
Voltage Sag ModelLV Phase to Neutral
0
0.1
0.2
0.3
0.4
0.5
0.6
0.7
0.8
0.9
1
1.1
0 0.5 1 1.5Time Seconds
Sag
Volta
ge P
U
Van LV - MV Ph toPh fault
Vbn LV - MV Ph toPh fault
Vcn LV - MV Ph toPh fault
Van LV - MV Ph toE fault
Vbn LV - MV Ph toE fault
Vcn LV - Ph to Efault
Va Vb & Vc - MV 3Ph fault
ITIC Curve
Protection Curve
© Electric Power Consulting Pty Ltd June 2005
7km line - 0.1km steps

Electric Power Consulting Pty Ltd
12
University of WollongongCountry Energy
LV Phase to Phase Voltages

Electric Power Consulting Pty Ltd
13
University of WollongongCountry Energy
Voltage Sag ModelLV Phase to Phase
0
0.1
0.2
0.3
0.4
0.5
0.6
0.7
0.8
0.9
1
0 0.5 1 1.5Time Seconds
Sag
Volta
ge P
U
Vab Vbc & Vca -MV 3 Ph fault
ITIC Curve
Protection Curve
© Electric Power Consulting Pty Ltd June 2005
7km line - 0.1km steps

Electric Power Consulting Pty Ltd
14
University of WollongongCountry Energy
Voltage Sag ModelLV Phase to Phase
0
0.1
0.2
0.3
0.4
0.5
0.6
0.7
0.8
0.9
1
1.1
0 0.5 1 1.5Time Seconds
Sag
Volta
ge P
U
Vab LV - MV Ph toPh fault
Vbc LV - MV Ph toPh fault
Vca LV - MV Ph toPh fault
Vab Vbc & Vca -MV 3 Ph fault
ITIC Curve
Protection Curve
© Electric Power Consulting Pty Ltd June 2005
7km line - 0.1km steps

Electric Power Consulting Pty Ltd
15
University of WollongongCountry Energy
Voltage Sag ModelLV Phase to Phase
0
0.1
0.2
0.3
0.4
0.5
0.6
0.7
0.8
0.9
1
1.1
0 0.5 1 1.5Time Seconds
Sag
Volta
ge P
U
Vab LV - MV Ph toPh fault
Vbc LV - MV Ph toPh fault
Vca LV - MV Ph toPh fault
Vab LV - MV Ph toE fault
Vbc LV - MV Ph toE fault
Vca LV - Ph to Efault
Vab Vbc & Vca -MV 3 Ph fault
ITIC Curve
Protection Curve
© Electric Power Consulting Pty Ltd June 2005
7km line - 0.1km steps

Electric Power Consulting Pty Ltd
16
University of WollongongCountry Energy
Comparison of Phase to Neutral & Phase to Phase LV Connections

Electric Power Consulting Pty Ltd
17
University of WollongongCountry Energy
Voltage Sag Model - Comparison of 11kV Ph to Ph Faults
0
0.1
0.2
0.3
0.4
0.5
0.6
0.7
0.8
0.9
1
1.1
0 0.5 1 1.5Time Seconds
Sag
Volta
ge P
U
Van LV - MV Ph toPh fault
Vbn LV - MV Ph toPh fault
Vcn LV - MV Ph toPh fault
ITIC Curve
Protection Curve
Vab LV - MV Ph toPh fault
Vbc LV - MV Ph toPh fault
Vca LV - MV Ph toPh fault
© Electric Power Consulting Pty Ltd June 2005
7km line - 0.1km steps

Electric Power Consulting Pty Ltd
18
University of WollongongCountry Energy
Voltage Sag Model - Comparison of 11kV Ph to E Faults
0
0.1
0.2
0.3
0.4
0.5
0.6
0.7
0.8
0.9
1
1.1
0 0.5 1 1.5Time Seconds
Sag
Volta
ge P
U
Van LV - MV Ph toE fault
Vbn LV - MV Ph toE fault
Vcn LV - Ph to Efault
ITIC Curve
Protection Curve
Vab LV - MV Ph toE fault
Vbc LV - MV Ph toE fault
Vca LV - Ph to Efault
© Electric Power Consulting Pty Ltd June 2005
7km line - 0.1km steps

Electric Power Consulting Pty Ltd
19
University of WollongongCountry Energy
Zone Substation – 4 11kV Feeders

Electric Power Consulting Pty Ltd
20
University of WollongongCountry Energy
11kV Network Exposure ~ k L2
1 3 6 8 101 4 10 18 28
L
Cumulative 11kV Network Exposure (km)
Electric Power Consulting Pty Ltd
21
University of WollongongCountry Energy
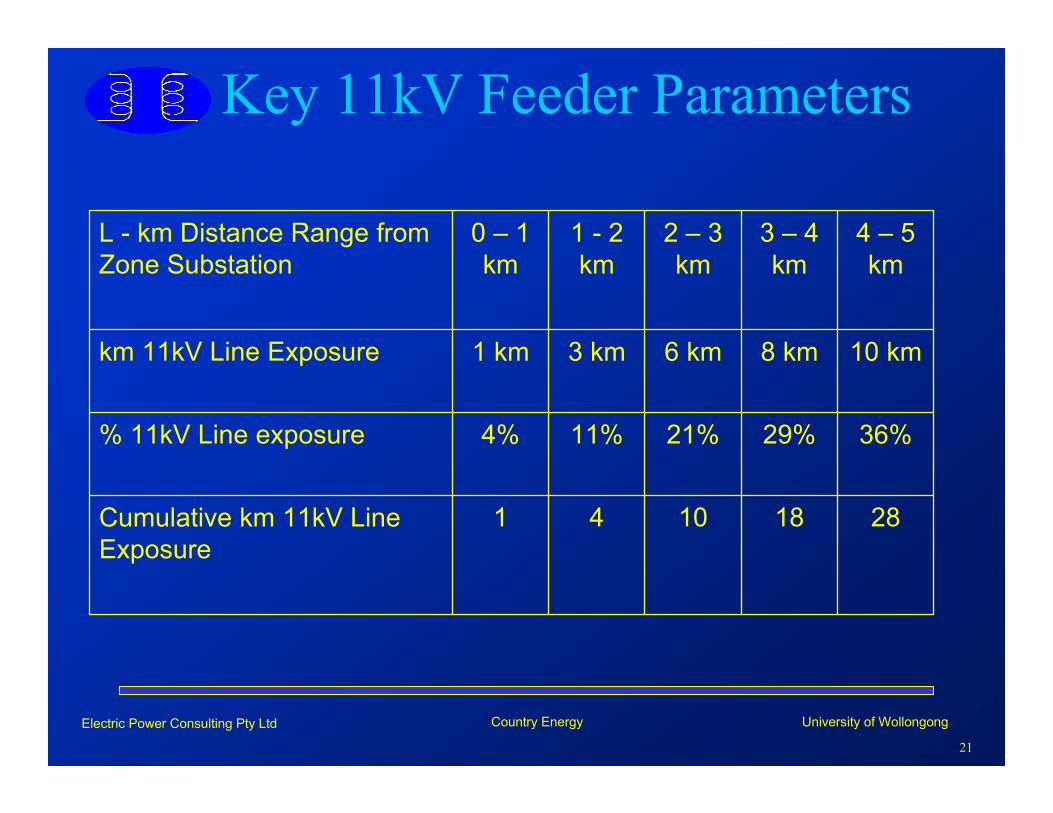
Key 11kV Feeder Parameters
28181041Cumulative km 11kV Line Exposure
36%29%21%11%4%% 11kV Line exposure
10 km8 km6 km3 km1 kmkm 11kV Line Exposure
4 – 5km
3 – 4km
2 – 3km
1 - 2 km
0 – 1 km
L - km Distance Range from Zone Substation

Electric Power Consulting Pty Ltd
22
University of WollongongCountry Energy
Model Parameters
years of history to model2
faults per year80
faults/100km/year8
RMS Average feeder length10
11kV feeders10
km of 11kV1000

Electric Power Consulting Pty Ltd
23
University of WollongongCountry Energy
Model Parameters
11kV Ph to E Faults C16%
11kV Ph to E Faults B16%
11kV Ph to E Faults A16%
11kV Ph to Ph Faults C - A14%
11kV Ph to Ph Faults B - C14%
11kV Ph to Ph Faults A - B14%
11kV 3 phase Faults13%
Total 100%

Electric Power Consulting Pty Ltd
24
University of WollongongCountry Energy
Probabilistic Voltage Sag ModelLV Phase to Neutral
0
0.1
0.2
0.3
0.4
0.5
0.6
0.7
0.8
0.9
1
0 0.5 1 1.5Time Seconds
Sag
Volta
ge P
U
V LV - MV Ph A toPh B faultV LV - MV Ph B toPh C faultV LV - MV Ph C toPh A faultV LV - MV Ph A toE faultV LV - MV Ph B toE faultV LV - Ph C to EfaultV LV - MV 3 Ph fault
ITIC Curve
Protection Curve
© Electric Power Consulting Pty Ltd June 2005

Electric Power Consulting Pty Ltd
25
University of WollongongCountry Energy
Probabilistic Voltage Sag ModelLV Phase to Phase
0
0.1
0.2
0.3
0.4
0.5
0.6
0.7
0.8
0.9
1
0 0.5 1 1.5
Time Seconds
Sag
Volta
ge P
U
Vab LV - MV Ph toPh faultVbc LV - MV Ph toPh faultVca LV - MV Ph toPh faultVab LV - MV Ph toE faultVbc LV - MV Ph toE faultVca LV - Ph to EfaultVab Vbc & Vca -MV 3 Ph faultITIC Curve
Protection Curve

Electric Power Consulting Pty Ltd
26
University of WollongongCountry Energy
Applications for Industrial Customers
• In general – use 400V Phase to Phase connections for control equipment
• Choose common phasing for control equipment –e.g. 400V Red to Blue phases across the entire plant
• Assess the benefits of using 3 phase 400V supplies for low power control equipment
• Understand the likely frequency and severity of voltage sags

Electric Power Consulting Pty Ltd
27
University of WollongongCountry Energy
Applications for Distributors• Understand and quantify the benefits of
minimising Network Exposure• Understand the benefits of star point
resistor/inductor earthing• Understand the critical role of Protection Settings
and Protection Arrangements on voltage sag performance
• Inform customers of “expected” voltage sag performance levels at various parts of the network

Electric Power Consulting Pty Ltd
28
University of WollongongCountry Energy
Applications for NewStandards
• Forcast expected sag activity for specific sites without long duration surveys
• Allows generation of standardised voltage sag environments for equipment immunity
• Develop immunity guidelines as alternative to generic CBEMA curve

Electric Power Consulting Pty Ltd
29
University of WollongongCountry Energy
ConclusionsThe Voltage Sag Model• Gives distributors a tool to predict the comparative
voltage sag performance at key parts of the network
• Helps explain plant & network options available to improve voltage sag performance for customers
• Has an application in defining a standardised voltage sag environment for use in assessing the immunity of electrical equipment
Electric Power Consulting Pty Ltd
30
University of WollongongCountry Energy
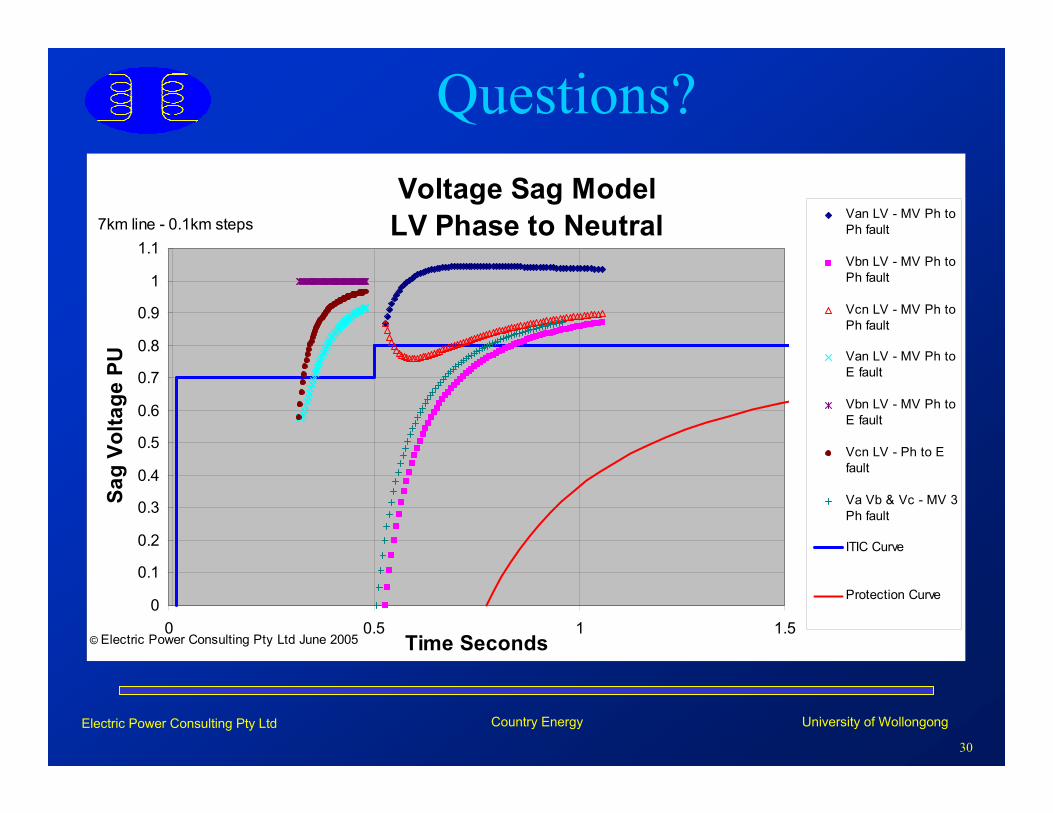
Questions?Voltage Sag ModelLV Phase to Neutral
0
0.1
0.2
0.3
0.4
0.5
0.6
0.7
0.8
0.9
1
1.1
0 0.5 1 1.5Time Seconds
Sag
Volta
ge P
U
Van LV - MV Ph toPh fault
Vbn LV - MV Ph toPh fault
Vcn LV - MV Ph toPh fault
Van LV - MV Ph toE fault
Vbn LV - MV Ph toE fault
Vcn LV - Ph to Efault
Va Vb & Vc - MV 3Ph fault
ITIC Curve
Protection Curve
© Electric Power Consulting Pty Ltd June 2005
7km line - 0.1km steps