Embed Size (px)
Citation preview

Current Zoology 60 (2): 170–179, 2014
Received May 17, 2013; accepted Aug. 6, 2013.
Corresponding author. E-mail: [email protected]
© 2014 Current Zoology
Predicting wild boar damages to croplands in a mosaic of agricultural and natural areas
Gentile Francesco FICETOLA1*, Anna BONARDI1, Paola MAIROTA2, Vincenzo LERONNI2, Emilio PADOA-SCHIOPPA1 1 Dipartimento di Scienze dell’Ambiente e del Territorio e di Scienze della Terra, Università degli Studi di Milano-Bicocca. Pi-
azza della Scienza 1, 20126 Milano Italy 2 Dipartimento di Scienze Agro-Ambientali e Territoriali, University of Bari, Bari.
Abstract Crop damages by wildlife is a frequent form of human-wildlife conflict. Identifying areas where the risk of crop dama-
ges is highest is pivotal to set up preventive measures and reduce conflict. Species distribution models are routinely used to pre-
dict species distribution in response of environmental changes. The aim of this paper was assessing whether species distribution
models can allow to identify the areas most at risk of crop damages, helping to set up management strategies aimed at the mitiga-
tion of human-wildlife conflicts. We obtained data on wild boar Sus scrofa damages to crops in the Alta Murgia National Park,
Southern Italy, and related them to landscape features, to identify areas where the risk of wild boar damages is highest. We used
MaxEnt to build species distribution models. We identified the spatial scale at which landscape mostly affects the distribution
damages, and optimized the regularization parameter of models, through an information-theoretic approach based on AIC. Wild
boar damages quickly increased in the period 2007-2011; cereals and legumes were the crops more affected. Large areas of the
park have a high risk of wild boar damages. The risk of damages was related to low cover of urban areas or olive grows, interme-
diate values of forest cover, and high values of shrubland cover within a 2-km radius. Temporally independent validation data
demonstrated that models can successfully predict damages in the future. Species distribution models can accurately identify the
areas most at risk of wildlife damages, as models calibrated on data collected during only a subset of years correctly predicted
damages in the subsequent year [Current Zoology 60 (2): 170–179, 2014].
Keywords Environmental heterogeneity, Human-wildlife conflict, Landscape composition, Predictive distribution model, Protected areas, Spatial scale, Sus scrofa.
Crop damages by wildlife is a frequent form of hu-man-wildlife conflict, particularly within or nearby pro-tected areas, and can have an important impact on the management of reserves. On the one hand, damages can make communities intolerant and antagonistic towards wildlife, and this may limit the effectiveness of conser-vation strategies (Naughton-Treves, 1998; Linkie et al., 2007). On the other hand, to limit human-wildlife con-flicts, properties suffering wildlife damages are often financially compensated, particularly within or nearby protected areas (e.g. Cozza et al., 1996; Schley et al., 2008; Hegel et al., 2009). However, compensation may have negative consequences in the long term (Bulte and Rondeau, 2005); furthermore, as funding available for protected areas is limited, the additional cost of com-pensation may reduce resources available for other management activities (e.g., conservation of threatened species or habitats). The mitigation of human-wildlife conflict can benefit from the identification of factors
determining crop damages, and from the development of predictive models to identify areas that are most at risk of damages. These information can allow to set up strategies to prevent damages (Linkie et al., 2007; Hegel et al., 2009; Lavelle et al., 2011; Schlageter and Haag- Wackernagel, 2012), or to target culling activities to-ward specific areas, improving their efficacy (Honda and Kawauchi, 2011).
Wild boar populations have dramatically increased all over Europe in the past decades, because of the in-crease of forest cover and repeated releases for hunting. This has determined the intensification of damages and conflicts with humans due to an increased access of these animals to agricultural land (Toso and Pedrotti, 2001; Thurfjell et al., 2009; Barrios-Garcia and Ballari, 2012; Schlageter and Haag-Wackernagel, 2012). The identification of factors increasing the risk of damages can provide important information for the control of population and the limitation of damages (e.g., fences,

FICETOLA GF et al.: Predicting wild boar damages 171
odours) (Schley et al., 2008; Honda and Kawauchi, 2011; Schlageter and Haag-Wackernagel, 2012). Wild boar damages depend not only on the abundance of wild boars, but also on topographical and landscape features (Cocca et al., 2007; Schley et al., 2008; Thurfjell et al., 2009; Honda and Kawauchi, 2011). It is therefore im-portant considering landscape features in analyses as-sessing the risk of damages by wild boars.
Spatially explicit species distribution models (SDM;
often referred to as ecological niche models) allow iden-
tifying relationships between species occurrence (e.g., presence, abundance, damage), and a number of envi-
ronmental features (e.g., climate, land use, landscape features) measured at multiple spatial scales. SDM are
usually used to identify the areas with the highest like-lihood for the presence of a species, and to assess the
risk of invasion by non-native species (Elith and Leath-
wick, 2009; Jiménez-Valverde et al., 2011; Reshetnikov and Ficetola, 2011). In addition, recent studies showed
that SDM can estimate other important parameters, such as reproductive success (Ficetola et al., 2009; Brambilla
and Ficetola, 2012) and risk of damages by target spe-
cies (Honda and Kawauchi, 2011). However the valida-tion of SDM predictions can be challenging, and re-
quires the use of independent data collected in different areas or time (external evaluation; Randin et al., 2006;
Nogués-Bravo, 2009; Jimenez-Valverde et al., 2011; Bahn and McGill, 2013). Such data are rarely available
and used for an accurate validation of model predic-
tions. The aim of this study was assessing whether SDM
can allow to identify the areas most at risk of crop da-mages, helping to set up management strategies aimed
at the mitigation of human-wildlife conflicts. First, we analysed wild boar damages to agriculture in the area of
the Alta Murgia National Park in Southern Italy, and
related them to landscape features. We used SDM to identify areas where the risk of wild boar damages is
highest. Furthermore, we took advantage of data on wild boar damages collected over five years, to evaluate
the capability of models to accurately predict damages
in subsequent years.
1 Materials and Methods
1.1 Study area The study area corresponds to the Alta Murgia Na-
tional Park (AMNP) (area 680 km2) and a 2-km buffer surrounding the park. The AMNP is located in Southern Italy and is partly coincident with the Natura 2000
“Murgia Alta” IT9120007 SCI/SPA (Fig. 1). This Na-tura 2000 site has an area of 1,259 km2; the altitude range is 300- 679 m above sea level. This case study is derived form the Biodiversity Multi-SOurce Monitoring System: From Space To Species (BIO_SOS) project (www.biosos.eu). BIO_SOS is a three-year research project aimed at developing a pre-operational system for a cost- and time-effective monitoring of changes in the land cover and habitats within and along the borders of protected areas, to judge their effectiveness in pro-tecting and conserving the regions from human impacts (www.biosos.eu).
Fig. 1 Location of study area in Italy, and wild boar damages reported in the in 2007–2011 Open circles: 2007; filled circles: 2008; open squares: 2009; open triangles: 2010; filled triangles: 2011.
The AMNP is characterized by a typical dry karst
landscape, and by a pluviseasonal-oceanic Mediterra-nean bioclimate; the ombrotypes range from dry to sub-humid and thermotype is mesomediterranean (Forte et al., 2005). The sub natural vegetation type mostly rep-resented and of greater conservation concern in this site are Mediterranean steppe grasslands. Other sub- and semi- natural vegetation types include garrigues and shrubs, Macedonian oak (Quercus trojana Webb) and downy oak (Q. pubescens Willd.) woodlands, and pine plantations (mainly Pinus halepensis Miller). The natu-ral vegetation is embedded within an agricultural matrix mostly dominated by cereal crops which have substi-tuted large chunks of the grasslands mainly over the last century. Additional cultures include olive groves, or-chards (including almond orchards), vineyards, legumes

172 Current Zoology Vol. 60 No. 2
and other vegetables (Dimopoulos et al., 20111). The AMNP with the surrounding buffer zone was chosen instead of the whole Natura 2000 site as damange re-cords were only available for the former. 1.2 Data
Records of wild boar damages to agriculture were provided by the AMNP Authority for 2007–2011. Damages are defined as causes of impairment of the value or the complete destruction of agricultural crops in privately owned lands. Damages are economically evaluated and refunds paid to farmers by competent public authorities in charge of the management of the park. These records were referred to cadastral parcels. The same parcel was damaged in multiple years in less than 2% of cases. Within the study area, the average area of parcels is approximately 5×10⁴ m2, so we used a grid with 220×220 m cells (i.e., cell size roughly corre-sponding to the average area of parcels).
Environmental variables were extracted from the thematic land cover / land use (LC/LU) map of the Pug-lia region (2006, 1:5000 nominal scale), classified in the Corine Land Cover taxonomy (III and IV level). In the original LC/LU map, land use categories are repre-sented by 68 distinct categories. To avoid over-parame-trization of models, the original categories were aggre-gated in eight land use classes: forest, shrubland, her-baceous cropland, vineyard, olive grove, woody culture (e.g. orchards), grass land and urban. The percentage cover of each class in each cell was used as an envi-ronmental variable as it represents a measure of the landscape composition in each cell. The Euclidean dis-tance between the edge of each cell and the edge the nearest patch of forest/shrubland was also used as an environmental variable, as wild boars use forest and shrubland as shelter (hereafter: distance to shelter) (e.g., Meriggi and Sacchi, 2001; Cocca et al., 2007; Thurfjell et al., 2009; Honda and Kawauchi, 2011). Climatic and terrain variables may be helpful to build SDM, particu-larly at broad spatial scale (Belda et al., 2012). However, at finer spatial scale habitat and land use variables are more important; as the study area was highly homoge-neous, and as all the study area is climatically suitable for wild boars, our analyses focused on land use vari-ables (Soberon and Nakamura, 2009; Belda et al., 2012; Gallien et al., 2012). 1.3 Statistical analyses
Before running analyses, we calculated correlation
between environmental variables. Correlation coeffi-cients between independent variables |r| > 0.7 can affect the standard errors and significance of regression coef-ficients, and therefore may make it difficult the inter-pretation of species/habitat relationships (Dormann et al., 2013). However, significance of individual variables was not the focus of the present study; correlation be-tween variables is not a major problem when the main focus is understanding the processes within a given area, and AIC-based model selection has been shown to have good performance even in presence of collinearity (Murtaugh, 2009). We used maximum entropy model-ling (MaxEnt) to identify the areas with highest risk of damages (Phillips et al., 2006; Elith et al., 2011). Max-Ent is a machine-learning approach that assesses the likelihood of presence in a given cell on the basis of environmental features in that cell; it is considered one of the most efficient approaches to SDM using pres-ence-only data, and may outperform some more tradi-tional presence / absence methods such as general linear models (Elith et al., 2006; Elith et al., 2011). The pro-gram establishes flexible relationships between the de-pendent and independent variables, and is therefore well suited to evaluate complex or non-linear relationships. Several studies demonstrated the ability of MaxEnt to build models that can be extrapolated into new contexts (e.g., in other regions or in other temporal steps) with high predictive performance (e.g., Pearson et al., 2007; Rödder et al., 2009; Ficetola et al., 2010; Fouquet et al., 2010; Reshetnikov and Ficetola, 2011; Masin et al., 2013). MaxEnt provides a index of likelihood of pres-ence instead of the actual probability of presence. Nev-ertheless, MaxEnt outcome is very strongly correlated with the output of models producing the probability of presence (Li et al., 2011), while making a lower number of assumptions (Phillips, 2012). It is likely that not all crop damages are reported to local authorities, for in-stance because they may remain undetected by owners. For this reason, no true absence data were available, and we used a presence / background method (MaxEnt) in-stead than more traditional presence / absence methods (e.g., generalized linear models).
We built a series of MaxEnt models by using the lo-cation of all wild boar damages data. We performed analyses by measuring landscape features at different radii, and with different values of the regularization
multiplier .
1 Dimopoulos P, Kallimanis A, Honrado JP, Mucher CA, Lucas RM et al., 2011. Sites’ Description. BIO SOS Biodiversity Multisource Monitor-
ing System: From Space to Species (BIO SOS) Deliverable 6.10.

FICETOLA GF et al.: Predicting wild boar damages 173
Landscape radius. Damage distribution can be af-fected by landscape features at different spatial scales; this can be assessed by changing the extent of the land-scape portion considered while living the grain (i.e., 220 m cell resolution) constant. This was done by using as independent variable values (i) the landscape cover within the cell (i.e., within a radius of 0 km from the focal cell), or the average cover of each landscape cate-gory within a radius of (ii) 2, (iii) 4 and (iiii) 6 km from the focal cell. These radii represent distances that can be travelled by wild boars, particularly during foraging activities (e.g., Janeau et al., 1995; Cocca et al., 2007; Honda and Kawauchi, 2011). Distance from shelter was included into models built at all the spatial scales.
Regularization multiplier. In MaxEnt models, re-sponse curves can have varying degrees of complexity,
expressed by the regularization multiplier (Phillips et al., 2006; Warren and Seifert, 2011). Models with in-
creasing values of have response curves with higher smoothing and therefore less complexity (Elith et al., 2010; Warren and Seifert, 2011). For each landscape radius, we build seven models with increasing values of
: 1, 2, 3, 5, 7, 10, 15 (Warren and Seifert, 2011). Overall, we built 28 MaxEnt models (4 scales × 7
values of ). We then used Akaike’s Information Crite-rion, corrected for small sample size (AICc) (Burnham and Anderson, 2001; Burnham and Anderson, 2002) to
identify the best combination of and landscape radius. AICc trades off explanatory power versus model com-plexity. Parsimonious models explaining more variation have the lowest AICc value and are considered to be the “best-AICc model” (Burnham and Anderson, 2001; Burnham and Anderson, 2002). We calculated AICc values by standardizing raw scores for each model so that all scores within the geographic space sum to 1. The likelihood of the data given each model is then ob-tained by taking the product of the suitability scores for each grid cell containing a presence. The number of parameters in the model is measured by counting all parameters with a nonzero weight in the lambda file produced by Maxent (Warren and Seifert, 2011). Simu-lations suggested that this approach allows to identify the models with highest generality and transferability to other time periods (Warren and Seifert, 2011). AICc also allows quantifying the relative support of models. If some model have AICc values within 2 units from the best model (i.e., it is close to the best model), the best model has a limited support. AICc differences of 4–7 units indicate moderate support of the best model, while
AICc > 10 units indicate very strong support in favour
of the best model (Burnham and Anderson, 2001). The best-AICc model also tends to estimate well the relative
importance of environmental variables (Warren and
Seifert, 2011). We used bootstraps (100 replicates) to build response curves for the best model, as well as the
associated standard deviation.
After the identification of the best-fitting values of and landscape radius, we built a series of MaxEnt mod-els using only a subset of wild board data, to assess the actual capability of our model to predict damages in the future, and using logistic output. First, we trained a model using the 2007-08 data, and tested its ability to correctly predict the location of the 2009 damages (test
data). Similarly, we trained a model using the 2007 2009 data and used the 2010 data as test, and we trained a model using the 2007–2010 data and used the 2011 data as test. In each model, we assumed that a cell has high risk of damages if its suitability score was greater than the 10th percentile of training presence points (Pearson et al., 2007). We then examined the omission error of models to evaluate their predictive performance (Jiménez-Valverde et al., 2008). The omission errors of each test year were identified as the damages that were not correctly predicted by the model built for previous years (i.e., damages that were not in high-risk cells). To test the significance of model predictions, we then used a binomial test to assess whether omission errors are significantly less than expected by chance. In these three tests, the test data are temporally (but not spatially) distinct from the training data, therefore they constitute an independent validation of the model predictive per-formance, and permit to assess whether our model al-lows to predict the location of damages in the future (Nogués-Bravo, 2009; Ficetola et al., 2010). As a meas-ure of discrimination capacity, for each model we also calculated the area under the curve of the receiver ope-rator plot (AUC) (Manel et al., 2001). AUC was used to perform both internal and external evaluation (Randin et al., 2006). For internal validation, AUC was used to test the ability of the model to correctly discriminate
presence/absences in the training data, while for exter-nal validation AUC tested the ability of the model to
correctly discriminate presence absences in the data collected during subsequent years (Randin et al., 2006).
AUC usually takes values between 0 and 1, with 0.5
indicating that the model do not discriminate better than random and 1 indicating perfect discrimination. How-
ever, it should be remarked that in MaxEnt models the

174 Current Zoology Vol. 60 No. 2
maximum achievable AUC is below 1, making it com-plex the application of standard scales of classification of AUC values (Phillips et al., 2006; see also Smith, 2013 for additional issues). Furthermore, we calculated the Kulczynski’s coefficient of dissimilarity among the models built using training data from different years (Randin et al., 2006). Kulczynski’s coefficient of dis-similarity represents the disagreement among predic-tions performed using data from different years, ranges between zero (no disagreement) and 1, and is at its minimum when the difference between models is null (Randin et al., 2006). To obtain Kulczynski’s coeffi-cients, we created 3 000 random points covering the whole study area, and for each point we extracted the suitability values, as obtained by MaxEnt models cali-brated using different data. We then calculated Kulc-zynski’s coefficients using the vegan package in R 2.15 (Oksanen et al., 2012; R Development Core Team, 2012).
Spatial autocorrelation, arising for instance from clustering of presence points, might influence the results of SDM (Veloz, 2009). We therefore assessed whether our data are affected by spatial autocorrelation. First, we randomly generated a number of pseudo-absence points equal to the number of records of wild boar damages; for all presence and pseudo-absence points, we ex-tracted the suitability value as predicted by the best- AICc MaxEnt model. We calculated residuals as the difference between observed presence/pseudo absence and predicted suitability. We then used Moran’s I to assess spatial autocorrelation of residuals in SAM 4.0 (Rangel et al., 2010).
The previously described models have been trained using the whole study area as background. However, damages can only occur in areas exploited by human activities. We therefore repeated all analyses by exclu-ding from background all grid cells that are completely covered by natural vegetation (shrubland or forest), and compared the results obtained using the two typologies of background data (i.e., whole study area; excluding areas not exploited by humans).
Models were built using MaxEnt 3.3.3 (Phillips et al., 2006; Elith et al., 2011); AICc of models was calculated with ENMTools 1.3 (Warren et al., 2010; Warren and Seifert, 2011).
2 Results
We used 20 records of wild boar damages in 2007, 23 in 2008, 38 in 2009, 29 in 2010 and 47 in 2011 (Fig. 1). The number of records of damages significantly in-creased over the study period (Spearman’s correlation,
rS = 0.90, P = 0.037). Damages were often clustered in specific areas of the park, and in certain sectors dam-ages were reported only in one of the study years (Fig. 1). Cereals, legumes and vineyards were the crops of cadastral parcels more frequently damaged by wild boars (Fig. 2). Correlations between environmental variables were generally weak, indicating lack of major multicol-linearity problems. Pairwise correlations were |r| < 0.6 for all landscape variables measured in the radius of 0, 2 and 4 km from the focal cell. If landscape variables were measured within 6 km from the focal cell, we de-tected a strong negative correlation between crop and olive grow cover (r = -0.88). Other pairwise correlations were |r| < 0.6 for all variables measured at this scale.
Fig. 2 Types of crops damaged by wild boars in 2007- 2011: percentage of cadastral parcels It should be remarked that, within cereals, 71% of damages only were attributed to a specific culture (wheat, barley or oats); for the remain-ing cereals the damaged was attributed to undefined cereals. Error bars are standard deviation over the five study years.
The model with regularization multiplier = 3 and landscape measured in a radius of 2 km showed the lowest AICc (AICc = 2887), and was thus considered to be the best-AICc model (Table 1). No model had AICc values very close to the best model. The model with the
second lowest value of AICc ( = 5, radius = 2 km) had AICc = 2901 (Table 1). The difference in AICc values between the two models was 14, thus indicating a very strong support in favour of the best model (see e.g., Burnham and Anderson, 2001).
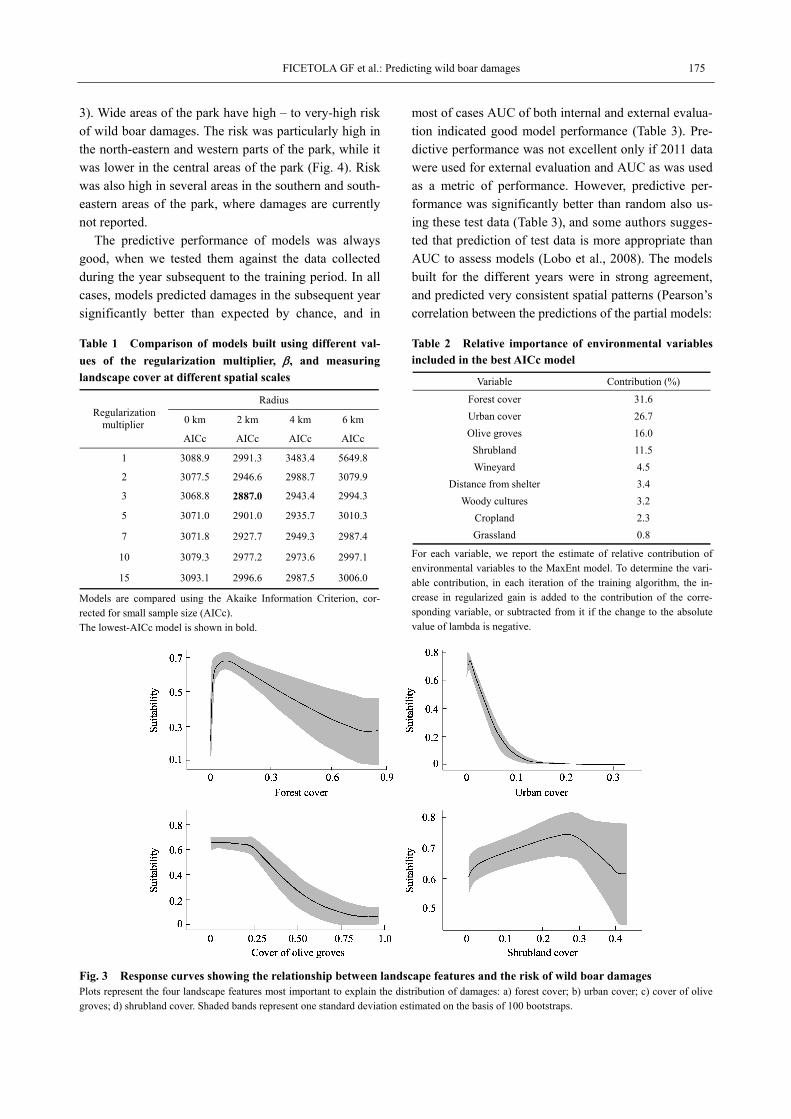
The cover of forest, urban, olive groves and shrub-lands within 2 km were the variables most important to explain the location of damages (Table 2). The risk of damages resulted highest in cells with low cover of ur-ban areas or olive grows, intermediate values of forest cover, and relatively high values of shrubland cover (Fig.
FICETOLA GF et al.: Predicting wild boar damages 175
3). Wide areas of the park have high – to very-high risk of wild boar damages. The risk was particularly high in the north-eastern and western parts of the park, while it was lower in the central areas of the park (Fig. 4). Risk was also high in several areas in the southern and south- eastern areas of the park, where damages are currently not reported.
The predictive performance of models was always good, when we tested them against the data collected during the year subsequent to the training period. In all cases, models predicted damages in the subsequent year significantly better than expected by chance, and in
Table 1 Comparison of models built using different val-
ues of the regularization multiplier, , and measuring
landscape cover at different spatial scales
Radius
0 km 2 km 4 km 6 km Regularization
multiplier AICc AICc AICc AICc
1 3088.9 2991.3 3483.4 5649.8
2 3077.5 2946.6 2988.7 3079.9
3 3068.8 2887.0 2943.4 2994.3
5 3071.0 2901.0 2935.7 3010.3
7 3071.8 2927.7 2949.3 2987.4
10 3079.3 2977.2 2973.6 2997.1
15 3093.1 2996.6 2987.5 3006.0
Models are compared using the Akaike Information Criterion, cor-rected for small sample size (AICc). The lowest-AICc model is shown in bold.
most of cases AUC of both internal and external evalua- tion indicated good model performance (Table 3). Pre-dictive performance was not excellent only if 2011 data were used for external evaluation and AUC as was used as a metric of performance. However, predictive per-formance was significantly better than random also us-ing these test data (Table 3), and some authors sugges-ted that prediction of test data is more appropriate than AUC to assess models (Lobo et al., 2008). The models built for the different years were in strong agreement, and predicted very consistent spatial patterns (Pearson’s correlation between the predictions of the partial models:
Table 2 Relative importance of environmental variables included in the best AICc model
Variable Contribution (%)
Forest cover 31.6
Urban cover 26.7
Olive groves 16.0
Shrubland 11.5
Wineyard 4.5
Distance from shelter 3.4
Woody cultures 3.2
Cropland 2.3
Grassland 0.8
For each variable, we report the estimate of relative contribution of environmental variables to the MaxEnt model. To determine the vari-able contribution, in each iteration of the training algorithm, the in-crease in regularized gain is added to the contribution of the corre-sponding variable, or subtracted from it if the change to the absolute value of lambda is negative.
Fig. 3 Response curves showing the relationship between landscape features and the risk of wild boar damages Plots represent the four landscape features most important to explain the distribution of damages: a) forest cover; b) urban cover; c) cover of olive groves; d) shrubland cover. Shaded bands represent one standard deviation estimated on the basis of 100 bootstraps.

176 Current Zoology Vol. 60 No. 2
Fig. 4 Risk of wild boar damages in the Parco Nazionale dell’Alta Murgia, on the basis of data collected from 2007 to 2011. 0.236 is the 10th percentile training presence threshold (Pearson et al., 2007).
r ≥ 0.87 for all pairwise correlations; Pearson’s correla-tion between the partial models and the model built us-ing the data from all years: r > 0.75 for all pairwise correlations). Kulczynski’s coefficients of dissimilarirty between models were always very low, indicating strong agreement and high transferability of models (Table 3). Spatial autocorrelation of residuals was very weak (Moran’s I = 0.036).
Results were identical if models were built excluding fully natural areas from background, as these models showed perfect agreement with those built considering the whole study area as background. The correlation coefficient between models considering the whole study area, and models excluding natural areas, was always > 0.97 (correlation between the two models built using the 2007–2008 data: r = 0.998; correlation between the two models built using the 2007–2009 data: r = 0.994; cor-relation between the two models built using the 2007–
2010 data: r = 0.994; correlation between the two mod-els built using all the data: r = 0.974).
3 Discussion
As in other areas of Europe, wild boar damages are quickly increasing in the Alta Murgia National Park, with a two-fold increase in just five years. Despite the number of damaged parcels at present may seem limited, if compared with other regions (e.g., Schley et al., 2008), the quickly growing trend raises concern for the situa-tion in the next future. It should also be remarked that the damage records available were limited to the reports performed by farmers. Particularly for the earlier years from the launching of the compensatory scheme within the NP a number of damages were probably not re-ported. Damage claims might have increased in more recent years, but still the available figures probably represent an underestimation of the current damages. In our study area, it seems that wild boars thrive on natural trophic resources and switch on cultivated ones during the summer, when they mostly damage vineyards and almond groves (Corriero et al., 20102). Cereals are the dominant crop within the study area representing the landscape matrix in which other crops and shelter area are scattered and far apart. Therefore the high number of damages in this land use class is to be probably re-lated to the movements of the animals from and be-tween trophic and refuge land use classes.
Our model identifies landscape features that increase the risk of crop damages: the risk was highest in areas with very low urban cover, intermediate values of forest and shrub cover, and intermediate to low cover of olive groves. These relationships allow to map the areas of the AMNP where damage risk is highest (Fig. 4). The negative relationship with human presence can be ex- plained by the avoidance of these areas, and has been
Table 3 Predictive performance of models
AUC Kulczynski’s coefficient of dissimilarity Training years Test year Omission rate P
IE EE 2007–2009 2007–2010 2007–2011
2007–2008 2009 0.237 <0.0001 0.91 0.83 0.203 0.206 0.251
2007–2009 2010 0.310 <0.0001 0.91 0.81 0.140 0.219
2007–2010 2011 0.511 0.005 0.90 0.65 0.190
Omission rate was assessed by testing the model outcome with data collected during of the year subsequent to the training period. The area under the curve of the receiver operator plot (AUC) was calculated on training data (internal evaluation: IE) and on test data collected during the subse-quent years (external evaluation, EE). Kulczynski’s coefficient of dissimilarity represents the disagreement among predictions performed using data from different years.
2 Corriero G, Sorino R, Scorrano S Gaudiano L, 2010. Studio a breve termine della popolazione di cinghiale Sus scrofa nel Parco Nazionale dell'Alta Murgia. Technical report, Dipartimento di Biologia Università degli Studi di Bari and Ente Parco Nazionale dell'Alta Murgia.

FICETOLA GF et al.: Predicting wild boar damages 177
observed in other regions of Europe (Schley et al., 2008), even though there are several cases where wild boars have higher human tolerance, do not avoid human activities, and are even found in large cities (e.g. Berlin). Similarly, the partially positive relationship with forests and shrublands likely occurs because of the high suita-bility of these LC/LU for wild boars (Meriggi and Sac-chi, 2001; Schley et al., 2008; Honda and Kawauchi, 2011). Shrubland cover was the variable most positively related to damages (Fig. 3), still in the whole study area no cells had more than 40% of shrub cover within 2km, and the highest suitability was associated with shrub-land cover around 30%. Distance from potential shelter areas (i.e., shrubland or forest) was not among the most important predictors in our models (Table 2). However, our model included the cover of forests and shrublands, and these variables are partially correlated to the dis-tance from shelters (correlation between shrub cover and distance from refugia: r = -0.28; correlation be-tween forest cover and distance from refugia: r = -0.56).
The best models were those measuring landscape features within a radius of 2 km (Table 1), indicating that the risk of damages is influenced not only by the local features of patches, but also by the broader land-scape context. This probably occurs because wild boars may travel long distances from refugia to reach foraging areas. For instance, radiotracking data from Southern France suggest that wild boars may perform long movements, in which individuals can reach areas that are up to 2.5 km from the departure point (Janeau et al., 1995). This distance corresponds well to the 2 km ra-dius identified by our best model.
It should be remarked that damage risk was not asso-ciated with very high values of any particular landscape feature. Actually, damage risk was high in areas having relatively low values of a combination of several land-scape features (e.g., forest, olive grove, shrubland…; Fig. 3), that is in relatively more heterogeneous land-scapes. This probably occurs because we did not model the suitability of cells for wild boars, which is expected to be highest in areas with the most natural vegetation (Meriggi and Sacchi, 2001). Instead, we tried to identify the areas with highest risk of damages. The risk of damages can be challenging to model, particularly for species whose habitat requirements are manifold, and even more so when the species perform long range movements. Actually, the risk of damages depends by the interplay between the presence of natural patches that can be used as shelter by the study species (i.e., forest or shrubland) and the features of the agricultural
landscape. Overall, habitat complementation is ex-tremely important for the distribution of wild boar damages (Dunning et al., 1992). The risk of damages is highest in areas with very heterogeneous landscape, not too close to human settlements, comprising some pat-ches of natural or semi-natural vegetation, and agricul-tural areas the wild boars can exploit for foraging. Even though such area are rather large, they are also clumped in a limited number of individual blocks. Thus the risk maps could be used to plan preventive measures with the aim of improving the effectiveness of management both in the short and long term perspectives. First, these maps can help to identify the areas more suitable for population monitoring schemes, which will allow a bet-ter knowledge of population dynamics, and can provide essential information for a more effective management of populations. Collecting standardized data and regu-larly updating the databases is necessary for an adaptive management of populations. Second, the maps could allow to identify crops at risk that can be protected through fences (mechanical or electrified), and eventu-ally to localize feeding plots in forested areas, where it is possible to perform actions aimed at population con-trol.
One basic assumption of SDM is that species are at equilibrium with the available environmental features (Guisan and Thuiller, 2005; Gallien et al., 2012), yet it is very difficult to verify this (but see Gallien et al., 2012). In our study area, claims for wild boars damages are quickly growing: in 2007 reports of damages were limited to specific, small areas. The fact that damage claims have not reached the equilibrium may limit the predictive ability of SDM (Gallien et al., 2012), still models may be able to identify relationships with habi-tats with sufficient accuracy to perform useful predic-tions. Even though some analyses suggested that SDM may have limited transferability (Randin et al., 2006; Bahn and McGill, 2013), other studies have demon-strated the ability of SDM to predict distribution changes and expansion of species not at equilibrium (e.g. Ficetola et al., 2010). Our results further support these findings as the models predicted well the areas most at risk of damages in the subsequent years, and even in years not used for the training of the model (Ta-ble 3). Moreover, despite reports of damages now cover a quite larger range (Fig. 1), damages might not have yet occurred in areas with a predicted high risk, par-ticularly in the southern sectors (Fig. 4) of the park. The possibility to obtain useful SDM even when this as-sumption is not fully met is a good news for models

178 Current Zoology Vol. 60 No. 2
aiming at predicting the potential distribution or impact of species in quick expansion, such as many species causing human-wildlife conflicts, invasive species, or species undergoing the effects of climate change. At present, these are some of the situations for which the predictive ability of SDMs is most frequently called as an important step toward management (Jeschke and Strayer, 2008).
Such potentials of SDM could be further exploited within the framework of regular monitoring pro-grammes based on both damage recording and land-scape features change assessment. More realistic indica-tions could be obtained if frequently updated and much detailed LC/LU maps were fed in the model, such as those produced by means of Earth observation tech-niques which provide accurate detection and quantifica-tion of landscape features dynamics over broad geo-graphic scales (Nagendra et al., 2013).
Acknowledgements We thank four reviewers for comments on early versions of this manuscript. This work was supported by the European Community's Seventh Framework Program-me, within the FP7/SPA.2010.1.1-04: “Stimulating the devel-opment of GMES services in specific area”, under grant agreement 263435 for the project Biodiversity Multi-Source Monitoring System: From Space To Species (BIO_SOS). The work was based on data provided to the BIO_SOS project by Anna Grazia Frassanito, faunal officer at the Alta Murgia Na-tional Park.
References
Bahn V, McGill BJ, 2013. Testing the predictive performance of distribution models. Oikos 122: 321–331.
Barrios-Garcia M, Ballari S, 2012. Impact of wild boar Sus scrofa in its introduced and native range: A review. Biol. Invasions 14: 2283–2300.
Belda A, Zaragozí B, Martínez-Pérez JE, Peiró V, Ramón A et al., 2012. Use of GIS to predict potential distribution areas for wild boar (Sus scrofa Linnaeus 1758) in Mediterranean re-gions (SE Spain). Ital. J. Zool. 79: 252–265.
Brambilla M, Ficetola GF, 2012. Species distribution models as a tool to estimate reproductive parameters: A case study with a passerine bird species. J. Anim. Ecol. 81: 781–787.
Bulte EH, Rondeau D, 2005. Why compensating wildlife dama-ges may be bad for conservation. J. Wildlife Manage. 69: 14– 19.
Burnham KP, Anderson DR, 2001. Kullback-Leibler information as a basis for strong inference in ecological studies. Wildlife Research 28: 111–119.
Burnham KP, Anderson DR, 2002. Model Selection and Multi-model Inference: A Practical Information-Theoretic Approach. New York: Springer Verlag.
Cocca G, Sturaro E, Dal Compare L Ramanzin M, 2007. Wild boar Sus scrofa damages to mountain grassland: A case study in the Belluno province, eastern Italian Alps. Italian Journal of
Animal Science 6: 845–847. Cozza K, Fico R, Battistini ML Rogers E, 1996. The dama-
ge-conservation interface illustrated by predation on domestic livestock in central Italy. Biol. Conserv. 78: 329–336.
Dormann CF, Elith J, Bacher S, Buchmann C, Carl G et al., 2013. Collinearity: A review of methods to deal with it and a simula-tion study evaluating their performance. Ecography 36: 27–46.
Dunning JB, Danielson BJ, Pulliam HR, 1992. Ecological proce-sses that affect populations in complex landscapes. Oikos 65: 169–175.
Elith J, Graham CH, Anderson RP, Dudík M, Ferrier S et al., 2006. Novel methods improve prediction of species’ distributions from occurrence data. Ecography 29: 129–151.
Elith J, Kearney M, Phillips S, 2010. The art of modelling range-shifting species. Methods in Ecology and Evolution 1: 330–342.
Elith J, Leathwick JR, 2009. Species distribution models: Eco-logical explanation and prediction across space and time. Annu. Rev. Ecol. Evol. Syst. 40: 677–697.
Elith J, Phillips SJ, Hastie T, Dudík M, Chee YE et al., 2011. A statistical explanation of MaxEnt for ecologists. Divers. Dis-trib. 17: 43–57.
Ficetola GF, Maiorano L, Falcucci A, Dendoncker N, Boitani L et al., 2010. Knowing the past to predict the future: Land-use change and the distribution of invasive bullfrogs. Global Change Biol. 16: 528–537.
Ficetola GF, Thuiller W, Padoa-Schioppa E, 2009. From introduc-tion to the establishment of alien species: Bioclimatic diffe-rences between presence and reproduction localities in the slider turtle. Divers. Distrib. 15: 108–116.
Forte L, Perrino EV, Terzi M, 2005. Le praterie a Stipa aus-troitalica Martinovsky ssp. austroitalica dell’Alta Murgia (Puglia) e della Murgia Materana (Basilicata). Fitosociologia 42: 83–103.
Fouquet A, Ficetola GF, Haigh A, Gemmell N, 2010. Using eco-logical niche modelling to infer past, present and future envi-ronmental suitability for Leiopelma hochstetteri, an endan-gered New Zealand native frog. Biol. Conserv. 143: 1375– 1384.
Gallien L, Douzet R, Pratte S, Zimmermann NE, Thuiller W, 2012. Invasive species distribution models: How violating the equi-librium assumption can create new insights. Global Ecol. Bio-geogr. 21: 1126–1136.
Guisan A, Thuiller W, 2005. Predicting species distribution: Of-fering more than simple habitat models. Ecol. Lett. 8: 993– 1009.
Hegel TA, Gates CC, Eslinger D, 2009. The geography of conflict between elk and agricultural values in the Cypress Hills, Cana-da. Journal of Environmental Management 90: 222–235.
Honda T, Kawauchi N, 2011. Methods for constructing a wild boar relative-density map to resolve human-wild boar conflicts. Mammal Study 36: 79–85.
Janeau G, Cargnelutti B, Cousse S, Hewison M, Spitz F, 1995. Daily movement pattern variations in wild boar Sus scrofa L.. Ibex – Journal of Mountain Ecology 3: 98–101.
Jeschke JM, Strayer DL, 2008. Usefulness of bioclimatic models for studying climate change and invasive species. Annals of the New York Academy of Sciences 1134: 1–24.
Jimenez-Valverde A, Decae AE, Arnedo MA, 2011. Environ-
FICETOLA GF et al.: Predicting wild boar damages 179
mental suitability of new reported localities of the funnelweb spider Macrothele calpeiana: An assessment using potential distribution modelling with presence-only techniques. J. Bio-geogr. 38: 1213–1223.
Jiménez-Valverde A, Lobo JM, Hortal J, 2008. Not as good as they seem: The importance of concepts in species distribution modelling. Divers. Distrib. 14: 885–890.
Jiménez-Valverde A, Peterson AT, Soberon J, Overton JM, Aragon P et al., 2011. Use of niche models in invasive species risk as-sessments. Biol. Invasions 13: 2785–2797.
Lavelle MJ, Vercauteren KC, Hefley TJ, Phillips GE, Hygnstrom SE et al., 2011. Evaluation of fences for containing feral swine under simulated depopulation conditions. J. Wildlife Manage. 75: 1200–1208.
Li W, Guo Q, Elkan C, 2011. Can we model the probability of presence of species without absence data? Ecography 34: 1096–1105.
Linkie M, Dinata Y, Nofrianto A, Leader-Williams N, 2007. Pat-terns and perceptions of wildlife crop raiding in and around Kerinci Seblat National Park, Sumatra. Anim. Conserv. 10: 127–135.
Lobo JM, Jiménez-Valverde A, Real R, 2008. AUC: A misleading measure of the performance of predictive distribution models. Global Ecol. Biogeogr. 17: 145–151.
Manel S, Williams HC, Ormerod SJ, 2001. Evaluating presence- absence models in ecology: The need to account for preva-lence. J. Appl. Ecol. 38: 291–931.
Masin S, Bonardi A, Padoa-Schioppa E, Bottoni L, Ficetola GF, 2013. Risk of invasion by frequently traded freshwater turtles. Biol. Invasions DOI: 10.1007/s10530–013–0515–y
Meriggi A, Sacchi O, 2001. Habitat requirements of wild boars in the northern Apennines (N Italy): A multi-level approach. Ital. J. Zool. 68: 47–55.
Murtaugh PA, 2009. Performance of several variable-selection methods applied to real ecological data. Ecol. Lett. 12: 1061– 1068.
Nagendra H, Lucas RM, Honrado JP, Jongman RHG, Tarantino C et al., 2013. Remote sensing for conservation monitoring: As-sessing protected areas, habitat extent, habitat condition, spe-cies diversity, and threats. Ecological Indicators 33: 45–59.
Naughton-Treves L, 1998. Predicting patterns of crop damage by wildlife around Kibale National Park, Uganda. Conserv. Biol. 12: 156–168.
Nogués-Bravo D, 2009. Predicting the past distribution of species climatic niche. Global Ecol. Biogeogr. 18: 521–531.
Oksanen J, Blanchet FG, Kindt R, Legendre P, O'Hara RB et al., vegan: Community Ecology Package version 2.0-5. www.r– project.org.
Pearson RG, Raxworthy CJ, Nakamura M Peterson AT, 2007. Predicting species distributions from small numbers of occur-rence records: A test case using cryptic geckos in Madagascar.
J. Biogeogr. 34: 102–117. Phillips S, 2012. Inferring prevalence from presence-only data: A
response to 'Can we model the probability of presence of spe-cies without absence data?'. Ecography 35: 385–387.
Phillips SJ, Anderson RP, Schapire RE, 2006. Maximum entropy modeling of species geographic distributions. Ecol. Model. 190: 231–259.
R Development Core Team, 2012. R: A Language and Environ-ment for Statistical Computing. R Foundation for Statistical Computing, Vienna. www. r–project.org.
Randin CF, Dirnbock T, Dullinger S, Zimmermann NE, Zappa M et al., 2006. Are niche-based species distribution models transferable in space? J. Biogeogr. 33: 1689–1703.
Rangel TFLVB, Diniz-Filho JAF, Bini LM, 2010. SAM: A com-prehensive application for spatial analysis in macroecology. Ecography 33: 46–50.
Reshetnikov AN, Ficetola GF, 2011. Potential range of the inva-sive fish rotan Perccottus glenii in the Holarctic. Biol. Inva-sions 13: 2967–2980.
Rödder D, Schmidtlein S, Veith M, Lötters S, 2009. Alien inva-sive slider turtle in unpredicted habitat: A matter of niche shift or of predictors studied? PLoS ONE 4: e7843.
Schlageter A, Haag-Wackernagel D, 2012. Evaluation of an odor repellent for protecting crops from wild boar damage. Journal of Pest Science 85: 209–215.
Schley L, Dufrene M, Krier A, Frantz AC, 2008. Patterns of crop damage by wild boar Sus scrofa in Luxembourg over a 10-year period. European Journal of Wildlife Research 54: 589–599.
Smith AB, 2013. On evaluating species distribution models with random background sites in place of absences when test pres-ences disproportionately sample suitable habitat. Divers. Dis-trib. 19: 867–872.
Soberon J, Nakamura M, 2009. Niches and distributional areas: Concepts, methods, and assumptions. Proc. Natl. Acad. Sci. USA 106: 19644–19650.
Thurfjell H, Ball JP, Ahlen PA, Kornacher P, Dettki H et al., 2009. Habitat use and spatial patterns of wild boar Sus scrofa (L.): Agricultural fields and edges. European Journal of Wildlife Research 55: 517–523.
Toso S, Pedrotti L, 2001. Linee guida per la gestione del cinghiale Sus scrofa nelle aree protette. Quaderni di Conservazione della Natura, 2, Ministero dell'Ambiente, Modena.
Veloz SD, 2009. Spatially autocorrelated sampling falsely inflates measures of accuracy for presence-only niche models. J. Bio-geogr. 36: 2290–2299.
Warren DL, Glor RE, Turelli M, 2010. ENMTools: A toolbox for comparative studies of environmental niche models. Ecogra-phy 33: 607–611.
Warren DL, Seifert SN, 2011. Ecological niche modeling in Maxent: The importance of model complexity and the per-formance of model selection criteria. Ecol. Appl. 21: 335–342.