Embed Size (px)
Citation preview

Padhi et al., Cogent Engineering (2016), 3: 1181821http://dx.doi.org/10.1080/23311916.2016.1181821
CHEMICAL ENGINEERING | RESEARCH ARTICLE
Prediction of bed pressure drop, fluctuation and expansion ratios for three-phase fluidization of ternary mixtures of dolomite in a conical conduitR.K. Padhi1*, D.T.K. Dora1, Y.K. Mohanty1, G.K. Roy1 and B. Sarangi2
Abstract: Hydrodynamics of conical fluidized bed differ from that of columnar beds by the fact that a velocity gradient exists along the axial direction of the bed. The gas–liquid–solid fluidized bed has emerged in recent years as one of the most prom-ising devices for three-phase operations. Such a device is of considerable industrial importance as evident from its wide applications in chemical, refining, petrochemi-cal, biochemical processing, pharmaceutical, and food industries. To explore this, ex-periments have been carried out to find the bed pressure drop, bed fluctuation, and expansion ratios for ternary mixtures of dolomite in a three-phase conical fluidized bed. The effect of superficial liquid and gas velocity, initial static bed height, average particle size, and cone angle on the above-mentioned three responses have been studied. Mathematical models have been developed for the responses using both di-mensional and statistical analyses. The calculated values of the responses from the developed models have shown a very good agreement with the experimental ones.
*Corresponding author: R.K. Padhi, Department of Chemical Engineering, Gandhi Institute of Engineering and Technology, Gunupur, Rayagada 765 022, Odisha, India E-mail: [email protected]
Reviewing editor:Zhibing Zhang, University of Birmingham, UK
Additional information is available at the end of the article
ABOUT THE AUTHORSRadha Krushna Padhi obtained his Bachelor’s and Master degree in Chemical Engineering from BPUT, Rourkela. He has published six papers in national and international journals, has also presented four papers in national and international conferences.
D.T.K.Dora is presently professor in the Department of Chemical Engineering, GIET, Gunupur. He has published Twelve paper in various national and international journal.
Y.K. Mohanty is presently professor in the Department of Chemical Engineering, GIET, Gunupur. He has published Eighteen paper in various national and international journal and authorship of one book.
G.K. Roy is presently visiting professor ,Department of chemical Engineering at GIET,Gunupur. He has over 43 year of teaching and research experience with authorship of more than 200 research publication and six book.
B. Sarangi is presently professor, Department Metallurgical & Materials Engineering at IGIT,Saranga, odisha. He has over 30 years of teaching and research experience with authorship of more than thirty research publication and one book.
PUBLIC INTEREST STATEMENTExperiments have been carried out to find the bed pressure drop, bed fluctuation, and expansion ratios for ternary mixture of dolomite in a three-phase conical fluidized bed. The effect of superficial liquid and gas velocity, initial static bed height, average particle size, and cone angle on the three responses have been studied. Mathematical models have been developed for the responses using both dimensional and statistical analyses. The calculated values of the responses from the developed models have shown a very good agreement with the experimental ones.
Received: 16 October 2015Accepted: 17 April 2016First Published: 26 April 2016
© 2016 The Author(s). This open access article is distributed under a Creative Commons Attribution (CC-BY) 4.0 license.
Page 1 of 20
R.K. Padhi

Page 2 of 20
Padhi et al., Cogent Engineering (2016), 3: 1181821http://dx.doi.org/10.1080/23311916.2016.1181821
Subjects: Chemical Engineering; Chemical Processing & Design; Dynamics & Kinematics; Fluid Mechanics
Keywords: gas–liquid–solid fluidization; conical bed; bed pressure drop; bed fluctuation ratio and bed expansion ratio; dimensional analysis; ANOVA
1. IntroductionWith the development of fluidized bed coal combustion and the recent interest in the use of such beds for waste utilization and dry solids separation, potential applications of multi-component fluid-ized beds are on the rise. It is because of the fact that fluidized particles of uniform size at the begin-ning, may change due to attrition, coalescence, and chemical reaction, thereby affecting the quality of fluidization by high elutriation loss, de-fluidization, segregation, and inhomogeneous residence time in the bed leading to non-uniform products of wide particle size distribution. Therefore, Sau, Mohanty, and Biswal (2008) stated that proper characterization of bed dynamics for binary and multi-component mixtures in gas–solid systems is an important prerequisite for their effective utili-zation, where the combination of particle size, density, and shape influences the fluidization behavior.
Biswal, Sahu, and Roy (1982), Biswal, Samal, and Roy (1984), Biswal, Bhowmik and Roy (1984, 1985) developed theoretical models for minimum fluidization velocity and bed pressure drop for spherical particles for gas–solid systems in conical vessels. Due to angled walls, random and unre-stricted particle movement occurs in a tapered surface with reduced back mixing. They, therefore, proposed a modified equation for the calculation of the maximum pressure drop. Later, Peng and Fan(1997)made an in-depth study of hydrodynamic characteristics of solid–liquid fluidization in a tapered bed and derived theoretical models for the prediction of minimum fluidization velocity and maximum pressure drop, based on the dynamic balance of forces exerted on the particle. However, the experiments were carried out for spherical particles only. Jing, Hu, Wang, and Jin (2000) and Shan et al. (2001) proposed models for ΔPmf and Umf for gas–solid conical fluidized beds for spherical coarse and fine particles based on Peng and Fan (1997) models, but neglected pressure drop due to the kinetic change in the bed.
A correlation for fluctuation ratio in conical vessels for regular particles has been developed by Biswal, Samal, et al. (1984) using dimensional analysis approach based on four dimensionless groups neglecting the effect of density of gas and solid particles. They have developed a correlation for the bed fluctuation ratio for irregular particles in conical vessel. Singh, Roy, and Suryanarayana (1991) have developed correlations for bed fluctuation ratio for binary homogeneous and heterogeneous mixtures of spherical and non spherical particles in conical conduits. Singh, Suryanarayana, and Roy (1999) have also developed correlations for bed expansion ratio for cylindrical and non cylindrical beds. Dora, Panda, Mohanty, and Roy (2013) have studied the bed expansion and fluctuation ratios in a gas–solid conical fluidized bed for homogeneous ternary mixture of irregular particles.
Current literature deals with the development of mathematical models for fluctuation and expan-sion ratios for binary mixtures in a conical bed with different cone angles. Practically no work has been carried out for three-phase fluidization in a conical bed. The objective of the present work is to study the hydrodynamic characteristics of ternary mixture in a three-phase conical fluidized bed with different cone angles viz. 4.61°, 5.13°, 7.47°, and 11.2° (incorporating the similar values of an earlier study (Dora et al., 2013) and to develop mathematical model for the determination of fluc-tuation and expansion ratios by dimensional analysis as well as statistical analysis.
2. Materials and methodsThe experimental setup consists of a single-stage air compressor of sufficient capacity, an accumu-lator for storage of air at constant pressure (20 psig), a water tank, and a liquid pump (0.5 HP) as shown in Figure 1. Two rotameters, one for water (0–10 LPM) and the other for air (0–50 LPM) were used to measure the water and air flow rates, respectively. A 40 mesh screen at the bottom served

Page 3 of 20
Padhi et al., Cogent Engineering (2016), 3: 1181821http://dx.doi.org/10.1080/23311916.2016.1181821
as the support as well as the distributor. The inside hollow space of the distributor was filled with glass beads of 1.5 cm outer diameter for uniform water and air distribution. The conical conduits with different cone angles are made up of Perspex sheets to allow visual observation. Detailed di-mensions for the conical conduits used are given in Table 1. Two pressure tapings were provided for noting the bed pressure drop. A gate valve of 15 mm inner diameter was provided in the line to control the water flow to the bed. Two sets of manometer with carbon tetrachloride (for low pres-sure range) and mercury (for high pressure range) as manometric liquids were used to record the bed pressure drop. A high-speed digital camera has been used for verification of the maximum and minimum heights of the bed during fluidization.
Three closely sized samples of dolomite (as presented in Table 2) were used for the investigation. For ternary mixtures, fairly good mixing has been achieved by coning and quartering method as done in experimental practice and classification has been avoided since the ratio of the particle sizes of two successive fractions in the mixture was kept below 1.3. The scope of the experiments is pre-sented in Table 2. A weighed quantity of the mixture was poured into the conical column. Prior to recording any data, the charge was vigorously fluidized with water at a velocity where no entrain-ment was observed. After a certain time, the water flow was suddenly stopped to obtain a mixed packed bed. The velocity of the water was then increased slowly allowing sufficient time to reach a steady state. Then air was passed through the bed as a dispersed phase. The mass velocity of the air (Gf) was increased slowly allowing sufficient time to reach a steady state. The rotameter and ma-nometer readings were noted for each increment in flow rate from which the values of the
Figure 1. Schematic diagram of experimental setup.
Table 1. Dimensions of conical conduitsDimension Tapered angle (in degree)
4.61 5.13 7.47 9.52 11.2Bottom diameter (m) 0.048 0.050 0.042 0.050 0.045
Top diameter (m) 0.132 0.135 0.174 0.212 0.245
Height of the column (m) 0.520 0.470 0.504 0.483 0.510
Page 4 of 20
Padhi et al., Cogent Engineering (2016), 3: 1181821http://dx.doi.org/10.1080/23311916.2016.1181821
superficial gas velocity and pressure drop were calculated. The above procedure was repeated for different values of initial static bed height (Hs), average particle size (Dpavg), and cone angle (α).
In this work, both dimensional analysis and statistical analysis approaches have been used for the prediction of mathematical model for responses like bed pressure drop, fluctuation, and expansion ratios with minimum liquid fluidization mass velocity (Gmf) and bottom diameter (DO) as independent variables. In dimensional analysis, the following mathematical model has been used for different responses (Dora et al., 2013).
where a1, a2, a3, and a4 are exponents and K is the coefficient.
For statistical analysis, central composite design (CCD) has been used to develop correlations with four independent dimensionless variables viz.
(
Gf
Gmf
)(
Hs
DO
)(
Dpavg
DO
)
and (tan �) for the three depend-
ent variables in dimensionless form such as bed pressure drop ΔPfΔPmf
, bed fluctuation ratio (r), and bed expansion ratio (R).
The response has been used to develop an empirical model by statistical analysis that correlates the response of fluidized bed with process variables using a second-degree polynomial equation as given by Equation (2).
where Y is the predicted response, b′0, the constant coefficient, bi, the linear coefficients, bij, the inter-action coefficients, bii, the quadratic coefficients, and Xi, Xj are the coded values of process variables. The number of tests required (N) for the CCD includes the standard 2n factorial with its origin at the center, 2n points fixed axially at a distance, say α, from the center to generate the quadratic terms, and replicate tests at the center; where n is the number of variables. The axial points are chosen such that they allow rotatability (Box & Hunter, 1957) which ensures that the variance in the model prediction is constant at all points equidistant from the design center. Replicates of the test at the center are very important as they provide an independent estimate of the experimental error. For four variables, the recommended number of tests at the center is six (Box & Hunter, 1961).
(1)Response = K
(
GfGmf
)a1(
HsDO
)a2(
Dpavg
DO
)a3
(tan �)a4
(2)Y = b�0 +
n∑
i=1
biXi +
n∑
i=1
biiX2i +
n∑
i=1
n∑
j>1
bijXiXj
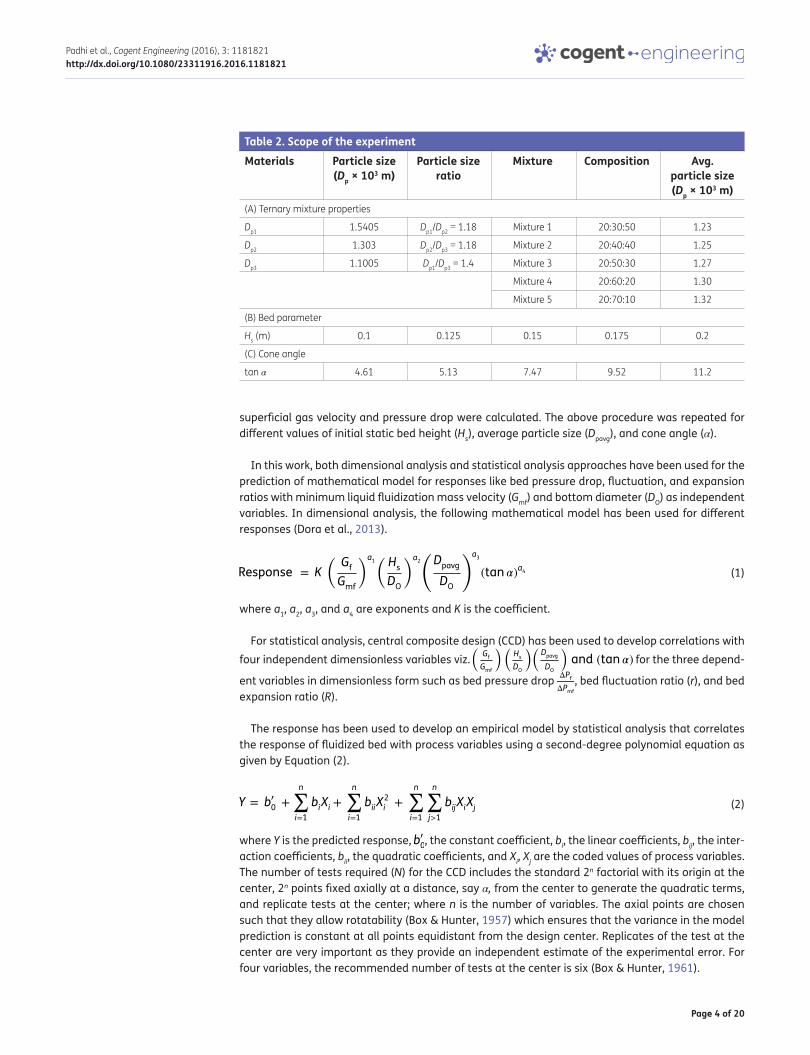
Table 2. Scope of the experimentMaterials Particle size
(Dp × 103 m)Particle size
ratioMixture Composition Avg.
particle size (Dp × 103 m)
(A) Ternary mixture properties
Dp1 1.5405 Dp1/Dp2 = 1.18 Mixture 1 20:30:50 1.23
Dp2 1.303 Dp2/Dp3 = 1.18 Mixture 2 20:40:40 1.25
Dp3 1.1005 Dp1/Dp3 = 1.4 Mixture 3 20:50:30 1.27
Mixture 4 20:60:20 1.30
Mixture 5 20:70:10 1.32
(B) Bed parameter
Hs (m) 0.1 0.125 0.15 0.175 0.2
(C) Cone angle
tan α 4.61 5.13 7.47 9.52 11.2

Page 5 of 20
Padhi et al., Cogent Engineering (2016), 3: 1181821http://dx.doi.org/10.1080/23311916.2016.1181821
Once the desired range of values of the variables are defined, they are coded to lie at ±1 for the factorial points, 0 for the center points and ±α for the axial points. For statistical analysis, a statistical software package Design-Expert-8, Stat-Ease, Inc., Minneapolis, USA, has been used for regression analysis of the fluidized bed responses.
3. Results and discussion
3.1. Bed pressure dropFigure 2(a) shows the variation in bed pressure drop with superficial water velocity for initial static bed height of 0.15 m, mixture of 20:50:30 and cone angle of 7.47° for different superficial air veloci-ties. It has been observed that the bed pressure drop decreases with the increase in superficial air velocity. This is due to the fact that increase in air velocity tends to increase the gas hold-up and which in turn decreases the density of the bed material (Dora, Mohanty, & Roy, 2012). Figure 2(b) shows the variation in bed pressure drop with respect to superficial water velocity for different mix-ture compositions at constant air velocity of 0.21 m/s, cone angle of 7.47°, and initial static bed height of 0.15 m. It is observed from Figure 2(b) that with the increase in average particle size the bed pressure drop decreases. The decrease may be due to increase in void space with increase in particle size. Similarly, Figure 2(c) shows the variation in bed pressure drop with superficial water velocity for a mixture of 20:50:30, air velocity of 0.21 m/s, and cone angle of 7.47° for different values of initial static bed heights. It is observed that with the increase in initial static bed height, the bed pressure drop increases. This is due to the fact that the pressure drop required for counterbalancing the weight of the bed increases with the increase in initial static bed height. The variation in bed pressure drop with superficial water velocity for different cone angles at an initial static bed height of 0.15 m, superficial air velocity of 0.21 m/s, and for a mixture of 20:50:30 is presented in Figure 2(d). It is clear that with increase in cone angle, pressure drop also increases. This is due to the fact that for a given initial static bed height, with increase in cone angle, the weight of the bed increases, and therefore the pressure drop required to counterbalance the weight of the bed also increases.
(3)N = 2n + 2n + nc = 24+ 2 × 4 + 6 = 30
Figure 2(a). Variation in bed pressure drop with superficial water velocity for different superficial air velocity at HS = 0.15 m, Dpavg = 0.00127 m, and cone angle = 7.47°.

Page 6 of 20
Padhi et al., Cogent Engineering (2016), 3: 1181821http://dx.doi.org/10.1080/23311916.2016.1181821
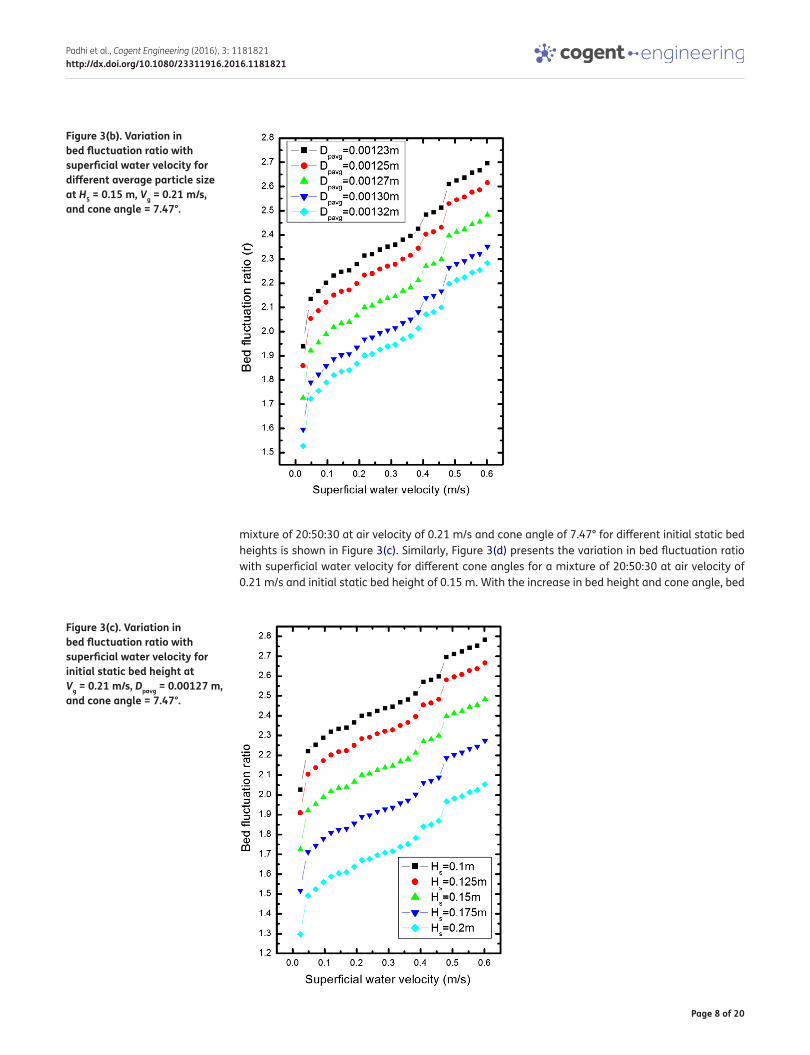
3.2. Bed fluctuation ratioThe bed fluctuation ratio (r) is defined as the ratio of the highest to the lowest bed height of the fluid-ized bed in expansion, i.e. r = h2/h1. The variation in bed fluctuation ratio with superficial water veloc-ity for initial static bed height of 0.15 m with 20:50:30 mixture and cone angle of 7.47° for different values of superficial air velocity is shown in Figure 3(a). It has been observed that the bed fluctuation increases with increase in air velocity. Figure 3(b) shows the variation in bed fluctuation ratio with
Figure 2(b). Variation in bed pressure drop with superficial water velocity for different average particle size at HS = 0.15 m, Vg = 0.21 m/s, and cone angle = 7.47°.
Figure 2(c). Variation in bed pressure drop with superficial water velocity for initial static bed height at Vg = 0.21 m/s, Dpavg = 0.00127 m, and cone angle = 7.47°.

Page 7 of 20
Padhi et al., Cogent Engineering (2016), 3: 1181821http://dx.doi.org/10.1080/23311916.2016.1181821
superficial water velocity for different mixtures at constant air velocity of 0.21 m/s, initial static bed height of 0.15 m, and cone angle of 7.47°. It is observed that with decrease in particle diameter (i.e. increase in percentage of fines), the bed fluctuation ratio (r) increases. The fines entrained by the bubbles compared to course particles are carried to greater height in the bed, resulting in the in-crease in fluctuation ratio. The variation in bed fluctuation ratio with superficial water velocity for
Figure 2(d). Variation in bed pressure drop with superficial water velocity for cone angles at HS = 0.15 m, Dpavg = 0.00127 m, and Vg = 0.21 m/s.
Figure 3(a). Variation in bed fluctuation ratio with superficial water velocity for different superficial air velocity at HS = 0.15 m, Dpavg = 0.00127 m, and cone angle = 7.47°.
Page 8 of 20
Padhi et al., Cogent Engineering (2016), 3: 1181821http://dx.doi.org/10.1080/23311916.2016.1181821
mixture of 20:50:30 at air velocity of 0.21 m/s and cone angle of 7.47° for different initial static bed heights is shown in Figure 3(c). Similarly, Figure 3(d) presents the variation in bed fluctuation ratio with superficial water velocity for different cone angles for a mixture of 20:50:30 at air velocity of 0.21 m/s and initial static bed height of 0.15 m. With the increase in bed height and cone angle, bed
Figure 3(b). Variation in bed fluctuation ratio with superficial water velocity for different average particle size at HS = 0.15 m, Vg = 0.21 m/s, and cone angle = 7.47°.
Figure 3(c). Variation in bed fluctuation ratio with superficial water velocity for initial static bed height at Vg = 0.21 m/s, Dpavg = 0.00127 m, and cone angle = 7.47°.

Page 9 of 20
Padhi et al., Cogent Engineering (2016), 3: 1181821http://dx.doi.org/10.1080/23311916.2016.1181821
fluctuation ratio is found to decrease as observed from Figures 3(c) and 3(d). Whether it is an in-crease in bed height or an increase in cone angle, the vertical lift of the particles in the upper seg-ment of the bed for both the above cases is reduced to a considerable extent, thereby reducing the fluctuation of the top of the expanded bed surface and consequently the fluctuation ratio.
Figure 3(d). Variation in bed fluctuation ratio with superficial water velocity for cone angles at Dpavg = 0.00127 m, Vg = 0.21 m/s, and HS = 0.15 m.
Figure 4(a). Variation in bed expansion ratio with superficial water velocity for different superficial air velocity at HS = 0.15 m, Dpavg = 0.00127 m, and cone angle = 7.47°.

Page 10 of 20
Padhi et al., Cogent Engineering (2016), 3: 1181821http://dx.doi.org/10.1080/23311916.2016.1181821
3.3. Bed expansion ratioThe variation in bed expansion ratio (R) with superficial water velocity for the column with cone an-gle of 7.47° and initial static bed height of 0.15 m with a mixture of 20:50:30 for different values air velocities is shown in Figure 4(a). It is clear from that with the increase in air velocity the bed expan-sion ratio increases. Figure 4(b) shows the variation in bed expansion ratio with respect to superficial water velocity for different mixtures at constant air velocity of 0.21 m/s, initial static bed height of 0.15 m, and cone angle of 7.47°. It is clear from Figure 4(b) that with an increase in particle size (i.e. decrease in percentage of fines in the mixture), the expansion ratio decreases because of reduction in the amount of fine particles in the mixture, which are generally lifted to a relatively greater height. Figure 4(c) shows the variation in bed expansion ratio with superficial water velocity for the column with cone angle of 7.47°, air velocity of 0.21 m/s, and mixture of 20:50:30 for different values of initial static bed height. Similarly, Figure 4(d) presents the variation in bed expansion ratio with superficial water velocity for columns with different cone angles for a mixture of 20:50:30 at air velocity of 0.21 m/s, and an initial static bed height of 0.15 m. It is clear from Figures 4(c) and 4(d) that with an increase in the initial static bed height and the column cone angle, the expansion ratio decreases. The reason is same as that has been explained in Section 3.2 above for the reduction in the bed fluctuation ratio in these two cases.
3.4. Development of correlations for pressure drop, fluctuation, and expansion ratio by dimensional analysisThe dimensional analysis for the prediction of bed pressure drop, fluctuation, and expansion ratios for a conical fluidized bed have been found to depend upon four dimensionless groups. The values of the dimensionless groups along with their corresponding responses are presented in Table 3. The number of runs as shown in Table 3 is 20. The individual exponents are obtained by plotting a power trend for each response with respect to that of each independent variable keeping the others con-stant at their respective “zero” levels. After obtaining the exponents, the coefficient is obtained as suggested by Davis (1978). The developed correlations for the three responses are as follows:
The term ∆Pmf used in the Equations (4 and 8) is calculated from Equation (7) which is correlated us-ing author’s data.
The negative values of the exponent show the antagonistic effect and the positive values of expo-nent show the synergistic effect of the independent variables on the responses. Figures 5–7 show the comparison of the calculated values of responses with the experimental ones for bed pressure drop ratio, fluctuation, and expansion ratios, respectively. From Figure 5, the value of the coefficient of correlation is found to be 0.97, where the developed correlation for bed pressure drop ratio shows a very good agreement with the experimental data. Similarly, from Figures 6 and 7 the coefficients of correlations are found to be 0.82 and 0.97 for bed fluctuation and expansion ratios, respectively.
(4)ΔPfΔPmf
= 6 × 10⁻¹²(
GfGmf
)−0.214( HsDO
)0.142(
Dpavg
DO
)−7.06
(tan �)0.085
(5)r = 8 × 10⁶(
GfGmf
)0.109( HsDO
)−0.084(
Dpavg
DO
)4
(tan �)−0.058
(6)R = 7 × 10⁶(
GfGmf
)0.093( HsDO
)−0.675(
Dpavg
DO
)3.84
(tan �)0.2
(7)ΔPmf = 3 × 10⁻⁶(
HsDO
)0.84(
Dpavg
DO
)−3.08
(tan �)0.013

Page 11 of 20
Padhi et al., Cogent Engineering (2016), 3: 1181821http://dx.doi.org/10.1080/23311916.2016.1181821
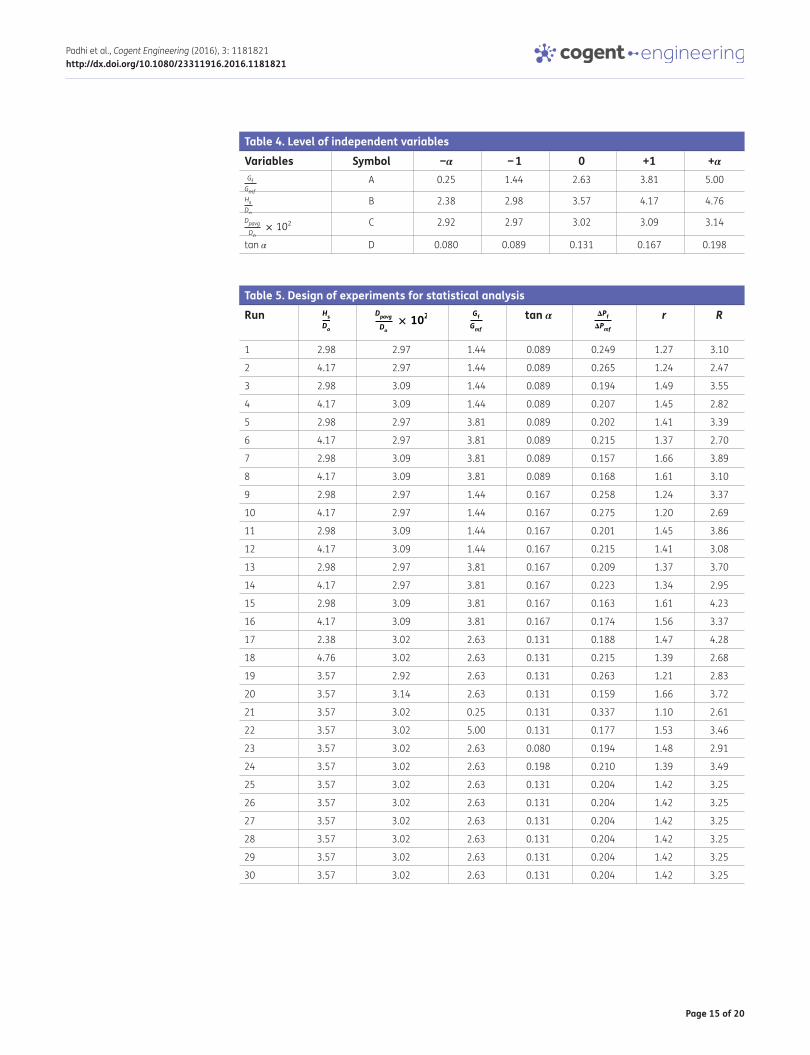
3.5. Development of regression model equations using response surface methodology based central composite designOn the basis of experimental data the models have been developed by employing response surface methodology (RSM)-based central composite design (CCD). Analysis of variance (ANOVA) has been used to estimate the statistical parameter. Table 4 represents the complete experimental range and level of variables where Table 5 shows design of experiment together with the experimental result for the three responses. The final empirical models in terms of coded factor (excluding the
Figure 4(b). Variation in bed expansion ratio with superficial water velocity for different average particle size at HS = 0.15 m, Vg = 0.21 m/s, and cone angle = 7.47°.
Figure 4(c). Variation in bed expansion ratio with superficial water velocity for initial static bed height at Vg = 0.21 m/s, Dpavg = 0.00127 m, and cone angle = 7.47°.

Page 12 of 20
Padhi et al., Cogent Engineering (2016), 3: 1181821http://dx.doi.org/10.1080/23311916.2016.1181821
Figure 4(d). Variation in bed expansion ratio with superficial water velocity for cone angles at Dpavg = 0.00127 m, Vg = 0.21 m/s, and HS = 0.15 m
Table 3. Design of experiments for dimensional analysisRun G
f
Gmf
Hs
DO
× 102 D
pavg
DO
tan α �Pf
�Pmf
r R
1 2.38 3.02 2.63 0.131 0.280 1.45 3.90
2 2.98 3.02 2.63 0.131 0.292 1.44 3.60
3 3.57 3.02 2.63 0.131 0.300 1.43 2.89
4 4.17 3.02 2.63 0.131 0.312 1.40 2.61
5 4.76 3.02 2.63 0.131 0.320 1.35 2.46
6 3.57 2.92 2.63 0.131 0.436 1.02 2.56
7 3.57 2.97 2.63 0.131 0.367 1.23 2.90
8 3.57 3.02 2.63 0.131 0.314 1.34 3.13
9 3.57 3.09 2.63 0.131 0.242 1.45 3.38
10 3.57 3.14 2.63 0.131 0.226 1.48 3.44
11 3.57 3.02 0.25 0.131 0.351 1.07 2.54
12 3.57 3.02 1.44 0.131 0.282 1.28 2.88
13 3.57 3.02 2.63 0.131 0.230 1.39 3.11
14 3.57 3.02 3.81 0.131 0.157 1.50 3.36
15 3.57 3.02 5.00 0.131 0.141 1.53 3.42
16 3.57 3.02 2.63 0.080 0.323 1.31 3.74
17 3.57 3.02 2.63 0.089 0.336 1.30 4.08
18 3.57 3.02 2.63 0.131 0.344 1.29 4.31
19 3.57 3.02 2.63 0.167 0.356 1.26 4.56
20 3.57 3.02 2.63 0.198 0.364 1.21 4.62

Page 13 of 20
Padhi et al., Cogent Engineering (2016), 3: 1181821http://dx.doi.org/10.1080/23311916.2016.1181821
insignificant terms) for bed pressure drop (
ΔPf
ΔPmf
)
, bed fluctuation ratio (r), and bed expansion ratio
(R) have been presented in Equations (8), (9), and (10), respectively, as under:
ANOVA has been used to analyze the experimental factors on bed pressure drop, bed fluctuation, and expansion ratios and to estimate the statistical parameters. The ANOVA for the responses, (
ΔPf
ΔPmf
)
, r and R are represented in Tables 6–8. The F-values for the models as depicted in Equations
(8–10) are found to be 22.17, 94.72, and 232.33, respectively, which implies that the models are significant. The model F-values show that 99.99% of noise has been avoided. Value of “prob. > F” less
than 0.0500 indicate model terms are significant. Thus, for (
ΔPf
ΔPmf
)
the model terms A, B, C, D, AC, A2,
and C2 are significant. Similarly, for bed fluctuation and expansion ratio the model terms A, B, C, D, BC, CD, C2, and D2 are significant and for bed expansion ratio the model terms A, B, C, D, AB, AC, BD, A2, and C2 are significant.
Figures 8–10 show the comparison of the calculated and actual data obtained for bed pressure drop, bed fluctuation, and expansion ratios, respectively. In Figure 8, the value of coefficient of cor-relation (R2) has been found to be 0.95, which shows that the model developed agrees well with the experimental data. Similarly, Figures 9 and 10 show the comparison of experimental values with the calculated ones obtained from models shown in Equations (9 and 10) for bed fluctuation and expan-sion ratios, respectively. The R2 values have been found to be 0.98 and 0.99 for the responses “r” and
(8)
ΔPfΔPmf
= 0.203 + 0.0068A − 0.026B − 0.028C + 0.0039D − 0.0007AC − 0.0016A2 + 0.012C2
(9)r = 1.424 − 0.02A + 0.112B + 0.085C − 0.02D + 0.006BC − 0.001CD − 0.025C2 + 0.004D2
(10)R = 3.252 − 0.38A + 0.22B + 0.17C + 0.142D − 0.025AB − 0.016AC + 0.009BD + 0.06A2 − 0.051C2
Figure 5. Comparison of the values of ΔPf
ΔPmf calculated
from Equation (4) with the experimental ones.

Page 14 of 20
Padhi et al., Cogent Engineering (2016), 3: 1181821http://dx.doi.org/10.1080/23311916.2016.1181821
“R,” respectively, which show that the models developed for both bed fluctuation and expansion ratios agree well with the experimental values. The adequate precision of 18.95, 37.01, and 59.92 obtained for bed pressure drop, fluctuation, and expansion ratios indicate adequate signals. Thus, the model evaluated can be used to navigate the design space. The fair correlation coefficients might have resulted by the insignificant terms in Table 5 and is most likely due to four different
Figure 6. Comparison of the values of “r” calculated from Equation (5) with the experimental ones.
Figure 7. Comparison of the values of “R” calculated from Equation (6) with the experimental ones.
Page 15 of 20
Padhi et al., Cogent Engineering (2016), 3: 1181821http://dx.doi.org/10.1080/23311916.2016.1181821
Table 4. Level of independent variablesVariables Symbol −α − 1 0 +1 +αGf
Gmf
A 0.25 1.44 2.63 3.81 5.00
Hs
Do
B 2.38 2.98 3.57 4.17 4.76
Dpavg
Do× 10
2 C 2.92 2.97 3.02 3.09 3.14
tan α D 0.080 0.089 0.131 0.167 0.198
Table 5. Design of experiments for statistical analysisRun H
s
Do
Dpavg
Do
× 102 G
f
Gmf
tan α �Pf
�Pmf
r R
1 2.98 2.97 1.44 0.089 0.249 1.27 3.10
2 4.17 2.97 1.44 0.089 0.265 1.24 2.47
3 2.98 3.09 1.44 0.089 0.194 1.49 3.55
4 4.17 3.09 1.44 0.089 0.207 1.45 2.82
5 2.98 2.97 3.81 0.089 0.202 1.41 3.39
6 4.17 2.97 3.81 0.089 0.215 1.37 2.70
7 2.98 3.09 3.81 0.089 0.157 1.66 3.89
8 4.17 3.09 3.81 0.089 0.168 1.61 3.10
9 2.98 2.97 1.44 0.167 0.258 1.24 3.37
10 4.17 2.97 1.44 0.167 0.275 1.20 2.69
11 2.98 3.09 1.44 0.167 0.201 1.45 3.86
12 4.17 3.09 1.44 0.167 0.215 1.41 3.08
13 2.98 2.97 3.81 0.167 0.209 1.37 3.70
14 4.17 2.97 3.81 0.167 0.223 1.34 2.95
15 2.98 3.09 3.81 0.167 0.163 1.61 4.23
16 4.17 3.09 3.81 0.167 0.174 1.56 3.37
17 2.38 3.02 2.63 0.131 0.188 1.47 4.28
18 4.76 3.02 2.63 0.131 0.215 1.39 2.68
19 3.57 2.92 2.63 0.131 0.263 1.21 2.83
20 3.57 3.14 2.63 0.131 0.159 1.66 3.72
21 3.57 3.02 0.25 0.131 0.337 1.10 2.61
22 3.57 3.02 5.00 0.131 0.177 1.53 3.46
23 3.57 3.02 2.63 0.080 0.194 1.48 2.91
24 3.57 3.02 2.63 0.198 0.210 1.39 3.49
25 3.57 3.02 2.63 0.131 0.204 1.42 3.25
26 3.57 3.02 2.63 0.131 0.204 1.42 3.25
27 3.57 3.02 2.63 0.131 0.204 1.42 3.25
28 3.57 3.02 2.63 0.131 0.204 1.42 3.25
29 3.57 3.02 2.63 0.131 0.204 1.42 3.25
30 3.57 3.02 2.63 0.131 0.204 1.42 3.25

Page 16 of 20
Padhi et al., Cogent Engineering (2016), 3: 1181821http://dx.doi.org/10.1080/23311916.2016.1181821
Table 6. ANOVA for �P
f
�Pmf
Source Sum of squares df Mean square F value p-value prob. > F RemarksModel 0.041338 14 0.002953 22.1716 <0.0001 Significant
A 0.001127 1 0.001127 8.464783 0.0108 Significant
B 0.016269 1 0.016269 122.1613 <0.0001 Significant
C 0.018772 1 0.018772 140.957 <0.0001 Significant
D 0.000364 1 0.000364 2.736673 0.0188 Significant
AB 1.17E-05 1 1.17E-05 0.087717 0.7712
AC 8.24E-06 1 8.24E-06 0.061879 0.0369 Significant
AD 2.58E-07 1 2.58E-07 0.001937 0.9655
BC 0.000119 1 0.000119 0.892444 0.3598
BD 3.72E-06 1 3.72E-06 0.027935 0.8695
CD 2.62E-06 1 2.62E-06 0.019707 0.8902
A2 7.53E-05 1 7.53E-05 0.565063 0.0439 Significant
B2 1.1E-05 1 1.1E-05 0.082479 0.7779
C2 0.004092 1 0.004092 30.72863 <0.0001 Significant
D2 6.88E-05 1 6.88E-05 0.516917 0.4832
Residual 0.001998 15 0.000133
Lack of fit 0.001998 10 0.0002
Pure error 0 5 0
Cor total 0.043336 29
Table 7. ANOVA for bed fluctuation ratio (r)Source Sum of squares df Mean square F value p-value prob. > F RemarksModel 0.521339 14 0.037239 94.72371 <0.0001 Significant
A 0.009906 1 0.009906 25.19707 0.0002 Significant
B 0.302247 1 0.302247 768.827 <0.0001 Significant
C 0.176156 1 0.176156 448.0882 <0.0001 Significant
D 0.010108 1 0.010108 25.71098 0.0001 Significant
AB 4.01E-05 1 4.01E-05 0.101934 0.7539
AC 1.81E-05 1 1.81E-05 0.046144 0.8328
AD 1.29E-06 1 1.29E-06 0.003288 0.9550
BC 0.000565 1 0.000565 1.437841 0.0491 Significant
BD 4.03E-05 1 4.03E-05 0.102444 0.7533
CD 1.82E-05 1 1.82E-05 0.046375 0.0324 Significant
A2 0.000396 1 0.000396 1.007668 0.3314
B2 0.000784 1 0.000784 1.994496 0.1783
C2 0.017746 1 0.017746 45.14168 <0.0001 Significant
D2 0.000525 1 0.000525 1.335683 0.0259 Significant
Residual 0.005897 15 0.000393
Lack of fit 0.005897 10 0.00059
Pure error 0 5 0
Cor total 0.527236 29

Page 17 of 20
Padhi et al., Cogent Engineering (2016), 3: 1181821http://dx.doi.org/10.1080/23311916.2016.1181821
Table 8. ANOVA for bed expansion ratio (R)Source Sum of squares df Mean square F value p-value prob. > F RemarksModel 6.033103 14 0.430936 232.3384 <0.0001 Significant
A 3.456181 1 3.456181 1863.395 <0.0001 Significant
B 1.171439 1 1.171439 631.5797 <0.0001 Significant
C 0.694681 1 0.694681 374.5363 <0.0001 Significant
D 0.483748 1 0.483748 260.8122 <0.0001 Significant
AB 0.009999 1 0.009999 5.3909 0.0347 Significant
AC 0.004565 1 0.004565 2.461187 0.0175 Significant
AD 0.004048 1 0.004048 2.182244 0.1603
BC 0.001634 1 0.001634 0.881237 0.3627
BD 0.001449 1 0.001449 0.78136 0.0307 Significant
CD 0.000662 1 0.000662 0.356726 0.5592
A2 0.097375 1 0.097375 52.49967 <0.0001 Significant
B2 0.002153 1 0.002153 1.160727 0.2983
C2 0.073656 1 0.073656 39.71154 <0.0001 Significant
D2 0.002413 1 0.002413 1.301148 0.2719
Residual 0.027822 15 0.001855
Lack of fit 0.027822 10 0.002782
Pure error 0 5 0
Cor total 6.060925 29
Figure 8. Comparison of the values of ΔPf
ΔPmf calculated
from Equation (8) with the experimental ones.

Page 18 of 20
Padhi et al., Cogent Engineering (2016), 3: 1181821http://dx.doi.org/10.1080/23311916.2016.1181821
variables selected in wide ranges with a limited number of experiments, as well as the nonlinear influence of the investigated parameters on process response.
4. ConclusionIn this study, the hydrodynamic behavior of three-phase fluidized bed for homogenous ternary mixtures in conical conduits has been carried out. In three-phase fluidization, the hydrodynamic variables studied are bed pressure drop, bed fluctuation, and bed expansion ratios. As pressure drop in a fluidization system is an important parameter for the design and fabrication of the fluidized bed reactor, its value should be as low as possible from economic point of view. In this study by the use of a secondary fluidizing medium (air) beyond minimum fluidization the bed pressure drop can be significantly reduced. Simultaneously, the study of both
Figure 9. Comparison of the values of “r” calculated from Equation (9) with the experimental ones.
Figure 10. Comparison of the values of “R” calculated from Equation (10) with the experimental ones.

Page 19 of 20
Padhi et al., Cogent Engineering (2016), 3: 1181821http://dx.doi.org/10.1080/23311916.2016.1181821
dimensional analysis and RSM-based CCD and quadratic programming are used to model the influence of four process parameters on the three responses. Mathematical correlations are derived for the three re-sponses using sets of experimental data and ANOVA. Predicted values obtained using the model equations have been found to be in very good agreement with the experimental values. Hence, the developed correla-tions can be used for the design of three-phase conical fluidized bed systems with homogeneous ternary mixtures of irregular particles of bed materials within the ranges of the operating parameters investigated.
Nomenclature
DO bottom diameter of tapered bed (m)
Dpav average diameter of ternary mixture (m)
Hs initial static bed height (m)
Α cone angle (in degree)
ΔPmf pressure drop at minimum fluidization velocity (N/m2)
ΔPf pressure drop during fluidization (N/m2)
Gf flow rate of fluid at fluidization condition (kg/h m2)
Gmf flow rate of fluid at minimum fluidization condition (kg/h m2)
r bed fluctuation ratio
R bed expansion ratio
N number of runs
n number of independent variables
h1 highest bed height (m)
h2 lowest bed height (m)
Vg superficial gas velocity (m/s)
FundingThe authors received no direct funding for this research.
Author detailsR.K. Padhi1
E-mail: [email protected]. Dora1
E-mail: [email protected]. Mohanty1
E-mail: [email protected]. Roy1
E-mail: [email protected]. Sarangi2
E-mail: [email protected] Department of Chemical Engineering, Gandhi Institute of
Engineering and Technology, Gunupur, Rayagada 765 022, Odisha, India.
2 Department of Metallurgical Engineering, Indira Gandhi Institute of Technology, Saranga, Dhenkanal, Odisha, India.
Citation informationCite this article as: Prediction of bed pressure drop, fluctuation and expansion ratios for three-phase fluidization of ternary mixtures of dolomite in a conical conduit, R.K. Padhi, D.T.K. Dora, Y.K. Mohanty, G.K. Roy & B. Sarangi, Cogent Engineering (2016), 3: 1181821.
ReferencesBiswal, K. C., Sahu, S., & Roy, G. K. (1982). Prediction of the
fluctuation ratio for gas–solid fluidization of regular particles in a conical vessel. The Chemical Engineering
Journal., 23, 97–99. http://dx.doi.org/10.1016/0300-9467(82)85011-9
Biswal, K. C., Samal, B. B., & Roy, G. K. (1984). Dynamics of gas-solid fluidization of regular particles in conical vessels. Journal of the Institution of Engineers (India), 65(CH 1).
Biswal, K. C., Bhowmik, T., & Roy, G. K. (1984). Prediction of pressure drop for a conical fixed bed of spherical particles in gas–solid systems. The Chemical Engineering Journal, 29, 47–50. http://dx.doi.org/10.1016/0300-9467(84)80006-4
Biswal, K. C., Bhowmik, T., & Roy, G. K. (1985). Prediction of minimum fluidization velocity for gas–solid fluidization of regular particles in conical vessels. The Chemical Engineering Journal, 30, 57–62. http://dx.doi.org/10.1016/0300-9467(85)80007-1
Biswal, K. C., & Roy, G. K. (1985). Prediction of fluctuation ratio for gas–solid fluidization of irregular particles in conical vessels. Journal of Institute of Engineers (India), 65(CH 2), 32–35.
Box, G. E. P., & Hunter, J. S. (1957). Multi-factor experimental designs for exploring response surfaces. The Annals of Mathematical Statistics, 28, 195–241. http://dx.doi.org/10.1214/aoms/1177707047
Box, G. E. P., & Hunter, W. G. (1961). The 2 k-p fractional designs, parts I and II. Journal of Technometrics, 3, 311–458.
Davis, O. L. (1978). Design and analysis of industrial experiments (2nd ed.). London: Longman.
Dora, D. T. K., Mohanty, Y. K., & Roy, G. K. (2012). Hydrodynamics of three-phase fluidization of a homogeneous ternary mixture of irregular particles. Chemical Engineering Science, 79, 210–218. http://dx.doi.org/10.1016/j.ces.2012.04.035
Dora, D. T. K., Panda, S. R., Mohanty, Y. K., & Roy, G. K. (2013). Hydrodynamics of gas–solid fluidization of a homogeneous

Page 20 of 20
Padhi et al., Cogent Engineering (2016), 3: 1181821http://dx.doi.org/10.1080/23311916.2016.1181821
© 2016 The Author(s). This open access article is distributed under a Creative Commons Attribution (CC-BY) 4.0 license.You are free to: Share — copy and redistribute the material in any medium or format Adapt — remix, transform, and build upon the material for any purpose, even commercially.The licensor cannot revoke these freedoms as long as you follow the license terms.
Under the following terms:Attribution — You must give appropriate credit, provide a link to the license, and indicate if changes were made. You may do so in any reasonable manner, but not in any way that suggests the licensor endorses you or your use. No additional restrictions You may not apply legal terms or technological measures that legally restrict others from doing anything the license permits.
Cogent Engineering (ISSN: 2331-1916) is published by Cogent OA, part of Taylor & Francis Group. Publishing with Cogent OA ensures:• Immediate, universal access to your article on publication• High visibility and discoverability via the Cogent OA website as well as Taylor & Francis Online• Download and citation statistics for your article• Rapid online publication• Input from, and dialog with, expert editors and editorial boards• Retention of full copyright of your article• Guaranteed legacy preservation of your article• Discounts and waivers for authors in developing regionsSubmit your manuscript to a Cogent OA journal at www.CogentOA.com
ternary mixture in a conical bed: Prediction of bed expansion and bed fluctuation ratios. Particuology, 11, 681–688. http://dx.doi.org/10.1016/j.partic.2013.02.009
Jing, S., Hu, Q., Wang, J., & Jin, Y. (2000). Fluidization of coarse particles in gas–solid conical beds. Chemical Engineering and Processing: Process Intensification, 39, 379–387. http://dx.doi.org/10.1016/S0255-2701(99)00103-8
Peng, Y., & Fan, L. T. (1997). Hydrodynamic characteristics of fluidization in liquid–solid tapered beds. Chemical Engineering Science, 52, 2277–2290. http://dx.doi.org/10.1016/S0009-2509(97)00061-4
Sau, D. C., Mohanty, S. B., & Biswal, K. C. (2008). Correlations for critical fluidization velocity and maximum bed pressure drop for heterogeneous binary mixture of irregular particles in gas–solid tapered fluidized beds. Chemical
Engineering and Processing: Process Intensification, 47, 2386–2390. http://dx.doi.org/10.1016/j.cep.2007.11.003
Shan, J., Guobin, C., Fan, M., Yu, B., Jinfu, W., & Yong, J. (2001). Fluidization of fine particles in conical beds. Powder Technology, 118, 271–274. http://dx.doi.org/10.1016/S0032-5910(00)00385-5
Singh, R. K., Roy, G. K., & Suryanarayana, A. (1991). Prediction of fluctuation ratio for binary mixtures of non-spherical particles in conical beds. Indian Chemical Engineers, 33, 26–28.
Singh, R. K., Suryanarayana, A., & Roy, G. K. (1999). Prediction of bed expansion ratio for gas-solid fluidization in cylindrical and non-cylindrical conduits. Journal of Institution of Engineers (India), 79, 51–54.